1. Introduction
It is best to start with the question of how consumers want sweet cherries and what consumers’ preferences are. Do consumers really care about health-related elements such as antioxidants and phenolic compounds in sweet cherries? Or are researchers emphasizing these factors as if they align with consumer preferences? In fact, consumers do not have such expectations from cherries, peaches, apples, etc. Some recent studies have shown that although such biochemical compounds are emphasized, consumer preference is generally based on weight, size, color, shape, crispness, and taste. It has been reported that consumer preferences for cherries include color, size, firmness, sweetness, flavor, shelf life, and price. Researchers have informed that flavor, size, and shelf life are especially important [
1]. Another study on consumer preferences in sweet cherries emphasized the importance of color, shape, size, firmness, sweetness, flavor, and juiciness [
2]. The researcher reported that consumers attach importance to size and taste. Detailed research was conducted on consumer preferences in Bulgaria, Chile, Hungary, Italy, Japan, Latvia, and Türkiye, and they reported that taste, color, size, and shape came to the forefront. In order to evaluate consumer attitudes in Serbia and Bosnia and Herzegovina (B&H), an online survey was conducted with 402 participants on the most important features of cherry fruits [
3]. Consumers expressed their views on the most important external (fruit color, fruit shape, fruit size, presence of a stalk on the fruit, length of the stalk, and the presence of damage to the fruit) and internal (fruit taste, fruit firmness) characteristics of the fruit [
4]. A similar study was carried out in Oregon. In this study, the participants preferred large and dark cherries [
5]. In a study conducted in the United States, consumer preferences were focused on fruit color, shape, and size, and American consumers preferred dark fruits [
6]. It was reported that quality characteristics such as size, mass, color, thickness, taste, flavor, etc., in cherries were key factors and highly valued by consumers [
7,
8]. Thus, across the world, if consumers really cared about health and consumed fruits specifically for biochemical substances that contribute to health, would they use cigarettes that blacken the lungs, alcohol that destroys the liver, and fast food that slowly kills them?
Interestingly, it is scientists, not consumers, who emphasize the importance of biochemical compounds for health. These substances are really important for medics and pharmacists, and of course, especially for human health. Human beings have been consuming fruits with great pleasure for their taste, aroma, and flavor for thousands of years. Fruit breeding programs also focus on basic quality features such as size, color, taste, flavor, crispness, firmness, stem length, and shelf life. It has been suggested that today, the aim of breeding programs is to bring varieties with these quality characteristics to the market [
9]. In addition, fruit cracking is a significant challenge for producers in cherry cultivation. Moreover, breeders pay special attention to fruit cracking in breeding programs.
Fruit cracking in sweet cherries is a major preharvest disorder, often triggered by rainfall that limits yield and marketability. While traditionally explained by osmotic water uptake through the skin causing rupture, recent studies suggest that internal water absorption via roots leads to increased turgor pressure, which is now considered the primary driver of cracking. Surface water contributes by weakening the cuticle and epidermis. Therefore, various factors that influence water uptake, such as stem thickness, fruit size, soluble solid content, and bioactive compounds, may significantly affect fruit cracking.
It has been reported that some fruit characteristics had an effect on some other quality characteristics in sweet cherries [
10]. In that study, there was a positive polynomial relationship between the fruit stalk thickness and fruit cracking, between fruit weight and fruit stalk thickness, and between fruit weight and fruit firmness. In addition, there was a positive relationship between the fruit weight and the acidity content, and between the fruit firmness, acidity, and soluble solids. There was a negative relationship between fruit firmness and pH. The researchers used correlation analysis in their study. In breeding studies, information about the correlations between different characteristics is important. For the reasons stated above, in the study, we, as fruit scientists, care to reveal the effects of this biochemical on fruit quality, not human health. For example, do these biochemical compounds affect quality factors such as fruit size, stem length, or crack index? Actually, this is the main question for pomologists. In addition, is there a relationship between quality criteria such as fruit weight, stem thickness, hardness, and cracking index? If these relationships can be revealed, valuable information will be revealed for fruit breeding studies. For this purpose, after determining the quality criteria and biochemical compounds specified in this study, we investigated the correlations among these traits. Correlation analysis is also a useful method for specifying the degree of relationship between variables. Simple correlation may be insufficient because different genotypes are sensitive to different environmental conditions to varying degrees. The phenotypic and genotypic correlation estimates help us understand the environmental influence on heredity. This analysis is used to understand the complex relationships between features.
Previous studies have primarily relied on linear correlations or traditional regression models to explore the associations between morphological traits and cracking susceptibility. While informative, such approaches often fail to capture nonlinear relationships, interactions, and the conditional influence of biochemical properties. To overcome these limitations, we propose a comprehensive trait-dissection approach that integrates dimensionality reduction via Principal Component Analysis (PCA), nonlinear prediction through Random Forest regression, and model interpretability using Shapley Additive Explanations (SHAP). This multi-layered methodology enhances our ability to uncover hidden patterns in fruit phenotyping data and serves as a transferable analytical strategy for complex trait analysis in horticultural research.
To address these limitations, this study aims to develop a hybrid analytical framework that combines both classical statistical techniques and machine learning-based interpretability tools.
3. Results
3.1. Fruit Characteristics of the Genotypes Included in the Experiment
There are statistically significant differences in fruit characteristics between the varieties and genotypes included in the experiment (
Table 3). In the cultivars examined in the experiment, fruit weight varied between 1.76 g and 7.60 g, fruit width between 23.13 mm and 12.76 mm, and fruit length between 22.10 mm and 13.45 mm. The largest fruits in terms of fruit weight, width, and length were obtained from the Ş2 genotype, ‘Sweetheart’ and ‘Regina’ cultivars, while the smallest fruits were obtained from the E5 genotype. The size of the fruit stalk in cherries is very important for the nutrition of the fruit. It is also known that the length of the fruit stalk is an important factor in cracking. In the cultivars examined in this study, it was observed that the fruit stalk thickness ranged from 0.91 to 2.04 mm, while the fruit length ranged between 38.56 and 60.09 mm (
Table 3). In this experiment, the longest stalk fruits were obtained from GM5, the shortest stemmed fruits were obtained from the Ş2 genotype, the thickest stalk fruits were obtained from A1, GM6 and T4, and the thinnest stemmed fruits were obtained from the E5 genotype. The total soluble solids (TSS) content of cherries is very important in terms of taste and flavor. It varies from ecology to ecology, as well as from variety to variety. Moreover, it is an important variety-specific quality characteristic. It was observed that the TSS ranged between 14 33 (E5) and 21.27% (T4) in the genotypes included in the experiment (
Table 3).
In these studies, it has been revealed that cracking in cherries is an important cultivar characteristic. The sensitivity or resistance of cultivars to cracking can be demonstrated by determining the cracking indexes in laboratory conditions. In this study, the cracking index of the tested cultivars varied between 6.56 and 23.84. In the experiment, the highest crack index was found in GM4 (23.84) and the lowest crack index in the A8 (6.56) genotype (
Table 3).
According to numerous scientific studies, when quality is mentioned in cherries, fruit weight, fruit diameter, stem length, total soluble solids, acidity, color, and fruit flesh firmness come to mind. In fact, cultivar-breeding studies mainly focus on these criteria. This confirms our hypothesis in the introduction. This approach does not mean that the biochemical parameters such as total phenolic, total flavonoid, and total anthocyanin contents, and antioxidant capacity we focus on in this study are not important. Of course, when these are evaluated well, they are very important for human health, and pharmacists should especially work on these substances together with pomologists. However, these are not the elements that come to mind when it comes to fruit quality.
Although the ANOVA results provide clear evidence of statistically significant differences among genotypes in terms of individual fruit quality parameters, they do not fully capture the intricate interrelationships and potential nonlinear interactions among these traits. For example, while larger fruits tended to have higher cracking indices, exceptions such as GM4 suggested that factors beyond size, possibly biochemical properties, might modulate cracking susceptibility.
In order to address these complexities and to further elucidate the multidimensional relationships among physical attributes, biochemical composition, and cracking behavior, a hybrid analytical framework was implemented. This included exploratory data analysis techniques, such as PCA, alongside advanced machine learning models such as Random Forest regression combined with SHAP. These models offer a more holistic and interpretable view of the data.
PCA provided an initial overview of the covariance structure among the measured traits, revealing latent dimensions primarily driven by fruit size and stalk characteristics. Notably, PCA indicated that cracking index was not strongly associated with size-related traits alone, hinting at the influence of other factors such as biochemical composition.
Subsequently, a Random Forest regression model was trained to predict the cracking index using both physical and biochemical features. Permutation-based importance analysis revealed that antioxidant-related traits (e.g., DPPH activity, anthocyanin content) were among the most influential predictors, surpassing traditional physical characteristics in predictive relevance.
To enhance model interpretability, SHAP values were calculated to quantify and visualize the contribution of each feature at the individual sample level. These analyses demonstrated that antioxidant capacity exhibited a protective effect against cracking, particularly in larger fruits, thereby validating the hypothesis that biochemical properties play a critical and conditional role in determining cracking susceptibility.
3.2. Exploratory Analysis and Dimensionality Reduction
The correlation matrix (
Figure 2) reveals several key associations among physical fruit traits. Fruit weight, width, and length demonstrated extremely strong positive correlations with each other (r > 0.77), suggesting that these attributes represent a common underlying dimension related to fruit size. In contrast, stalk length showed a negative correlation with fruit weight (r = −0.49), indicating that lighter fruits tend to have longer stalks, a pattern that may reflect physiological differences in nutrient allocation.
Moderate positive correlations were also observed between stalk thickness and soluble solid content (r = 0.67), as well as between these variables and the cracking index (r ≈ 0.29–0.30). In addition, fruit weight showed a strong positive correlation with stalk thickness (r = 0.78, p < 0.01) and a moderate negative correlation with TSS (r = −0.34, p < 0.05). These specific associations emphasize the interconnected nature of morphological and internal quality traits. These findings suggest that internal quality traits such as sugar content and tissue firmness may be involved in susceptibility to cracking, though their linear relationships appear weak to moderate. Notably, the cracking index did not show strong linear correlation with fruit size variables, implying that more complex, nonlinear or interaction-based relationships may be present, warranting further investigation using machine learning models
The relationships between the cracking index of sweet cherry and other fruit characteristics, as in the PCA biplot, are shown in
Figure 3. Principal component 1 (PC1) explained 47.6% of the variability, while principal component 2 (PC2) accounted for 20.7% of the variation. PC1 appears to primarily reflect fruit weight, width, and length, consistent with the high intercorrelation observed in the correlation matrix. PC2 likely captures orthogonal variation, potentially associated with fruit stalk thickness, length or cracking index susceptibility.
PC1 and PC2 both explained 68.3% of the total variance in the dataset, reflecting both size-related traits and cracking susceptibility factors across genotypes. The observed clustering patterns suggest notable heterogeneity among the samples, with certain genotypes clearly separated in the PCA space. This indicates underlying phenotypic variation that could be leveraged for classification or grouping analyses. Additionally, the absence of extreme outliers and the presence of spread in both principal components support the appropriateness of PCA for dimensionality reduction in this context.
These findings reinforce the initial correlation-based observations and justify the subsequent use of multivariate and machine learning techniques to uncover nonlinear and interaction effects not captured by traditional linear methods.
Although PCA provided valuable insights into the overall structure of fruit traits and highlighted patterns of association among physical characteristics, it primarily captured linear relationships and unsupervised clustering patterns. However, the nature of fruit cracking susceptibility is inherently more complex, potentially driven by nonlinear interactions and conditional dependencies between both physical and biochemical variables. Therefore, to advance beyond the descriptive capability of PCA and to develop a predictive framework capable of quantifying the relative contributions of each trait to cracking risk, a machine learning approach was adopted. In this context, a Random Forest regression model was constructed to model and predict the cracking index based on the integrated dataset, offering both robust prediction and interpretable feature importance estimation.
3.3. Predictive Modeling with Random Forest and Feature Importance
Following the initial exploration, a Random Forest regression model was constructed to predict the cracking index based on both physical and biochemical traits. Permutation-based feature importance was computed to rank the predictive power of each variable. To assess the robustness of these importance scores, the analysis was repeated across 100 bootstrap samples. For each feature, the mean permutation importance, standard deviation, z-score, and approximate p-value were calculated.
Understanding the physiological and biochemical factors that contribute to fruit cracking in sweet cherries is essential for developing cultivars with enhanced resilience and postharvest quality. While traditional studies have focused on physical attributes such as fruit weight, size, and stalk length, recent evidence suggests that biochemical properties—particularly antioxidant profiles—may play a critical role in modulating cracking susceptibility under environmental stress.
To explore this hypothesis, we adopted a hybrid analytical framework combining classical statistics and machine learning. Specifically, we applied Random Forest regression models with bootstrap-based permutation importance to quantify the relative contribution of each trait to cracking index prediction. As summarized in
Table 4, biochemical compounds such as DPPH antioxidant capacity and anthocyanin content emerged as top-ranked predictors in terms of model contribution. However, their importance scores exhibited considerable variance, which is visually represented in
Figure 4 using confidence intervals derived from bootstrap resampling.
The predictive performance of the Random Forest model was evaluated on a test set, yielding an R2 of 0.63, mean absolute error (MAE) of 2.37, and root mean squared error (RMSE) of 3.66. These results confirm the model’s ability to reliably predict the cracking index using the integrated dataset.
These preliminary findings suggest that antioxidant-related traits may have a more complex and potentially conditional influence on fruit cracking than previously assumed. Thus, more interpretable and nonlinear modeling approaches are warranted in the subsequent stages of analysis.
Figure 4 shows bootstrapped permutation importance scores for each predictor variable based on the Random Forest model (n = 100 trees, 30 bootstraps). Error bars indicate ±1 standard deviation. The model achieved R
2 = 0.63, MAE = 2.37, and RMSE = 3.66 on test data.
As shown in
Table 4 and
Figure 4, the bootstrapped permutation importance analysis identified DPPH antioxidant capacity as the most influential variable in predicting the cracking index, with a mean importance score of 0.43. However, the relatively high standard deviation (0.41) resulted in a non-significant z-score (z = 1.04,
p = 0.298), indicating substantial variability across bootstrap samples.
Anthocyanin content and total phenolic content also demonstrated moderate model contributions, although their statistical significance remained low (p > 0.3). This variability may be attributed to genotype-specific responses or nonlinear interactions not fully captured by global importance metrics.
While the Random Forest model successfully identified key predictors of the cracking index through permutation-based importance analysis, this approach only provides a global ranking of features and does not capture the directionality or sample-specific effects of these variables. Understanding how each feature influences cracking risk at an individual observation level and whether these effects are consistent or conditional requires more granular interpretability. Therefore, to further dissect the predictive mechanisms and reveal nuanced, potentially nonlinear relationships, SHAP was applied to the trained model. SHAP enables a detailed and interpretable decomposition of model predictions, thus offering new insights into how physical and biochemical traits jointly determine cracking susceptibility in sweet cherries.
3.4. Interpretability with SHAP Values
To enhance model interpretability. SHAP was applied to the Random Forest model. SHAP values enabled the estimation of the direction and magnitude of each feature’s contribution at the individual observation level. This helped in detecting conditional effects, particularly involving antioxidant capacity and fruit size, to further understand the model’s inner workings. SHAP analysis was performed to disentangle the direction and conditional nature of each predictor’s influence. While DPPH antioxidant capacity exhibited high model importance, SHAP revealed that its contribution varied across samples and was more protective in larger fruits.
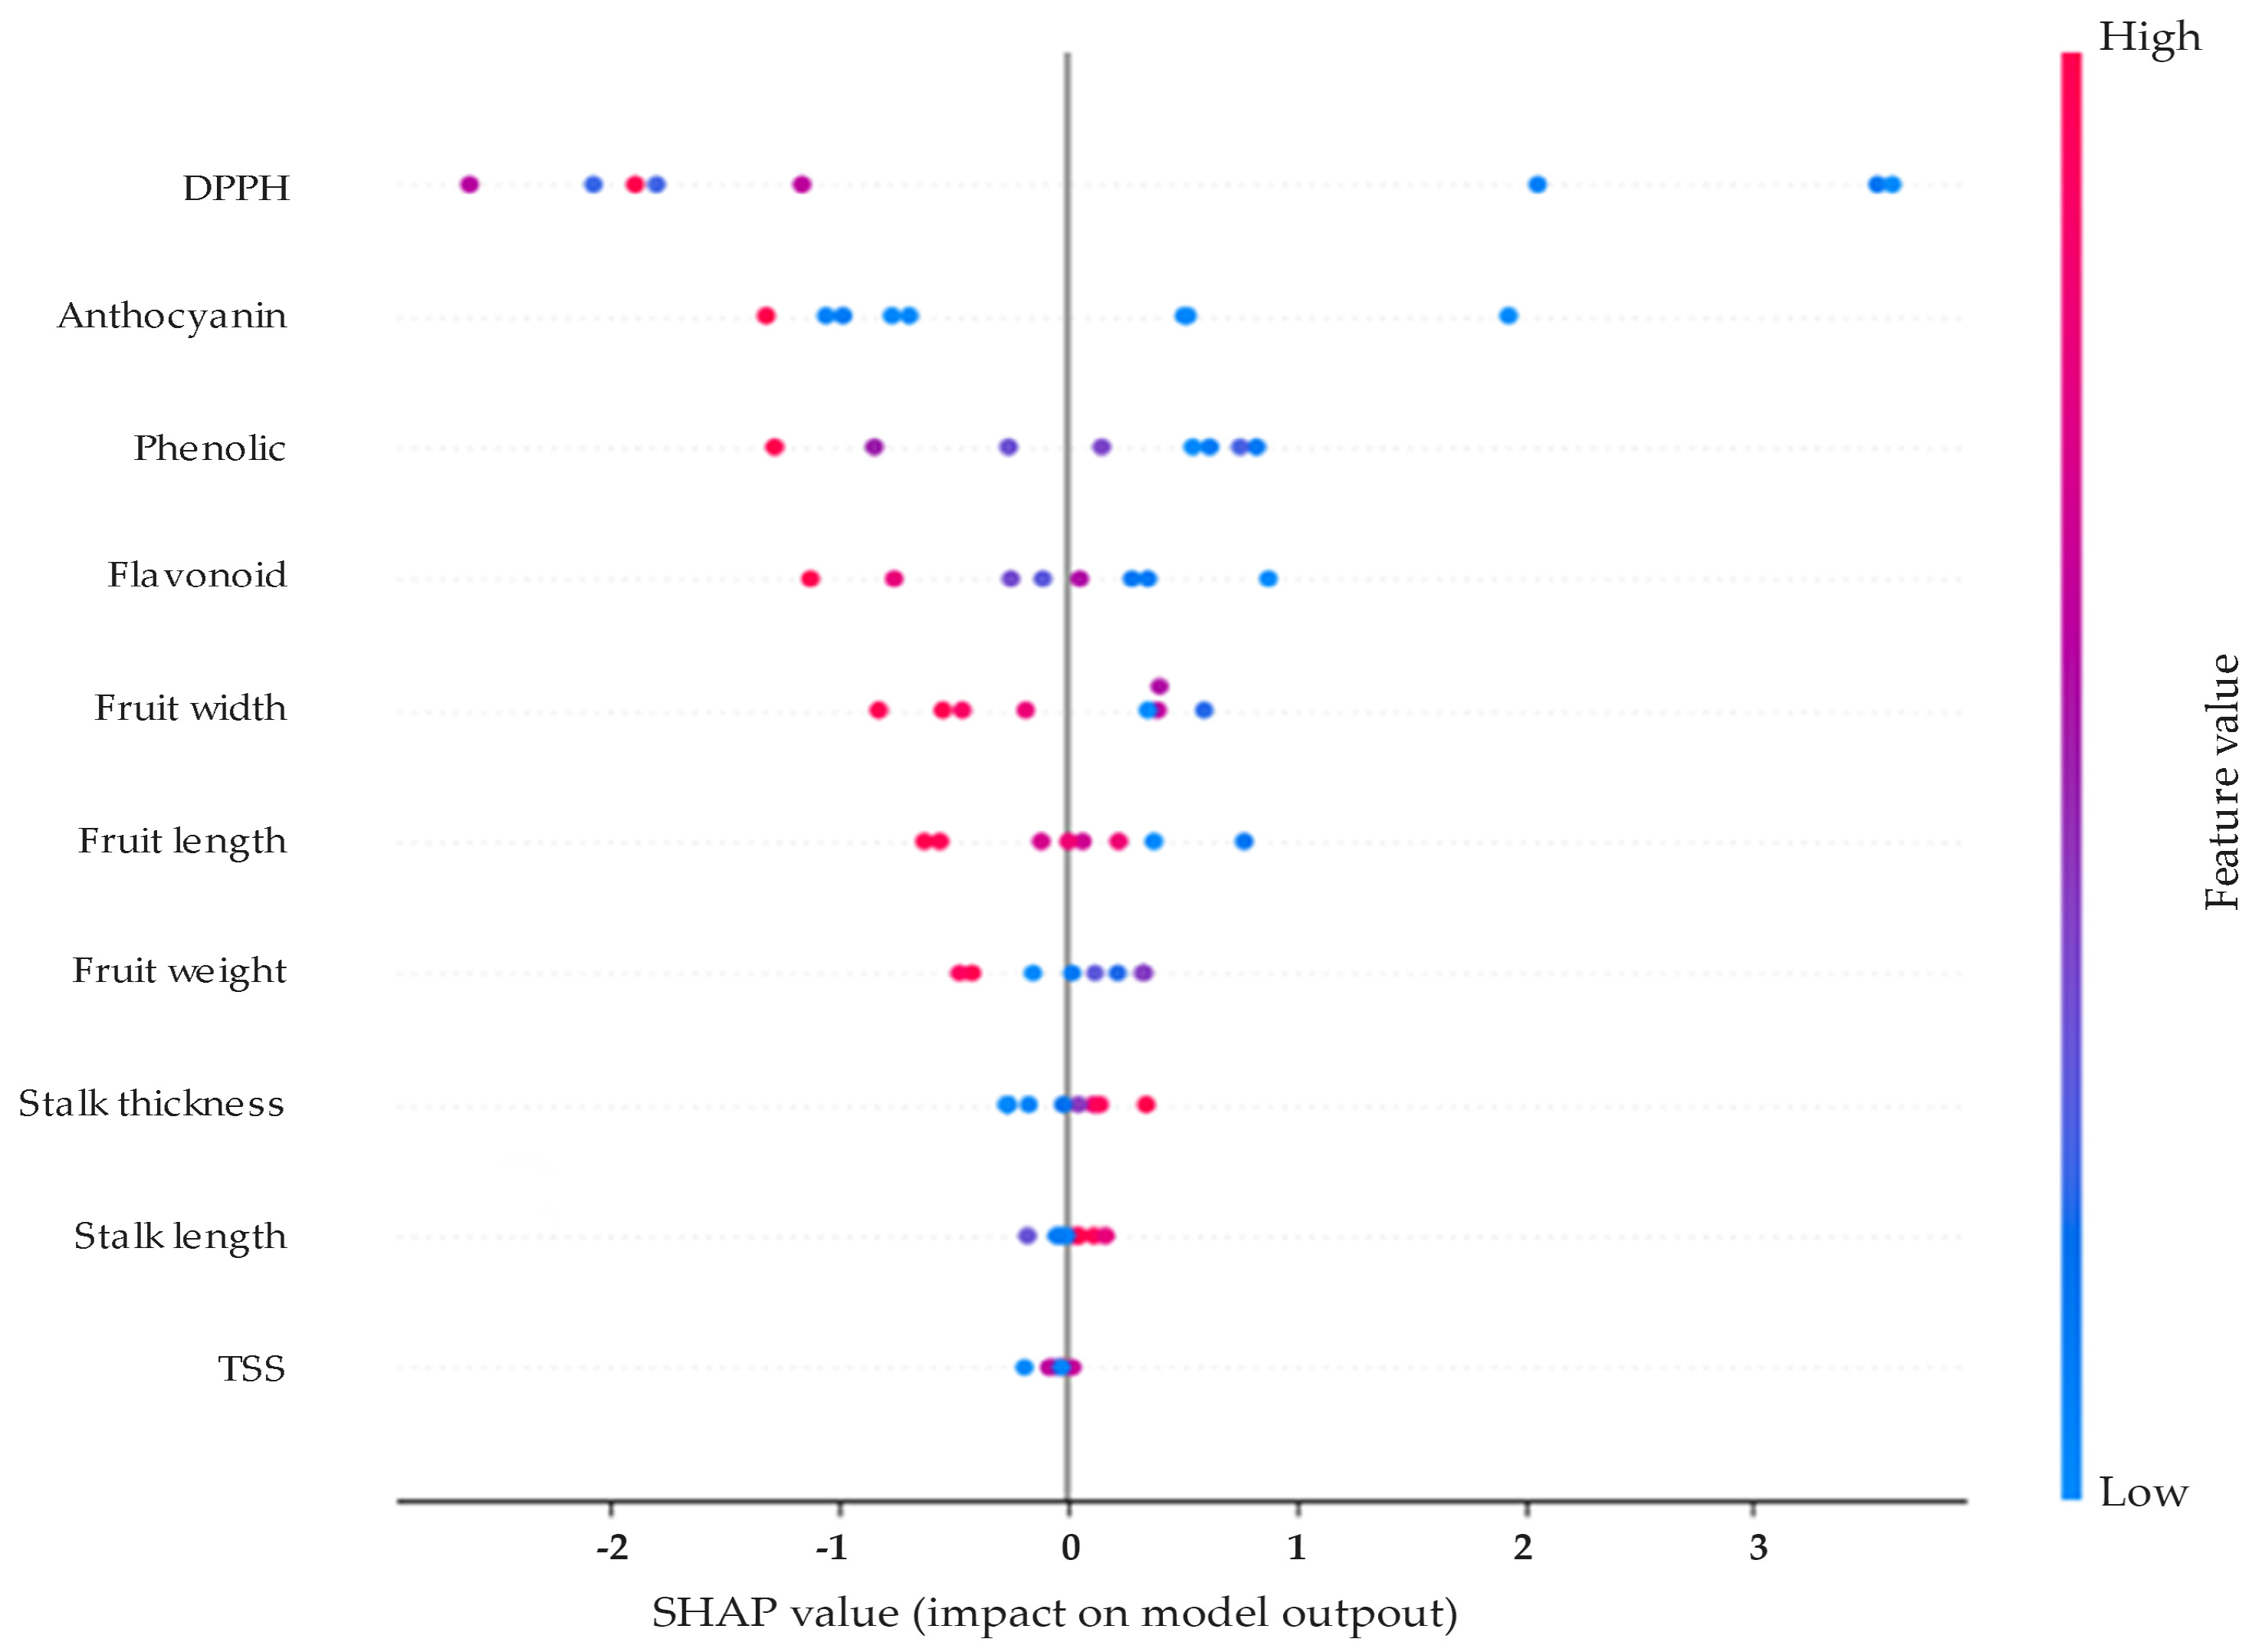
In
Figure 5, each dot represents an individual prediction; the position along the x-axis indicates whether the feature increased (positive SHAP value) or decreased (negative SHAP value) the predicted value. The color gradient reflects the actual feature value (red = high; blue = low).
In
Figure 5, each point represents a sample. The x-axis shows the actual value of DPPH, while the y-axis indicates the corresponding SHAP value. The shaded region indicates estimated confidence bounds. DPPH exerts the most substantial influence on the model’s prediction of cracking index, followed by anthocyanin and phenolic compounds. Importantly, the direction of influence varies across observations. For instance, lower DPPH values (blue points) are associated with higher positive SHAP values, indicating an increased predicted cracking risk. Conversely, high DPPH values (pink-red) tend to pull the prediction downward.
Figure 6 provides further insight into the conditional relationship between DPPH and the cracking index. The SHAP values suggest a non-monotonic relationship: when DPPH levels are low (around 12 or less), the predicted cracking risk increases significantly (positive SHAP values). However, at higher DPPH concentrations (>13.5), the SHAP values turn negative, indicating that higher antioxidant capacity actively reduces cracking susceptibility.
4. Discussion
Data collected from Amasya and Giresun 42 sweet cherry genotypes revealed fruit weight between 2.6 and 9.3 g, fruit width between 19.5 and 26.6 mm [
21], fruit weight between 2.7 and 8.7 g, fruit diameter between 16.7 mm and 25.7 mm, and fruit length between 24.8 and 15.4 mm in the cherry genotypes collected from Northern Anatolia [
15]. A fruit weight between 2.45 and 8.27 g in new sweet cherry accessions was reported in a study carried out in Czechsia [
22]. Another study found that the fruit weight of different cherry cultivars varied between 2.45 and 9.56 g [
23]. A fruit weight of 9.5 g in the Skeena cherry variety was found in a study conducted in Belgium [
24]. It was reported in another study that the fruit weight of different cherry cultivars varied between 10.3 and 13.6 g [
25]. Researchers determined the effects of rootstocks and cultivars on quality in Oregon and found that the Bing cultivar produced fruits between 9.0 and 11.1 g on different rootstocks. In the same study, it was also stated that different rootstocks had effects on other quality characteristics [
26]. A study was conducted on 19
P. cerasifera rootstock selections in Italy and noted that the fruit weight of the Burlat, Ferrovia, Giorgia, and Lapins cultivars varied between 6.5 and 9.8 g [
27]. Additionally, fruit weight between 4.40 and 8.86 g, fruit width between 19.06 and 24.91 mm, and fruit length between 18.88 and 28.45 mm were found in a study on 45 sweet cherry genotypes [
28]. In a study in Morocco with 47 sweet cherry genotypes, fruit weight ranged between 3.6 and 7.52 g, fruit length between 16.21 and 22.24 mm, and fruit width between 17.75–24.62 mm [
29]. In studies conducted in different parts of the world, it has been found that fruit size varies according to varieties and is an important cultivar characteristic.
In cherries collected from the Northern Anatolia region, the stalk thickness varies between 0.8 mm and 1.2 mm, and the stalk length varies between 2.1 and 4.9 cm [
15]. In another study, stalk length varied between 2.52 and 4.23 cm in sour cherry genotypes [
30]. The stalk length varies between 2.90 and 5.10 cm in the sour cherry genotype orchards in Serbia [
31]. It was found that fruit stalk length varies between 3.18 and 6.92 cm in the sour cherry cultivar region of Castilla y Leon Community (Spain) [
32]. In a study conducted in Iran, it was determined that the stem length of cherries varied between 10.57 and 12.40 mm, and the stem thickness varied between 0.77 and 1.96 mm [
28]. It was found that the fruit stalk length varied between 22.54 and 46.43 mm in a study carried out in Morocco with 47 cherry genotypes [
29]. It is known that varieties with longer stalks are more valuable both in the market and at harvest. For this reason, fruit stalk size is an important quality criterion in cherries. The TSS content in cherry genotypes collected from North Anatolia varied between 10.00 and 21.2% [
15]. The TSS content varied between 18.60 and 21.40% in the USA [
33]. In a study conducted in Oregon, the water-soluble dry matter content of different cherry cultivars on different rootstocks varied between 18.2 and 22.8% [
26]. TSS content generally varied between 17.00 and 18.00% in a study carried out on 19
P. cerasifera rootstock selections in Italy [
34]. The TSS of Burlat, Ferrovia, Giorgia and Lapins cultivars varied between 12.4 and 18.1% [
27]. The TSS content of 11 cherry cultivars grown on Gisela 5 rootstocks varied between 11.1 and 19.7% in Slovenia. In Belgium [
35], the TTS content in different cherry cultivars varied between 17.4 and 21.1% [
25]. The total soluble solids content varied between 17.2 and 19.8 in late cultivars and between 14.1 and 16.2 in early cultivars in the Czech Republic [
36]. The TSS content in the cherry cultivar region of Castilla y León Community (Spain) varied between 16.49 and 23.80% [
32]. The TSS content varied between 15.60 and 20.88% in 45 cherry genotypes in Iran [
28]. The TSS content was 15.50–18.50% at Rosegarland in the Derwent Valley, Australia [
37]. Although TSS content is a cultivar-specific feature, as can be seen in the examples given, that in different regions varies considerably due to climate.
Fruit cracking in cherries caused by rain is a very important problem. Indeed, cracked fruits have no market value. It has been suggested that fruit cracking in cherries is a very complex event, mainly due to water uptake from the root surface and pedicle [
34]. For this reason, scientists have conducted many studies on this subject for many years [
38,
39,
40,
41,
42]. A low cracking index indicates that the cultivar has better resistance to cracking. The cracking index in the tested early sweet cherry cultivars ranged from 0 to 44%, while it ranged from 0 to 19% in the late cultivars [
36]. A study conducted in Oregon reported that cracking occurred in different varieties and rootstocks. In this study, the cracking index in fruiting of trees with different rootstock and cultivar combinations varied between 7 and 14% [
26]. The cracking index varies between 0.00 and 56.10% in different sweet cherry cultivars [
10]. In addition, it has been suggested that the crack index is closely related to the bark thickness, and the crack index decreases as the bark thickness of the variety increases [
43].
There was a positive polynomial relationship between the fruit weight and the fruit stalk thickness, while there was a positive linear regression between the fruit stalk thickness and fruit diameter. Moreover, in the same study, it was found that there was a positive polynomial relationship between the fruit weight and fruit diameter [
10]. A linear regression was reported between the fruit weight and fruit diameter [
44]. The highest correlations (above 0.87) were observed between the variables fruit weight, fruit width, and fruit length [
45]. Similar positive correlations between fruit weight, fruit diameter, and fruit length were seen in other studies [
46,
47]. This can be explained by the fact that a heavier fruit has larger dimensions and a larger fruit stalk. Fruit diameter is an important criterion to help fruit classification in cherries [
10]. In a study conducted on 39 sweet cherry genotypes in Romania, it was determined that there was a positive correlation between fruit weight, fruit length, and fruit width, while there was a negative correlation between fruit weight and TSS [
48]. A report conducted on five sweet cherry genotypes determined that there was a positive correlation between fruit weight and fruit diameter, while there was a negative correlation between fruit weight and TSS [
49]. The tendency to crack increases with an increase in water-soluble substances from 17 to 21% and decreases between 21 and 24% [
50]. A weak relationship was observed between TSS and cracking rate [
17], whereas many researchers did not find any relationship [
51,
52,
53,
54]. As can be seen, despite the literature reporting that the tendency to crack increases with an increase in water-soluble substances, there is generally no clear relationship between water-soluble dry matter and cracking, because it is known that water-soluble, dry matter affects water uptake and therefore has an indirect effect on cracking. Indeed, it has been suggested that in cherries, the increase in sugars and soluble substances in the fruit juice leads to a rise in osmotic pressure, which in turn causes water uptake through the fruit epidermis or the roots [
51].
As a matter of fact, the relationship suggested here was a positive polynomial relationship between the fruit stalk thickness and fruit cracking, and the cultivars with the thickest fruit stalks had a higher cracking index than the cultivars with the thinnest fruit stalks [
10]. It was also reported that the passing of water into or out of fruit through the fruit stalk might cause fruit cracking [
54]. In addition, this study focused on water uptake from the fruit stem during cracking. All these studies show that the effect of fruit stalk on cracking is important [
55].
The first principal component (PC1) likely reflects traits such as fruit weight, width, and length, consistent with the strong relationships observed in the correlation matrix among these traits. The second principal component (PC2) captures variation that is orthogonal to PC1 and is thought to be related to traits such as fruit stem thickness, stem length, or susceptibility to cracking. In the study conducted on the Oblacinska sour cherry cultivar, it was determined that the variables with high discriminatory value were related to fruit characteristics [
47]. In a study with Early Bigi and Lapins sweet cherry cultivars, the researchers determined that there was a positive correlation between fruit cracking index and fruit width, length, and TSS [
56]. In the study conducted on the Early Bigi cultivar grafted onto SL 64 and Maxma 60 rootstocks, it was determined that fruit weight, fruit width, and length showed positive correlations [
57].
Interestingly, traditional physical traits such as fruit weight, width, and length displayed low permutation importance, suggesting that biochemical properties may play a more critical role in cracking susceptibility than size alone. This aligns with previous studies emphasizing the role of antioxidant activity in mitigating physiological disorders under stress conditions. It is known that antioxidants can reduce fruit cracking by preserving cell wall integrity, minimizing free radical damage, and regulating water uptake. Therefore, the presence of these compounds is highly important for mitigating or preventing the adverse effects of cracking. In the crack-susceptible ‘Prime Giant’ cherry cultivar, fruit antioxidant capacity and total phenolic compounds were significantly lower [
58]. This information is crucial for sweet cherry breeding programs [
59,
60,
61]. Moreover, several studies have demonstrated that the tendency for fruit cracking decreases as peroxidase activity, which forms cross-links with phenolic compounds, increases. These findings support the integration of explainable machine learning methods to uncover latent relationships that are not readily apparent from linear models or correlation analysis alone.
Antioxidant activity has an effect on fruit features, but only for certain ranges or under specific conditions, supporting the hypothesis that these effects are nonlinear and conditional. Other features like fruit weight and fruit size (fruit width and fruit length) exhibit lower and more balanced SHAP values, confirming their weaker overall influence. The process begins with exploratory data analysis, including descriptive statistics, correlation analysis, and PCA, aimed at revealing basic structure, redundancy, and multicollinearity among fruit traits.
In the second stage, a Random Forest regression model is trained using both physical and biochemical features to predict the cracking index. This is followed by a bootstrapped permutation importance analysis, which quantifies the average decrease in model performance when each predictor is randomly permuted thus providing a robust and unbiased ranking of feature relevance. Finally, SHAP is applied to the trained model to dissect the contribution of each feature at the individual sample level. This step provides insight into the direction, magnitude, and conditional behavior of each variable’s influence on model output, enabling interpretation of complex interactions that would be missed by conventional models. Together, this structured approach enhances the analytical depth of the study, offering both statistical reliability and interpretability, key requirements for applied agricultural decision-making, and cultivar improvement strategies.
Since SHAP analysis assumes feature independence, we conducted a multicollinearity diagnostic using Variance Inflation Factors (VIF). Between results indicated high collinearity among biochemical traits, particularly DPPH, anthocyanin, flavonoids, and phenolics (VIF > 50). This suggests that SHAP importance scores may overrepresent individual biochemical contributions due to shared variance. Therefore, interpretability results should be viewed in light of these interdependencies.
It is important to note that SHAP-based interpretability is inherently model-specific. While Random Forest served as the core algorithm in this study, future analyses should include additional ensemble models such as Gradient Boosting and XGBoost to assess the consistency of trait importance rankings. Moreover, applying the hybrid framework to external datasets or other sweet cherry cultivars would further test the robustness and generalizability of the observed relationships. Such validation steps are critical for translating the findings into widely applicable breeding strategies.
These findings have direct implications for breeding programs aiming to reduce cracking susceptibility while enhancing fruit quality. For instance, genotypes exhibiting both high DPPH antioxidant activity (>13.5 µmol TE/g) and low cracking index (<10%) represent promising candidates for cultivar development. This dual selection criterion enables breeders to target genotypes that combine physiological resilience with nutritional value. Moreover, identifying the dominant influence of stalk thickness and anthocyanin content on cracking risk provides actionable insights for parent selection and cross-breeding strategies.
This finding aligns with the theoretical expectation that antioxidants help mitigate oxidative stress at the cellular level, particularly under conditions that favor cuticle damage or water imbalance. Such effects would not be visible in a traditional linear correlation analysis, reinforcing the value of SHAP in agricultural phenotyping research.


