Article

Correlation, Path-Coefficient, and Economic Heterosis Studies in CMS-Based Cabbage Hybrids over Different Environments

1
Department of Vegetable Science, Dr. YS Parmar University of Horticulture and Forestry, Solan 173230, HP, India
2
Department of Fruit Science, Dr. YS Parmar University of Horticulture and Forestry, Solan 173230, HP, India
3
Faculty of Biology, Yerevan State University, Yerevan 0025, Armenia
4
Center for the Research and Technology of Agroenvironmental and Biological Sciences, Inov4Agro, Universidadede Trás-os-Montes e Alto Douro, Quinta de Prados, 5000-801 Vila Real, Portugal
*
Author to whom correspondence should be addressed.
Horticulturae 2025, 11(6), 606; https://doi.org/10.3390/horticulturae11060606
Submission received: 2 April 2025 / Revised: 22 May 2025 / Accepted: 26 May 2025 / Published: 29 May 2025

Abstract

:
Securing food for an expanding population in the face of climate change necessitates a transformation of global food systems towards sustainability, emphasizing nutritional quality and environmental consequences. This research assessed eight cytoplasmic male sterility-based cabbage hybrids and two controls across nine environments from 2020 to 2022 to improve cabbage output and sustainability. Essential characteristics, including head weight, compactness, and yield, were examined, revealing considerable heterogeneity and elevated heritability for features such as ascorbic acid content (98.41%) and net head weight (86.12%). Yield had a favorable correlation with characteristics such as net head weight and harvest index. Path coefficient research revealed that gross and net head weight have the most significant direct effects on yield. Heterosis research indicated UHF-CAB-HYB-1 had the highest significant positive heterosis in yield compared to the standard checks, Pusa Hybrid-81 and Pusa Cabbage-1, across all nine conditions. The results underscore the need to identify essential characteristics for the creation of high-yield, hardy cabbage hybrids, in accordance with sustainable agriculture and food security objectives.

1. Introduction

The most critical and challenging issue at present is to ensure food security for the growing population in a sustainable manner while simultaneously addressing the escalating effects of climate change. The recognition of the necessity for a shift in the global food system’s focus from quantity of food to nutritional quality, as well as its impact on environmental and health outcomes, is increasingly widespread. Cole crops, also known as cruciferous vegetables, have served as sustenance for countless generations, with a history spanning thousands of years. In the absence of contemporary methods of transportation and storage, these crops exhibited exceptional durability, allowing for year-round availability. Cabbage (Brassica oleracea L. var. capitata L.) possesses significant potential in enhancing global food security, rendering it a highly valuable cash crop within the vegetable industry [1]. Cabbage is a member of the Brassicaceae family, with a chromosome number of 2n = 2x = 18 and a genome size of 630 Mb, as reported by Liu et al. in 2014 [2]. Cabbage has been documented in historical records as having been utilized for medicinal purposes, with claims of efficacy in treating various ailments such as cancer, headaches, vomiting, gout, peptic ulcers, and facilitating detoxification of the body [3]. The leafy head, a nutritious source of fiber, minerals, and vitamins, is the economically significant portion of cabbages [4]. In the current worldly scenario, the majority of the cabbage genotypes are hybrids, requiring early head formations and more yield. In the context of the Indian market, the private sector dominates the vegetable hybrid sector, selling at exorbitant prices [5]. The successful production of F1 hybrids in cabbage demands a cost-effective, more efficient, reliable, and stable process. This production process should be persistent in producing hybrid seeds that are devoid of self-fertilized seeds from both parents. Owing to the presence of smaller-sized flowers, the emasculation and pollination process leading to the production of hybrid seeds in cabbage is extremely tedious [6]. The cytoplasmic male sterility (CMS) system is the genetic mechanism that is the most stable and provides a solid alternative for the creation of F1 hybrids without the process of emasculation [7]. Genetic abundance in any germplasm is crucial for any crop improvement attempt since it is the key to integrating desirable genes and necessitates a detailed awareness of existing genetic diversity [8,9]. To enhance yield and production output through breeding, it is necessary to identify variability, character associations’ nature, and involvement of various traits in crops [10]. Given the intricate nature of inheritance and the potential involvement of multiple related traits, understanding the extent of phenotypic and genotypic correlations among traits holds significant importance in the context of economically valuable traits. Yield is a multifaceted parameter that is subject to the influence of various factors, including polygenes, environmental conditions, and genetic heterogeneity [11]. The selection for increased yield should not be solely centered on yield itself, as it is a multifaceted trait that interacts with other traits that enhance yield [12]. Hence, following the acquisition of understanding regarding the characteristics and extent of genetic diversity, it becomes crucial to collect data pertaining to the correlation between crop yield and other traits, as well as the interrelationships among these traits. This information serves as a foundation for identifying specific traits that can enhance the effectiveness of both direct and indirect selection methods, ultimately leading to the establishment of an optimal plant phenotype [13,14].
Path coefficient analysis is a statistically sound methodology used to partition correlation coefficients into direct and indirect effects. It assesses the interconnectivity of multiple yield-related traits [11]. By simply correlating the independent factors and regressing each independent component on each dependent factor independently, path analysis enables one to determine the impact of independent factors on dependent factors [15]. The study of genetic variation is of significant interest to plant breeders. The greater the genetic dissimilarity between parents, the higher the probability of a heterotic cross producing an F1 generation with a broad range of diversity in subsequent generations of segregation [5]. The different CMS (cytoplasmic male sterility) and restorer lines have the purpose of enhancing the production of superior hybrids that exhibit high head yield, along with improved heterosis [7,16,17].
Heterosis exploration is a scientific methodology aimed at enhancing the yield and productivity of cabbage. Heterosis, also known as hybrid vigor, is a well-documented phenomenon observed when an F1 hybrid resulting from the crossing of genetically distinct parents exhibits enhanced performance compared to the standard or commercial variety. In scientific trials, a check variety is commonly included for comparison purposes [18,19]. The phenomenon referred to as economic heterosis has been identified and documented by Mogesse [20]. The present investigation utilized correlation-based path analysis and trait association in measurable characteristics of cabbage to assess the economic heterosis (%) for yield and contributing traits across National Checks (hybrids) in various situations and locations.

2. Materials and Methods

2.1. Plant Materials

The investigation was carried out using eight hybrids developed by using cytoplasmic male sterile lines at the experimental farm of the Department of Vegetable Science, Dr YS Parmar University of Horticulture and Forestry, Solan (HP), India, along with two checks (Table 1). The two checks were Pusa Hybrid-81, which was the first CMS-based cabbage hybrid developed in India, and the other check, Pusa Cabbage-1, was another public sector hybrid. The seedlings of hybrids and check cultivars were laid out in a randomized complete block design with three replications at each location (Table 2) by transplanting at different dates, creating nine environments during 2020–2021 and 2021–2022 (Figure 1). Field trials were conducted recurrently at three locations in two cropping seasons (2021 and 2022) in India. The seedlings were transplanted in the field at a spacing of 45 × 45 cm, and each genotype consisted of 20 plants per plot per replication. The observations with respect to the following characters were recorded on ten randomly selected plants from each plot in each replication.
The measurement standards of the traits were as follows:
Days to fifty percent marketable maturity: The number of days taken from the date of transplanting to the date when 50 percent of the plants had attained the marketable head size.
Number of non-wrapper leaves: The number of leaves that are not wrapping the head were counted as non-wrapper leaves.
Plant spread (cm): The plant spread in centimeters was measured as the distance between two opposite outermost leaves along two intersecting equatorial axes at right angles and recorded as the average of two measurements.
Head compactness (g/cm3): The head compactness was calculated by using the formula:
Z = C W 3 × 100
where Z = compactness index, C = net head weight (g), W = average of polar and equatorial diameter of head (cm).
Head shape index: The head shape of a variety is represented by the ratio of the polar and equatorial diameters of the head, and ratios of <0.5, 0.8–1.0, and >1.0 represent drumhead, normal or spherical, and conical, respectively, as suggested by Selvakumar [21]. So, based on the head shape index, head shape was recorded as drumheads, round heads, and conical heads.
Gross head weight (g): The weight of the whole plant, including roots and stalk, was recorded at the time of harvesting on ten randomly selected plants, and their mean was calculated as the average gross head weight.
Net head weight (g): The weight of ten randomly selected heads (excluding stalk and non-wrapper leaves) was recorded at the time of harvest, and the mean was calculated to get the average net head weight.
Stalk length (cm): The stalk length was calculated from the first non-wrapper leaf up to the first secondary root.
Harvest index (%): Ratio of net head weight to gross plant weight was calculated and recorded in percentage. Harvest index was calculated by the following formula:
H I ( % ) = N H W G H W × 100
where HI = harvest index, NHW = net head weight (g), GHW = gross head weight (g).
Equatorial diameter of head (cm): The horizontal length of the head in centimeters after cutting it into two equal halves was recorded as the equatorial diameter of the head using digital Vernier calipers at marketable maturity.
Polar diameter of head (cm): The vertical length of the head in centimeters after cutting it into two equal halves was recorded as the polar diameter of the head using digital Vernier calipers at marketable maturity.
Core length (cm): Internal stem length of the head from head base to end of the core was measured by cutting the head vertically into 2 equal halves.
Total soluble solids (˚B): Total soluble solids of the heads were determined by crushing and extracting juice with the help of muslin cloth. A drop of juice was placed on the plate of the hand refractometer and the reading was noted. The results were expressed as ˚B.
Ascorbic Acid (mg/100 g): Ascorbic acid content of heads was determined as per the 2,6-dichlorophenol-indophenol visual titration method as described by Ranganna [7].
Yield per plot (kg): The total heads harvested in each plot were weighed and expressed as yield per plot in kilograms, and from that, per hectare in quintals was calculated.

2.2. Statistical Analysis

As per Gomez and Gomez [22], Opstat.python software (http:\\opstat.pythonanywhere.com, accessed on 1 January 2025) was used to do an analysis of variance on pooled agro-morphological data from the years 2021 and 2022. The magnitude of various genetic parameters was classified in which the phenotypic coefficient of variation (PCV) and the genotypic coefficient of variation (GCV) with values greater than 30% were categorized as high, values between 15% and 30% as moderate, and low if the values are less than 15%. The heritability (H) values were classified as high if they exceeded 80%, moderate if they ranged between 50% and 80%, and were below 50% [23]. Correlation coefficients were worked out to determine the degree of association among the characters as well as yield [24]. The estimates of direct and indirect effects were calculated by the path coefficient analysis method as suggested by Dewey and Lu [25]. Both correlation and significance analyses and path coefficient analysis were conducted by Plant Breeding Tools (PBTools) by the International Rice Research Institute (IRRI).
The estimation of heterosis was done as the deviation of the F1 mean from the standard check. The following formula was followed for the calculation of different estimates of heterosis [26]:
Heterosis (%) over standard check (SC) = [(F1 − SC)/SC] × 100
In order to test the significance for different estimates of heterosis, a t-test was conducted.

3. Results

3.1. Source of Variation

Combined analysis of variance results for all genotypes across all locations for the traits of vegetative, yield, and yield components are presented in Supplementary Table S1. Significant variation was observed among environments (E), genotypes (G), and G × E interaction. Highly significant differences (p ≤ 0.05) were detected between environment, genotype, and genotype-environment interactions for all the variables studied. The extent of the significant differences observed implies that there is a considerable degree of genetic variation among the genotypes evaluated.

3.2. Parameters of Variability

For formulating an efficient breeding program, the nature and extent of genetic variability is one of the important criteria. The knowledge of phenotypic and genotypic coefficients of variation is very much helpful in predicting the amount of variation present in a given set of genetic stocks. Table 3 indicated great genotypic and phenotypic variability in experimental material. The phenotypic coefficient of variation ranged from 4.00 to 17.66 percent. High phenotypic coefficient of variation was observed in head compactness (17.66%). Moderate phenotypic coefficients of variation were recorded for ascorbic acid content (13.08%), net head weight (12.12%), core length (10.92%), harvest index (10.80%), and yield (10.16%), while plant spread exhibited a low phenotypic coefficient of variation (4.00%).
Phenotypic coefficient of variation alone does not reveal the relative amount of variation; hence, different aspects of genetic parameters were also worked out. Genotypic coefficients of variation (GCV) were high for head compactness (16.12%), and ascorbic acid (12.98%) moderate for net head weight (11.25%), core length (9.98%), and yield (9.29%), and low for polar diameter of head (3.32%). Heritability in a broad sense is a parameter of tremendous significance to the breeders, as its magnitude indicates the reliability with which a genotype can be recognized by its phenotypic expression. In the present study, high to moderate heritability estimates were obtained for most of the characters (Table 3). Heritability in the broad sense (h2bs) ranged from 26.86 to 98.41 percent. High heritability estimates were obtained for ascorbic acid (98.41%), followed by days to fifty percent marketable maturity (92.75%), net head weight (86.12%), yield (83.63%), and head compactness (83.32%), while moderate heritability was recorded for total soluble solids (77.02%), harvest index (70.48%), gross head weight (70.45%), and number of non-wrapper leaves (60.66), respectively. In the present study, high genetic advance as a percentage of the mean was observed for head compactness (30.31%), ascorbic acid (26.53%), and net head weight (21.50%).

3.3. Correlation Studies

Table 4 displays the environmental correlation of yield and yield component traits of cabbage hybrids across the environment. We noticed that the majority of the traits had a non-significant association with each other and with yield in terms of environmental correlation. The net head weight (0.57) and head compactness (0.48) had strong and perfect correlation with yield. A perusal of values of genotypic and phenotypic correlation coefficients is presented in Table 5. Data revealed that genotypic correlation was higher in magnitude than the corresponding phenotypic correlation. The phenotypic correlation coefficients among different characters revealed that yield had significant positive correlation with neat head weight (0.73), harvest index (0.56), head compactness (0.55), and gross head weight (0.47), respectively. The association of characters and the magnitude of their relationship with other characters at the genotypic level revealed that yield had a positive and significant correlation coefficient with net head weight (0.82), gross head weight (0.72), harvest index (0.62), head compactness (0.56), and total soluble solids (0.54). It can be anticipated that choosing hybrids with a high yield potential based on the combination or alone of these traits will produce the desired results. Yield had a negative and significant correlation with the number of non-wrapper leaves (−0.70) and plant spread (−0.57). Net head weight was positively and significantly correlated with harvest index (0.92), total soluble solids (0.70), ascorbic acid (0.61), and head compactness (0.59), respectively.

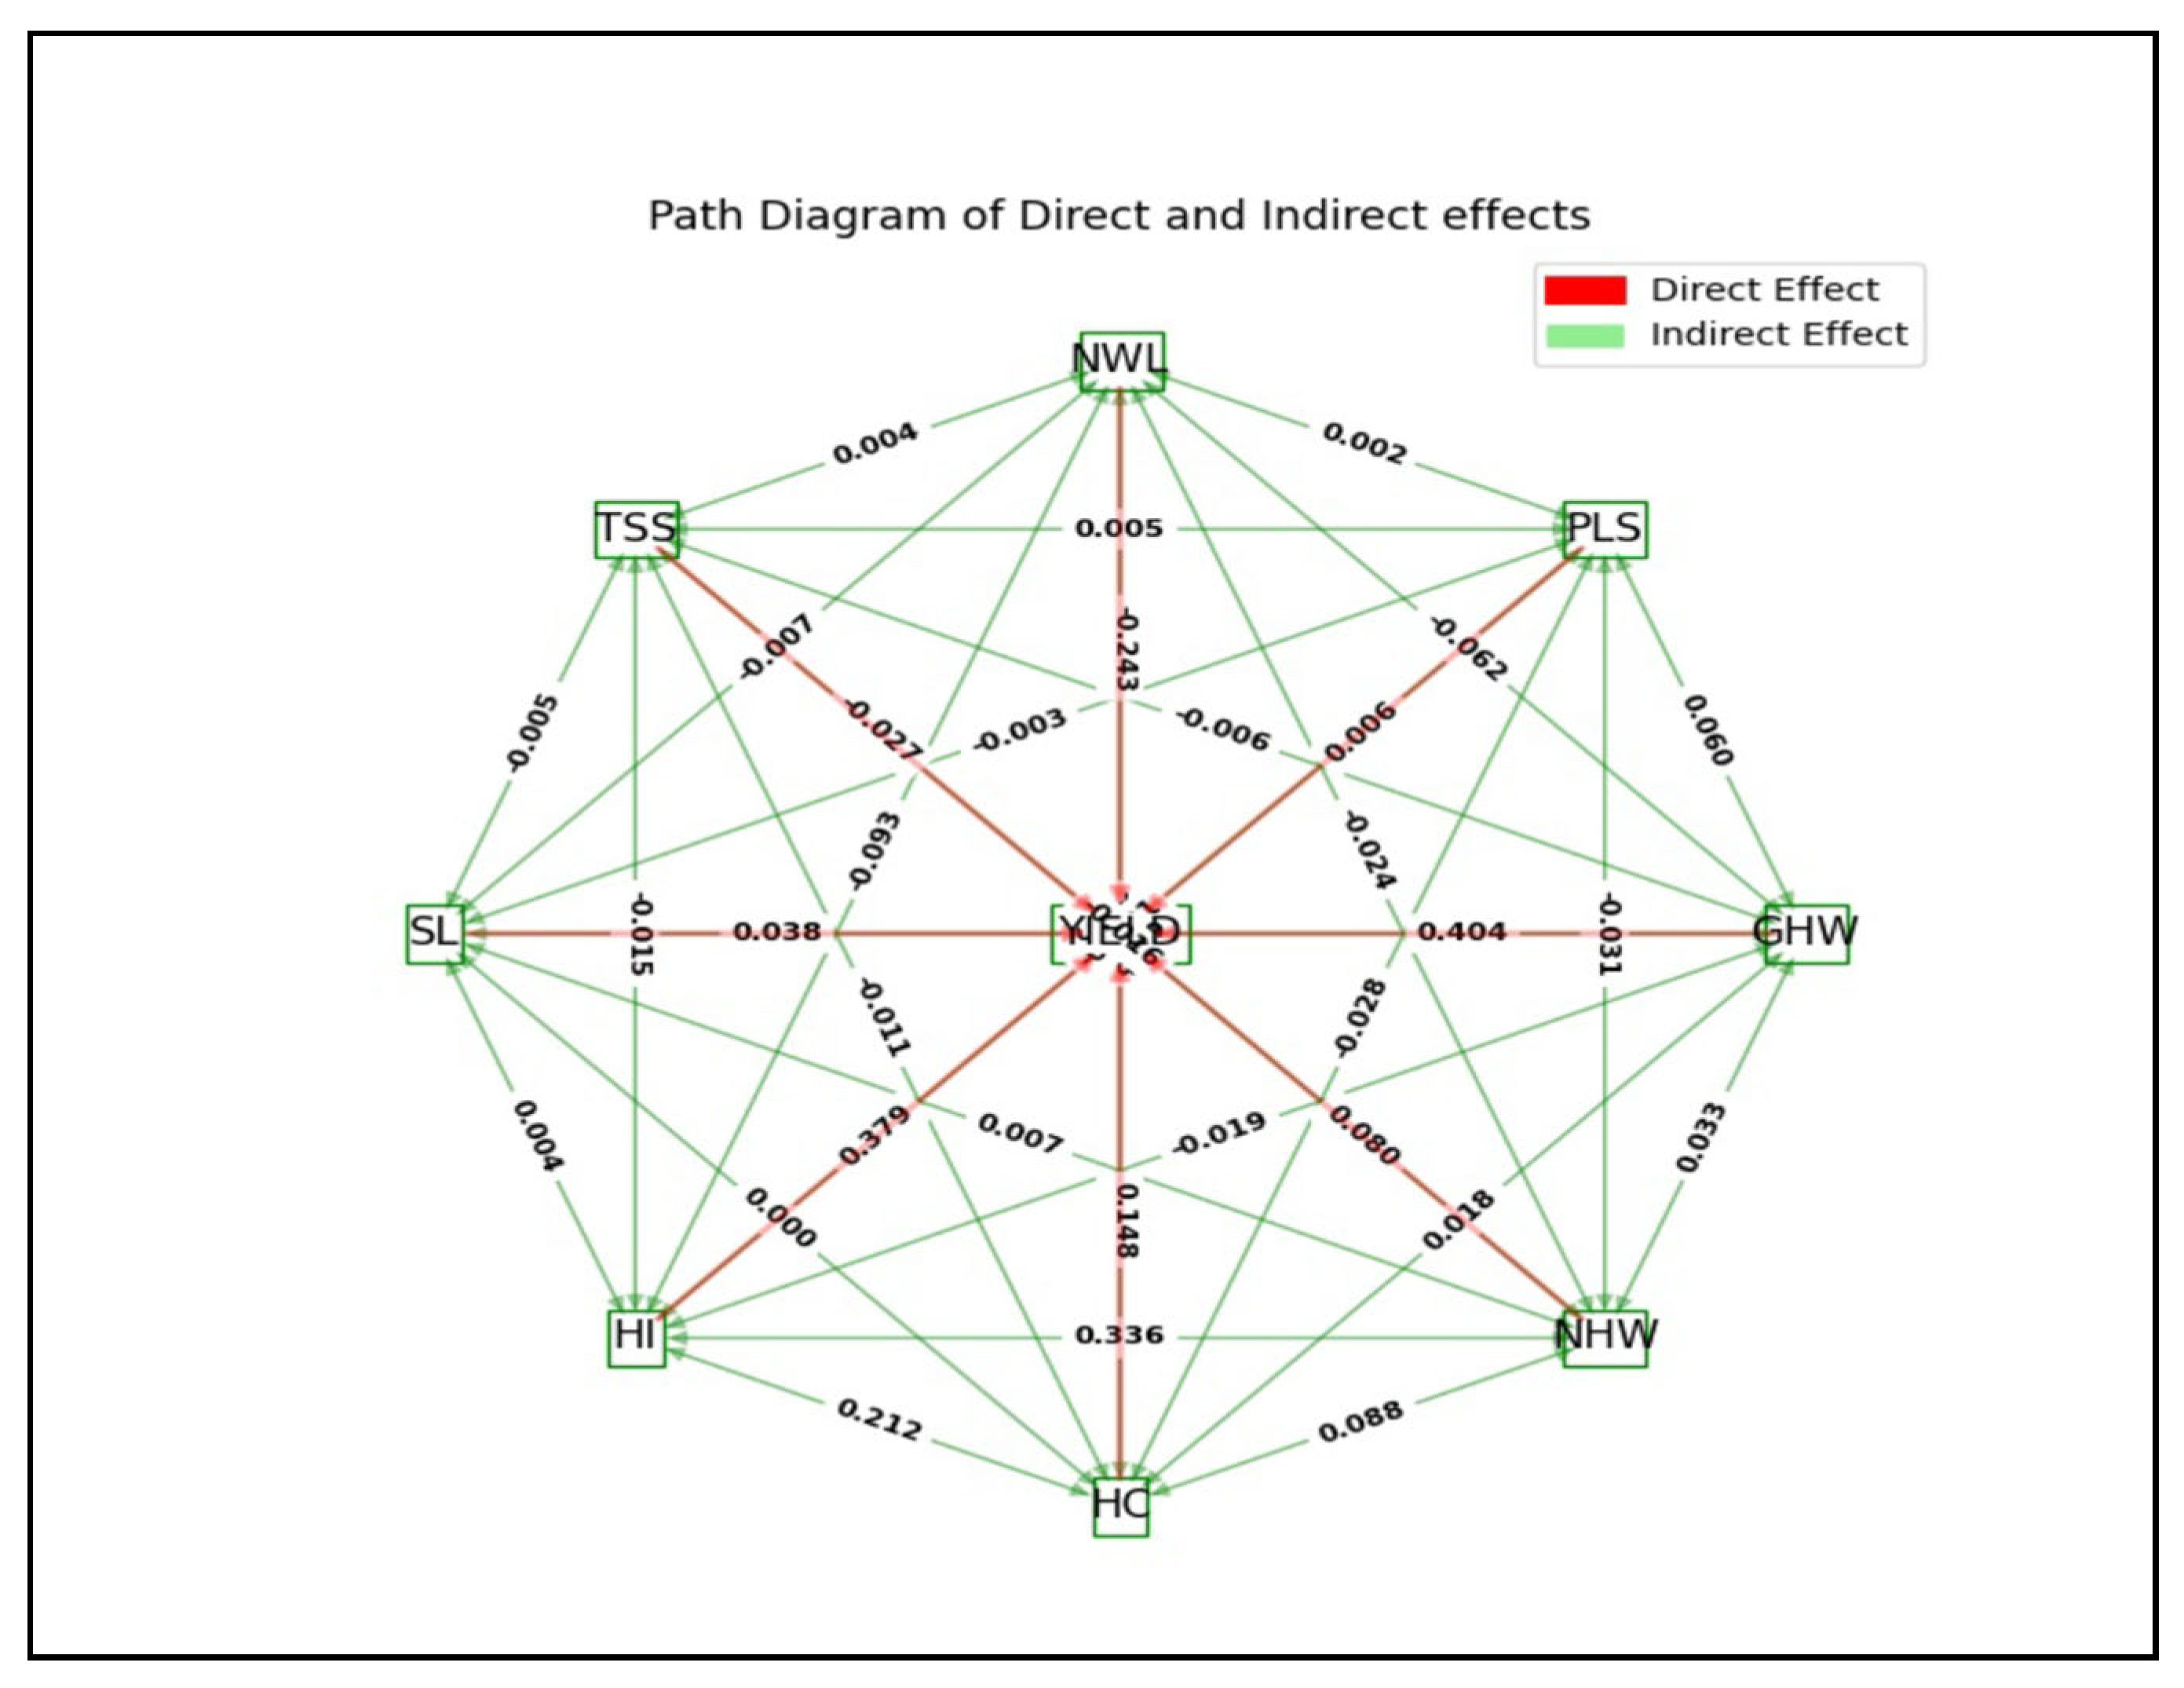
3.4. Path Coefficient Analysis

Path coefficient analysis makes it possible to examine both the direct effects of different characters on yield as well as their indirect effects through other component features. The yield components are thus determined using the calculations of the direct and indirect effects. Path coefficient analysis, which was made by the method of Dewey [25] and developed by Wright [24], gives a realistic way to give the right amount of weight to different factors when making a practical plan to improve yield. It was evident from the data (Figure 2) that gross head weight (0.404) had the maximum positive direct effect on yield, followed by harvest index (0.379), head compactness (0.148), and net head weight (0.080). These traits can be employed directly in selection for yield increase in cabbage breeding due to their strong positive direct effect on yield and large positive connection with yield, with the exception of number of non-wrapper leaves. Gross head weight exhibited positive indirect effects via the number of non-wrapper leaves (0.038) and net head weight (0.033). The positive indirect effects of net head weight were observed via harvest index (0.336) and gross head weight (0.167). The positive indirect effects of head compactness were observed mainly via harvest index (0.212) and number of non-wrapper leaves. At the genotypic level, the residual effect was found to be 0.00170. The presence of a residual impact suggests the contribution of other factors on the variability beyond the ones that were evaluated.

3.5. Heterosis Studies

The heterosis study was conducted over nine environments, viz., E1 (first date of transplanting at UHF, Nauni, Solan), E2 (first date of transplanting at RHR and TS, Dhaulakuan), E3 (first date of transplanting at RHR and TS, Bajaura), E4 (second date of transplanting at UHF, Nauni, Solan), E5 (second date of transplanting at RHR and TS, Dhaulakuan), E6 (second date of transplanting at RHR and TS, Bajaura), E7 (third date of transplanting at UHF, Nauni, Solan), E8 (third date of transplanting at RHR and TS, Dhaulakuan), and E9 (third date of transplanting at RHR and TS, Bajaura). The superiority of eight F1 hybrids over the two standard checks was worked out in the present study in cabbage over nine environments (Table 6, Table 7 and Tables S2–S6). Since early market maturity is preferred, a negative heterosis is preferred for days leading to 50% marketable maturity. For days to fifty percent marketable maturity, hybrid UHF-CAB-HYB-1 had maximum significant negative heterosis over both standard checks in all the nine environments except E9. For a number of non-wrapper leaves, negative heterosis is desirable. Hybrid UHF-CAB-HYB-1 had maximum significant negative heterosis over both standard checks in E1, E2, E4, E5, E6, and E8, while at E3 significant maximum negative heterosis was exhibited by UHF-CAB-HYB-2 over Pusa Hybrid-81 for non-wrapper leaves. For plant spread, hybrid UHF-CAB-HYB-1 exhibited maximum significant negative heterosis at E4, E6, and E7; UHF-CAB-HYB-3 at E5 and E8, and UHF-CAB-HYB-6 at E9 over both the standard checks. For gross head weight, maximum significant positive heterosis over both the standard checks was exhibited by hybrid UHF-CAB-HYB-6 at E1, UHF-CAB-HYB-6 at E4, UHF-CAB-HYB-5 at E5 and E8, UHF-CAB-HYB-3 at E6 and E9, and UHF-CAB-HYB-2 at E7. Net head weight is an important horticultural trait contributing towards higher yield. The hybrid, UHF-CAB-HYB-1, exhibited maximum positive standard heterosis for net head weight over both the checks in all the nine environments (Table 6). For harvest index, UHF-CAB-HYB-1 had maximum significant positive heterosis in E1, E2, E3, E4, E5, E8, and E9 over both standard checks, while UHF-CAB-HYB-1 over Pusa Hybrid-81 and Pusa Cabbage-1 in E6 and E7, respectively. Head compactness is a very necessary criterion for good cabbage hybrids from the consumer viewpoint (Table 7). Hybrid UHF-CAB-HYB-1 had maximum significant positive heterosis in E1, E2, E4, E7, E8, and E9 over both standard checks for head compactness. It is preferable to have negative heterosis for stalk length. For stalk length, maximum significant positive heterosis was exhibited by UHF-CAB-HYB-5 in E1, UHF-CAB-HYB-7 in E2, and UHF-CAB-HYB-4 in E3 over both the standard checks. Maximum significant negative heterosis over both the standard checks for core length was exhibited by hybrid UHF-CAB-HYB-7 in E1, E2, and E3; UHF-CAB-HYB-2 in E4; UHF-CAB-HYB-1 in E5; UHF-CAB-HYB-7 in E6; and UHF-CAB-HYB-1 in E7, E8, and E9. For ascorbic acid, maximum significant positive heterosis was exhibited by hybrid UHF-CAB-HYB-1 in E1, E3, and E6 and UHF-CAB-HYB-5 in E4, E9, E5, and E7 over both the standard checks used in the present investigation (Table S6). For total soluble solids, maximum significant positive heterosis was exhibited by UHF-CAB-HYB-3 in E6, and UHF-CAB-HYB-1 in E7 had positive significance over both the standard checks, while UHF-CAB-HYB-1 was positively significant in E1 over Pusa Hybrid-81.

4. Discussion

Selection for a particular trait is generally made on the basis of its phenotypic expression, which is the outcome of interaction between genotype and environment. Therefore, the phenotypic superiority of plants over the original population is not solely due to favorable environmental factors. In such a situation, genetic advance gives a good idea for actual gain to be made in the population under evaluation. Genetic advance is a measurement of genetic gain under selection that is dependent on numerous parameters, including heritability, genotypic coefficient of variation component (GCV), and phenotypic coefficient of variation component (PCV) [27]. It was shown in the study that the genotypic coefficients of variation (GCV) were high for head compactness and ascorbic acid. There is a significant amount of genetic variation in the calculated characteristics, and the phenotypic and genotypic coefficients of variance address this variation. Due to the fact that the success of selection is dependent on the variance in genetic material, this suggests that selecting these characteristics might be highly helpful in achieving the desired results. Variability and association studies were carried out by various researchers, viz., Sharma et al. [28], Sharma et al. [29], and Ozer et al. [30] in cabbage; Chittora and Singh [31], Dey et al. [32], and Chıttora et al. [33] in cauliflower; and Wudneh [34] in kale, and they reported a higher magnitude of phenotypic coefficient of variability than genotypic coefficient of variability.
In this study, high heritability estimates were recorded for ascorbic acid (98.41%), followed by days to fifty percent marketable maturity (92.75%), net head weight (86.12%), yield (83.63%), and head compactness (83.32%). Moderate heritability was noted for total soluble solids (77.02%), harvest index (70.48%), gross head weight (70.45%), and number of non-wrapper leaves (60.66%), respectively. The current findings contradict those of several other studies, namely Sharma et al. [28], Ozer et al. [30], Soni et al. [35], and Thakur and Vidyasagar [36].
Yield is a complex character that arises through the interactions between a number of constituent characters and their environments. The effectiveness of any breeding program depends upon the nature of the association between yield and other component characters; the more directly a character is associated with yield in the desirable direction, the more successful the selection program. Therefore, after getting the knowledge on the nature and magnitude of genetic variation, it is also important to gather information on the association of yield with other characters among themselves and their basis to identify characters for increasing the efficiency of both direct and indirect selection and thereby defining an ideal plant type. Having the right cultivars is essential for extensive cabbage production. The degree to which particular features are genetically determined and which of them are most crucial for the selection and development of novel cultivars can be demonstrated by studies of correlation between properties [37]. The results demonstrated that the phenotypic correlation was inferior to the genotypic correlation.
Head weight exhibited a highly substantial and positive connection at both the phenotypic and genotypic levels with the number of wrapper leaves per plant, head diameter, and days to harvest characteristic. Data revealed that genotypic correlation was higher in magnitude than the corresponding phenotypic correlation. This might be due to the masking effect of the environment on the total expression of the hybrids under study, resulting in the reduced phenotypic association [38]. The results demonstrated that the phenotypic correlation was inferior to the genotypic correlation. Yield exhibited a highly substantial and positive connection at genotypic levels with net head weight, gross head weight, harvest index, head compactness, and total soluble solids characteristics. Kutty et al. [39] also reported that net head weight showed significant positive correlation with days to harvest, plant spread, gross plant weight, stalk length and non-wrapping leaves. Our findings were corroborated with the findings of Sharma et al. [28], Sharma et al. [29], and Ozer et al. [30].
It is an important tool for partitioning the correlation coefficients into direct and indirect effects of independent variables on a dependent variable. Path analysis provides an effective means of a crucial examination of specific forces acting to produce a given correlation and measuring the relative importance of each factor. Path coefficient analysis, which assigns weights to various factors while undergoing a crop improvement initiative, serves as the ideal alternative [40]. The data clearly indicated that gross head weight exerted the most substantial positive direct effect on yield, followed by harvest index, head compactness, and net head weight. These qualities can be directly utilized in the selection process for yield enhancement in cabbage breeding, owing to their significant positive direct impact on yield and substantial positive correlation with yield. These results are in consonance with Singh et al. [37], Ozer et al. [30], Katoch et al. [41], Kibar et al. [42], and Biswal et al. [43].
The main aim of any breeding program is to increase the productivity of the crop. An increase in productivity can be achieved in the quickest possible time only through heterosis breeding, which is feasible in cabbage [18]. Standard heterosis is a phenomenon in which an F1 hybrid of two genetically dissimilar parents shows superiority over the standard or commercial variety, which is often included in the trial as a check variety. The superior hybrids over the checks for yield and other characters can be exploited further in breeding programs for improving such important quantitative and qualitative traits [19]. Heterosis breeding has been significant in improving yield and its component qualities in both self-pollinated and cross-pollinated plants. Contrary to the stable evidence demonstrating the superiority of heterozygotes in cross-pollinated species, the evidence for inbreeding species has been inconsistent. In terms of yield, maximum significant positive heterosis over both the standard checks, viz., Pusa Hybrid-81 and Pusa Cabbage-1, was exhibited by UHF-CAB-HYB-1 in all the environments. The presence of substantial positive desirable heterosis for yield in cabbage had also been reported by Singh et al. [37], Kutty et al. [39], and Impa et al. [44].

5. Conclusions

In the conclusion, the investigation suggested that net head weight was the most key attribute among the tested yield component traits in cabbage due to its strong and positive correlation as well as a high direct impact on yield kg per hectare. Correlation and path analysis studies indicated that yield had a significant positive association with net head weight, gross head weight, harvest index, head compactness, and total soluble solids. Selection of these traits would be fruitful for tailoring novel genotypes with superiority over environments. As a result, to maximize the production of cabbage, the variables total net head weight, gross head weight, and harvest index must be prioritized. These studies are essential for determining the essential characteristics that, especially under different environmental circumstances, increase cabbage’s production, adaptability, and economic worth. On the basis of heterosis studies, hybrids UHF-CAB-HYB-1, UHF-CAB-HYB-2, UHF-CAB-HYB-6, and UHF-CAB-HYB-7 exhibited desirable heterosis over standard checks in different locations. The purpose of the standard heterosis estimation in this study was to find the best hybrids of cabbage in different locations with a high degree of usable heterosis for head yield and other yield-attributing characteristics for their prospects for future usage in cabbage breeding programs.

Supplementary Materials

The following supporting information can be downloaded at: https://www.mdpi.com/article/10.3390/horticulturae11060606/s1, Table S1: Analysis of variance for different characters over the environment in cabbage hybrids, Table S2: Estimates of standard heterosis for days to 50 per cent marketable maturity and number of non-wrapper leaves, Table S3: Estimates of standard heterosis for plant spread and gross head weight (g), Table S4: Estimates of standard heterosis for polar diameter of head and equatorial diameter of head, Table S5: Estimates of standard heterosis for stalk length (cm) and core length (cm), Table S6: Estimates of standard heterosis for total soluble solids (°B) and ascorbic acid (mg/100 g), Table S7: Mean monthly meteorological data during the field experiments periods at UHF, Nauni, Solan, HP, India, Table S8: Mean monthly meteorological data during the field experiments periods at RHR&TS, Dhaualkuan, HP, India, Table S9: Mean monthly meteorological data during the field experiments periods at RHR&TS, Bajaura, Kullu, HP, India.

Author Contributions

Conceptualization, S.S.P., A.V., R.K.D. and R.K.; methodology, S.S.P.; software, S.S.P.; validation, S.S.P. and R.K.S.; formal analysis, S.S.P.; investigation, S.S.P.; resources, S.S.P. and A.S.; data curation, S.S.P., A.S., K.G., M.G., J.R.S. and R.K.S.; writing—original draft preparation, S.S.P., A.S., K.G., J.R.S. and R.K.S. writing—review and editing, S.S.P.; visualization, S.S.P.; supervision, S.S.P.; project administration, S.S.P. All authors have read and agreed to the published version of the manuscript.

Funding

This research received no external funding.

Data Availability Statement

Data available on reasonable request from corresponding authors.

Acknowledgments

Support to authors by CITAB, Inov4Agro, Universidadede Trás-os-Montes e Alto Douro (UTAD), National Funds by FCT-Portuguese Foundation for Science and Technology, under the projects UI/04033 And LA/P/0126/2020 (https://doi.org/10.54499/LA/P/0126/2020) is gratefully acknowledged.

Conflicts of Interest

The authors declare no conflicts of interest.

References

  1. Yue, Z.; Zhang, G.; Wang, J.; Wang, J.; Luo, S.; Zhang, B.; Liu, Z. Comparative Study of the Quality Indices, Antioxidant Substances, and Mineral Elements in Different Forms of Cabbage. BMC Plant Biol. 2024, 24, 187. [Google Scholar] [CrossRef]
  2. Liu, S.; Liu, Y.; Yang, X.; Chaobo, T.; David, E. The Brassica oleracea Genome Reveals the Asymmetrical Evolution of Polyploid Genomes. Nat. Commun. 2014, 5, 3930. [Google Scholar] [CrossRef] [PubMed]
  3. Samec, D.; Pavlovic, I.; Salopek-Sondi, B. White Cabbage (Brassica oleracea L. var. capitata f. alba L.): Botanical, Phytochemical, and Pharmacological Overview. Phytochem. Rev. 2017, 16, 117–135. [Google Scholar] [CrossRef]
  4. Liu, Z.; Alemán-Báez, J.; Visser, R.G.; Bonnema, G. Cabbage (Brassica oleracea var. capitata) Development in Time: How Differential Parenchyma Tissue Growth Affects Leafy Head Formation. Plants 2024, 13, 656. [Google Scholar] [CrossRef] [PubMed]
  5. Cervenski, J.; Gvozdanovic-Varga, J.; Glogovac, S. Variance Components and Correlations of Agronomic Traits Among Cabbage (Brassica oleracea L. var. capitata L.) Maturity Groups. Genetika 2012, 44, 55–68. Available online: https://doiserbia.nb.rs/Article.aspx?ID=0534-00121201055C (accessed on 1 January 2025). [CrossRef]
  6. Yamagishi, H.; Bhat, S.R. Cytoplasmic male sterility in Brassicaceae crops. Breed Sci. 2014, 64, 38–47. [Google Scholar] [CrossRef]
  7. Parkash, C.; Kumar, S.K.; Singh, R.; Kumar, A.; Kumar, S.; Dey, S.S.; Kumar, R. ‘Ogura’-Based ‘CMS’ Lines with Different Nuclear Backgrounds of Cabbage Revealed Substantial Diversity at Morphological and Molecular Levels. 3 Biotech 2018, 8, 27. [Google Scholar] [CrossRef]
  8. Verma, S.; Yashveer, S.; Rehman, S.; Gyawali, S.; Kumar, Y.; Chao, S.; Sarker, A.; Verma, R.P.S. Genetic and Agro-morphological diversity in global barley (Hordeum vulgare L.) collection at ICARDA. Genet. Resour. Crop Evol. 2021, 68, 1315–1330. [Google Scholar] [CrossRef]
  9. Faysal, A.S.M.; Ali, L.; Azam, M.G.; Sarker, U.; Ercisli, S.; Golokhvast, K.S.; Marc, R.A. Genetic Variability, Character Association, and Path Coefficient Analysis in Transplant Aman Rice Genotypes. Plants 2022, 11, 2952. [Google Scholar] [CrossRef]
  10. Yadav, A.K.; Kumar, A.; Grover, N.; Ellur, R.K.; Bollinedi, H.; Krishnan, S.G.; Bhowmick, P.K.; Vinod, K.K.; Nagarajan, M.; Singh, A.K. Genome-Wide Association Study Reveals Marker-Trait Associations for Early Vegetative Stage Salinity Tolerance in Rice. Plants 2021, 10, 559. [Google Scholar] [CrossRef]
  11. Usman, M.G.; Rafii, M.Y.; Martini, M.Y.; Oladosu, Y.; Kashiani, P. Genotypic Character Relationship and Phenotypic Path Coefficient Analysis in Chili Pepper Genotypes Grown Under Tropical Condition. J. Sci. Food Agric. 2017, 97, 1164–1171. [Google Scholar] [CrossRef]
  12. Khan, M.M.H.; Rafii, M.Y.; Ramlee, S.I.; Jusoh, M.; Al Mamun, M. Genetic Analysis and Selection of Bambara Groundnut (Vigna subterranea L. Verdc.) Landraces for High Yield Revealed by Qualitative and Quantitative Traits. Sci. Rep. 2021, 11, 7597. [Google Scholar] [CrossRef] [PubMed]
  13. Khan, M.M.H.; Rafii, M.Y.; Ramlee, S.I. Path-Coefficient and Correlation Analysis in Bambara Groundnut (Vigna subterranea L. Verdc.) Accessions Over Environments. Sci. Rep. 2022, 12, 245. [Google Scholar] [CrossRef] [PubMed]
  14. Wang, Z.; Zhang, Y.; Yan, L.; Chen, Y.; Ken, Y.; Huai, D.; Wang, X.; Jiang, H.; Lei, Y.; Liao, B. Correlation and Variability Analysis of Yield and Quality Related Traits in Different Peanut Varieties Across Various Ecological Zones of China. Oil Crop Sci. 2023, 8, 236–242. [Google Scholar] [CrossRef]
  15. Correa, E.; Malla, S.; Crosby, K.M.; Avila, C.A. Evaluation of Genotypes and Association of Traits in Watermelon Across Two Southern Texas Locations. Horticulturae 2020, 6, 67. [Google Scholar] [CrossRef]
  16. Chakraborty, N.R.; Lakshman, S.S.; Debnath, S.; Rahimi, M. Yield Stability and Economic Heterosis Analysis in Newly Bred Sunflower Hybrids throughout Diverse Agro-Ecological Zones. BMC Plant Biol. 2022, 22, 579. [Google Scholar] [CrossRef]
  17. Singh, S.; Kalia, P.; Mangal, M.; Prakash, V.; Parihar, B.R. Development of Ogura CMS Lines in Indian Cauliflower and Their Characterization Using Agro-Morphological Traits and mtDNA Markers. Sci. Hort. 2022, 291, 110589. [Google Scholar] [CrossRef]
  18. Fang, Z.; Liu, Y.; Lou, P.; Liu, G. Current Trends in Cabbage Breeding. J. New Seeds 2005, 6, 75–107. [Google Scholar] [CrossRef]
  19. Nedi, G.; Tulu, L.; Alamerew, S. Standard Heterosis of the Selected Maize (Zea mays L.) Inbred Line Hybrids for Grain Yield and Yield Components at Jimma, South West Oromia Region, Ethiopia. J. Biol. Agric. Healthc. 2017, 7, 51–58. [Google Scholar]
  20. Mogesse, W.; Zelleke, H.; Nigussie, M. Standard Heterosis for Grain Yield and Yield-Related Traits in Maize (Zea mays L.) Inbred Lines in Haramaya District, Eastern Ethiopia. East Afr. J. Sci. 2020, 14, 51–64. [Google Scholar]
  21. Selvakumar, R. A Textbook on Glaustas Olericulture; New Vishal Publications: New Delhi, India, 2014; 618p. [Google Scholar]
  22. Gomez, K.A.; Gomez, A.A. Statistical Procedures for Agricultural Research; Wiley & Sons Inc.: New York, NY, USA, 1984; p. 680. [Google Scholar]
  23. Liu, Z.; Jiang, J.; Ren, A.; Xu, X.; Zhang, H.; Zhao, T.; Jiang, X.; Sun, Y.; Li, J.; Yang, H. Heterosis and combining ability analysis of fruit yield, early maturity, and quality in tomato. Agronomy 2021, 11, 807. [Google Scholar] [CrossRef]
  24. Wright, S. The theory of path coefficients a reply to Niles’s criticism. Genetics 1923, 8, 239. [Google Scholar] [CrossRef] [PubMed]
  25. Dewey, D.R.; Lu, K.H. A Correlation and Path Coefficient Analysis of Components of Crested Wheat Grass Seed Population. Agron. J. 1959, 51, 515–518. [Google Scholar] [CrossRef]
  26. Falconer, D.S.; Mackay, T.F.C. Introduction to Quantitative Genetics, 4th ed.; Longman: London, UK, 1996. [Google Scholar]
  27. Allard, R.W. Principles of Plant Breeding; John Wiley & Sons: Hoboken, NJ, USA, 1999. [Google Scholar]
  28. Sharma, K.C. Genetic Variability, Character Association and Path Analysis in Exotic Lines of Cabbage under Mid-Hill, Sub-Humid Conditions of Himachal Pradesh. J. Hill Agric. 2010, 1, 146–150. [Google Scholar]
  29. Sharma, P.; Singh, S.P.; Dogra, B.S.; Rani, R.; Verma, A. Assessment of genetic variability, correlation and path analysis studies in cabbage (Brassica oleracea) under low hill conditions of Himachal Pradesh. Indian J. Agric. Sci. 2023, 93, 1375–1379. [Google Scholar] [CrossRef]
  30. Ozer, M.O.; Kar, H.; Bekar, N.K.; Dogru, S.M.; Beşirli, G.; Sönmez, İ. Correlation, genetic variability, heritability and genetic advance for some morphological traits in red cabbage lines (Brassica oleracea L. var. capitata subvar. rubra). J. Agric. Fac. Gaziosmanpaşa Univ. 2023, 40, 58–65. [Google Scholar]
  31. Chittora, A.; Singh, D.K. Genetic variability studies in early cauliflower (Brassica oleracea var. botrytis L.). Elec. J. Plant. Breed. 2015, 6, 842–847. [Google Scholar]
  32. Dey, S.S.; Bhatia, R.; Sharma, S.; Sharma, K.; Kumar, R.; Sharma, V.K.; Parkash, C. Genetic divergence and interaction among CUPRAC, FRAP and total phenolics content in cauliflower (Brassica oleracea var. botrytis L.). Indian. J. Gen. Plant Breed. 2015, 75, 79–85. [Google Scholar] [CrossRef]
  33. Chittora, A.; Sıngh, D.K.; Kaushal, A. Genetic variability, heritability and genetic advance in early maturing cauliflower. Ann. Plant Soil Res. 2016, 18, 251–256. [Google Scholar]
  34. Wudneh, A.Y. Genetıc variability, heritability and genetic advance for vegetable yield and its component traits in ethıopıan kale (Brassica carinata A.). Inter. J. Plant Breed. Crop Sci. 2020, 7, 946–952. [Google Scholar]
  35. Soni, S.; Kumar, S.; Maji, S. Correlation and Path Coefficient Analysis Studies for the Yield and Its Traits in Cabbage (Brassica oleracea L. var. capitata L.). Ann. Hortic. 2013, 6, 331–336. [Google Scholar]
  36. Thakur, H.V. Combining Ability, Gene Action and Heterosis Studies Involving SI and CMS Lines and Testers in Cabbage. Green Farming 2016, 7, 580–585. [Google Scholar]
  37. Singh, B.; Mishra, A.K.; Sanwal, S.K.; Singh, P.K.; Rai, M. Genetic Variability and Character Association Analysis in Cabbage Hybrids. Indian J. Hortic. 2013, 70, 296–299. [Google Scholar]
  38. Milatovic, D.D.; Nikolic, D.D. Variability, heritability and correlations of some factors affecting productivity in peach. Hortic. Sci. 2010, 37, 79–87. [Google Scholar] [CrossRef]
  39. Kutty, C.N.; Sreelatha, U.; Prameela, K.P. Variance components and correlation of economic traits in tropical cabbage (Brassica oleracea L. var. capitata L.). Indian J. Agric. Sci. 2017, 87, 240–244. [Google Scholar] [CrossRef]
  40. Ahmet, B.; Yanmaz, R.; Apaydin, A.; Kar, H. Morphological Characterization of White Head Cabbage (Brassica oleracea var. capitata subvar. alba) Genotypes in Turkey. N. Z. J. Crop Hortic. Sci. 2010, 33, 75–107. [Google Scholar]
  41. Katoch, V.; Shiwani, K.; Sharma, A.; Kumari, V. Correlation and Path Coefficient Analysis in Sprouting Broccoli (Brassica oleracea L. var. italica L.). Indian J. Agric. Sci. 2014, 84, 49–57. [Google Scholar] [CrossRef]
  42. Kibar, B.; Karaagac, O.; Kar, H. Heterosis for Yield-Contributing Head Traits in Cabbage (Brassica oleracea L. var. capitata L.). Sci. Investig. Agrar. 2015, 42, 205–216. [Google Scholar] [CrossRef]
  43. Biswal, P.P.; Verma, A.; Sharma, D. To Assess Association Correlation in Mid-Season Cauliflower (Brassica oleracea L. var. botrytis L.). Pharma Innov. J. 2022, 11, 1827–1829. [Google Scholar]
  44. Impa, H.R.; Kumar, R.; Dogra, R.K. Estimation of Mean Performance and Heterosis in Cytoplasmic Male Sterility (CMS)-Based Hybrids in Cabbage. Crop Breed. Appl. Biotechnol. 2023, 23, 43802313. [Google Scholar] [CrossRef]
Figure 1. General view of experimental farms. (a) The experimental farm of Department of Vegetable Science, Dr YS Parmar University of Horticulture and Forestry, Nauni, Solan (HP), (b) the experimental farm of Regional Horticultural Research and Training Station, Dhaulakuan, Sirmour (HP), (c) the experimental farm of Regional Horticulture Research and Training Station, Bajaura, Kullu (HP).
Horticulturae 11 00606 g001
Figure 2. The correlation relationships between different traits.
Horticulturae 11 00606 g002
Table 1. Details of the hybrids used in the study.
Sr. No.HybridsMorphological Characters
1.UHF-CAB-HYB-1Spherical, Green
2.UHF-CAB-HYB-2Spherical, Green
3.UHF-CAB-HYB-3Spherical, Green
4.UHF-CAB-HYB-4Spherical, Light green
5.UHF-CAB-HYB-5Spherical, Light green
6.UHF-CAB-HYB-6Spherical, Green
7.UHF-CAB-HYB-7Spherical, Green
8.UHF-CAB-HYB-8Spherical, Green
9.Pusa Hybrid-81 (Check-1)Spherical, Green
10.Pusa Cabbage-1 (Check-2)Spherical, Green
Table 2. Environmental description of the experimental sites.
LocationLatitudeLongitudeAltitude (MSL)Av Temp (°C)Av Hum (%)Rainfall (mm)
2021
Location I30°5″ N77°80″ E127024.90–7.0655.5625.4
Location II30°30′20″ N77°20′30″ E46826.35–14.6672.877.06
Location III32.8° N74.7° E109023.91–3.7062.7125.85
2022
Location I30°5″ N77°80″ E127023.02–7.5758.632.96
Location II30°30′20″ N77°20′30″ E46824.50–13.8048.6555.35
Location III32.8° N74.7° E109022.72–5.6163.4239
Location I: The experimental farm of Department of Vegetable Science, Dr YS Parmar University of Horticulture and Forestry, Nauni, Solan (HP). Location II: The experimental farm of Regional Horticultural Research and Training Station, Dhaulakuan, Sirmour (HP). Location III: The experimental farm of Regional Horticulture Research and Training Station, Bajaura, Kullu (HP).
Table 3. Estimation of the percentage of phenotypic and genotypic coefficient of variation, heritability, and genetic advance for different quantitative traits.
Response VariableSEDGCVPCVHeritabilityGen-Adv % Means
YIELD1.039.2910.1683.6317.51
DTFMM3.778.679.0092.7517.20
NWL1.035.967.6660.669.57
PLS3.092.074.0026.862.21
GHW76.734.575.4570.457.91
NHW51.7111.2512.1286.1221.50
HC4.4216.1217.6683.3230.31
HI4.469.0710.8070.4815.68
PD1.033.325.9531.213.83
ED1.043.655.9038.224.64
SL0.343.506.1831.984.07
CL0.309.9810.9283.5518.79
TSS0.414.505.1277.028.13
AA0.6312.9813.0898.4126.53
where, DTFMM = days to fifty percent marketable maturity, NWL = number of non-wrapper leaves, PS = plant spread, GHW = gross head weight, NHW = net head weight, HC = head compactness, HI = harvest index, PD = polar diameter of head, ED = equatorial diameter of head, HSI = head shape index, SL= stalk length, CL = core length, TSS = total soluble solid and AA= ascorbic acid.
Table 4. Estimation of environmental correlation.
YieldDTFMMNWLPLSGHWNHWHCHIPDEDSLCLTSSAA
Yield1.00
DTFMM−0.041.00
NWL0.06−0.031.00
PLS0.02−0.280.041.00
GHW−0.360.090.070.271.00
NHW0.57 **0.22−0.24−0.15−0.111.00
HC0.48 **0.410.110.15−0.140.59 **1.00
HI0.360.41−0.21−0.26−0.63 **0.84 **0.53 **1.00
PD−0.34−0.23−0.11−0.210.350.11−0.31−0.111.00
ED−0.58 **0.13−0.34−0.220.070.19−0.230.110.47 **1.00
SL0.09−0.120.150.280.070.160.400.100.02−0.151.00
CL−0.310.08−0.10−0.31−0.460.17−0.150.39−0.070.240.271.00
TSS−0.070.390.11−0.220.240.180.160.020.150.430.09−0.041.00
AA0.11−0.290.240.080.240.04−0.14−0.110.24−0.070.06−0.06−0.011.00
** Significant at 5% level of significance (p ≤ 0.05). Where DTFMM = days to fifty percent marketable maturity, NWL = number of non-wrapper leaves, PS = plant spread, GHW = gross head weight, NHW = net head weight, HC = head compactness, HI = harvest index, PD = polar diameter of head, ED = equatorial diameter of head, HSI = head shape index, SL= stalk length, CL = core length, TSS= total soluble solid and AA= ascorbic acid.
Table 5. Correlation coefficients (above diagonal genotypic and below diagonal phenotypic correlation coefficients).
VariableYieldDTFMMNWLPLSGHWNHWHCHIPDEDSLCLTSSAA
Yield1.00−0.34−0.70 **−0.57 **0.72 **0.82 **0.56 **0.62 **0.030.170.37 **−0.180.54 **0.27
DTFMM−0.301.000.76 **1.19−0.08−0.48 **−0.49 **−0.54 **0.58 **−0.08−0.380.15−0.05−0.60 **
NWL−0.49 **0.57 **1.000.85 **−0.27−0.35−0.63 **−0.260.440.48 **−0.58 **0.14−0.25−0.34
PLS−0.270.53 **0.361.000.06−0.71 **−0.52 **−0.89 **0.88 **−0.40−0.96 **0.22−0.19−0.67 **
GHW0.47 **−0.05−0.150.151.000.56 **0.200.190.460.120.41−0.260.20−0.05
NHW0.73 **−0.37−0.31−0.380.411.000.59 **0.92 **−0.300.170.26−0.080.70 **0.61 **
HC0.55 **−0.38−0.42−0.190.120.59 **1.000.58 **−0.99 **−0.75 **−0.26−0.380.47 **0.68 **
HI0.56 **−0.37−0.25−0.50 **−0.050.89 **0.56 **1.00−0.55 **0.200.140.040.76 **0.76 **
PD−0.100.260.100.110.38−0.12−0.61 **−0.311.000.61 **0.390.42−0.29−0.84 **
ED−0.09−0.020.06−0.270.090.15−0.50 **0.150.52 **1.000.95 **0.35−0.17−0.27
SL0.22−0.23−0.18−0.080.220.190.020.110.130.231.000.430.29−0.10
CL−0.200.140.07−0.01−0.30−0.04−0.340.120.190.280.311.000.420.02
TSS0.420.01−0.14−0.180.210.61 **0.410.56 **−0.0807.00.180.331.000.65 **
AA0.25−0.58 **−0.24−0.34−0.020.57 **0.61 **0.62 **−0.44−0.18−0.050.010.56 **1.00
** Significant at 5% level of significance (p ≤ 0.05). Where DTFMM = days to fifty percent marketable maturity, NWL = number of non-wrapper leaves, PS = plant spread, GHW = gross head weight, NHW = net head weight, HC = head compactness, HI = harvest index, PD = polar diameter of head, ED = equatorial diameter of head, HIS = head shape index, SL = stalk length, CL = core length, TSS = total soluble solid and AA = ascorbic acid.
Table 6. Estimates of standard heterosis for net head weight (g).
HybridsE1E2E3E4E5E6E7E8E9
SC1SC2SC1SC2SC1SC2SC1SC2SC1SC2SC1SC2SC1SC2SC1SC2SC1SC2
UHF-CAB-HYB-1 45.82 *22.84 *28.85 *30.61 *14.50 *25.41 *29.69 *23.64 *18.57 *21.47 *26.62 *12.30 *29.39 *52.20 *21.63 *26.00 *51.15 *33.62 *
UHF-CAB-HYB-227.57 *7.47 *4.696.121.7511.44 *5.470.55−5.79−3.498.63 *−3.66−2.4814.71 *−1.462.0717.25 *3.65
UHF-CAB-HYB-323.72 *4.23−3.54−2.220.4710.04 *−3.87−8.36 *−5.14−2.82−1.86−12.96 *−13.93 *1.25−15.13 *−12.09 *0.88−10.82 *
UHF-CAB-HYB-426.82 *6.84 *−0.211.155.6915.76 *−12.81 *−16.88 *−17.62 *−15.61 *−3.52−14.44 *−17.64 *−3.12−9.50 *−6.25−0.21−11.78 *
UHF-CAB-HYB-512.24 *−5.445.196.62−8.52 *0.19−1.97−6.55−8.94 *−6.71 *−3.36−14.29 *−19.88 *−5.75−20.34 *−17.48 *−4.51−15.58 *
UHF-CAB-HYB-621.43 *2.3017.07 *18.67 *−21.49 *−14.01 *2.25−2.52−2.71−0.338.46 *−3.80−4.1312.77 *−5.93−2.5620.46 *6.49
UHF-CAB-HYB-723.94 *4.41−2.65−1.32−5.053.99−9.76 *−13.98 *−20.81 *−18.87 *−2.06−13.13 *−16.01 *−1.20−12.82 *−9.69 *4.72−7.43
UHF-CAB-HYB-8−5.38−20.29 *11.10 *12.62 *−19.18 *−11.48 *9.10 *4.01−2.81−0.4412.59 *−0.14−8.46 *7.68 *−11.62 *−8.45 *9.54−3.17
* Significant at 5% level of significance (p ≤ 0.05). SC1 = Pusa Hybrid-81. SC2 = Pusa Cabbage-1.
Table 7. Estimates of standard heterosis for head compactness (g/cm3).
Sr. No.HybridsE1E2E3E4E5E6E7E8E9
SC1SC2SC1SC2SC1SC2SC1SC2SC1SC2SC1SC2SC1SC2SC1SC2SC1SC2
1UHF-CAB-HYB-1 40.25 *18.97 *15.17 *31.43 *27.00 *41.94 *29.58 *14.83 *16.64 *19.41 *10.43 *1.626.5041.65 *9.94 *23.79 *25.64 *29.75 *
2UHF-CAB-HYB-215.85 *−1.73−2.7710.965.4117.82 *6.28−5.82−2.75−0.456.82−1.70−20.14 *6.21−13.64 *−2.768.2211.76
3UHF-CAB-HYB-326.26 *7.10−14.67 *−2.624.8917.23 *−8.68−19.08 *−14.77 *−12.76 *−17.30 *−23.89 *−20.20 *6.13−20.56 *−10.55 *−20.12 *−17.51 *
4UHF-CAB-HYB-424.48 *5.59−2.2111.60 *18.94 *32.94 *−5.70−16.43 *−7.05−4.85−0.17−8.13−25.58 *−1.01−14.34 *−3.55−2.191.01
5UHF-CAB-HYB-510.08−6.639.6025.08 *−3.757.57−7.53−18.06 *−19.20 *−17.29 *−16.11 *−22.81 *−13.11 *15.56 *−33.91 *−25.58−20.12 *−17.51 *
6UHF-CAB-HYB-61.32−14.05 *8.8824.25 *−6.484.52−5.34−16.12 *−9.20 *−7.05−8.21−15.53 *−3.4928.37 *−17.66 *−7.28−2.021.18
7UHF-CAB-HYB-710.23−6.50−16.41 *−4.6021.79 *36.12 *−10.57 *−20.75 *−18.21 *−16.27 *−5.83−13.34 *−15.69 *12.14−16.95 *−6.49−7.08−4.05
8UHF-CAB-HYB-8−13.64 *−26.74 *0.5014.69 *−20.54 *−11.18 *16.19 *2.96−2.55−0.254.33−3.995.9140.86 *−20.40 *−10.38−1.511.71
* Significant at 5% level of significance (p ≤ 0.05). SC1 = Pusa Hybrid-81. SC2 = Pusa Cabbage-1.
Disclaimer/Publisher’s Note: The statements, opinions and data contained in all publications are solely those of the individual author(s) and contributor(s) and not of MDPI and/or the editor(s). MDPI and/or the editor(s) disclaim responsibility for any injury to people or property resulting from any ideas, methods, instructions or products referred to in the content.

