Article

Insights into the Underlying Mechanism of the Piriformospora indica-Enhanced Drought Tolerance in Blueberry

College of Horticulture, Shanxi Agricultural University, Taigu 030801, China
*
Author to whom correspondence should be addressed.
Horticulturae 2025, 11(6), 605; https://doi.org/10.3390/horticulturae11060605
Submission received: 16 April 2025 / Revised: 20 May 2025 / Accepted: 28 May 2025 / Published: 29 May 2025
(This article belongs to the Special Issue New Insights into Protected Horticulture Stress)

Abstract

:
Piriformospora/Serendipita indica has been frequently proved to play a crucial role in enhancing plant adaptation to environmental stresses. However, its influence on blueberry (Vaccinium corymbosum) drought tolerance has not yet been studied. Here, we reported that P. indica colonization can significantly enhance the drought tolerance of blueberry. Physio-biochemical parameter determination results showed that, compared to non-colonized controls (CK), P. indica-colonized (PI) plants exhibited higher leaf chlorophyll and carotenoids contents, photosynthetic capacity, biomass and root antioxidant enzyme activities (superoxide dismutase and catalase), while also exhibiting lower root malondialdehyde content under drought stress (DS). To explore the underlying mechanism, comparative root transcriptome analysis of well-watered (WW) and DS-treated CK and PI blueberry plants was conducted. In total, we identified 14,587 differentially expressed genes (DEGs) across CK-WW vs. CK-DS, PI-WW vs. PI-DS, CK-WW vs. PI-WW and CK-DS vs. PI-DS comparisons. Under DS, stress-, metabolism- and regulation-related DEGs were overwhelmingly upregulated in PI, while being downregulated in CK. Weighted gene co-expression network analysis categorized DEGs into four modules. Of them, the MEblack module was significantly correlated with the PI-DS group, with DEGs enriched in the cell wall macromolecule catabolic process, carbohydrate metabolic process, phenylpropanoid biosynthesis, and so on. Several defense-related genes, including four thaumatin family proteins, were identified as hub genes of this module. DEGs in the MEblue module were expressed at the highest level in CK-DS, followed by in PI-DS. Hub genes of the MEblue module included DEG-encoding lipid transfer protein, abscisic stress ripening protein, and so on. This study demonstrates that P. indica enhances blueberry drought tolerance by enhancing antioxidant ability and mediating the expression of genes related to stress, carbohydrate and secondary metabolism, and cell wall metabolism.

1. Introduction

The blueberry (Vaccinium corymbosum L.) is a new and popular fruit crop belonging to the genus Vaccinium of family Ericaceae [1,2]. Its fruits are rich in diverse nutrients, including anthocyanins, mineral elements, vitamins, and so on, making them possess excellent nutritional and health benefits [2,3]. Blueberry roots are shallow and hairless, making the water and nutrient uptake ability of blueberry plants very weak, especially under drought conditions [4]. In recent years, with global climate change, drought events have become increasingly frequent and severe, posing a significant threat to the blueberry industry [5,6]. To enhance the drought tolerance of blueberry plants, scientists have conducted extensive research. Evidence revealed that abscisic acid (ABA) and methyl jasmonate can improve the drought tolerance of blueberry plants by enhancing water retention, mitigating oxidative stress, and promoting enzymatic antioxidant activities [7]. Exogenous spermidine application can increase the relative water content, chlorophyll content and photosynthetic rate, enhance superoxide dismutase (SOD) and peroxidase (POD) activities, and reduce electrolyte leakage and accumulations of malondialdehyde (MDA), soluble sugar, and ABA, thereby alleviating the negative effects of drought on blueberry plants [8]. Melatonin can enhance the drought tolerance of blueberry plants by influencing photosynthetic capacity and the antioxidant system [4]. Fertilizers containing seaweed extracts can also mitigate the adverse effects of several abiotic stresses, including drought, on blueberry plants [9].
In nature, blueberry roots form symbiotic relationships with mycorrhizal fungi, which compensate for their low water and nutrient absorption ability caused by the absence of root hair [10]. Evidence revealed that inoculations of growth-promoting microorganisms can enhance the stress tolerance of blueberry plants [11,12]. The inoculation of Penicillium chrysogenum and P. brevicompactum, two endophytic fungi isolated from Antarctic plants, greatly enhances the drought tolerance of blueberry plants through improving water potential, and strengthening the SOD and POD activities [11]. Inoculating blueberry plants with the growth-promoting dark septate endophyte fungus R16 (Dothideomycetes sp., isolated from blueberry roots) enhanced the drought tolerance of blueberry plants by modulating phytohormones and non-structural carbohydrates metabolisms [13].
Piriformospora/Serendipita indica, a cultivable arbuscular mycorrhizal fungi like (AMF-like) fungus, is characterized by its thick-walled, pear-shaped chlamydospores [14]. Like AMF, it promotes host plant growth, nutrient uptake, fruit quality and yield, and enhances the plants’ resistance to various biotic and abiotic stresses [15]. Unlike AMF, P. indica can grow on semi-synthetic or synthetic media and can colonize plants that AMF cannot, such as plant members from the Brassicaceae family [16], which makes its application more convenient and greatly broadens its host range. P. indica was first discovered in the Thar Desert [14]. This habitat enables P. indica to have a high resistance to environmental stresses. Moreover, it can improve the tolerance of host plants to numerous abiotic stresses [15,16]. Studies have shown that P. indica colonization improves plant drought tolerance by increasing the relative water content, mediating accumulations of osmoregulatory substances and bioactive compounds, enhancing antioxidant capacity, and so on [17]. For instance, P. indica colonization greatly alleviates the drought-induced damages in eggplant by increasing relative water, proline (Pro) and total chlorophyll contents, and antioxidant enzyme activities in leaves [18]. In tomato plants, P. indica colonization alleviates drought damage by boosting relative water and Pro content [19]. In rice, P. indica colonization enhances plant drought tolerance by increasing catalase (CAT) and glutathione reductase (GR) activities and reducing malondialdehyde (MDA) content in leaves [20]. In soybeans, the fungal colonization significantly increases the relative water content in leaves, contents of Pro, glycine betaine, soluble sugar and soluble protein, and activities of antioxidant enzymes in leaves and roots, thereby improving drought tolerance [21]. Moreover, P. indica-colonized trifoliate orange [22], maize [23,24] barley [25], and walnut [26] plants also exhibit enhanced drought tolerance.
P. indica has been successfully applied in blueberry plants to improve plant growth and stress tolerance. Its colonization significantly increases the maximum and total shoot length of blueberry plants [27], promotes rooting of blueberry cuttings and growth of cuttings seedlings and seedlings [28], and enhances the resistance of highbush blueberry plants to Phytophthora cinnamomi [27]. However, so far, there has been no report on its influences on blueberry drought tolerance. In this study, we first investigated the effects of P. indica on the drought tolerance of blueberry plants. Furthermore, to clarify the underlying mechanism of the fungal colonization enhanced drought tolerance in blueberry, RNA-seq analysis of well-watered (WW) and drought stress (DS)-treated P. indica-colonized and non-colonized blueberry roots were conducted. This study will clarify the functional mechanism of the P. indica-enhanced blueberry drought tolerance and can provide a basis for future applications of this fungus in blueberry production.

2. Materials and Methods

2.1. Plant Materials and Treatments

The ‘Fuxing’ blueberry seedlings used in this study were purchased from Dalian Senmao Modern Agriculture Co., Ltd. (Dalian, China). According to the method described by Cheng et al. [29], P. indica inoculation solution was prepared. Three P. indica plugs (diameter = 5 mm) each were added into 250 mL of a sterilized potato dextrose broth (PDB) solution, and shake-cultured at 200 rpm in the dark for 3 days. Then, the obtained P. indica fermentation broth was diluted three times and used as the inoculation solution.
Blueberry plants were first divided into two groups: one group was subjected to P. indica inoculation (PI group) by soaking the roots in the inoculation solution for 2 h, and the other group was treated by soaking the roots in a PDB solution that was diluted three times using sterile water (CK group). After the treatment, seedlings were transplanted into nutrient soil in pots (diameter = 15 cm, height = 11.5 cm). To ensure fungal colonization, the inoculation solution was added to the nutrient soil weekly, four times total. Simultaneously, CK plants were watered using equal-volume diluted PDB solution. Blueberry plants were grown in a 25 ± 2 °C chamber (with 60–80% relative humidity and a photoperiod of 16 h light (1500 lx)/8 h dark).

2.2. PCR Detection of P. indica Colonization in Blueberry Roots

One month post inoculation, the colonization of P. indica in blueberry roots was detected using PCR [30]. By using Plant Genomic DNA Kit (Cat# GDP304) (Tiangen, Beijing, China), genomic DNA was isolated from the roots of P. indica-inoculated and some non-inoculated blueberry plants and used as a template for PCR detection. The 20 μL PCR system contains 10.0 μL Dream Taq™ Green PCR Master Mix (2×), 7.0 μL ddH2O, 1 μL cDNA, and 1 μL each forward and reverse P. indica Pitef1-specific primers [30]. Amplification was carried out as follows: 95 °C for 5 min; 35 cycles of 95 °C for 30 s, 60 °C for 30 s, 72 °C for 1 min; and 72 °C for 10 min. After PCR detection, non-inoculated CK plants and PCR positive PI plants were divided into well-watered (CK-WW and PI-WW) and no watering (drought stress (DS), CK-DS and PI-DS) groups. Each group contained at least six blueberry plants. After one week of drought treatment, blueberry leaves and roots were collected for further analysis.

2.3. Measurement of Photosynthetic Parameters, and Chlorophyll and Carotenoids Contents in Blueberry Leaves

A portable gas exchange system (LI-6400, Li-Cor, Inc., Lincoln, NE, USA) [31] was used to measure photosynthetic parameters and chlorophyll fluorescence parameters in blueberry leaves from different groups. For each parameter, at least six replications were made.
For the measurements of chlorophyll and carotenoids contents in blueberry leaves, samples were ground into a fine powder in liquid nitrogen, and added into acetone containing 0.1% butylated hydroxytoluene. After ultrasonic extraction for 60 min, the mixture was centrifuged at 10,000 rpm for 15 min to collect supernatant. The absorbance values of the supernatant at wavelengths of 663 nm, 645 nm, and 450 nm were measured using a visible spectrophotometer (UV-1800, Max-analytical Instruments, Shanghai, China). The contents of chlorophyll a, chlorophyll b, total chlorophyll, and carotenoids were calculated according to Yang et al. [32].

2.4. Determinations of Root Activity and Antioxidant Ability Related Parameters

Root activities of CK-WW, PI-WW, CK-DS and PI-DS blueberry plants were detected by using the 2,3,5-tripheyl tetrazolium chloride (TTC) method [33]. A total of 0.5 g blueberry root samples were added into a 50 mL centrifuge tube containing 5 mL 0.4% TTC solution and 5 mL 0.1 mol/L Na2HPO4-NaH2PO4 (pH = 7.0), kept at 37 °C for 1 h, and added into 2 mL 1 mol/L H2SO4 to stop reactions. Roots were picked out and ground in a mortar with ethyl acetate to collect 10 mL of extract. Then, the absorbance at OD485 was detected and used for the calculation of the TTC reduction intensity [33]. The activities of superoxide dismutase (SOD), catalase (CAT), and peroxidase (POD), as well as the contents of malondialdehyde (MDA) and proline (Pro) in the roots, were determined using assay kits from Beijing Solarbio Technology Co., Ltd. (Beijing, China). All these parameters were determined with at least three replicates.

2.5. RNA-Seq Library Construction and Transcriptome Sequencing

By using a Trizol reagent (Invitrogen, Waltham, CA, USA), RNA was separately isolated from roots of the CK-WW, PI-WW, CK-DS, and PI-DS blueberry plants. High-quality root RNA samples were sent to Biomarker Technologies Co., Ltd. (Qingdao, China) for RNA-seq cDNA library construction and sequencing on the Illumina NovaSeq6000 platform. For each sample, three biological replications were made.

2.6. Identification and Enrichment Analysis of Differentially Expressed Genes (DEGs)

RNA-seq clean reads were mapped to the reference blueberry genome using Hisat2 [34]. The StringTie Reference Annotation Based Transcript (RABT) assembly method was used to construct and identify both known and novel genes from Hisat2 alignment results [35]. Gene counts in the 12 samples (three biological replicates for each group) were normalized into fragments per kilobase of exon per million mapped fragments (FPKM) using DESeq2 [36]. Differentially expressed genes (DEGs) were identified using the DESeq2_edgeR algorithm [36], with criteria of |log2(fold change, FC)| ≥ 1 and FDR < 0.01. Gene ontology (GO) and Kyoto Encyclopedia of Genes and Genomes (KEGG) enrichment analyses of DEGs were performed using the Biomarker Cloud Platform (https://www.biocloud.net/, accessed on 1 March 2024, q value < 0.05) and the online platform Microbial Bioinformatics Analysis and Visualization Cloud Platform (https://www.bioinformatics.com.cn/, accessed on 1 March 2024).

2.7. MapMan Annotation and Weighted Gene Co-Expression Network Analysis (WGCNA) of DEGs

All transcripts obtained by RNA-seq were functionally annotated online using Mercator v4.0 (https://www.plabipd.de/mercator_main.html, accessed on 9 March 2024). By using MapMan software (Version 3.5.1R2), DEGs involved in stress, metabolism, and regulation overviews were visualized.
WGCNA of DEGs from all the four comparisons was performed using the Biomarker Cloud Platform (https://www.biocloud.net/) under the following criteria: expression threshold > 1, module similarity threshold > 0.4, and a minimum of 30 genes for each module.

2.8. Quantitative Real-Time PCR Analysis

By using a polysaccharide and polyphenol plant total RNA extraction kit (DP441, Tiangen, Beijing, China), total RNA was extracted from roots of CK-WW, CK-DS, PI-WW, and PI-DS blueberry plants. The PrimeScript™ RT reagent kit and a gDNA Eraser (Perfect Real Time) kit (Takara, Dalian, China) were used for cDNA synthesis. By using Primer Premier 3 (https://bioinfo.ut.ee/primer3-0.4.0/, accessed on 1 April 2024), gene-specific primers for selected DEGs (including genes encoding peroxidases (PODs, POD1 and POD2), trehalose-phosphate phosphatase (TPP), thaumatin-like protein (TLP), FAD binding domain protein (FAD); lipid-transfer protein (LTP), WRKY transcription factor, abscisic stress ripening protein (ASR), and dehydration-responsive element-binding protein 1B-like (DREB1D)) were designed (Supplemental Table S1). The former eight genes were hub genes of one of the four WGCNA modules, and DREB1D was a homologous gene of known drought tolerance related DREB genes [37]. The 20 μL qRT-PCR reaction mixture included 1 μL blueberry root cDNA, 0.8 μL each of forward and reverse primers, 10 μL of TB Green Premix Ex TaqTM (Tli RNaseH Plus), 0.4 μL of ROX Reference Dye (Takara, Dalian, China), and 7 μL of ddH2O. Amplification was performed on a QuantStudio 3 real-time fluorescence quantitative PCR instrument (Applied Biosystems, Waltham, MA, USA). The reaction program was set as follows: 30 s at 95 °C for pre-denaturation; 45 cycles of 15 s at 95 °C for denaturation, 30 s at 60 °C for annealing, and 30 s at 72 °C for extension. By using GAPDH as the reference gene [38], the relative expression levels of DEGs were calculated using the 2−ΔΔCt method [28]. For each gene, three biological replications were made.

2.9. Statistic Analysis

All the data obtained in this study were statistically analyzed using SPSS Statistics 26 (IBM, Chicago, IL, USA). Difference significance of parameters or gene expression levels among different groups were analyzed at p < 0.05 level using SPSS Statistics 26 (IBM, Chicago, IL, USA). GraphPad Prism 8 was used for figure drawing.

3. Results

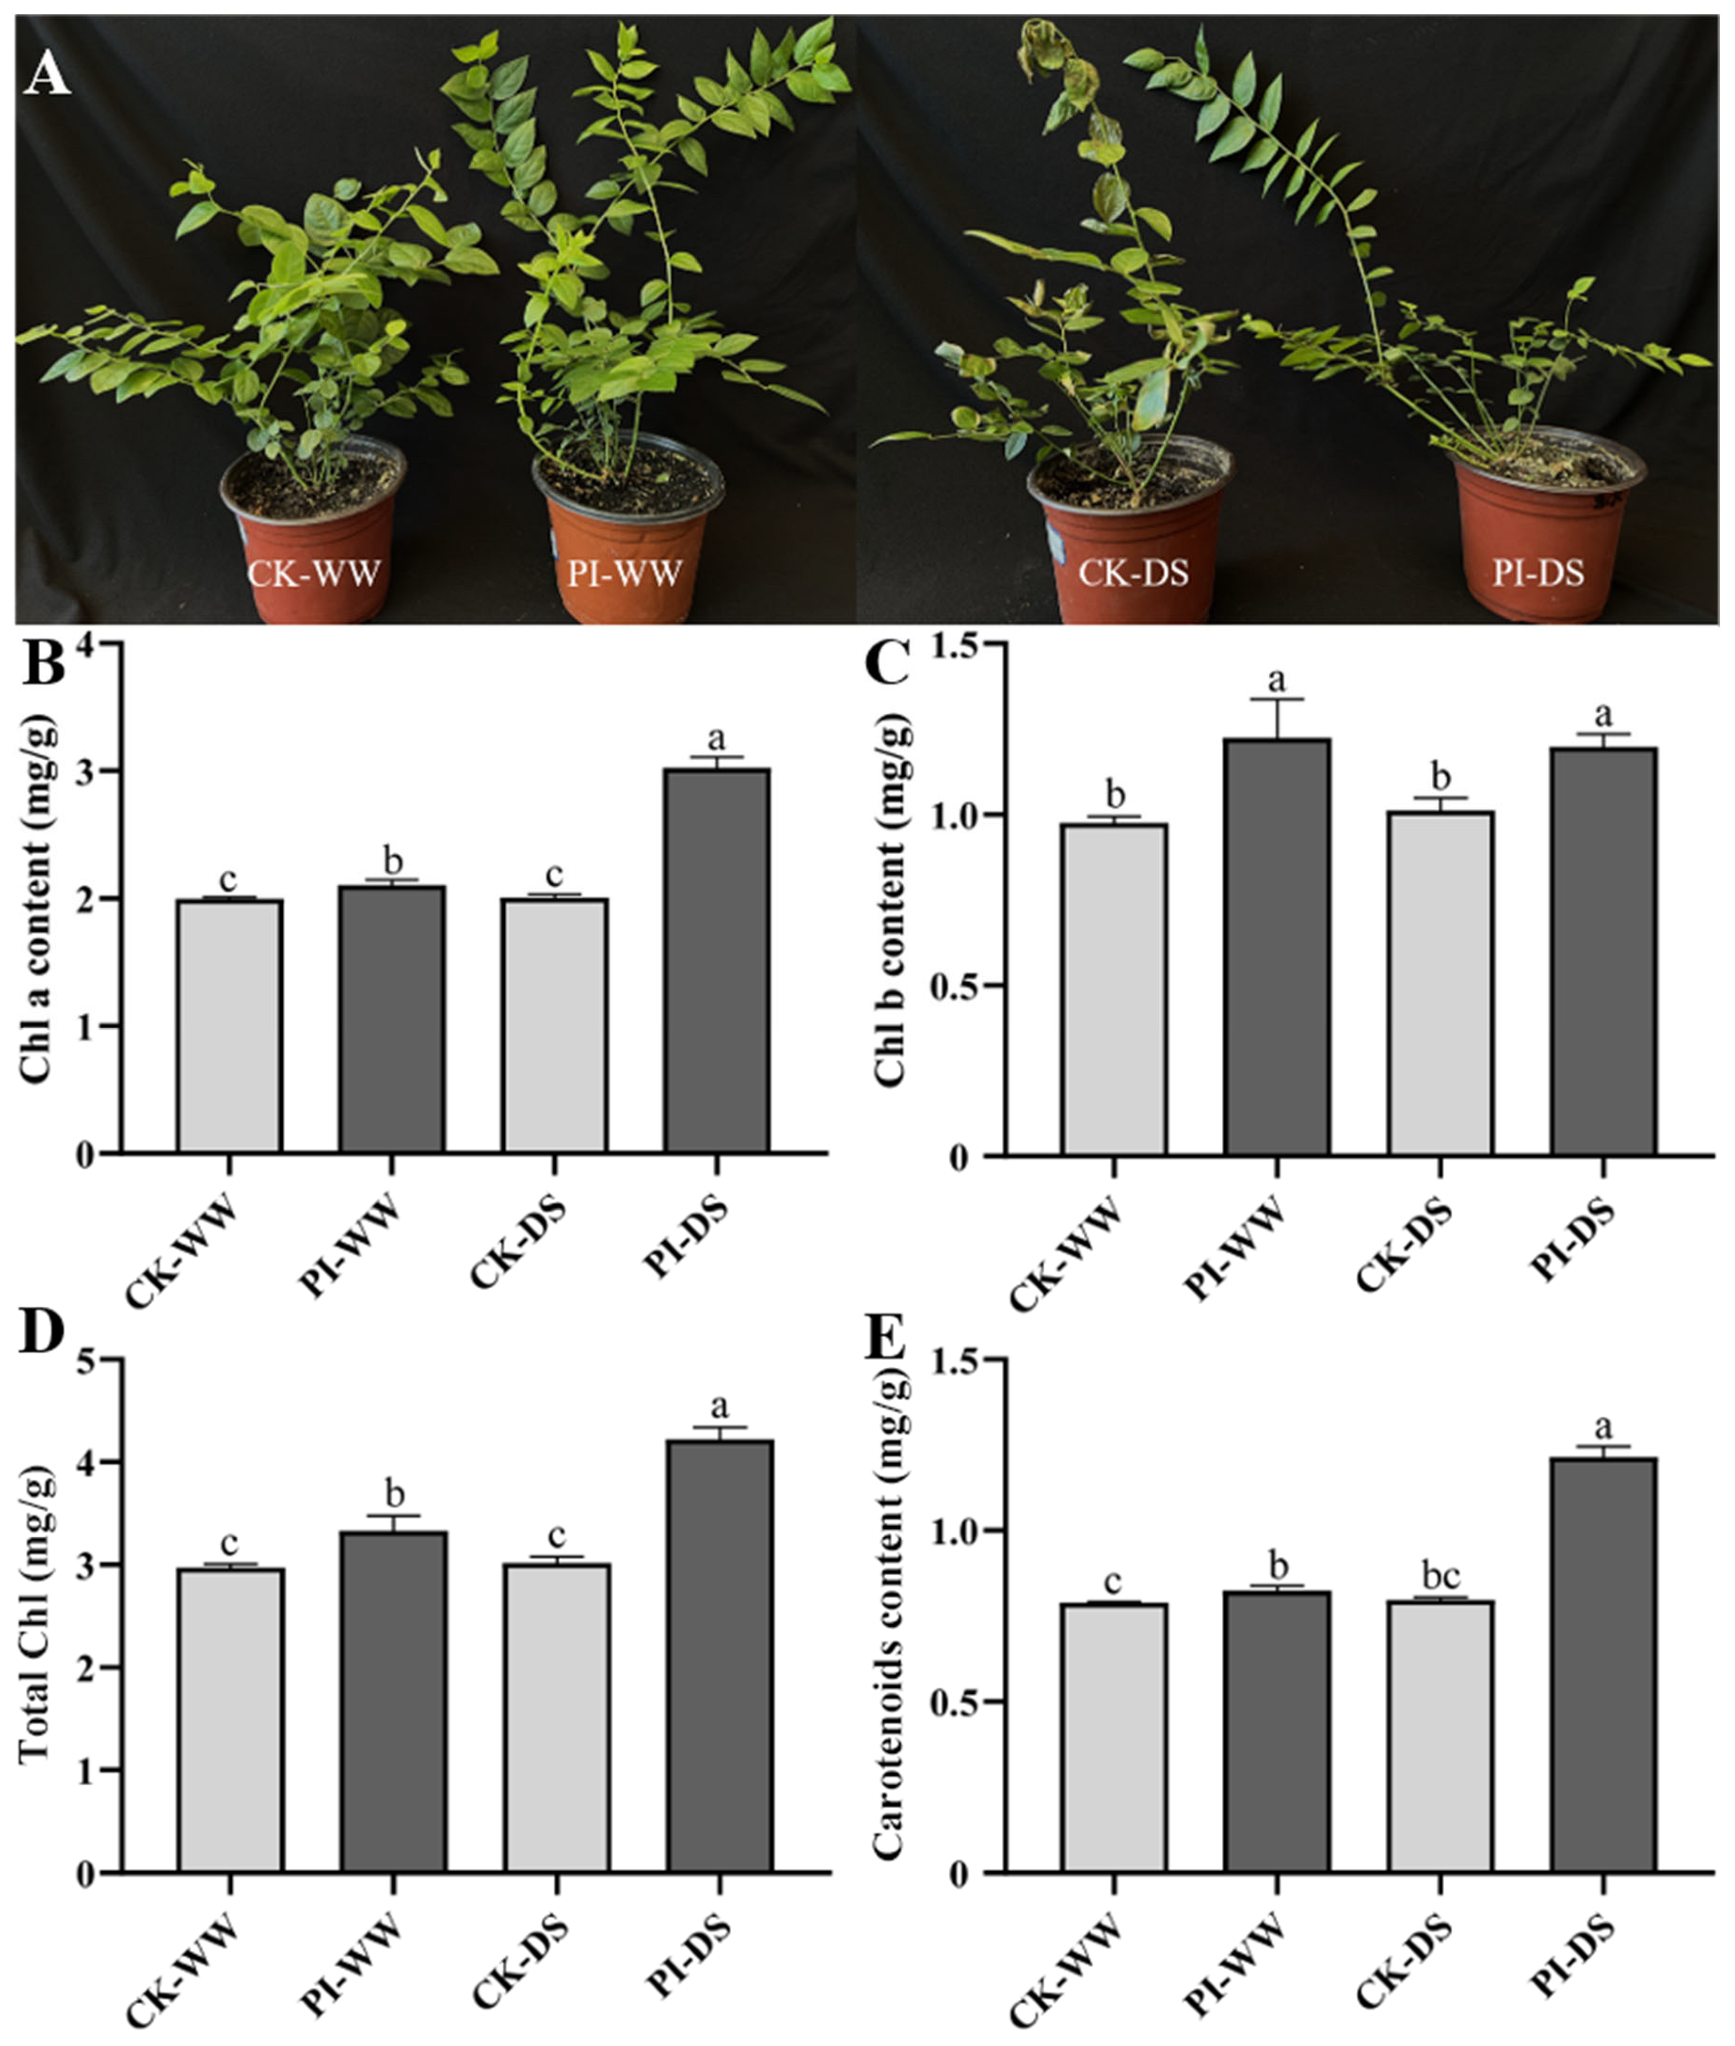
3.1. Influences of P. indica Colonization on Blueberry Drought Tolerance, Leaf Chlorophyll and Carotenoids Accumulations

PCR detection results showed that a 420 bp Pitef1 fragment was successfully amplified from blueberry roots inoculated with P. indica, indicating the successful colonization of P. indica (Supplemental Figure S1). After one week of DS treatment, non-colonized blueberry (CK) plants exhibited moderate wilting, while P. indica-colonized blueberry (PI) plants showed only slight wilting (Figure 1A). Moreover, CK plants had fewer green leaves, and more withered leaves than PI plants. These findings indicated that the fungal colonization improved the drought tolerance of blueberry plants.
The chlorophyll a, chlorophyll b, total chlorophyll, and carotenoid contents in the PI-WW group were significantly higher than those in the CK-WW group (p < 0.05), by 1.05-, 1.25-, 1.12-, and 1.04-fold, respectively. The PI-DS group had significantly higher levels of these pigments (p < 0.05), reaching 1.51-, 1.18-, 1.40-, and 1.52-fold of the CK-DS group (Figure 2B–E). These suggested that P. indica colonization alleviated the drought-caused suppression of chlorophyll and carotenoids accumulations in blueberry leaves.

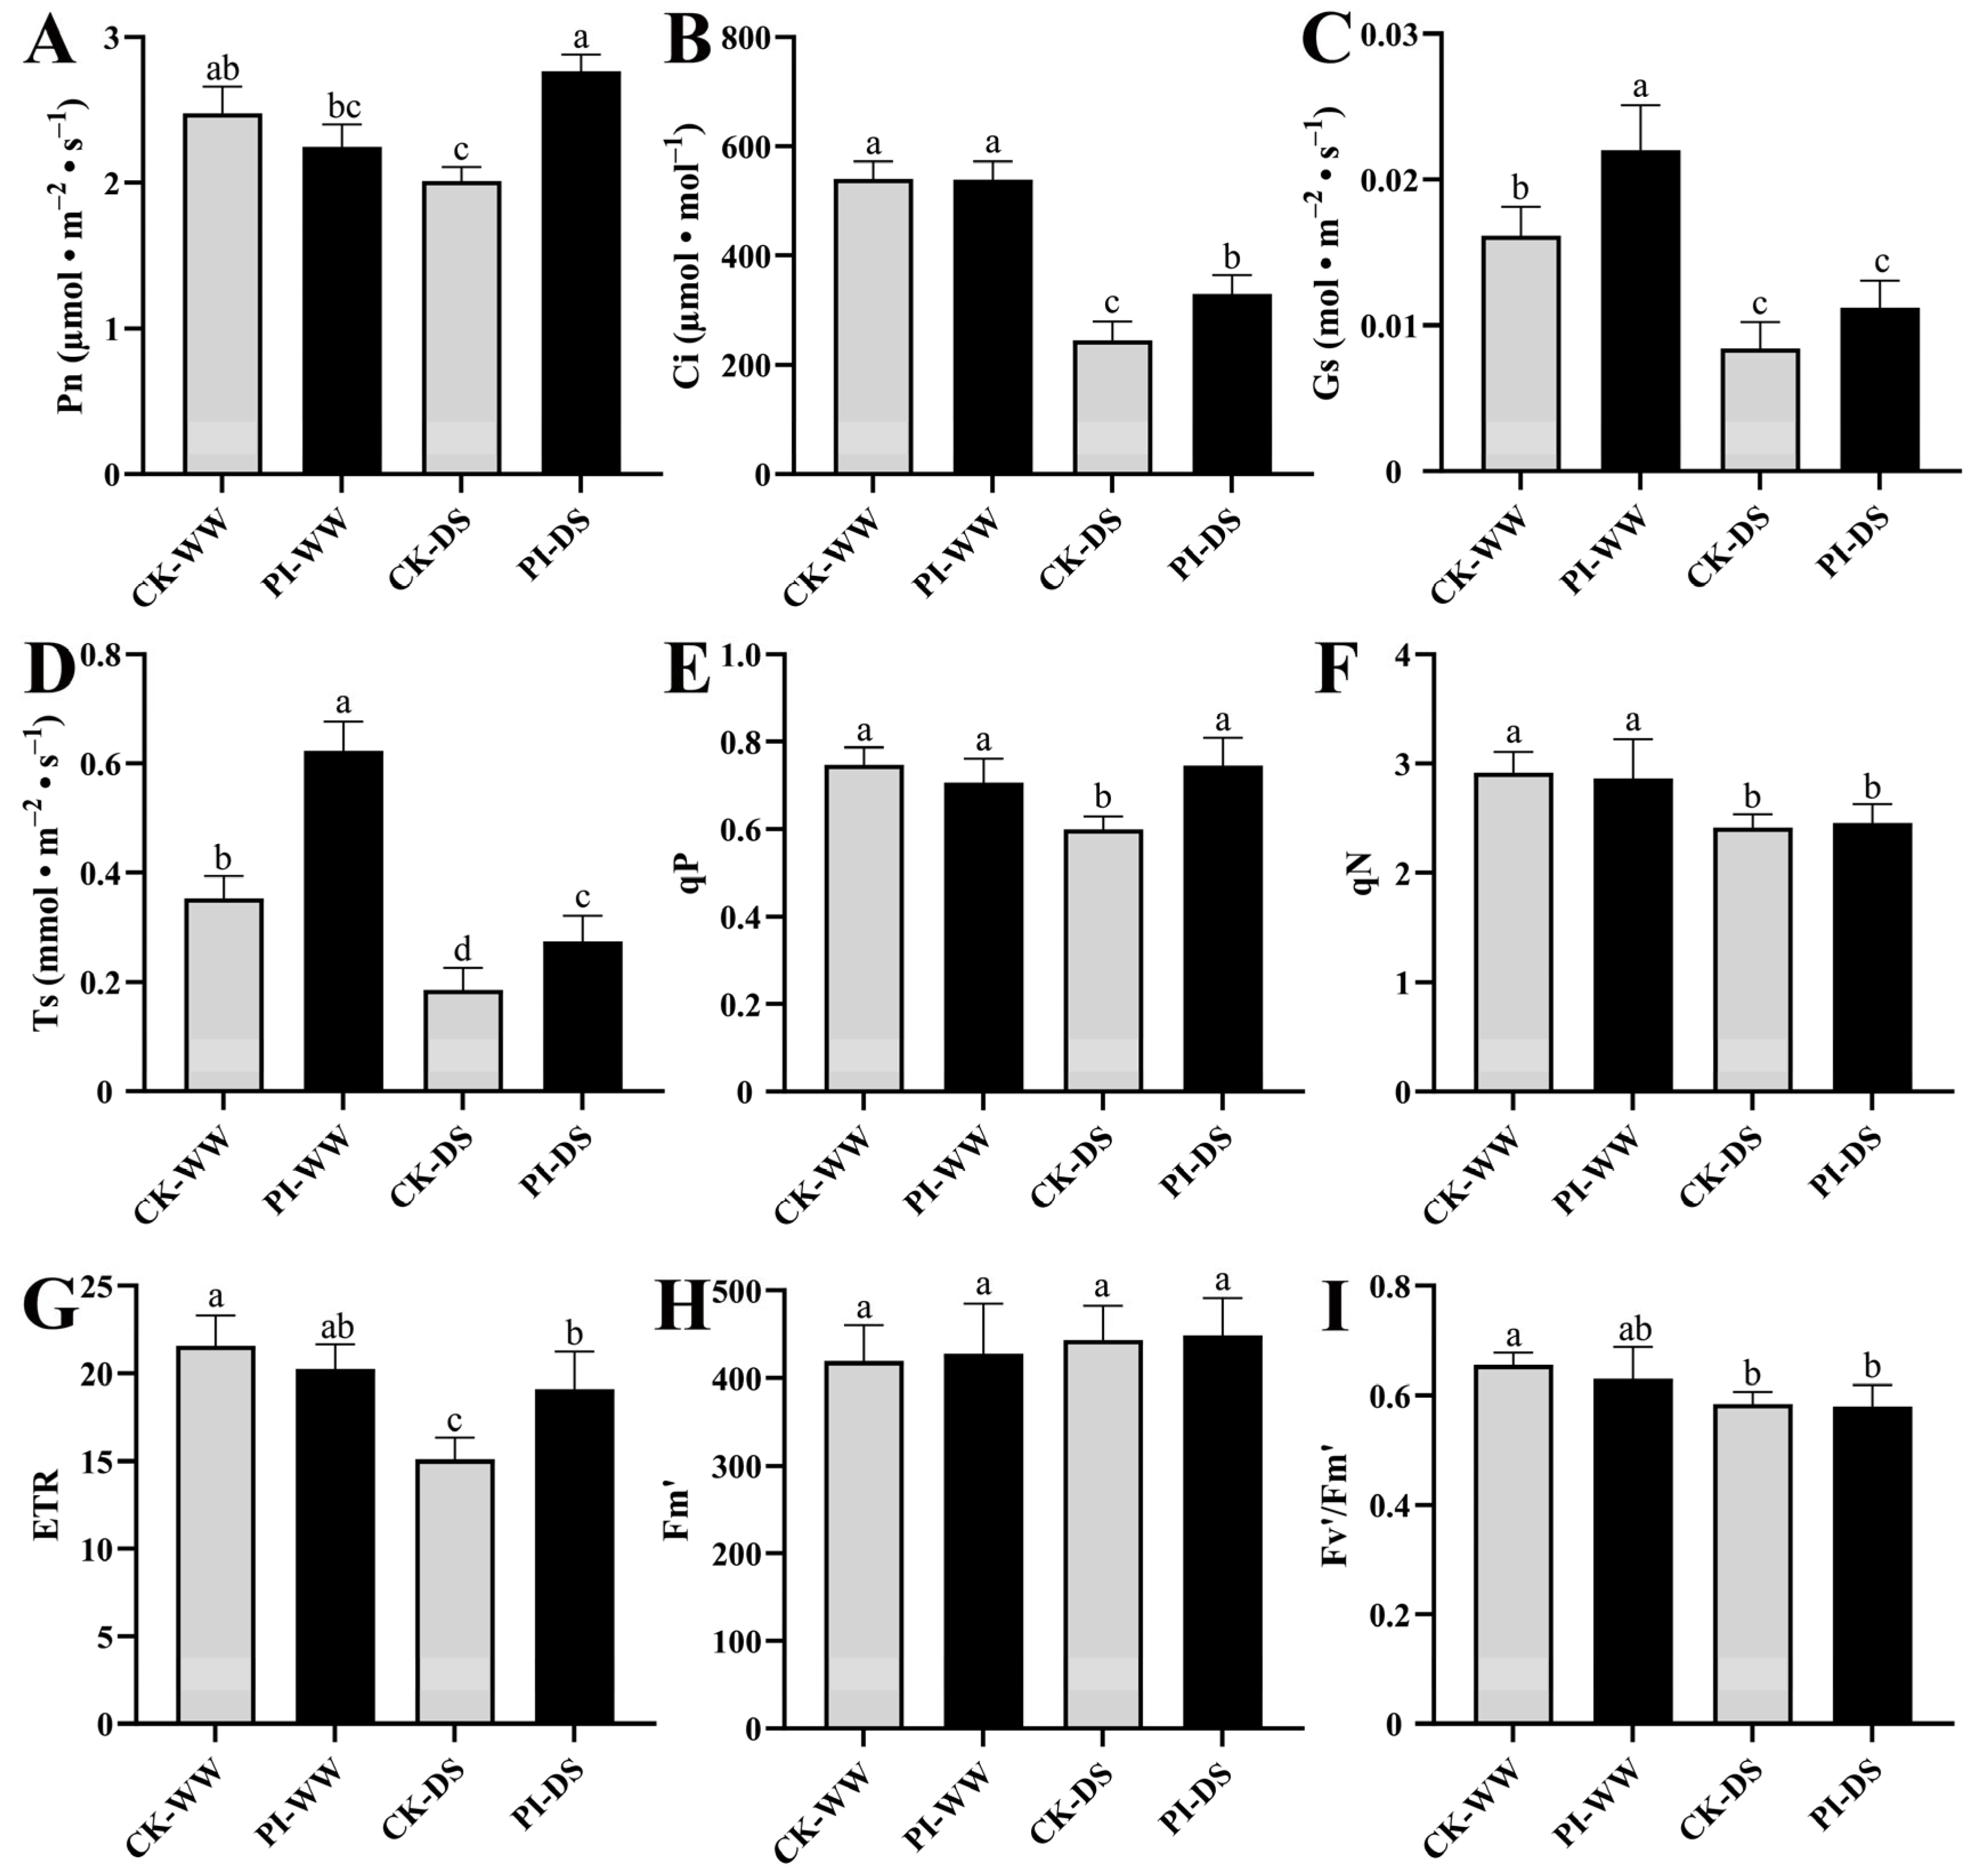
3.2. The Influences of P. indica Colonization on Blueberry Photosynthetic Capacity

We further determined and compared the photosynthesis- and chlorophyll fluorescence-related parameters of CK and PI plants under WW and DS conditions. Stomatal conductance (Gs) and transpiration rate (Ts) of the PI-WW group accounted for 1.36- and 1.76-fold of CK-WW group (p < 0.05), respectively. After DS, the PI-DS group showed a significantly higher net photosynthetic rate (Pn), intercellular CO2 concentration (Ci), transpiration rate (Ts), photochemical quenching coefficient (qP), and electron transport rate (ETR) (p < 0.05), accounting for 1.38-, 1.35-, 1.47-, 1.24-, and 1.26-fold of the CK-DS group (Figure 2), respectively. These results indicated that the fungal colonization improved greatly the photosynthetic capacity of blueberry plants under DS.

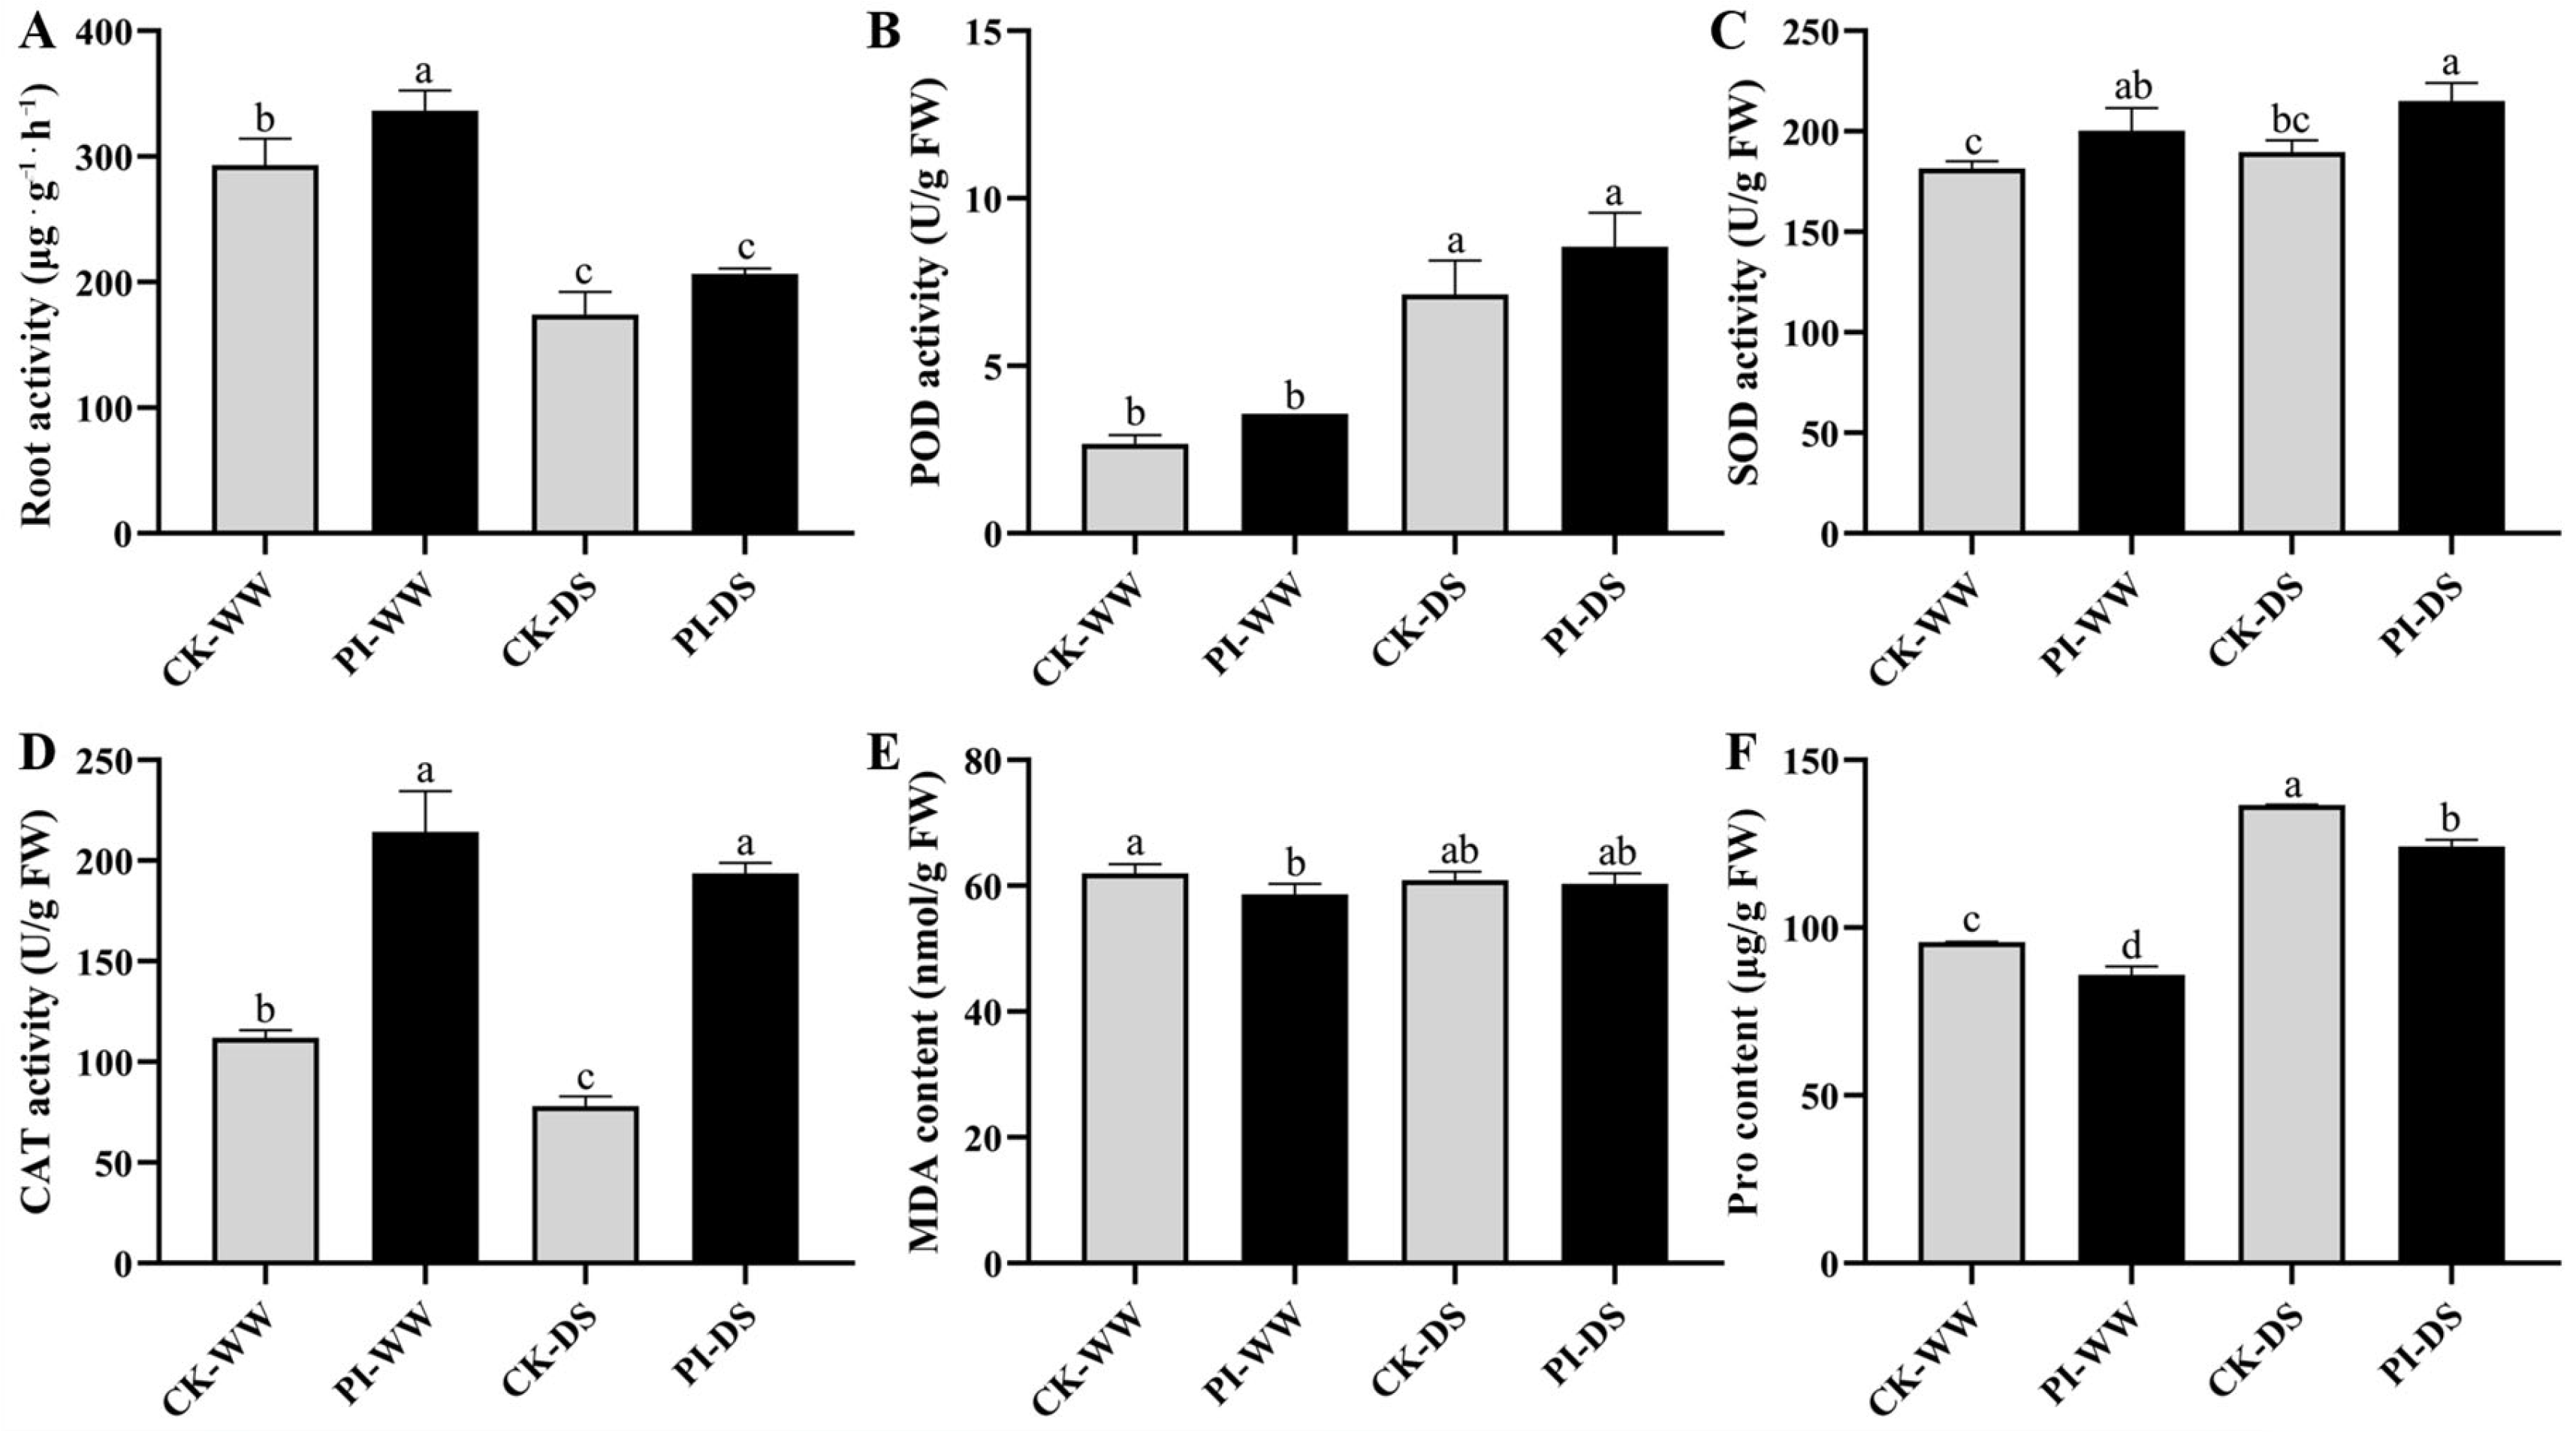
3.3. Influences of P. indica Colonization on Blueberry Root Activity

DS treatment greatly reduced the root activity of both CK and PI blueberry plants. Compared to the CK-WW group, the root activity of the CK-DS group dropped by 40.59%; compared to the PI-WW plants, the root activity of PI-DS plants dropped by 38.65% (Figure 3). The root activity of PI-WW group was found to be significantly higher (about 1.15-fold) than that of the CK-WW group (p < 0.05). Although no significant root activity difference was identified between PI-DS and CK-DS groups, the root activity of the PI-DS group was higher than the CK-DS group. These findings indicated that the fungal colonization improved the root activity and mitigated the adverse effects of DS on blueberry root activity.

3.4. Influences of P. indica Colonization on Antioxidant Ability-Related Parameters in Blueberry Roots

The superoxide dismutase (SOD) and CAT activities of the PI-WW group were significantly higher (p < 0.05), accounting for 1.10- and 1.92-fold of the CK-WW group, respectively. However, the MDA and Pro contents in the roots of the PI-WW group were significantly lower than those of the CK-WW group (p < 0.05). Although no significant difference was identified, the root peroxidase (POD) activities of PI plants were higher than CK plants under both WW and DS conditions.
Under DS, the SOD and CAT activities of the PI-DS group were significantly higher than those of the CK-DS group (p < 0.05), accounting for 1.13- and 2.48-fold of CK-DS, respectively. The Pro content of the PI-DS group was significantly lower than that of the CK-DS group (p < 0.05), while its POD activity accounted for about 1.2-fold of the CK-DS group. Compared to the CK-WW group, the CK-DS group showed increased POD and SOD activities and Pro content. Compared to the PI-WW group, the PI-DS group exhibited increases in POD and SOD activities and Pro content. The CAT activity and MDA content in the CK-DS group were 30.30% and 1.72% lower than those in the CK-WW group, respectively. Compared to the PI-WW group, in the PI-DS group, the CAT activity decreased by 9.65%, but the MDA content increased by 2.92% (Figure 3).

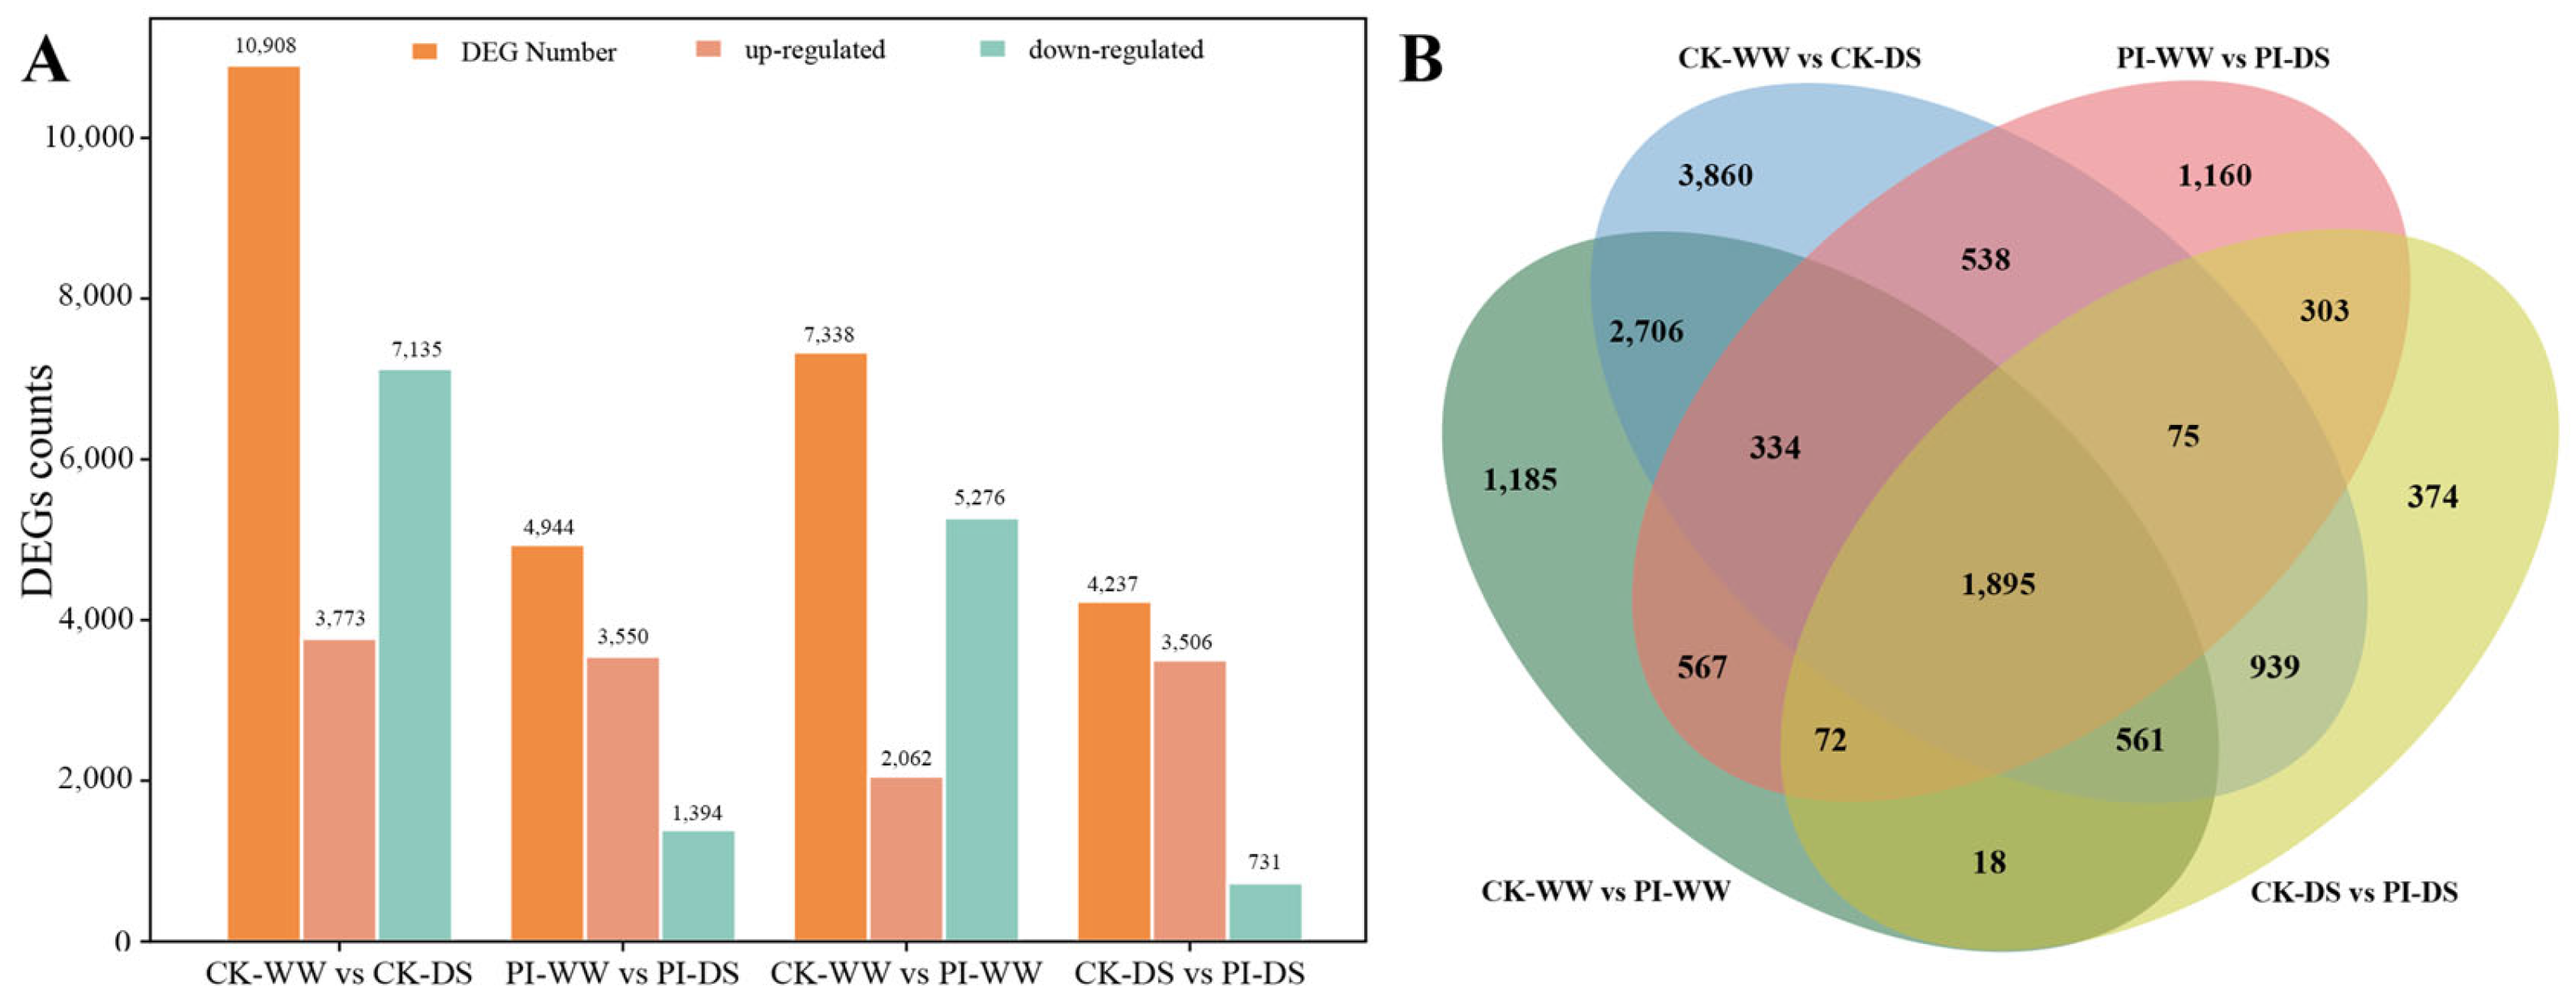
3.5. Transcriptome Sequencing and DEGs Analysis Results

Root RNA samples of blueberry plants from CK-WW, CK-DS, PI-WW, and PI-DS groups were subjected to RNA-seq analysis. A total of 90.24 Gb of clean data were generated for the 12 cDNA libraries (three biological replicates for each group), with each library yielding at least 6.25 Gb clean data. The Q30 and Q20 values of all the libraries were greater than 93.56% and 97.82%, with GC content ranging from 45.67% to 46.14%, and mapping ratio ranging from 87.80% to 91.12% of the reference blueberry genome (Supplemental Table S2), respectively. These results indicated that our transcriptome data were of high quality.
A total of 136,333 genes, including 7774 novel genes, were identified in at least one of the twelve blueberry root cDNA libraries. In total, 14,587 differentially expressed genes (DEGs) were detected across CK-WW vs. CK-DS, PI-WW vs. PI-DS, CK-WW vs. PI-WW, and CK-DS vs. PI-DS comparisons, with the DEG number being 10,908 (3773 upregulated and 7135 downregulated), 4944 (3550 upregulated and 1394 downregulated), 7338 (2062 upregulated and 5276 downregulated) and 4237 (3506 upregulated and 731 downregulated), respectively (Figure 4A). Among these DEGs, 1895 were identified common DEGs of all the four comparisons. It is worth noting that the PI-WW vs. PI-DS comparison had less than half of the DEG counts in the CK-WW vs. CK-DS comparison, but a higher proportion of upregulated DEGs. This suggests that P. indica colonization upregulated the expression of many genes related to coping with drought stress, thereby mitigating the impact of drought on the blueberry root transcriptome. Additionally, there were 2842 common DEGs between these two comparisons, accounting for 57.48% of the total DEGs in the PI-WW vs. PI-DS comparison, indicating that they might contribute greatly to the normal development of blueberry roots under drought stress (Figure 4B). Additionally, gene enrichment analysis showed that these common DEGs were primarily enriched in pathways related to carbohydrate transport and metabolism, signal transduction, and the biosynthesis, transport, and catabolism of secondary metabolites.
DEGs of the PI-WW vs. PI-DS and CK-WW vs. CK-DS comparisons were further annotated using Mercator V.4.0 and visualized with MapMan (Figure 5). Results showed that after DS, blueberry roots without P. indica colonization exhibited a significant downregulation of DEGs related to ‘stress’, ‘metabolism’, and ‘regulation’. Moreover, DEGs associated with redox state, ABA, lipids, cell wall, secondary metabolism, and energy metabolism were predominantly downregulated. In contrast, in P. indica-colonized blueberry roots, DEGs were overwhelmingly upregulated under DS (Figure 5). These results indicated that the fungal colonization greatly influenced the drought stress responses in blueberry roots.

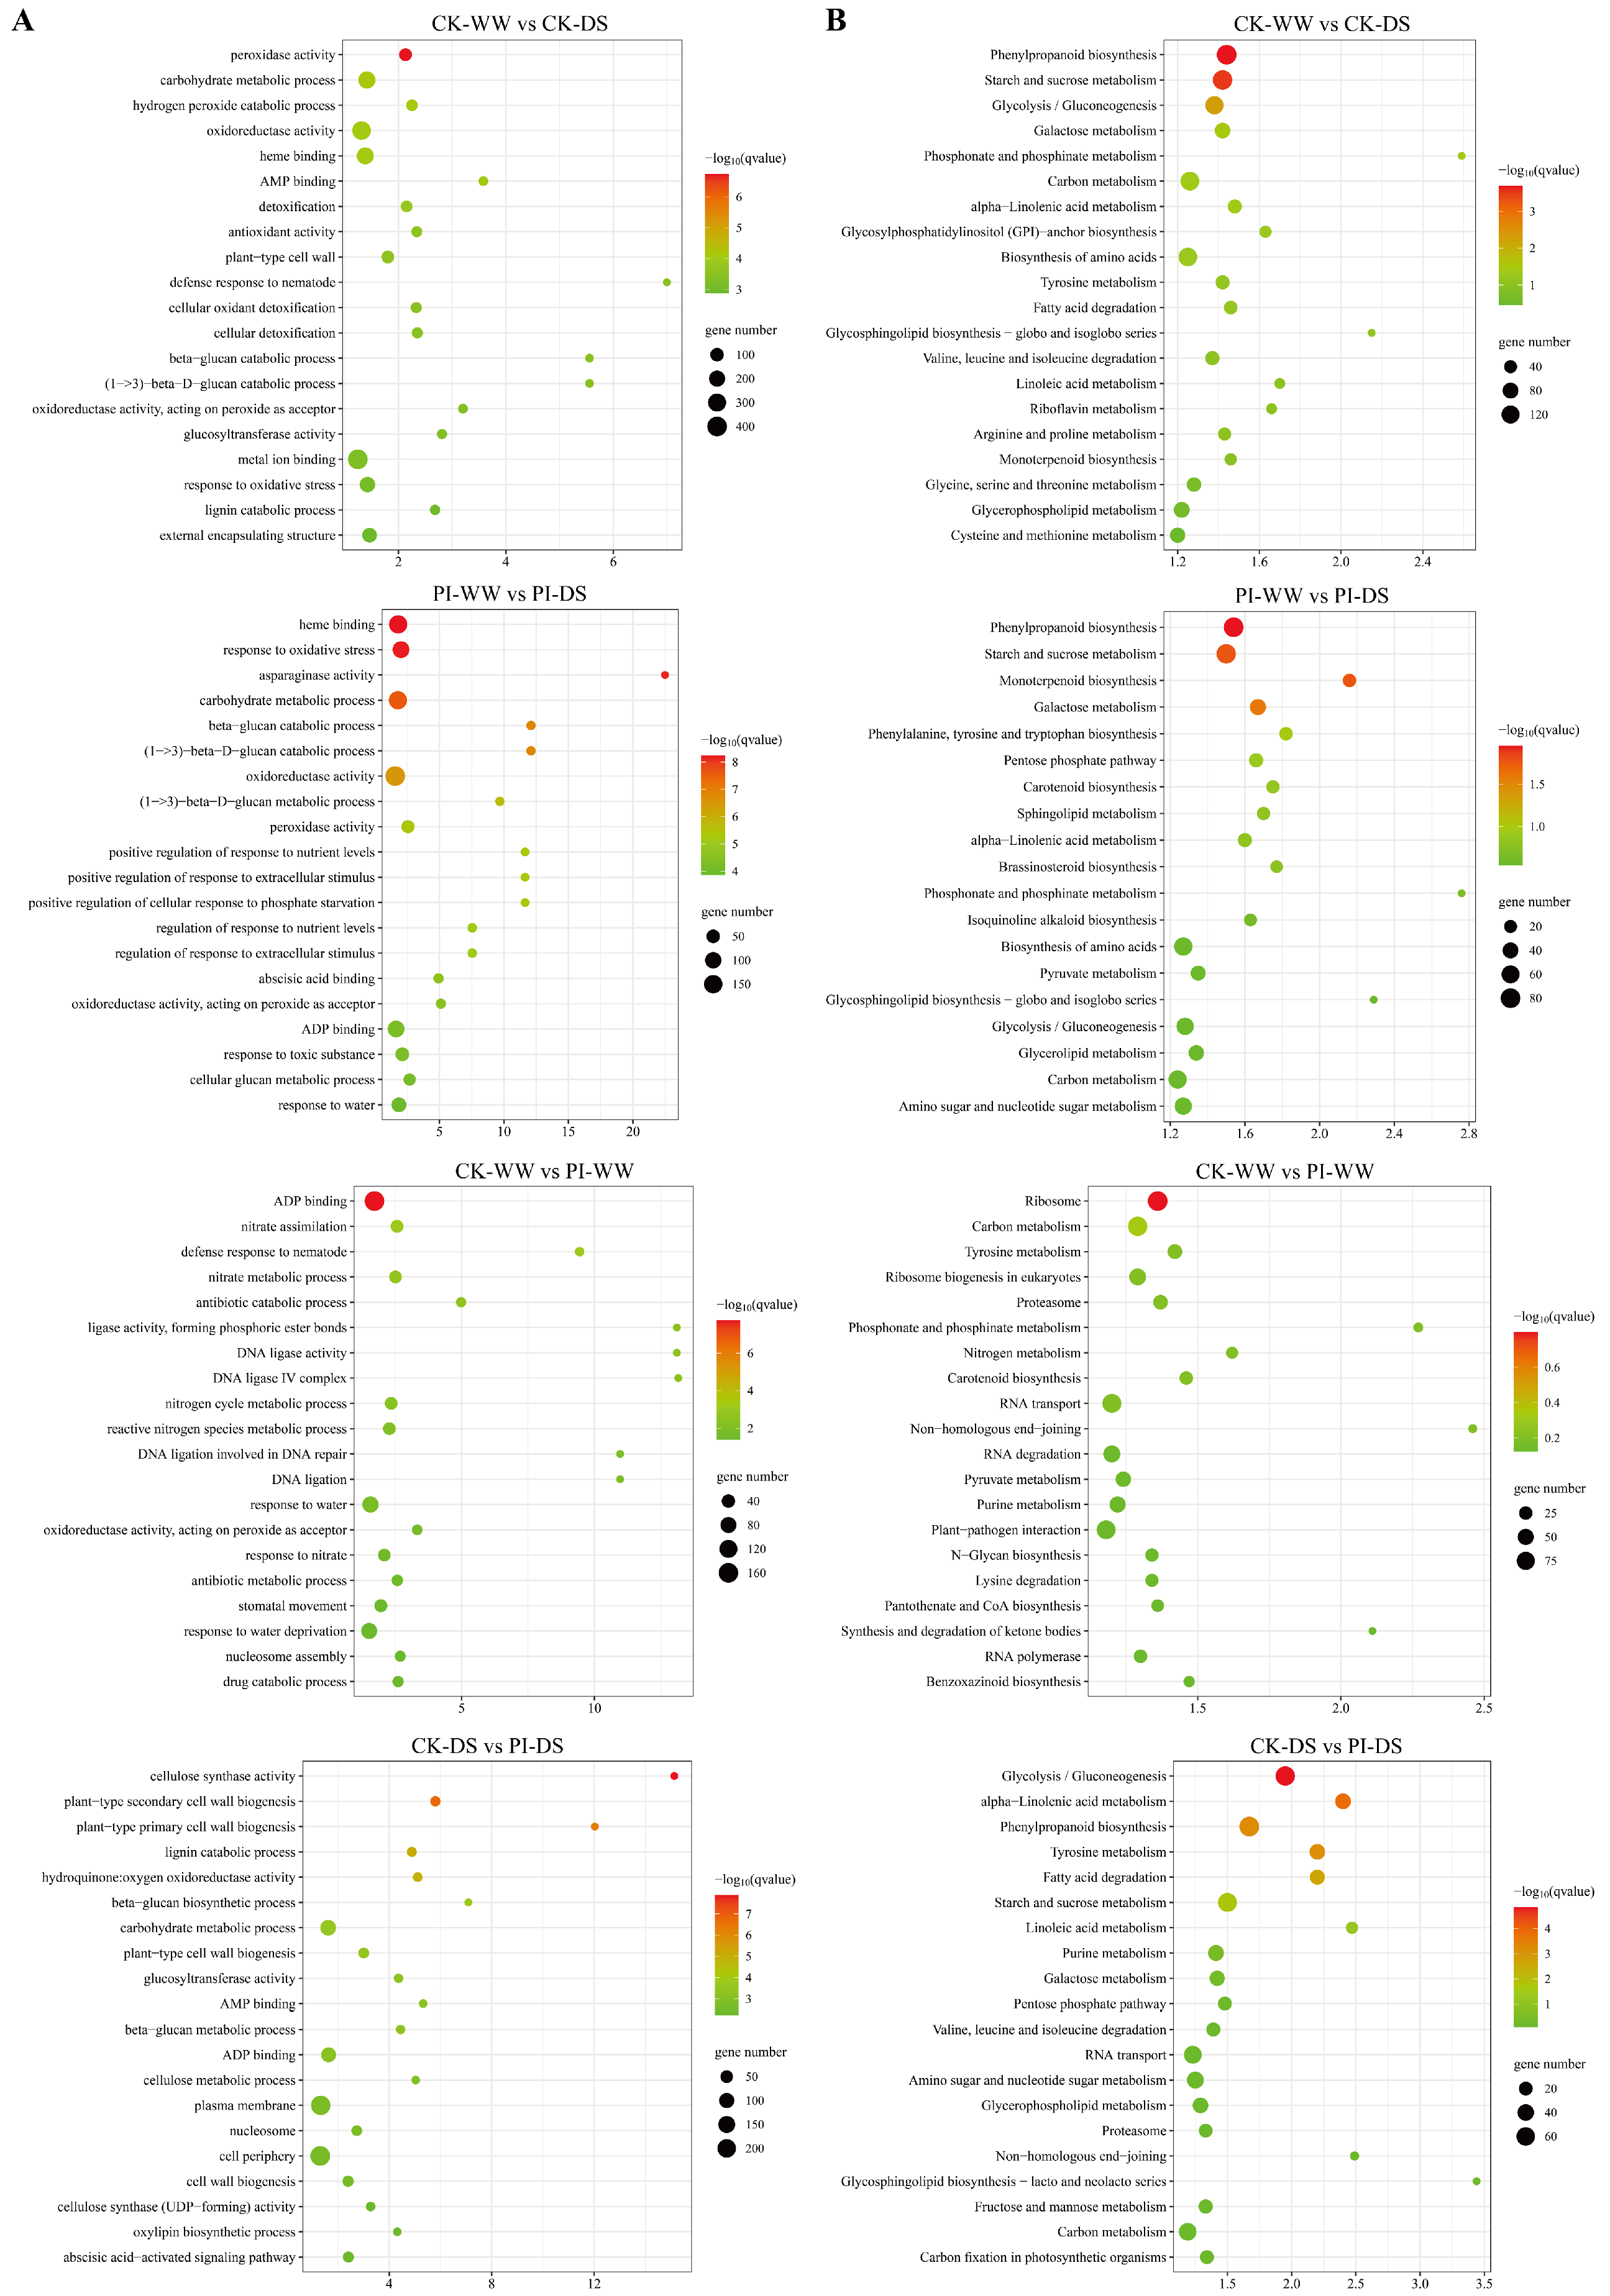
3.6. Enrichment Analysis Results of DEGs
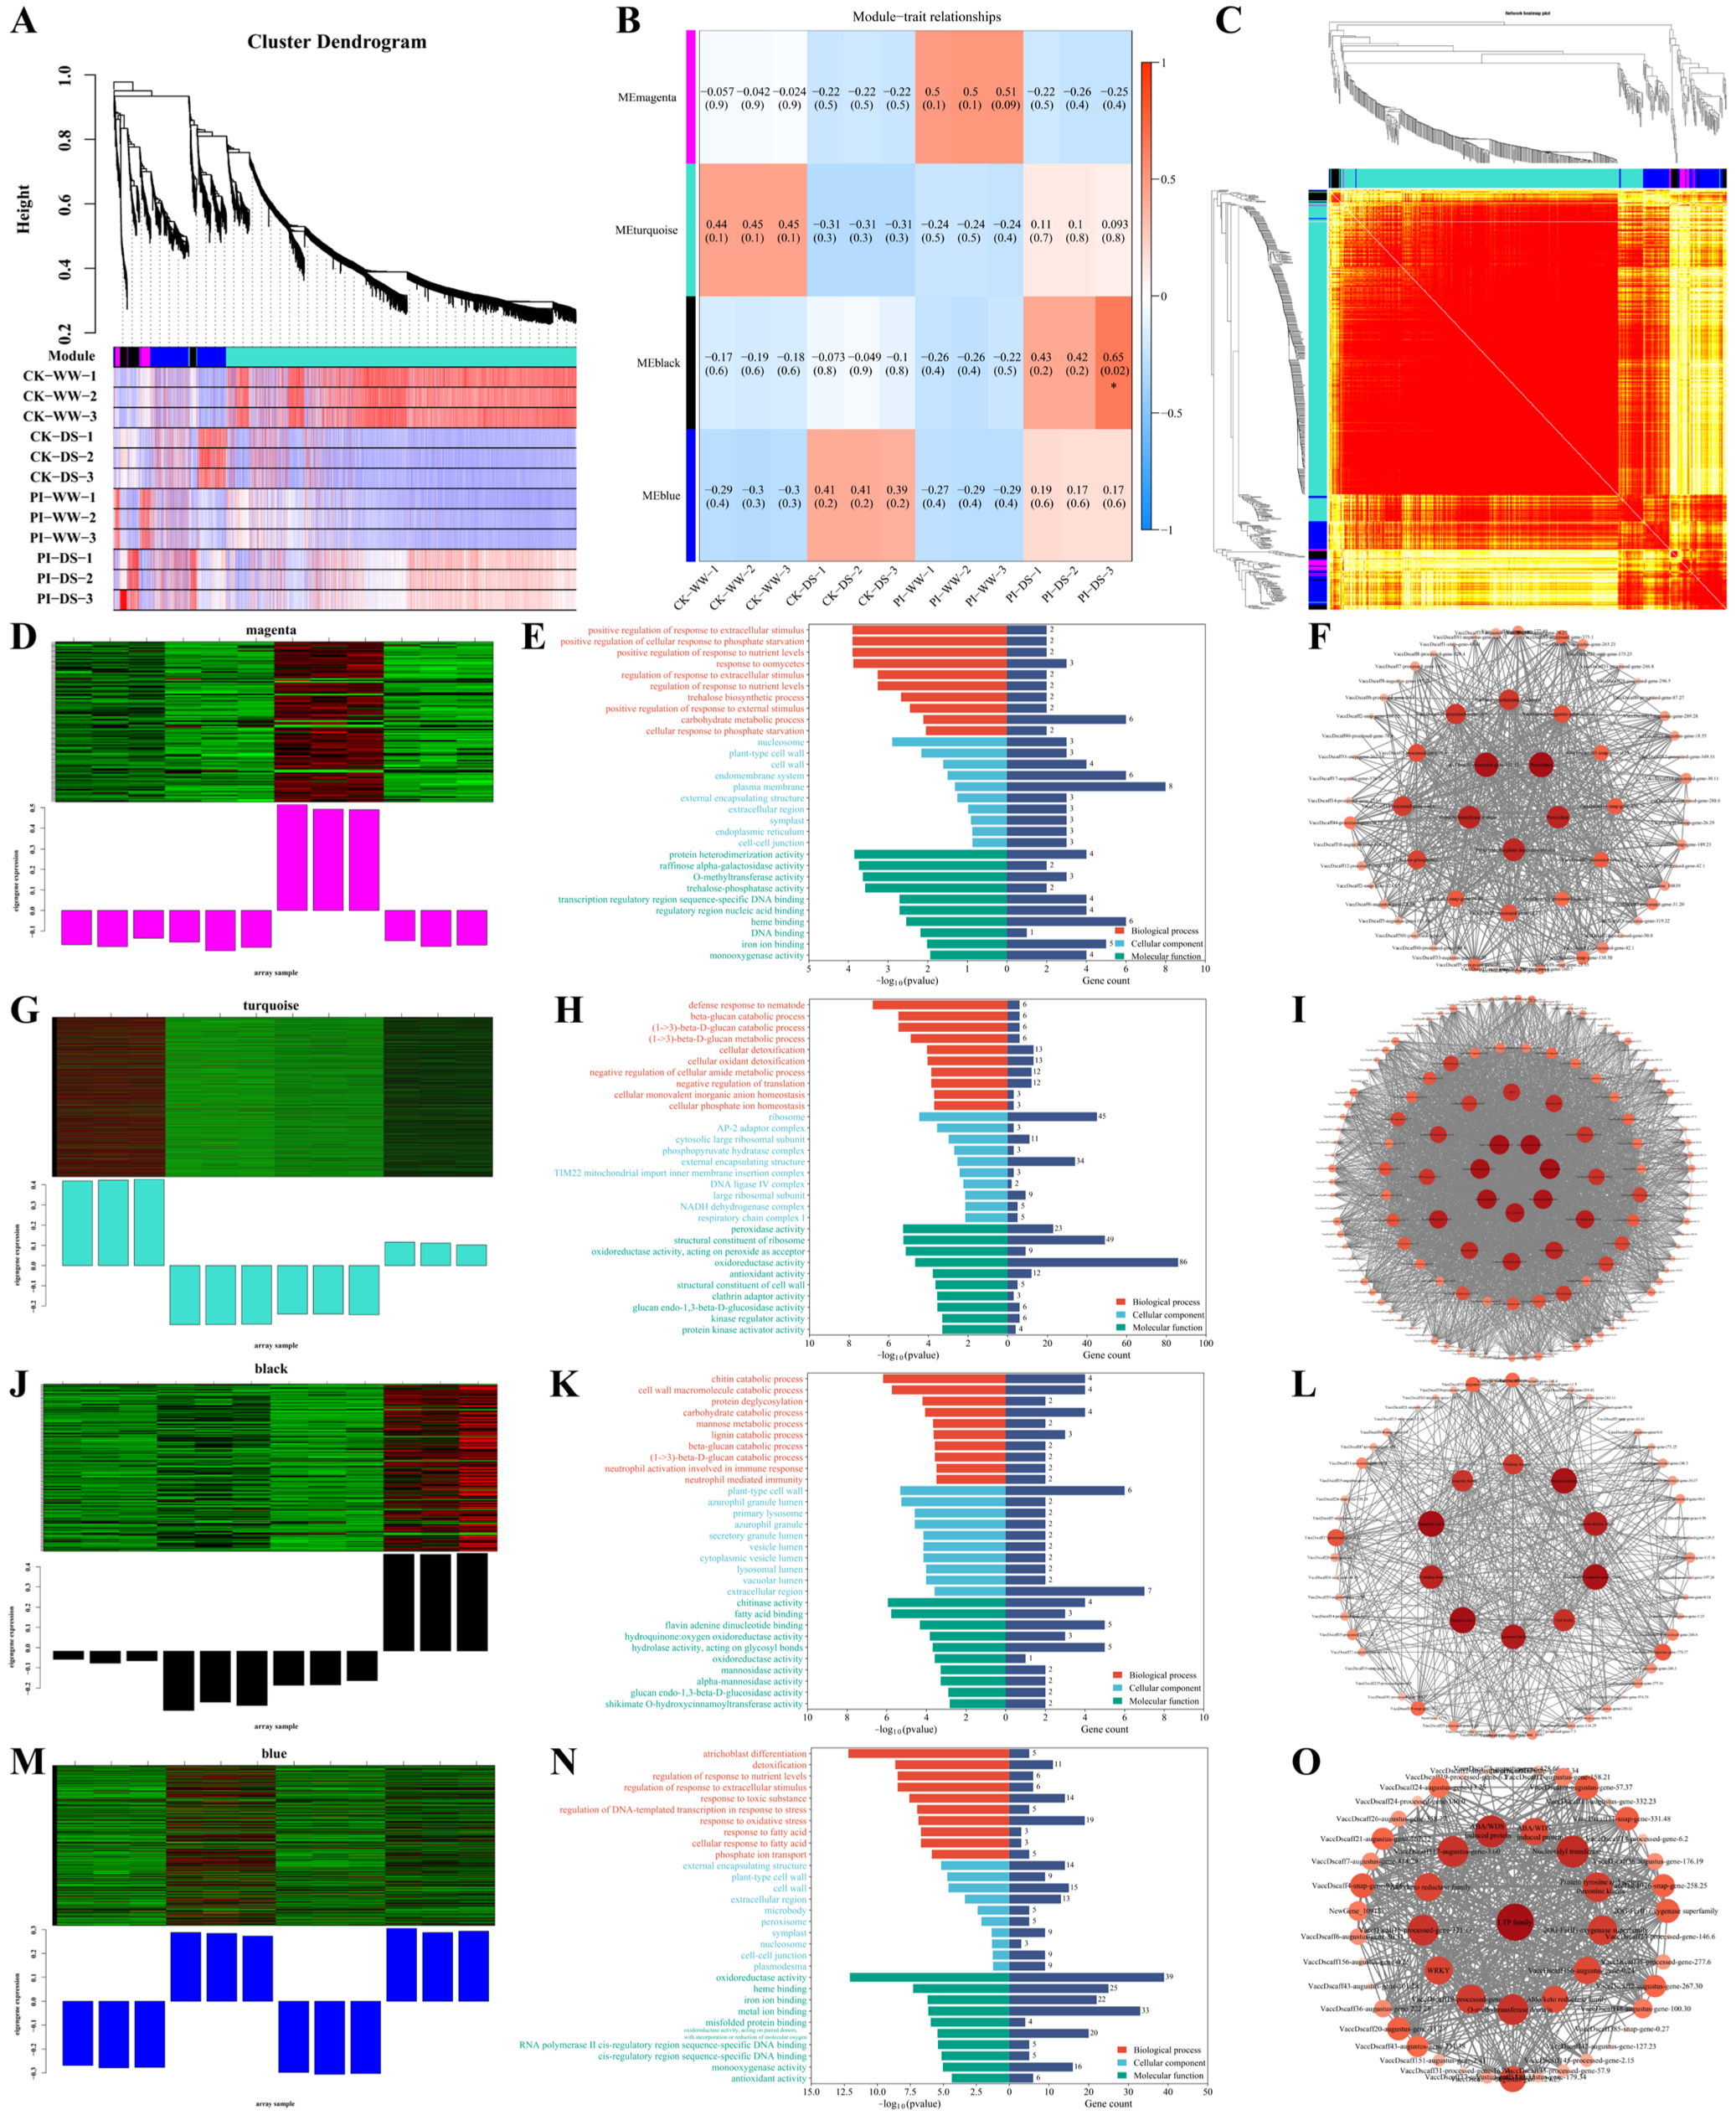
GO enrichment analysis of DEGs of each comparison was further performed (Figure 6A). For the DEGs of the CK-WW vs. CK-DS comparison, 42 biological process (BP) terms (such as ‘carbohydrate metabolic process’, ‘hydrogen peroxide catabolic process’), nine cellular component (CC) terms (such as ‘plant-type cell wall’, ‘external encapsulating structure’), and 26 molecular function (MF) terms (such as ‘peroxidase activity’, ‘oxidoreductase activity’, ‘heme binding’, ‘AMP binding’ and ‘antioxidant activity’) were significantly enriched (q value < 0.05). DEGs in the PI-WW vs. PI-DS comparison were significantly enriched in 89 BP terms (such as ‘response to oxidative stress and carbohydrate metabolic process’), four CC terms (such as ‘plant-type cell wall’, ‘cell wall’, ‘amyloplast, external encapsulating structure’), and 37 MF terms (such as ‘heme binding’, ‘asparaginase activity’, ‘oxidoreductase activity’, and ‘peroxidase activity’) (q value < 0.05). DEGs in the CK-WW vs. PI-WW comparison DEGs were significantly enriched in 17 BP terms (such as ‘nitrate assimilation’, ‘defense response to nematode’), one CC term (‘DNA ligase IV complex’), and four MF terms (‘ADP binding’, ‘DNA ligase activity’, ’ligase activity, forming phosphoric ester bonds’ and ‘oxidoreductase activity, acting on peroxide as acceptor’) (q value < 0.05). DEGs in the CK-DS vs. PI-DS comparison were significantly enriched in 24 BP terms (such as ‘plant type secondary cell wall biogenesis’, ‘plant type primary cell wall biogenesis’, ‘lignin catabolic process’), three CC terms (‘plasma membrane’, ‘nucleosome’ and ‘cell periphery’), and 23 MF terms (such as ‘cellulose synthase activity’, ’hydroquinone: oxygen oxidoreductase activity’, ‘glucosyltransferase activity’, ‘AMP binding’) (q value < 0.05).
KEGG enrichment analysis was also performed for DEGs of each comparison (Figure 6B). For the CK-WW vs. CK-DS comparison, DEGs were significantly enriched in seven KEGG pathways, including ‘phenylpropanoid biosynthesis’, ‘starch and sucrose metabolism’, ‘glycolysis/gluconeogenesis’, ‘galactose metabolism’, ‘phosphate and phosphonate metabolism’, ‘carbon metabolism’, and ‘α-linolenic acid metabolism’ (q value < 0.05). For the PI-WW vs. PI-DS comparison, DEGs were significantly enriched in ‘phenylpropanoid biosynthesis’, ‘starch and sucrose metabolism’, ‘monoterpenoid biosynthesis’, and ‘galactose metabolism’ pathways (q value < 0.05). For the CK-DS vs. PI-DS comparison, DEGs were significantly enriched in ‘glycolysis/gluconeogenesis’, ‘α-linolenic acid metabolism’, ‘phenylpropanoid biosynthesis’, ‘tyrosine metabolism’, ‘fatty acid degradation’, and ‘starch and sucrose metabolism’ pathways (q value < 0.05). No significantly enriched pathway was identified for DEGs of the CK-WW vs. PI-WW comparison.

3.7. WGCNA Results

WGCNA was performed to further analyze all the DEGs (FPKM > 1) identified in the four comparisons. Results showed that these DEGs were categorized into four modules, MEmagenta, MEturquoise, MEblack, and MEblue, involving 103, 2192, 173, and 424 DEGs (Figure 7), respectively. DEGs in the MEmagenta module showed significantly higher expression levels in PI-WW than other three groups. They were mainly enriched in GO terms such as ‘positive regulation of response to extracellular stimulus’, ‘positive regulation of cellular response to phosphate starvation’, ‘positive regulation of response to nutrient levels’, ‘regulation of response to extracellular stimulus’, ‘cell wall’, as well as KEGG pathways such as ‘glycosphingolipid biosynthesis-globo and isoglobo series’, ‘Stilbenoid, diarylheptanoid and gingerol biosynthesis’, ‘Valine, leucine and isoleucine degradation’, ‘Starch and sucrose metabolism’, ‘Galactose metabolism’, ‘Phenylpropanoid biosynthesis’ and so on. Hub genes in this module included genes encoding peroxidases (PODs), S-adenosylmethionine synthase 2, and trehalose-phosphate phosphatase (TPP) and so on (Supplemental Table S3).
DEGs in the MEturquoise module had the highest expression levels in CK-WW, followed by in PI-DS. These DEGs were primarily enriched in terms such as ‘defense response to nematode’, ‘beta-glucan catabolic process’, ‘(1->3)-beta-D-glucan catabolic process’, ‘(1->3)-beta-D-glucan metabolic process’, ‘cellular detoxification’ and so on, as well as pathways such as ‘ribosome’, ‘phenylpropanoid biosynthesis’. Hub genes included three polyphenol oxidases (PPOs), one heat-stress-associated 32 and so on (Supplemental Table S3).
DEGs in the MEblack module showed significantly higher expression levels in PI-DS than in other groups. They were mainly enriched in GO terms such as ‘chitin catabolic process’, ‘cell wall macromolecule catabolic process’, ‘protein deglycosylation’, ‘carbohydrate catabolic process’, ‘mannose metabolic process’, ‘lignin catabolic process’, ‘plant-type cell wall’ and so on, as well as pathways like ‘phenylpropanoid biosynthesis’, ‘plant hormone signal transduction’, and ‘flavonoid biosynthesis’. Hub genes in this module included several plant defense related genes, including four thaumatin-like proteins (TLPs), two FAD binding domain proteins (FADs), one defensin SD2, one pathogenesis-related protein 5 (PR5), and so on (Supplemental Table S3).
DEGs in the MEblue module had the highest expression levels in CK-DS, followed by PI-DS, with low expression in the other two groups, indicating that their expression was induced by drought. These DEGs were mainly enriched in terms such as ‘regulation of response to nutrient levels’, ‘regulation of response to extracellular stimuli’, ‘response to oxidative stress’, ‘response to fatty acids’, and ‘oxidoreductase activity’, as well as pathways such as ‘stilbenoid, diarylheptanoid, and gingerol biosynthesis’, ‘protein processing in the endoplasmic reticulum’, ‘phenylpropanoid biosynthesis’, and ‘starch and sucrose metabolism’. Hub genes of this module included DEGs encoding lipid-transfer proteins (LTPs), WRKY13, and abscisic stress ripening protein (ASR) and so on (Supplemental Table S3).

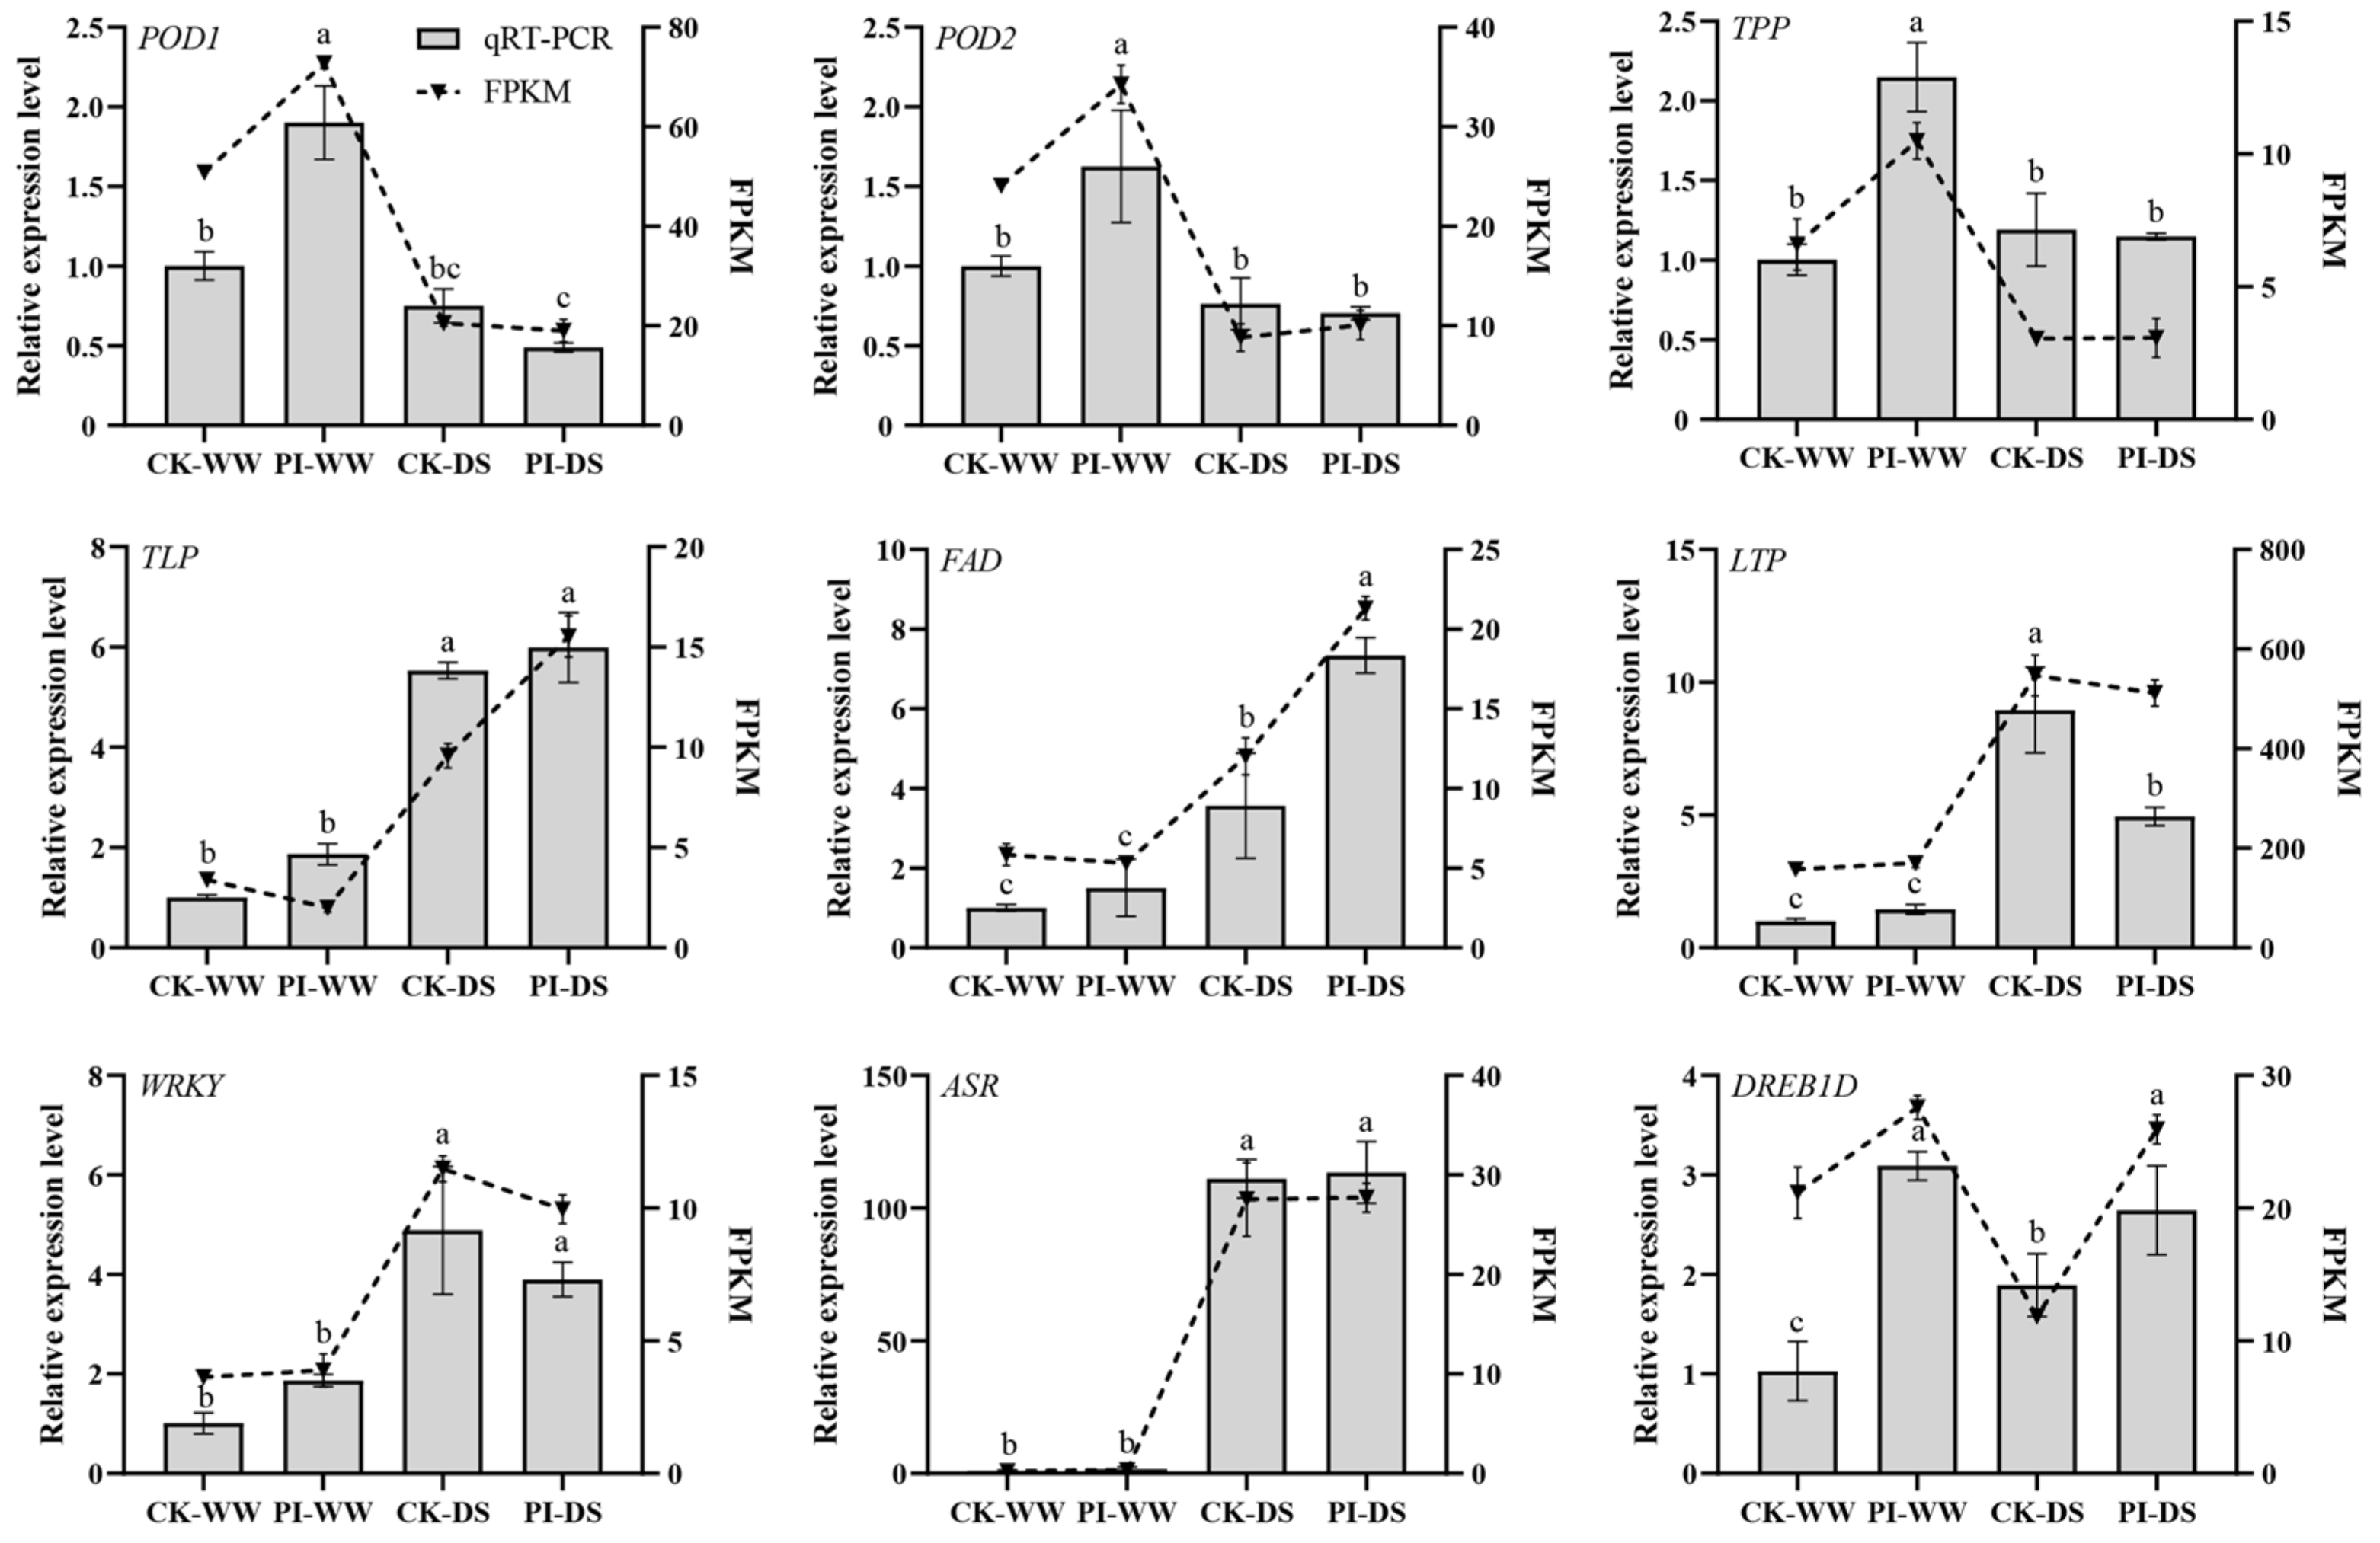
3.8. Quantitative Real-Time PCR Verification Results

Nine DEGs were selected for expression validations (Figure 8). qRT-PCR analysis results showed that their expression patterns were consistent with our transcriptome data, which can not only confirm the reliability of our transcriptome data but also demonstrate the crucial roles of these genes in blueberry responses to drought stress and in the P. indica-enhanced drought tolerance.

4. Discussion

4.1. P. indica Colonization Improved the Photosynthetic Capacity and Mediated the Antioxidant Defense System of Blueberry Plants Under Drought Stress

P. indica can enhance the drought tolerance of many host plants [39,40,41,42]. Under drought conditions, P. indica-colonized trifoliate orange plants showed higher net photosynthesis rates in leaves compared to non-inoculated controls [22,39]. Under drought condition, eggplant plants colonized by P. indica exhibited improved root length, shoot length, and plant biomass, as well as increased total chlorophyll content in leaves [18]. Consistently, our study showed that PI-DS plants exhibited significantly higher chlorophyll content, Pn, Ci, Ts, and qP in blueberry leaves compared to the CK-DS plants, indicating that P. indica colonization improved the photosynthetic capacity of blueberries under drought stress.
Under drought stress, the production of reactive oxygen species (ROS) in plant cells increases greatly, causing significant oxidative stress (OS) [43]. The intercellular concentration of MDA, a product of lipid peroxidation, is commonly used as a parameter reflecting the OS extent. In response to drought stress, plant will activate the activities of antioxidant enzymes (SOD, POD, CAT and so on), and improve accumulations of osmoregulatory substances (such as Pro and MDA) to detoxify and scavenge ROS [44]. P. indica-colonized trifoliate orange plants showed increased CAT, POD, and APX activities in leaves but decreased MDA content compared to non-colonized controls under drought condition [22,39]. Similarly, under drought stress, P. indica-colonized eggplant plants exhibited higher POD and CAT activities compared to the control group [18]. Significant increases in SOD, POD, CAT, GR, and MDHAR activities in both roots and leaves were found in P. indica-colonized walnut seedlings under drought condition [45]. P. indica-colonized maize showed higher activities of CAT and SOD enzymes but lower MDA content in leaves compared to non-inoculated controls [26]. Similarly, in this study, compared to CK roots, PI plants had significantly higher SOD and CAT activities, higher POD activity, and lower MDA content in roots. These results suggest that P. indica colonization enhanced the antioxidant ability of blueberry roots. Wang et al. [46] reported that, after drought stress, DEGs in blueberry roots were significantly enriched in ROS metabolism. Consistently, our study found that the expression levels of genes related to POD activity and antioxidant enzymes were significantly affected by drought and P. indica colonization. Moreover, P. indica colonization significantly upregulated the expression of ‘redox state’-related genes in blueberry roots. These findings indicate that P. indica colonization induces the expression of antioxidant enzyme-related genes, which will facilitate ROS scavenging and enhance blueberry drought resistance [20].

4.2. P. indica Colonization Mitigates the Suppression of Drought on Metabolism- and Stress-Related Genes in Blueberry Roots

Under drought stress, plants accumulate more compatible solutes (such as soluble sugars) and anti-stress metabolites for osmotic adjustment [43]. Evidence revealed that drought significantly influenced the carbon and energy metabolism of blueberry [47]. Consistently, in this study, DEGs in the CK-WW vs. CK-DS, PI-WW vs. PI-DS, and CK-DS vs. PI-DS comparisons were significantly enriched in GO terms related to carbohydrate metabolic processes and starch and sucrose metabolism pathways. Moreover, the expression of numerous genes related to primary metabolism, secondary metabolism, and energy metabolism in blueberry roots were found to be downregulated by drought. Our study showed that DEGs in the CK-WW vs. CK-DS and PI-WW vs. PI-DS comparisons were also significantly enriched in glycolysis/gluconeogenesis, and galactose metabolism pathways. Notably, these DEGs were mostly upregulated in PI roots under DS. Therefore, it can be concluded that P. indica colonization alleviated the suppression effects of drought on the expression of carbohydrate and energy metabolism related genes.
It has been reported that flavonoids biosynthesis plays a crucial role in the blueberry leaf response to drought [48]. Anthocyanins metabolism was also demonstrated to be important for blueberry root and leaf responses to drought [46]. After drought treatment, the levels of alkaloids and phenylpropanoids in blueberry roots significantly increased [47]. In this study, DEGs of the CK-WW vs. CK-DS and PI-WW vs. PI-DS comparisons were also enriched in pathways related to the biosynthesis, transport, and catabolism of secondary metabolites. Moreover, DEGs in the CK-WW vs. CK-DS, PI-WW vs. PI-DS, and CK-DS vs. PI-DS comparisons were all significantly enriched in the phenylpropanoid biosynthesis pathway, with most DEGs in the PI group being upregulated. These results indicate that P. indica can enhance blueberry drought tolerance by strengthening root secondary metabolism.
ABA plays a crucial role in plant responses to drought stress [49,50]. Both the ABA content and the expression of ABA metabolism-related genes in blueberry roots and leaves were upregulated under drought stress [46]. Cell wall metabolism is involved in plant stress defense mechanisms and is considered a drought tolerance mechanism in numerous plants [51,52]. In this study, after drought stress, most ABA- and cell wall metabolism-related DEGs were downregulated in CK roots, while upregulated in PI roots, indicating that P. indica enhances blueberry drought tolerance by activating root ABA and cell wall metabolisms [19].
Additionally, our study showed that the expression levels of most ‘stress’-related DEGs in P. indica-colonized blueberry roots were upregulated by drought stress, suggesting that P. indica improves blueberry drought resistance by upregulating the expression of plant stress-responsive genes. A high correlation was identified between the PI-DS group and the MEblack module, with several plant defense-related genes being hub genes. Of these hub genes, four TLP genes were included. TLPs have been reported to contribute positively to plant drought tolerance [53,54]. Their significant upregulation in drought treated PI plants suggested that they might play important roles in the P. indica-enhanced drought tolerance in blueberry.

5. Conclusions

This study revealed that P. indica colonization enhances blueberry drought resistance by improving photosynthetic and antioxidant capacities, and by regulating the expression of genes involved in carbohydrates metabolism, stress, cell wall metabolism, and phenylpropanoid biosynthesis. Our study will provide basis for the future applications of P. indica in the blueberry industry.

Supplementary Materials

The following supporting information can be downloaded at: https://www.mdpi.com/article/10.3390/horticulturae11060605/s1. Supplemental Table S1. Information for the primer used in this study. Supplemental Table S2. The quality indicators of transcriptome sequencing data. Supplemental Table S3. Information for the hub genes of the MEmagenta, MEturquoise, MEblack and MEblue modules. Supplemental Figure S1. Detection of P. indica Pitef1 gene in blueberry roots. CK-WW: well-watered CK plants; PI-WW: well-watered PI plants; CK-DS: drought stress treated CK plants; PI-DS: drought stress treated PI plants.

Author Contributions

Y.Z.: formal analysis, resources, funding acquisition, and writing—original draft; P.Q.: formal analysis, software, writing—original draft, and methodology; J.Z.: investigation, and data curation. R.L. (Ruide Li): data curation, investigation, and software; R.L. (Rui Li): data curation, and investigation; C.C.: conceptualization, writing—review and editing, supervision, funding acquisition, project administration. All authors have read and agreed to the published version of the manuscript.

Funding

This research was supported by the Natural Science Basic Research Program of Shanxi Province (202203021211267, 202403021212072), the PhD Introduction Research Start-up Project of Shanxi Agricultural University (2023BQ117), the Fund for High-level Talents of Shanxi Agricultural University (2021XG010), and the Reward Fund for PhDs and Postdoctors of Shanxi Province (SXBYKY2022004).

Data Availability Statement

Data are contained in the article or Supplemental Materials.

Conflicts of Interest

The authors declare that they have no known competing financial interests or personal relationships that could have appeared to influence the work reported in this paper.

Abbreviations

The following abbreviations are used in this manuscript:
ABAAbscisic acid
ASRAbscisic stress ripening protein
CATCatalase
CiIntercellular CO2 concentration
DEGDifferentially expressed gene
DREB1Ddehydration-responsive element-binding protein 1B-like
DSDrought stress
ETRElectron transport rate
Fm’The maximum chlorophyll fluorescence yield under illumination
FPKMFragments Per Kilobase of transcript per Million mapped reads
Fv’/Fm’capture efficiency of excitation energy
GOGene ontology
GRGlutathione reductase
GsStomatal conductance
KEGGKyoto Encyclopedia of Genes and Genomes
LTPLipid-transfer protein
MDAMalondialdehyde
OSOxidative stress
PnNet photosynthetic rate
PODPeroxidase
PPOPolyphenol oxidase
ProProline
qNNon-photochemical quenching
qPPhotochemical quenching
ROSReactive oxygen species
SODSuperoxide dismutase
TLPThaumatin-like protein
TPPTrehalose-phosphate phosphatase
TsTranspiration rate
WGCNAWeighted gene co-expression network analysis
WWWell-watered

References

  1. Duan, Y.; Tarafdar, A.; Chaurasia, D.; Singh, A.; Bhargava, P.C.; Yang, J.; Li, Z.; Ni, X.; Tian, Y.; Li, H.; et al. Blueberry fruit valorization and valuable constituents: A review. Int. J. Food Microbiol. 2022, 381, 109890. [Google Scholar] [CrossRef]
  2. Kalt, W.; Cassidy, A.; Howard, L.R.; Krikorian, R.; Stull, A.J.; Tremblay, F.; Zamora-Ros, R. Recent research on the health benefits of blueberries and their anthocyanins. Adv. Nutr. 2020, 11, 224–236. [Google Scholar] [CrossRef] [PubMed]
  3. Shi, J.; Xiao, Y.; Jia, C.; Zhang, H.; Gan, Z.; Li, X.; Yang, M.; Yin, Y.; Zhang, G.; Hao, J.; et al. Physiological and biochemical changes during fruit maturation and ripening in highbush blueberry (Vaccinium corymbosum L.). Food Chem. 2023, 410, 135299. [Google Scholar] [CrossRef] [PubMed]
  4. Sandoval, Y.; Tighe-Neira, R.; Inostroza-Blancheteau, C.; Soto-Cerda, B.; González-Villagra, J. Melatonin improves plant water status, photosynthetic performance, and antioxidant defense system in highbush blueberry (Vaccinium corymbosum L.) plants subjected to drought stress. Sci. Hortic. 2024, 323, 112528. [Google Scholar] [CrossRef]
  5. Balboa, K.; Ballesteros, G.I.; Molina-Montenegro, M.A. Integration of physiological and molecular traits would help to improve the insights of drought resistance in highbush blueberry cultivars. Plants 2020, 9, 1457. [Google Scholar] [CrossRef]
  6. Lobos, G.A.; Hancock, J.F. Breeding blueberries for a changing global environment: A review. Front. Plant Sci. 2015, 6, 782. [Google Scholar] [CrossRef]
  7. Balbontín, C.; Reyes, M.; Yáñez, M.A.; Parra-Palma, C.; Morales-Quintana, L.; Ramos, P. Enhancing blueberry drought resilience: ABA and MeJA hormonal formulations unveil water-saving strategies. Hortic. Environ. Biotechnol. 2025, 66, 99–110. [Google Scholar] [CrossRef]
  8. Chen, X.; Qiu, L.; Guo, H.; Wang, Y.; Yuan, H.; Yan, D.; Zheng, B. Spermidine induces physiological and biochemical changes in southern highbush vlueberry under drought stress. Braz. J. Bot. 2017, 40, 841–851. [Google Scholar] [CrossRef]
  9. Lenart, A.; Wrona, D.; Krupa, T. Biostimulators with marine algae extracts and their role in increasing tolerance to drought stress in highbush blueberry cultivation. PLoS ONE 2024, 19, e0306831. [Google Scholar] [CrossRef]
  10. Acuña-Rodríguez, I.S.; Ballesteros, G.I.; Atala, C.; Gundel, P.E.; Molina-Montenegro, M.A. Hardening blueberry plants to face drought and cold events by the application of fungal endophytes. Agronomy 2022, 12, 1000. [Google Scholar] [CrossRef]
  11. Balbontín, C.; Flores, S.; Reyes, M.; Urrutia, V.; Parra-Palma, C.; Morales-Quintana, L.; Ramos, P. Antarctic fungal inoculation enhances drought tolerance and modulates fruit physiology in blueberry plants. Curr. Plant Biol. 2025, 42, 100462. [Google Scholar] [CrossRef]
  12. Mu, D.; Du, N.; Zwiazek, J.J. Inoculation with Ericoid mycorrhizal associations alleviates drought stress in lowland and upland velvetleaf blueberry (Vaccinium myrtilloides) seedlings. Plants 2021, 10, 2786. [Google Scholar] [CrossRef] [PubMed]
  13. Su, H.; Guo, Y.; Gu, L.; Shi, X.; Zhou, Y.; Wu, F.; Wang, L. A novel growth-promoting dark septate endophytic fungus improved drought tolerance in blueberries by modulating phytohormones and non-structural carbohydrates. Tree Physiol. 2024, 44, tpae105. [Google Scholar] [CrossRef]
  14. Verma, S.; Varma, A.; Rexer, K.-H.; Hassel, A.; Kost, G.; Sarbhoy, A.; Bisen, P.; Bütehorn, B.; Franken, P. Piriformospora indica, gen. et sp. nov., a new root-colonizing fungus. Mycologia 1998, 90, 896–903. [Google Scholar] [CrossRef]
  15. Mensah, R.A.; Li, D.; Liu, F.; Tian, N.; Sun, X.; Hao, X.; Lai, Z.; Cheng, C. Versatile Piriformospora indica and its potential applications in horticultural crops. Hortic. Plant J. 2020, 6, 111–121. [Google Scholar] [CrossRef]
  16. Saleem, S.; Sekara, A.; Pokluda, R. Serendipita indica—A review from agricultural point of view. Plants 2022, 11, 3417. [Google Scholar] [CrossRef] [PubMed]
  17. Li, L.; Feng, Y.; Qi, F.; Hao, R. Research progress of Piriformospora indica in improving plant growth and stress resistance to plant. J. Fungi 2023, 9, 965. [Google Scholar] [CrossRef]
  18. Swetha, S.; Padmavathi, T. Mitigation of drought stress by Piriformospora indica in Solanum melongena L. cultivars. Proc. Natl. Acad. Sci. India Sect. B Biol. Sci. 2020, 90, 585–593. [Google Scholar] [CrossRef]
  19. Azizi, M.; Fard, E.M.; Ghabooli, M. Piriformospora indica affect drought tolerance by regulation of genes expression and some morphophysiological parameters in tomato (Solanum lycopersicum L.). Sci. Hortic. 2021, 287, 110260. [Google Scholar] [CrossRef]
  20. Tsai, H.-J.; Shao, K.-H.; Chan, M.-T.; Cheng, C.-P.; Yeh, K.-W.; Oelmüller, R.; Wang, S.-J. Piriformospora indica symbiosis improves water stress tolerance of rice through regulating stomata behavior and ROS scavenging systems. Plant Signal. Behav. 2020, 15, 1722447. [Google Scholar] [CrossRef]
  21. Yaghoubian, I.; Modarres-Sanavy, S.A.M.; Smith, D.L. Plant growth promoting microorganisms (PGPM) as an eco-friendly option to mitigate water deficit in soybean (Glycine max L.): Growth, physio-biochemical properties and oil content. Plant Physiol. Biochem. 2022, 191, 55–66. [Google Scholar] [CrossRef]
  22. Cao, J.-L.; He, W.-X.; Zou, Y.-N.; Wu, Q.-S. An endophytic fungus, Piriformospora indica, enhances drought tolerance of trifoliate orange by modulating the antioxidant defense system and composition of fatty acids. Tree Physiol. 2023, 43, 452–466. [Google Scholar] [CrossRef]
  23. Hosseini, F.; Mosaddeghi, M.R.; Dexter, A.R.; Sepehri, M. Maize water status and physiological traits as affected by root endophytic fungus Piriformospora indica under combined drought and mechanical stresses. Planta 2018, 247, 1229–1245. [Google Scholar] [CrossRef] [PubMed]
  24. Zhang, W.; Wang, J.; Xu, L.; Wang, A.; Huang, L.; Du, H.; Qiu, L.; Oelmüller, R. Drought stress responses in maize are diminished by Piriformospora indica. Plant Signal. Behav. 2017, 13, e1414121. [Google Scholar] [CrossRef] [PubMed]
  25. Ghaffari, M.R.; Mirzaei, M.; Ghabooli, M.; Khatabi, B.; Wu, Y.; Zabet-Moghaddam, M.; Mohammadi-Nejad, G.; Haynes, P.A.; Hajirezaei, M.R.; Sepehri, M.; et al. Root endophytic fungus Piriformospora indica improves drought stress adaptation in barley by metabolic and proteomic reprogramming. Environ. Exp. Bot. 2019, 157, 197–210. [Google Scholar] [CrossRef]
  26. Liu, B.; Jing, D.; Liu, F.; Ma, H.; Liu, X.; Peng, L. Serendipita indica alleviates drought stress responses in walnut (Juglans regia L.) seedlings by stimulating osmotic adjustment and antioxidant defense system. Appl. Microbiol. Biotechnol. 2021, 105, 8951–8968. [Google Scholar] [CrossRef] [PubMed]
  27. Trzewik, A.; Marasek-Ciolakowska, A.; Orlikowska, T. Protection of highbush blueberry plants against Phytophthora cinnamomi using Serendipita indica. Agronomy 2020, 10, 1598. [Google Scholar] [CrossRef]
  28. Qu, P.; Zhang, Z.; Li, R.; Liu, R.; Zhang, Y.; Cheng, C. Insights into the rooting and growth-promoting effects of endophytic fungus Serendipita indica in blueberry (Vaccinium corymbosum). J. Plant Growth Regul. 2024. [Google Scholar] [CrossRef]
  29. Cheng, C.; Liu, F.; Wang, B.; Qu, P.; Liu, J.; Zhang, Y.; Liu, W.; Tong, Z.; Deng, G. Influences of Serendipita indica and Dictyophorae echinovolvata on the growth and fusarium wilt disease resistance of banana. Biology 2022, 11, 393. [Google Scholar] [CrossRef]
  30. Bütehorn, B.; Rhody, D.; Franken, P. Isolation and characterisation of pitef1 encoding the translation elongation factor ef-1α of the root endophyte Piriformospora indica. Plant Biol. 2000, 2, 687–692. [Google Scholar] [CrossRef]
  31. Evans, J.R.; Santiago, L.S. PrometheusWiki Gold Leaf Protocol: Gas exchange using LI-COR 6400. Funct. Plant Biol. 2014, 41, 223–226. [Google Scholar] [CrossRef] [PubMed]
  32. Yang, R.; Yang, Y.; Hu, Y.; Yin, L.; Qu, P.; Wang, P.; Mu, X.; Zhang, S.; Xie, P.; Cheng, C.; et al. Comparison of bioactive compounds and antioxidant activities in differentially pigmented cerasus humilis fruits. Molecules 2023, 28, 6272. [Google Scholar] [CrossRef]
  33. Ghazanfar, B.; Cheng, Z.; Ahmad, I.; Khan, A.R.; Liu, H.; Haiyan, D.; Fang, C. Synergistic and individual effect of Glomus etunicatum root colonization and acetyl salicylic acid on root activity and architecture of tomato plants under moderate NaCl stress. Pak. J. Bot. 2015, 47, 2047–2054. [Google Scholar]
  34. Kim, D.; Langmead, B.; Salzberg, S.L. HISAT: A fast spliced aligner with low memory requirements. Nat. Methods 2015, 12, 357–360. [Google Scholar] [CrossRef]
  35. Pertea, M.; Pertea, G.M.; Antonescu, C.M.; Chang, T.C.; Mendell, J.T.; Salzberg, S.L. StringTie enables improved reconstruction of a transcriptome from RNA-seq reads. Nat. Biotechnol. 2015, 33, 290–295. [Google Scholar] [CrossRef] [PubMed]
  36. Love, M.I.; Huber, W.; Anders, S. Moderated estimation of fold change and dispersion for RNA-seq data with DESeq2. Genome Biol. 2014, 15, 550. [Google Scholar] [CrossRef]
  37. Vonapartis, E.; Mohamed, D.; Li, J.; Pan, W.; Wu, J.; Gazzarrini, S. CBF4/DREB1D represses XERICO to attenuate ABA, osmotic and drought stress responses in Arabidopsis. Plant J. 2022, 110, 961–977. [Google Scholar] [CrossRef]
  38. Zhang, Y.; Liu, F.; Wang, B.; Wu, H.; Wu, J.; Liu, J.; Sun, Y.; Cheng, C.; Qiu, D. Identification, characterization and expression analysis of anthocyanin biosynthesis-related bHLH genes in blueberry (Vaccinium corymbosum L.). Int. J. Mol. Sci. 2021, 22, 13274. [Google Scholar] [CrossRef] [PubMed]
  39. Wang, Y.; Cao, J.-L.; Hashem, A.; Abd_Allah, E.F.; Wu, Q.-S. Serendipita indica mitigates drought-triggered oxidative burst in trifoliate orange by stimulating antioxidant defense systems. Front. Plant Sci. 2023, 14, 1247342. [Google Scholar] [CrossRef]
  40. Hosseini, F.; Mosaddeghi, M.R.; Dexter, A.R. Effect of the fungus Piriformospora indica on physiological characteristics and root morphology of wheat under combined drought and mechanical stresses. Plant Physiol. Bioch. 2017, 118, 107–120. [Google Scholar] [CrossRef]
  41. Yaghoubian, Y.; Goltapeh, E.M.; Pirdashti, H.; Esfandiari, E.; Feiziasl, V.; Dolatabadi, H.K.; Varma, A.; Hassim, M.H. Effect of Glomus mosseae and Piriformospora indica on growth and antioxidant defense responses of wheat plants under drought stress. Agr. Res. 2014, 3, 239–245. [Google Scholar] [CrossRef]
  42. Ghabooli, M.; Khatabi, B.; Ahmadi, F.S.; Sepehri, M.; Mirzaei, M.; Amirkhani, A.; Jorrín-Novo, J.V.; Salekdeh, G.H. Prote-omics study reveals the molecular mechanisms underlying water stress tolerance induced by Piriformospora indica in barley. J. Proteom. 2013, 94, 289–3017. [Google Scholar] [CrossRef]
  43. Abid, M.; Ali, S.; Qi, L.K.; Zahoor, R.; Tian, Z.; Jiang, D.; Snider, J.L.; Dai, T. Physiological and biochemical changes during drought and recovery periods at tillering and jointing stages in wheat (Triticum aestivum L.). Sci. Rep. 2018, 8, 4615. [Google Scholar] [CrossRef]
  44. Garipova, S.R.; Markova, O.V.; Fedorova, K.A.; Dedova, M.A.; Kamaletdinova, A.A.; Lastochkina, O.V.; Pusenkova, L.I. Malondialdehyde and proline content in bean cultivars following the inoculation with endophytic bacteria. Acta Physiol. Plant 2022, 44, 89. [Google Scholar] [CrossRef]
  45. Xu, L.; Wang, A.; Wang, J.; Wei, Q.; Zhang, W. Piriformospora indica confers drought tolerance on Zea mays L. through enhancement of antioxidant activity and expression of drought-related genes. Crop J. 2017, 5, 251–258. [Google Scholar] [CrossRef]
  46. Wang, A.; Wang, L.; Liu, K.; Liang, K.; Yang, S.; Cao, Y.; Zhang, L.; Wang, A.; Wang, L.; Liu, K.; et al. Comparative transcriptome profiling reveals the defense pathways and mechanisms in the leaves and roots of blueberry to drought stress. Fruit Res. 2022, 2, 18. [Google Scholar] [CrossRef]
  47. Fan, X.; Lin, B.; Yin, Y.; Zong, Y.; Li, Y.; Zhu, Y.; Guo, W. Unraveling the molecular mechanisms of blueberry root drought tolerance through yeast functional screening and metabolomic profiling. Plants 2024, 13, 3528. [Google Scholar] [CrossRef]
  48. Feng, X.; Bai, S.; Zhou, L.; Song, Y.; Jia, S.; Guo, Q.; Zhang, C. Integrated analysis of transcriptome and metabolome provides insights into flavonoid biosynthesis of blueberry leaves in response to drought stress. Int. J. Mol. Sci. 2024, 25, 11135. [Google Scholar] [CrossRef]
  49. Muhammad Aslam, M.; Waseem, M.; Jakada, B.H.; Okal, E.J.; Lei, Z.; Saqib, H.S.A.; Yuan, W.; Xu, W.; Zhang, Q. Mechanisms of abscisic acid-mediated drought stress responses in plants. Int. J. Mol. Sci. 2022, 23, 1084. [Google Scholar] [CrossRef]
  50. Zareen, S.; Ali, A.; Yun, D.-J. Significance of ABA biosynthesis in plant adaptation to drought stress. J. Plant Biol. 2024, 67, 175–184. [Google Scholar] [CrossRef]
  51. Tenhaken, R. Cell wall remodeling under abiotic stress. Front. Plant Sci. 2015, 5, 771. [Google Scholar] [CrossRef] [PubMed]
  52. Coutinho, F.S.; Rodrigues, J.M.; Lima, L.L.; Mesquita, R.O.; Carpinetti, P.A.; Machado, J.P.B.; Vital, C.E.; Vidigal, P.M.; Ramos, M.E.S.; Maximiano, M.R.; et al. Remodeling of the cell wall as a drought-tolerance mechanism of a soybean genotype revealed by global gene expression analysis. aBIOTECH 2021, 2, 14–31. [Google Scholar] [CrossRef] [PubMed]
  53. Zhao, Y.; Yang, X.; Zhang, J.; Huang, L.; Shi, Z.; Tian, Z.; Sha, A.; Lu, G. Thaumatin-like protein family genes VfTLP4-3 and VfTLP5 are critical for faba bean’s response to drought stress at the seedling stage. Plant Physiol. Bioch. 2024, 206, 108243. [Google Scholar] [CrossRef] [PubMed]
  54. He, L.; Li, L.; Zhu, Y.; Pan, Y.; Zhang, X.; Han, X.; Li, M.; Chen, C.; Li, H.; Wang, C. BolTLP1, a thaumatin-like protein gene, confers tolerance to salt and drought stresses in broccoli (Brassica oleracea L. Var. italica). Int. J. Mol. Sci. 2021, 22, 11132. [Google Scholar] [CrossRef]
Figure 1. The influences of P. indica colonization on the drought tolerance of blueberry plants. (A) Phenotypes of blueberry seedings under well-watered and drought stress conditions. CK: non-colonized control; PI: P. indica-colonized; CK-WW: well-watered CK plants; PI-WW: well-watered PI plants; CK-DS: drought stress-treated CK plants; PI-DS: drought stress-treated PI plants. (BE) Effects of P. indica colonization on chlorophyll a, chlorophyll b, total chlorophyll and carotenoids contents in blueberry leaves, respectively. Chl: chlorophyll. Different letters above columns represent significant difference among samples at p < 0.05 level.
Horticulturae 11 00605 g001
Figure 2. Influences of P. indica colonization on the photosynthesis- and chlorophyll fluorescence-related parameters of blueberry plants under well-water and drought stress conditions. (A) Pn (net photosynthetic rate); (B) Ci (intercellular CO2 concentration); (C) Gs (stomatal conductance); (D) Ts (transpiration rate); (E) qP (photochemical quenching); (F) qN (non-photochemical quenching); (G) ETR (electron transport rate); (H) Fm’ (the maximum chlorophyll fluorescence yield under illumination); (I) Fv’/Fm’ (capture efficiency of excitation energy). Different letters above columns represent significant difference among samples at p < 0.05 level.
Horticulturae 11 00605 g002
Figure 3. Effect of P. indica-colonization on root activity and antioxidant ability-related parameters in blueberry roots. (A) Root activity, (BD) POD activity, SOD activity and CAT activity in blueberry roots, respectively. (E,F) The contents of MDA and Pro in blueberry roots, respectively. FW: fresh weight. Different letters above columns represent significant difference among samples at p < 0.05 level.
Horticulturae 11 00605 g003
Figure 4. Statistical analysis of differentially expressed genes (DEGs) identified in the four comparisons. (A) Numbers of DEGs identified in each comparison; (B) Venn diagram analysis results of differentially expressed genes of each comparison.
Horticulturae 11 00605 g004
Figure 5. Stress-, metabolism- and regulation-related differentially expressed genes identified from the CK-WW vs. CK-DS (A,C,E) and the PI-WW vs. PI-DS (B,D,F) comparisons.
Horticulturae 11 00605 g005
Figure 6. GO (A) and KEGG (B) enrichment analysis results of differentially expressed genes identified in each comparison. The abscissa represents rich factor. The redder the color of the circle, the more significant the enrichment of DEGs involved in this GO term or KEGG pathway.
Horticulturae 11 00605 g006
Figure 7. Weighted gene co-expression network analysis results of DEGs. (A) Clustering dendrogram of DEGs. (B) Correlation between different sample groups and each module. * represents significant correlation. (C) heatmap plot for DEGs from different modules. (D,G,J,M) Expression pattens of DEGs in MEmagenta, MEturquoise, MEblack and MEblue modules. (E,H,K,N) GO enrichment analysis results of DEGs from the MEmagenta, MEturquoise, MEblack and MEblue module, respectively. (F,I,L,O) Gene co-expression network for hub DEGs from the MEmagenta, MEturquoise, MEblack and MEblue module, respectively.
Horticulturae 11 00605 g007
Figure 8. Quantitative real-time PCR verification results of selected genes. POD: peroxidase; TPP: trehalose-phosphate phosphatase; TLP: thaumatin-like protein; FAD: FAD binding domain protein; LTP: lipid-transfer protein; WRKY: WRKY transcription factor; ASR: abscisic stress ripening protein; DREB1D: Dehydration-responsive element-binding protein 1B-like. Different lowercase letters above columns represent significant difference between samples at p < 0.05 level.
Horticulturae 11 00605 g008
Disclaimer/Publisher’s Note: The statements, opinions and data contained in all publications are solely those of the individual author(s) and contributor(s) and not of MDPI and/or the editor(s). MDPI and/or the editor(s) disclaim responsibility for any injury to people or property resulting from any ideas, methods, instructions or products referred to in the content.

