Abstract
Yellow sticky traps (YSTs) are common tools for monitoring the greenhouse whitefly (GWF), Trialeurodes vaporariorum Westwood (Hemiptera: Aleyrodidae), which can cause significant yield reduction in different greenhouse crops such as cucumber and tomato. In recent years, sticky traps equipped with green light-emitting diodes (LEDs) have also been (successfully) tested for catching GWFs. However, no study has observed GWF population dynamics at low population densities using such LED traps for early pest detection in crop stands. Therefore, a greenhouse experiment was conducted aiming to investigate the correlation between GWF populations on tomato crops (Solanum lycopersicum L. (Solanaceae)) and the numbers caught on yellow sticky traps and green LED traps, respectively. A small number of whiteflies was released into two pest-free greenhouse cabins, and populations on plants and traps were monitored for the duration of two months. The results show that the GWFs caught on LED traps correlate significantly positive with the population density on the tomato crops. Such a correlation was not found for standard YSTs. Moreover, the results indicate the possibility of early pest detection using LED traps. The findings are discussed in the context of the whiteflies’ ecology and population dynamics in greenhouses.
1. Introduction
The greenhouse whitefly (GWF), Trialeurodes vaporariorum Westwood (Hemiptera: Aleyrodidae), is an important pest in greenhouse crops, such as tomato, cucumber and capsicum [1]. The effective monitoring of this pest is of great importance because it takes up large amounts of phloem sap, reducing yields by more than 50% [2]. Additionally, the greenhouse whitefly is able to transmit plant viruses [3,4] and produces honeydew that supports fungal growth, affecting the photosynthetic effectiveness [2,5]. Yellow sticky traps are a common tool for whitefly and beneficial insect monitoring as they detect pests frequently [6]. Moreover, whitefly counts on these traps can correlate with the actual pest density on the crop [7], which is of great significance for decision-making in plant protection management [6,7]. Additionally, early pest detection plays a major role in biocontrol [6] as it helps in controlling pests already at a low population density. In the last two decades, common sticky traps have been further developed by adding light-emitting diodes (LEDs), aiming to improve pest monitoring [8,9,10,11,12,13]. Even though LED traps are more expensive than standard sticky traps, LEDs offer some advantages. For example, they emit a narrow light spectrum, which can be adjusted to the most attractive color of the target insect [14]. Furthermore, LED traps provide constant light emission during the day and night, and their light intensity can not only be adjusted [14] but also changed and fully scheduled. These and other properties make LEDs a potentially potent tool for improved insect monitoring. Some studies [8,9,10,11,12] showed increased trap catches of whiteflies and other pest insects such as thrips [13] on LED traps in controlled environments and/or crops in greenhouses compared to standard sticky traps. Nevertheless, green LED traps did not always catch significantly more whiteflies compared to YSTs [9,12], especially under no-choice situations. Moreover, none of these studies investigated LED traps as a tool to improve the assessment of whitefly population development in a crop stand and its possibility for early pest detection at low insect densities. For the western flower thrips Pergande (Frankliniella occidentalis), ref. [13] already showed improved monitoring—that is, earlier and more accurate monitoring of the thrips population density—by using blue LED traps in a greenhouse crop. Parallel to this, we hypothesized that the green LED trap, which was shown by [9] to be more attractive than a YST, performs better in a tomato crop in the greenhouse compared to a common YST, with regard to assessing the whitefly population by insects trapped. Additionally, investigating the performance of the two different trap types as tools for early monitoring was addressed by a low initial whitefly population density. The result of this study will help to improve whitefly monitoring in greenhouses and consequently pest management decisions.
2. Materials and Methods
2.1. LED Traps
Traps with eight green (521 nm) LEDs (NCSG219BT-V1 SMD; Nichia Corporation; Anan, Japan) were constructed based on the LED traps used by [9,13] (Figure 1). A yellow (non-sticky) plate (size: 11.5 × 16 cm; IVOG biotechnical systems; Neusäß Vogelsang, Germany) served as the background of the trapping area. The light of all LED traps was set to the same intensity (0.27 µmol/m−2*s−1, measured at a distance of 1 m) by using an LED driver (500 mA; LCM-40; MEAN WELL; New Taipei City, Taiwan). The light intensity and light spectrum were measured with a light meter (LI 250 with Quantum Sensor LI-190; LI-COR Biosciences; Bad Homburg, Germany) and a spectrometer (AvaSpec-2048-2; Avantes, Apeldoorn, The Netherlands) in complete darkness prior to the experiment. A double-sided adhesive tape and a plastic foil coated with insect glue (Insektenleim; Temmen; Hattersheim-Edersheim, Germany) were attached to the LED traps to make them sticky.
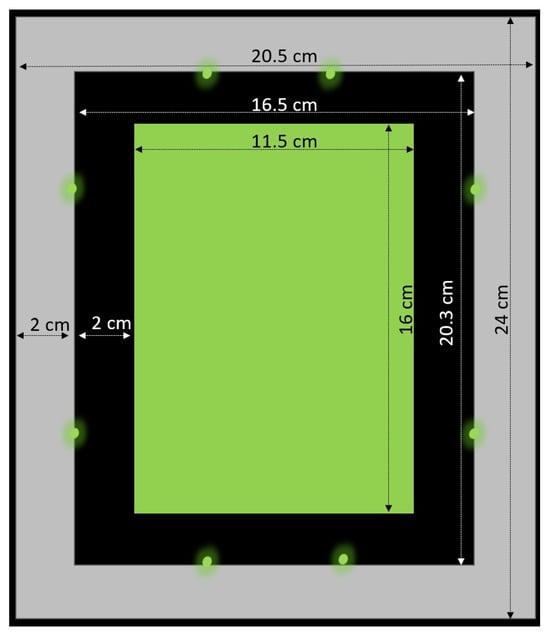
Figure 1.
Schematic of the LED trap equipped with eight green LEDs (521 nm) that were used in the experiments ([9,13] edited).
2.2. Insect Materials and Handling
Trialeurodes vaporariorum Westwood (Hemiptera: Aleyrodidae) was reared on tomato plants (Solanum lycopersicum), cv. “Brioso” (Rijk Zwaan; De Lier, The Netherlands), in custom-made wooden cages (approx. 30 × 30 × 40 cm) at the Leibniz Universität Hannover, Germany. Rearing cages were placed in a room with a 23 °C climate. Greenhouse whiteflies were collected in a glass vial (25 mL; Carl Roth; Karlsruhe, Germany). Beneficial insects (Diglyphus isaea, Phytoseiulus persimilis and Amblyseius californicus) were ordered from Katz Biotech (Baruth, Germany) and released in the greenhouse directly after delivery.
2.3. Plant Materials
Tomato plants cv. “Brioso” were individually cultivated in plastic pots (13 cm diameter) with standard soil substrate (Substrat 1; Klasmann-Deilmann; Geeste, Germany). Plants grew in the plant nursery at approximately 23 °C and were watered on a daily basis. No pesticides or beneficial insects were used, except for nematodes (Steinernema feltiae) against fungus gnats. Plants were used for the experiments when five to six true leaves were present.
2.4. Experimental Setup
The general setup of this experiment is based on the setup used in [13,15,16]. In 2021, two plantings were conducted in two large 63 m2 (size: 9 × 7 m) greenhouse cabins. In each cabin, forty tomato plants were set up as two double rows, containing ten plants per single row (Figure 2). Plants were potted in 10 L pots containing standard soil substrate (Substrat 1; Klasmann-Deilmann; Geeste, Germany) and 50 g long-term fertilizer (Neudorff Azet® Tomato Fertilizer; W. Neudorff; Emmerthal, Germany). An automated dripping system (Gardena “Flexcontrol”; GARDENA; Ulm, Germany) was used for watering the plants. Plants were fertilized (Wuxal® Top N; AGLUKON Spezialdünger; Düsseldorf, Germany), harvested and pruned manually as needed. At the height of 2.2 m, plant tip was cut off and the two highest side shoots were grown downwards. In the first planting, two LED traps were hung within each double row in cabin-2 (total of four traps/cabin). Yellow sticky traps were cut to the same size as the LED traps (11.5 × 16 cm; IVOG Biotechnical Systems, Neusäß Vogelsang, Germany) and attached to a dummy LED trap, which was turned off. Yellow sticky traps were used in cabin-1, avoiding the interference of the light emitted by the LED trap. Trap types were switched between cabins for the second planting—that is, LED traps were installed in cabin-1 and YST in cabin-2, respectively. Traps were placed at the height of the plant canopy of the two adjacent evaluation plants and adjusted every week due to plant growing. Traps were first installed three days after the initial release of forty adult whiteflies (unknown sex) and were replaced on a weekly basis just prior to insect counting. Insects of interest—that is, whitefly adults and larvae—were counted on nine leaves at eight plants per cabin (=72 leaves/cabin) in a non-destructive manner. Leaves were chosen randomly from three different heights of each plant (three leaves from each lower/middle/upper section), and both sides of the leaf were evaluated. Traps were analyzed in the laboratory using a stereomicroscope (Leica Camera, Wetzlar, Germany). Data were sampled from calendar week 31 to 38 (first planting) and 43 to 50 (second planting). Temperature and light conditions were recorded in each cabin using a data logger (HOBO Pendant®; Onset Computer Corporation; Bourne, MA, USA). Diglyphus isaea (calendar weeks 32/34) and a mixture of Phytoseiulus persimilis/Amblyseius cucumeris (calendar week 33) were applied in the first planting due to an infestation by tomato leaf miners and spider mites. No beneficial insects were used in the second planting.

Figure 2.
Schematic of the experimental setup of the first run in the two greenhouse cabins with either LED traps (A) or YSTs (B). Squares represent individual cucumber plants set up in two double-rows (each row consisting of 10 plants). X mark the release point of T. vaporariorum at start of the experiment. Grey fields (1–8) mark the eight sampling plants. The bold (LED) or lattice (YST) lines between grey fields mark the location of the four traps. Trap one was placed between plant 1 and 2, trap two between plant 3 and 4, trap three between plant 5 and 6 and trap four between plant 7 and 8, respectively.
2.5. Statistical Analysis
Data were analyzed with RStudio v.4.2.1 (R Studio, Boston, MA, USA). Count data were (log+1) transformed before fitting linear mixed models (GWFs on plants were the fixed effect and plants in the neighborhood and calendar week were the random effects) using regression (R-package: “lme4”). Plants in the neighborhood were plant 1 and plant 2 for trap 1; plant 3 and plant 4 were for trap 2; plant 5 and plant 6 were for trap 3; and plant 7 and plant 8 were for trap 4. Linear models were fitted to investigate climatic differences between the cabins and plantings (cabin and planting were the response variables). The models´ goodness of fit was investigated by the hnp-function (R-package: “hnp”) and explored visually through qqplots. The Wilcoxon rank-sum test was used for the direct comparison of whitefly catches on different trap types. Trap catches were treated as independent samples (technical replicates).
3. Results
3.1. Temperature and Ambient Light Conditions over Time
Since temperature influences the development of the whitefly population and its activity, the temperature over time is described in the following. Temperatures were similar in both greenhouse cabins in the first (F1,2368 = 2.09, p = 0.148) and second planting (F1,2362 = 0.1449, p = 0.703), respectively. The average temperatures in the first planting ranged from 25.71 ± 2.7 °C (mean ± SD, week 35) to 27.14 ± 4.09 °C (week 33) in cabin-1 and 25.52 ± 2.69 °C (week 38) to 26.89 ± 3.96 °C (week 33) in cabin-2 (Figure 3A).
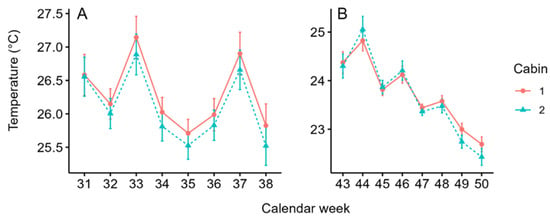
Figure 3.
Average (±SD) temperature in cabin-1 (solid red) and cabin-2 (dashed blue) during the first (A) and second (B) planting.
In the second planting, average temperatures ranged from 22.69 ± 0.96 °C (week 50) to 24.82 ± 2.76 °C (week 44) in cabin-1 and 22.43 ± 1.05 °C (week 50) to 25.05 ± 3.49 °C (week 44) in cabin-2 (Figure 3B). Average temperatures were 2.48 °C higher in the first planting (26.19 °C ± 3.15) compared the second (23.71 °C ± 1.92) planting (F1,4732 = 938.8, p < 0.001).
Since the ambient light intensity can influence the attractiveness of YSTs and LED traps, it is described in the following. Ambient light intensity (Lux) differed significantly between cabin-1 and cabin-2 in the first planting (F1,2368 = 18.52, p < 0.001) but was similar in the second planting (F1,2362 = 0.1298, p = 0.719). The average light intensity in the first planting ranged from 3431.41 ± 5242.55 Lux (week 38) to 5200.09 ± 8152.51 Lux (week 31) in cabin-1 and 4432.32 ± 6740.85 Lux (week 34) to 7125.04 ± 12,289.59 Lux (week 37) in cabin-2.
In the second planting, average light intensity ranged from 686.40 ± 945.37 Lux (week 47) to 2199.95 ± 4377.67 Lux (week 44) in cabin-1 and 799.22 ± 1075.90 Lux (week 47) to 2274.46 ± 3557.14 Lux (week 44) in cabin-2. Light intensity was 3.87 times higher in the first (5127.78 Lux ± 8462.83) than the second (1326.55 Lux ± 2127.84) planting (F3,4730 = 154.4 p < 0.001).
3.2. Whitefly Population over Time
Whitefly populations on the plants were similar in both cabins in the first (Wilcoxon test: p = 0.054) and second planting (Wilcoxon test: p = 0.456). In the first planting, on average, 0.01 ± 0.06 (mean ± SD) and 0.05 ± 0.18 adult whiteflies per leaf were counted in cabin-1 and cabin-2, respectively. The maximum number of whiteflies per leaf reached 0.03 ± 0.17 individuals in cabin-1 (calendar weeks 32 and 38) and 0.14 ± 0.45 in cabin-2 (calendar week 35) (Figure 4A).
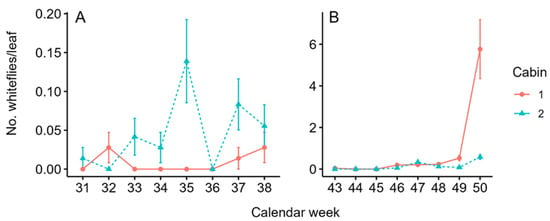
Figure 4.
Mean (±SD) number of whiteflies per tomato leaf in cabin-1 (solid red line) and cabin-2 (dashed blue line) during the first (A) and second (B) planting, respectively. Nine leaves on each eight plants (n = 72) were sampled. Note the different scales between the panels.
In the second planting, on average, 0.87 ± 1.86 and 0.15 ± 0.33 adult whiteflies per leaf were counted in cabin-1 and cabin-2, respectively. The maximum number of whiteflies per leaf was 5.76 ± 12.04 in cabin-1 (calendar week 50) and 0.58 ± 0.99 in cabin-2 (calendar week 50) (Figure 4B).
3.3. Attractiveness of the Different Trap Types
In the first planting, the LED traps caught 1.87 times more whiteflies than the YSTs, but no significant difference was observed (Wilcoxon test: p = 0.211). The number of whiteflies per trap ranged from 0.50 ± 0.82 (calendar week 37) to 23.25 ± 15.06 (calendar week 35) on LED traps and from 0.50 ± 0.96 (calendar week 34) to 10.25 ± 4.43 (calendar week 36) on YSTs (Figure 5A).

Figure 5.
Mean (±SD) number of whiteflies per LED trap (solid line, green circles) and YST (dashed line, yellow points) in the first (A) and second (B) planting. The mean calculated is based on four sticky traps per cabin per week.
In the second planting, YSTs caught 3.04 times more whiteflies than the LED traps, but no significant difference was observed (Wilcoxon test: p = 0.111). The number of whiteflies per trap ranged from 0.50 ± 0.58 (calendar weeks 44 and 45) to 40.00 ± 35.67 (calendar week 48) on LED traps and from 1.00 ± 0.82 (calendar week 44, 45 and 46) to 108.00 ± 73.11 (calendar week 48) on YSTs (Figure 5B).
No difference in trap catches was observed when data from both plantings were pooled (Wilcoxon test: p = 0.736).
3.4. Regressions—What LED and Common Sticky Traps Can and Cannot Tell Us about Whitefly Population Dynamics
Whitefly counts on LED traps did not correlate with adult GWFs on the plants in the first planting (y = 1.60 + 0.15x, p = 0.541) (Figure 6A, Table S1) but did in the second planting (y = 1.13 + 0.49x, p = 0.002) (Figure 6B, Table S1). Yellow sticky traps showed no significant correlation in either planting (first planting: y = 1.35 + 0.10x, p = 0.828; second planting: y = 2.52 + 0.04x; p = 0.863) (Figure 6C,D, Table S1).
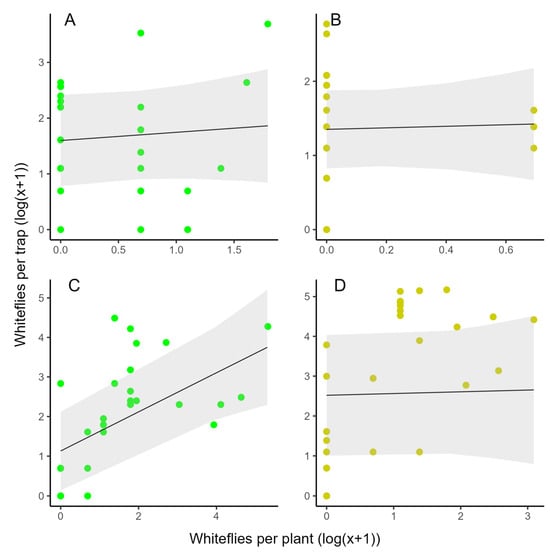
Figure 6.
Linear regression models to visualize the correlation between the mean T. vaporariorum on a LED (green) or sticky trap (yellow) and the sum of whiteflies on the two neighboring plants (n = 18) in the first (A,B) and second (C,D) planting. Data are on a log(x + 1) scale.
When data from the first and second planting were pooled, count data on LED traps correlated significantly with GWF adults on the plants (y = 1.36 + 0.40x, p = 0.002) (Figure 7A, Table S1), whereas catches on the YST did not correlate (y = 1.90 + 0.19x; p = 0.377) (Figure 7B, Table S1).
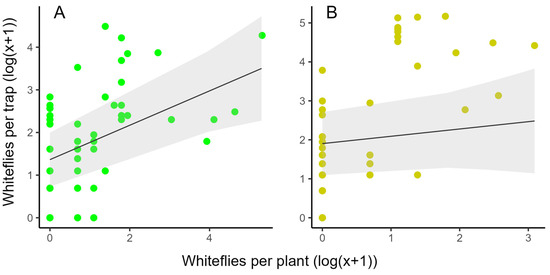
Figure 7.
Linear regression models to visualize the correlation between the mean T. vaporariorum on a LED trap (A, green dots) or yellow sticky trap (B, yellow dots) and the sum of whiteflies on the two neighboring plants (n = 18) in both plantings. Data from the first and second planting are pooled and on a log(x + 1) scale.
4. Discussion
The results indicate that green LED traps perform better at whitefly monitoring than common yellow sticky traps when assessing the pest population density on the crop. Although both trap types caught similar numbers of whiteflies, LED traps can detect the pest earlier than YSTs, and the steeper slope allows for more precise threshold estimates.
In general, the whitefly population developed, as expected, at a low level. Since just one whitefly per plant was initially released, we also expected to find only few individuals on the sampling plants. The increase in whiteflies on the plants three to four weeks after the start of the experiment can be explained by the short life cycle of the greenhouse whitefly. At the here-measured temperatures, whiteflies develop within 21 to 25 days (=three to four weeks) from egg to adult [17], which is also true for our study. However, the strong increase in the whiteflies sampled on the leaves in cabin-1 in week 50 remains unclear. We can only speculate that this might be due to a massive hatching of offspring in this week.
Although population densities were low during both plantings, green LED traps and YSTs caught significant numbers of whiteflies. Overall, none of the trap types was significantly more attractive than the other. This is in line with [9,12], who observed similar the attractiveness of LED traps and YSTs in no-choice situations, as also suggested in our experiment. Moreover, ref. [9] explained this observation by limited flight activity and the overall low number of GWFs present. Since many GWFs were found on the traps, flight activity seems not to be the limiting factor. Therefore, the low population density of whiteflies in general can explain the here-observed pattern of the similar numbers of GWFs caught on the two trap types.
During the first planting, numbers of GWF catches in the first week were much higher on LED traps than on YSTs, which could indicate the early detection of pests in the greenhouse by LED traps. Additionally, more whiteflies than initially released were caught on LED traps in the beginning of the first planting, indicating whitefly migration into the greenhouse to the LED traps. This supports once more the hypothesis of green LED traps monitoring GWFs early, as freshly immigrating GWFs infesting the crop were immediately detected. In contrast, trap counts were the same for both trap types in the first week of the second planting. Therefore, no clear picture of green LED traps detecting the GWFs earlier than YSTs can be drawn from our weekly results, even though first indications are given. Consequently, more studies with shorter counting intervals are necessary to investigate this hypothesis under greenhouse conditions.
Both trap types detected GWFs in the greenhouse, but only catches on LED traps correlate with whitefly population densities on tomato crops. This is not in line with [7], who have shown that the numbers of whiteflies caught on YSTs can correlate well with the population density on the crop. The most likely reason for this contradictory result is the extremely small number of whiteflies counted on the plants during both plantings and the high number of GWFs caught on the YSTs due to a high number of immigrations. Therefore, care should be taken when taking results from LED traps under certain conditions—i.e., in greenhouses without insect screens to reduce GWF movements and in open polytunnel growing environments—to mean they are more precise than YSTs for whitefly population monitoring.
Apart from whitefly monitoring, another important observation could be made: during the first planting, the release of Diglyphus isaea as a natural enemy to control the tomato leaf miner Liriomza bryoniae was necessary. In a monitoring context, it could be observed that the beneficial insects were not trapped on LED traps at all. This is of great importance for the implementation of LED traps as monitoring tools in practice because the effectivity of biocontrol measures should not be disrupted [18]. However, studies similar to [13,18] are necessary to further investigate whether and how the LED traps used here affect other beneficial insects.
To our knowledge, this is the first study investigating whitefly population development with LED traps in a tomato crop stand. Whitefly catches on green LED traps correlated well with the number of whiteflies on the crop. Nevertheless, further studies are necessary to investigate the performance of LED traps in practice at different whitefly population densities, with shorter monitoring intervals (daily) and additional releases of important natural enemies of GWFs.
Supplementary Materials
The following supporting information can be downloaded at: https://www.mdpi.com/article/10.3390/horticulturae10090960/s1, Table S1: Regression analysis.
Author Contributions
B.G. and R.M. conceived and designed research. B.G. conducted experiments B.G. analyzed data. B.G. and R.M. wrote the manuscript. B.G. and R.M. reviewed and edited the manuscript. Supervision and money acquisition: R.M. All authors have read and agreed to the published version of the manuscript.
Funding
The project was supported by funds of the Federal Ministry of Food and Agriculture (BMEL, FKZ: 2818506B18) based on a decision of the Parliament of the Federal Republic of Germany via the Federal Office for Agriculture and Food (BLE) under the innovation support program.
Data Availability Statement
The data that support the research findings of this study are available at https://doi.org/10.25835/k7m0hh7s [19] accessed on 5 September 2024.
Acknowledgments
We thank Andreas Olsowski for technical support. Moreover, we thank Eric Mühlnikel and Alexander Wilhelm for support in the greenhouse.
Conflicts of Interest
The authors declare no conflicts of interest. The funders had no role in the design of the study; in the collection, analyses, or interpretation of data; in the writing of the manuscript; or in the decision to publish the results.
References
- Mound, L.A.; Halsey, S.H.; Halsey, S.H. Whitefly of the World: A Systematic Catalogue of the Aleyrodidae (Homoptera) with Host Plant and Natural Enemy Data; Wiley: Chichester, UK, 1978; ISBN 0471996343. [Google Scholar]
- Byrne, D.N.; Bellows, T.S., Jr. Whitefly Biology. Annu. Rev. Entomol. 1991, 36, 431–457. [Google Scholar] [CrossRef]
- Salazar, L.F.; Müller, G.; Querci, M.; Zapata, J.L.; Owens, R.A. Potato yellow vein virus: Its host range, distribution in South America and identification as a crinivirus transmitted by Trialeurodes vaporariorum. Ann. Appl. Biol. 2000, 137, 7–19. [Google Scholar] [CrossRef]
- Duffus, J.E.; Liu, H.-Y.; Wisler, G.C. Tomato infectious chlorosis virus a new clostero-like virus transmitted by Trialeurodes vaporariorum. Eur. J. Plant Pathol. 1996, 102, 219–226. [Google Scholar] [CrossRef]
- Weber, H. Lebensweise und Umweltbeziehungen von Trialeurodes vaporariorum (Westwood) (Homoptera-Aleurodina); Erster Beitrag zu einer Monographie dieser Art; Zeitschrift für Morphologie und Ökologie der Tiere; Springer: Berlin, Germany, 1934; Volume 2, pp. 268–305. [Google Scholar]
- Pinto-Zevallos, D.M.; Vänninen, I. Yellow sticky traps for decision-making in whitefly management: What has been achieved? J. Crop Prot. 2013, 47, 74–84. [Google Scholar] [CrossRef]
- Böckmann, E.; Hommes, M.; Meyhöfer, R. Yellow traps reloaded: What is the benefit for decision making in practice? J. Pest. Sci. 2015, 88, 439–449. [Google Scholar] [CrossRef]
- Chen, T.-Y.; Chu, C.-C.; Henneberry, T.J.; Umeda, K. Monitoring and Trapping Insects on Poinsettia with Yellow Sticky Card Traps Equipped with Light-emitting Diodes. HortTechnology 2004, 14, 337–341. [Google Scholar] [CrossRef]
- Stukenberg, N. LED Based Trapping of Whiteflies and Fungus Gnats: From Visual Ecology to Application. Ph.D. Thesis, Leibniz Universität Hannover, Hannover, Germany, 2018. [Google Scholar]
- Chu, C.C.; Jackson, G.C.; Alexander, P.J.; Karut, K.; Henneberry, T.J. Plastic Cup Traps Equipped with Light-Emitting Diodes for Monitoring Adult Bemisia tabaci (Homoptera: Aleyrodidae). J. Econ. Entomol. 2003, 96, 543–546. [Google Scholar] [CrossRef] [PubMed]
- Otieno, J.A.; Stukenberg, N.; Weller, J.; Poehling, H.-M. Efficacy of LED-enhanced blue sticky traps combined with the synthetic lure Lurem-TR for trapping of western flower thrips (Frankliniella occidentalis). J. Pest. Sci. 2018, 91, 1301–1314. [Google Scholar] [CrossRef]
- McCormack, K. Enhancing the Monitoring and Trapping of Protected Crop Pests by Incorporating LED Technology into Existing Traps. Ph.D. Thesis, University of Edinburgh, Edinburgh, UK, 2015. [Google Scholar]
- Grupe, B.; Meyhöfer, R. Blue LED trap and commercial lure improve western flower thrips (Frankliniella occidentalis) monitoring in cucumber crops. J. Pest. Sci. 2024; open access. [Google Scholar] [CrossRef]
- Stukenberg, N.; Gebauer, K.; Poehling, H.-M. Light emitting diode (LED)-based trapping of the greenhouse whitefly (Trialeurodes vaporariorum). J. Appl. Entomol. 2015, 139, 268–279. [Google Scholar] [CrossRef]
- Dieckhoff, C.; Meyhöfer, R. If Only You Could Catch Me—Catch Me If You Can: Monitoring Aphids in Protected Cucumber Cultivations by Means of Sticky Traps. Horticulturae 2023, 9, 571. [Google Scholar] [CrossRef]
- Grupe, B.; Dieckhoff, C.; Meyhöfer, R. Keep an eye on natural enemies: What Aphidius on sticky traps tells us about aphid pest population dynamics. Entomol. Exp. Appl. 2023, 171, 722–731. [Google Scholar] [CrossRef]
- Burnett, T. The Effect of Temperature on an Insect Host-Parasite Population. Ecology 1949, 30, 113–134. [Google Scholar] [CrossRef]
- Grupe, B.; Meyhöfer, R. LED traps in commercial greenhouses: A field study report on Encarsia formosa by-catch. Entomol. Exp. Appl. 2024; accepted. [Google Scholar]
- Grupe, B.; Meyhöfer, R. LED Traps Enhance Monitoring of Trialeurodes vaporariorum in Greenhouse Grown Tomato [Data Set]; LUIS: Hannover, Germany, 2024. [Google Scholar] [CrossRef]
Disclaimer/Publisher’s Note: The statements, opinions and data contained in all publications are solely those of the individual author(s) and contributor(s) and not of MDPI and/or the editor(s). MDPI and/or the editor(s) disclaim responsibility for any injury to people or property resulting from any ideas, methods, instructions or products referred to in the content. |
© 2024 by the authors. Licensee MDPI, Basel, Switzerland. This article is an open access article distributed under the terms and conditions of the Creative Commons Attribution (CC BY) license (https://creativecommons.org/licenses/by/4.0/).