Article

The Effect of Yeast Inoculation Methods on the Metabolite Composition of Sauvignon Blanc Wines

1
Biological Chemistry and Bioactives Group, The New Zealand Institute for Plant and Food Research Limited, Auckland 1025, New Zealand
2
Viticulture and Oenology Group, The New Zealand Institute for Plant and Food Research Limited, Blenheim 7201, New Zealand
3
Marine Products Team, The New Zealand Institute for Plant and Food Research Limited, Nelson 7010, New Zealand
*
Author to whom correspondence should be addressed.
Fermentation 2023, 9(8), 759; https://doi.org/10.3390/fermentation9080759
Submission received: 27 June 2023 / Revised: 8 August 2023 / Accepted: 11 August 2023 / Published: 14 August 2023

Abstract

:
Evidence from the literature suggests that different inoculation strategies using either active dry yeast (ADY) or freshly prepared yeast cultures affect wine yeast performance, thus altering biomass and many primary and secondary metabolites produced during fermentation. Here, we investigated how different inoculation methods changed the fermentation behaviour and metabolism of a commercial wine yeast. Using a commercial Sauvignon blanc (SB) grape juice, fermentation was carried out with two different inoculum preparation protocols using Saccharomyces cerevisiae X5: rehydration of commercial ADY and preparation of pre-inoculum in a rich laboratory medium. We also determined the effect of different numbers of yeast cells inoculation (varying from 1 × 10⁶ to 1 × 10¹²) and successive inoculation on fermentation and end-product formation. The yeast inoculation method and number of cells significantly affected the fermentation time. Principal component analysis (PCA) using 60 wine metabolites showed a separation pattern between wines produced from the two inoculation methods. Inoculation methods influenced the production of amino acids and different aroma compounds, including ethyl and acetate esters. Varietal thiols, 3-mercaptohexanol (3MH), and 4-methyl-4-mercaptopentan-2-one (4MMP) in the wines were affected by the inoculation methods and numbers of inoculated cells, while little impact was observed on 3-mercaptohexyl acetate (3MHA) production. Pathway analysis using these quantified metabolites allowed us to identify the most significant pathways, most of which were related to central carbon metabolism, particularly metabolic pathways involving nitrogen and sulphur metabolism. Altogether, these results suggest that inoculation method and number of inoculated cells should be considered in the production of different wine styles.

1. Introduction

Winemaking is a complex process that involves interactions between different biotic and abiotic factors, including temperature, pH, juice composition, and wine yeasts. Wine yeast plays a vital role in determining the quality and style of wine by directly affecting the production of aroma and other flavour active compounds during fermentation [1,2]. Wine yeast cells are also exposed to multiple stresses (e.g., ethanol toxicity, starvation, heat, and oxidative stress) during winemaking that affect their growth, viability, fermentation capability, and, as a result, end-product (e.g., aroma compounds) formation [3,4]. Moreover, uneven distribution of nutrients and conditions present within the fermentation tank also may affect the growth and metabolism of wine yeasts.
The inoculation of fermentation tanks with a starter culture of wine yeast is a relatively new practice that has only been employed since the early 1970s. Now, many wineries follow this practice mainly because it offers better process control by providing successful completion of fermentation and consistent end-product formation [5]. Although rehydration of commercially available active dry yeasts (ADY) is mostly used by wineries to inoculate the grape must, many researchers are still concerned about the viability and fermentation performances of those wine yeasts [6,7]. The cell membranes of wine yeasts can be damaged during rehydration of ADY, thus causing the loss of cytoplasmic contents [8]. Moreover, inappropriate storage temperatures and the condition of the ADY also affect the lipid composition of the cell membranes, especially by increasing the concentrations of saturated fatty acids, which in turn reduces the viability of the yeast cells [9].
It has been reported previously that ADY cultures are less viable than wet yeast cultures, thus leading to decreased fermentation performance [6]. Therefore, some studies have already been conducted to determine the most appropriate and effective ways of wine yeast rehydration, including addition of different nutrients during the rehydration, and optimization of rehydration conditions [6,10,11,12,13,14,15]. For instance, Kontkanen, Inglis, Pickering and Reynolds [10] studied the effects of inoculation rate, acclimatisation, and nutrient addition on ice wine fermentation, and they found that stepwise-acclimatized (in grape juice) yeast cells fermented more sugar and thus produced more ethanol than direct inoculum. They also noted that nutrient addition to the yeast inoculum increased the biomass production, decreased fermentation time, and reduced ethanol and acetic acid concentrations in the ice wines. In particular, nutrient addition (e.g., glutathione, vitamins, and unsaturated fatty acids) while rehydrating the ADY has been recommended to increase the vitality and to improve the aroma profiles of wines [7,16,17]. Other researchers have shown that the amount of yeast inoculum significantly affects wine fermentation by changing the production of aroma compounds [18,19]. Therefore, the yeast inoculum preparation step is important and plays a direct role in the fermentation kinetics and in the production of different fermentation end products.
Although ADY is commonly used in commercial wine fermentation in New Zealand, most of the laboratory-scale winemaking here is still performed by using a pre-inoculum of wine yeast grown on an enriched medium (e.g., yeast extract peptone dextrose) under highly aerated conditions [20,21,22]. It is noteworthy that good aeration of the pre-inoculum provides the molecular oxygen essential for the development of the components of yeast membranes, such as ergosterol [23]. As a result, cell viability increases significantly, and the yeast cells can survive different stresses (e.g., osmotic and ethanol stress) effectively; thus, they might show better fermentation efficiency than the ADY cells. Therefore, the formation of different aroma compounds and other end products (e.g., ethanol, glycerol, and acetic acid) also could be affected by the type and quantity of inoculum used for winemaking. However, more research is needed to confirm this.
To fill the current knowledge gap, our main goal for this project was to determine the effects of two different wine yeast inoculation protocols—rehydration of ADY and inoculum preparation using enriched medium—on fermentation time and other wine parameters. We determined the primary and secondary metabolites in the resulting wines to understand how the inoculum method and quantity impacts the formation of different fermentation end products and thus overall wine composition.

2. Materials and Methods

2.1. Collection and Characterization of Sauvignon Blanc Juice

A commercial, cold-settled Sauvignon blanc (SB) grape juice was collected in the 2017 harvesting year from the Pernod Ricard winery (Marlborough, New Zealand). The juice was brought to room temperature (20 °C) and chemically sterilised by adding 400 µL/L of food grade dimethyl dicarbonate (DMDC, Sigma-Aldrich, Germany), followed by vigorous mixing. In aqueous conditions, DMDC reacts rapidly with proteins to inactivate yeast cells, and any unreacted DMDC then breaks down into methanol and carbon dioxide [24]. DMDC-treated juices were kept at 20 °C overnight prior to starting the fermentation process [25].
The total soluble solids content (°Brix) of the starting fresh juice was determined on a Mettler Toledo RM40 refractometer (Mettler Toledo, Columbus, OH, USA), while a Mettler Toledo T70 autotitrator was used for determining the acidity (pH) and acid content (titratable acidity). Total acid content was measured using an equivalence point titration with aqueous sodium hydroxide (0.1 M) as the titrant and calculated in tartaric acid equivalents (g/L) [26].
Glucose and fructose contents of the fresh juice were quantified by enzymatic assay kit purchased from Megazyme (Wicklow, Ireland) based on the reduction of nicotinamide adenine dinucleotide phosphate (NADP). Samples were appropriately diluted and quantified in duplicate against an eight-point standard curve (R2 > 0.98) [27].
Primary amino acids (PAA) were quantified in duplicate in isoleucine (N) equivalents using the orthophthaldialdehyde (NOPA) method adapted for the plate reader. Quantification was performed using a five-point calibration curve (R2 > 0.98). Ammonium content of the fresh juice was quantified by enzymatic assay kit obtained from Megazyme (Bray, Ireland) by monitoring the deprotonation of NADPH at 340 nm. Juice was appropriately diluted (usually two-fold) and quantified in duplicate using a five-point standard curve (R2 > 0.98). Yeast available nitrogen (YAN) was calculated as the sum of PAA plus ammonium expressed in mg N/L.
Optical density of the juice was determined in duplicate in a UV-transparent 96-well micro-plate at 280, 320, and 420 nm. Absorbance at 280 nm was used to quantify total phenolics against a gallic acid standard curve (five-point, R2 > 0.98) [28].
All spectrophotometric assays were run on a Molecular Devices Spectramax 384 Plus (San Jose, CA, USA) with a 1 cm path length cuvette reference correction.

2.2. Different Inoculum Preparation Methods

Saccharomyces cerevisiae X5 (Laffort, Bordeaux, France) was used for the inoculation of the microferments. Two different inoculation protocols were used in this study as described below and shown in Figure 1.

2.2.1. Rehydration of Commercial ADY (RY)

Commercial ADY (S. cerevisiae X5) was rehydrated following the protocol used by the research winery of The New Zealand Institute for Plant and Food Research Limited [28]. Briefly, 30 mL amount of distilled water in a beaker was kept in a water bath at 32–35 °C, and 0.25 gm to 3 gm of ADY was added to the beaker depending on inoculated cell numbers and kept for 20 min without stirring. Then, the beaker was removed from the water bath and stirred and then sat on the bench for another 15 min. The beaker with rehydrated wine yeasts was transferred to a chiller room to acclimatise them to a cooler temperature (15 °C). Inoculation of grape juices was carried out within 45 min to avoid the loss of viability of the rehydrated wine yeasts.

2.2.2. Preparation of Pre-Inoculum in a Rich Growth Medium (PI)

S. cerevisiae X5 was grown in a rich culture medium, YPD broth (1% bacto-yeast extract, 2% bacto-yeast peptone and 2% D-glucose), as described in Pinu, Jouanneau, Nicolau, Gardner and Villas-Boas [25]. A single colony of the yeast grown in YPD agar was inoculated into 30 mL of YPD broth in a series of 150 mL conical flasks (n = 50) and was incubated at 28 °C, with shaking at 200 rpm for 24 h. Good aeration of the pre-inoculum provides molecular oxygen, which is essential for the development of components of yeast membranes, such as ergosterol, which helps yeast cells to tolerate high concentrations of ethanol under anaerobic conditions [29]. Pre-inoculums were centrifuged at 3000 rpm for 5 min, and the YPD supernatant was discarded, and the yeast pellets were then washed twice with sterilised milliQ distilled water to remove any YPD residues on the cells. The cell pellet was resuspended with sterilised milliQ distilled water as required prior to inoculating the grape juice [22]. Cell counts and viability testing were carried out prior to determining the required amount of inoculum for each treatment described in Section 2.3.

2.3. Counting of Yeast Cells and Viability Testing

Prior to conducting the final fermentation experiments, a number of trial experiments were performed to determine the cell numbers and viability for both of the inoculation methods. As available methods for cell counting have both merits and demerits, especially when counting the higher number of cells we used in this study, we compared two methods to determine the viability of cells: using YPD medium and using a hemocytometer as described below. Yeast cells were prepared as described in Section 2.2.1 and Section 2.2.2. YPD medium was inoculated with yeast cell suspension (100 µL) from both protocols and incubated at 28 °C for 36 h. After that, visible colonies were counted as CFU/mL. While awaiting for yeast cells to grow in YPD medium, the same suspensions were used to determine the number of yeast cells from both methods using a Neubauer hemocytometer as described in Pinu [30]. Briefly, a 1/20 dilution of culture was made and transferred to hemocytometer for counting cell number per mL; the dilution was needed so that cell numbers of 10 squares ranged between 30 and 400. A cover slip was placed on the hemocytometer, and yeast cells were counted in five of the large squares in two separate counting chambers under a 40× objective. Budding yeast cells were counted as one cell unless they were the same size as the parent cell. Yeast cells on the top and left edges of the squares were counted, but cells on the bottom and right edges were not counted. From these cell count data, the volume of pre-culture required to inoculate 1 × 10⁶ to 1 × 10¹² yeast cells per mL of the final fermentation was determined (Figure 1). Methylene blue (0.1%) was used to assess the number of viable yeast cells. A 1:1 dilution of pre-culture was mixed with methylene blue and incubated for 5 min at room temperature and yeast cells were counted as described before. Viable cells appeared as colourless, as they reduced methylene blue, and dead cells were stained blue. The viability of cells from both counting methods was determined. Viability for RY culture was around 75% in cells grown in YPD medium, while it was 80% for PI. Approximately 75% of cells were viable for both inoculation protocols in cell counting by using a Neubauer hemocytometer. As the results were within similar ranges, and growing yeast cells in YPD medium needed 36 h of incubation time, we decided to use hemocytometer to count the cells during our final experiment. However, it is noteworthy that viability testing using YPD medium is more reliable than the microscopy-based methods.

2.4. Experimental Design and Wine Fermentation

Fermentation was carried out in 750 mL bottles using 700 mL of sterilised grape juice (Figure 1). The inoculum for each bottle was prepared separately to adjust to the right amount of cell numbers, and inoculation was also performed separately with 250 µL of inoculum to avoid dilution and extra nutrient inoculation in case of RY. The experiment was designed to determine the effects of two different yeast inoculation protocols on different primary and secondary metabolites produced by wine yeasts compared with control wines.
The control wines for both methods (RY and PI; n = 4) were inoculated with approximately 1 × 10⁶ yeast cells/mL. A set of ferments was inoculated with increased numbers of approximate yeast cells, namely 1 × 10⁸ (n = 3), 1 × 10¹⁰ (n = 3) and 1 × 10¹² (n = 3) in the must, as shown in Figure 1. Successive inoculation was also carried out for both methods: treatment 1= 1 × 10⁶, then 1 × 10⁶ at 10 and 0 °Brix (n = 4) and treatment 2 = 1 × 10⁶, then 1 × 10⁶ at 0 °Brix (n = 4) (Figure 1). Yeast cells and their viability were determined within 3 h of inoculating the ferments using hemocytometer (see Section 2.3, data in Table S1).
All the microferments were kept in a chiller room at 15 °C without any agitation. However, the contents were slightly mixed every day by swirling the bottles slowly to avoid any loss of fermenting grape juice. Soluble solids content (measured as °Brix) and temperature were monitored daily during fermentation using an Anton-Paar DMA 35 portable density meter. Once °Brix values dropped below 0, residual sugars were monitored daily using Clinitest®. When residual sugars reached less than 2.0 g/L as determined by an enzymatic assay kit, the ferments were stopped with the addition of 50 ppm SO2 (as potassium metabisulphite) and kept at the chiller (15 °C) overnight and centrifuged at 4600 rpm for 5 min using a Thermo Scientific Heraeus Multifuge 3SR+ centrifuge (Thermo Fisher Scientific, Waltham, MA, USA) prior to taking them to the laboratory for chemical analysis.

2.5. Analysis of the Resulting Wines

All the resulting wines were analysed to determine their acidity (pH and titratable acidity), sugar content (reducing sugars, glucose, and fructose), and total phenolics, as described in Section 2.2. Alcohol was determined using an Anton Parr Wine Alcolyzer (Graz, Austria).

2.5.1. Varietal Thiols

Thiols, 3-mercaptohexanol (3-MH), 3-mercaptohexyl acetate (3-MHA), and 4-mercapto-4-methylpentan-2-one (4-MMP) were extracted and analysed by Hill Laboratories Limited according to Green et al. [31]. In summary, varietal thiols in defrosted wines were analysed by headspace–solid-phase micro-extraction (HS-SPME) with gas chromatography–two-dimensional mass spectrometry (GC-MS/MS). Wine sub-samples were pipetted into 10 mL headspace vials with NaCl added to “salt-out” thiols into the headspace. Vials were capped, and then, deuterated internal standards for 3MHA and 3MH were robotically added to each vial through the cap septa. Each sample was buffered to pH 6.5–7.0 with phosphate buffer before analysis to avoid losses of thiols. Samples and calibration standards were extracted by SPME (polyacrylate, 85 lm coating supplied by Supelco, Bellefonte, PA, USA), using a robotic CTC CombiPal auto-sampler (Agilent Technologies, Santa Clara, CA, USA). For analysis, the SPME fibre was inserted into the hot (270 °C) GC inlet to desorb extracted thiols. Injections were in splitless mode, with a 0.75 mm i.d. glass liner (Restek, Bellefonte, PA, USA) at a temperature of 270 °C. Thiols were separated from co-extracted wine volatiles on a HP-5MS capillary column (30 m × 0.25 mm i.d. × 0.25 lm film thickness, Agilent Technologies, Santa Clara, CA, USA).

2.5.2. Aroma Compounds

Wine aroma compounds belonging to esters, higher alcohols, volatile fatty acids, c6 compounds, and terpenes were quantified following the method described by Herbst-Johnstone et al. [32] using SPME-GC-MS. Briefly, 10 mL of defrosted wine was mixed with 3.5 g of sodium chloride and transferred to an Agilent 20 mL amber screw cap vial. A mixture of deuterated internal standards in methanol was added; each sample was purged briefly with argon gas and sealed with a screw cap. Samples were placed for agitation and left for further automated analysis. The GC-MS system was an Agilent 7890A GC System coupled to 5975C mass selective detector. MassHunter software (v. B.05.00) (Agilent Technologies, Santa Clara, CA, USA) was used for data analysis, and aroma compounds were quantified using calibration curves. Odour activity value (OAV), which is the ratio of concentrations to perception thresholds, was determined to evaluate the impact of aroma compounds [22].

2.5.3. Organic Acids

A Shimadzu Prominence high-performance liquid chromatography (HPLC) (Shimadzu Corporation, Kyoto, Japan) system was used to quantify organic acids (tartaric, malic, ascorbic, shikimic, citric, and succinic acids) in wines using isocratic elution with a phosphate buffer (140 mM, pH 2.4) on an Allure Organic Acids Restek column (5 µm, 240 × 4.6 mm). Defrosted wine samples were diluted 10-fold in a solution containing internal standard (thiourea) and filtered through a 0.45 µm syringe filter before injection [33]. Samples were run in duplicate and quantified on a five-point standard curve. The correlation coefficient (R2) of actual versus predicted concentration was >0.98.

2.5.4. Amino Acids

Quantification of amino acids in wines was performed on an Agilent 1200 series HPLC (Santa Clara, CA, USA) using a gradient elution programme of phosphate/borate buffer (10 mM each, pH 8.2) and organic solvent (MeOH: MeCN: H2O, 45:45:10) on a Phenomenex Kinetix C18 column (5 µm, 240 × 4.6 mm) as described in Martin, Grose, Fedrizzi, Stuart, Albright, and McLachlan [28]. Briefly, online derivatization of primary amino acids was carried out with o-phthalaldehyde and 3-mercaptopropionic acid and detected by a diode array detector (DAD) at 340 nm excitation and 450 nm emission. Defrosted wine samples were treated with iodoacetic acid to encourage in the reduction of cysteine. Secondary amino acids were derivatized online with 9-fluorenylmethyl chloroformate and detected by DAD (260 nm excitation, 315 nm emission). A standard mix of 17 amino acids was purchased from Agilent (Santa Clara, CA, USA). All standards and samples contained internal standards sarcosine (100 mg/L) and α-aminobutyric acid (100 mg/L). Samples were diluted 4-fold in water and filtered through a 0.45 µm syringe filter before injection. Samples were run in duplicate and quantified on a four-point standard curve (R2 > 0.98) [34].

2.6. Statistical Analysis

Independent Student’s t-tests were performed to compare the changes in different parameters (e.g., alcohol content, varietal thiols concentrations, and other oenological parameters) of each treatment (e.g., two methods of inoculation, different numbers of cell inoculation, and successive inoculation) compared with their respective controls using an in-house R script. False-discovery rates (FDR) were calculated to account for multiple comparisons [27]. Principal component analysis (PCA), hierarchical cluster analysis (HCA), and two-way ANOVA were performed using a web interface, namely Metaboanalyst 5.0 (http://www.metaboanalyst.ca, accessed during 10–17 April 2023) [35]. Heatmaps were also produced to show the changes in different primary and secondary metabolites due to the inoculation method used in this study [35]. Pathway analysis was also performed based on the primary and secondary metabolites quantified in the resulting wines using S. cerevisiae as the pathway library to determine the pathways that were significantly affected due to inoculation methods. Global test and relative-betweenness centrality algorithms were selected for pathway enrichment and pathway topology analyses, respectively [27]. Debiased sparse partial correlation (DSPC) networks were created based on Basu et al. [36] using the Network analysis function in Metaboanalyst 5.0 with the quantified metabolites, for which KEGG ID is available.

3. Results and Discussion

Pre- and post-fermentation manipulations are often performed to produce a desired style of wine, often by changing the metabolism of wine yeasts [37,38]. Many other factors also can be modified and optimised (e.g., temperature, grape juice composition, and even the preparation of starting culture) to obtain different fermentation end products by wine yeasts. In this study, we determined how inoculum preparation protocols and inoculated yeast cell numbers affect overall fermentation behaviour of a commercial wine yeast strain and how these approaches change wine metabolite composition.

3.1. Fermentation Completion Time Depended on the Type of Inoculation Methods

Prior to fermentation, we determined the oenological properties of the starting commercial SB juice: pH 3.2, TA (total acidity) 8.1 g/L total soluble solids content 19.2 °Brix, and total reducing sugars 207.8 g/L (glucose 112.3 g/L and fructose 95.5 g/L). The YAN of the starting juice was 195 mg/L; therefore, no nitrogen adjustment prior to starting fermentation was performed, as YAN > 150 of the must is enough to avoid stuck fermentation [18]. Immediately after the yeast inoculation, we determined the cell numbers and their viability from each ferments. While approximately 75% cells were viable for inoculation protocols prior to inoculation, this number was around 70% in the ferments in the beginning of fermentation. This is not unexpected, as grape juice is a comparatively harsh media with low pH and high sugars. Moreover, typical New Zealand SB fermentation is carried out at 15 °C, which might have also affected the adaptation of the yeast cells into the ferments [37].
Our fermentation data clearly indicated that the ferments inoculated with rehydrated ADY (RY) were completed at least 4–5 days earlier than the ferments inoculated with pre-inoculum prepared in YPD medium (PI) (Table 1). Ferments inoculated with increased numbers of yeast cells also finished the fermentation one or two days earlier than the control ferments. Although an already-published study claimed that yeast cells were more viable and performed better during fermentation when a pre-inoculum was prepared in a highly aerated rich medium [6], our data from this experiment were not in agreement. However, ADY was also produced in highly aerated conditions, dried, and packed with nutrients and adjuvants, which might have a role in increased fermentation performance [7]. The ferments that underwent successive inoculation were deliberately kept for longer, although residual sugars were below 2 g/L. Therefore, we did not compare their fermentation completion time with other ferments. Overall, our data suggest that yeast inoculation protocol and inoculum quantity indeed affect the fermentation performance of wine yeasts.

3.2. No significant Change Was Observed on Different Oenological Properties of the Wines Based on Inoculation Methods

Table 1 also shows the oenological parameters of the wines produced in this study. We observed no significant difference in pH, TA, glucose, or total phenolic content of the wines compared with those of their respective control wines. As expected, glucose was almost completely consumed by the wine yeasts regardless of the inoculum preparation method or other treatments. However, fructose consumption varied among the ferments. For instance, less fructose was consumed when ferments were inoculated with increased numbers of yeast cells (for both RY and PI). This observation was expected, as it is well known that glucose is the most preferred and utilised carbon source for S. cerevisiae during fermentation [39]. On the other hand, yeast cells in ferments that were successively inoculated used more fructose than their controls. This is mainly because these ferments were kept for longer times, although their residual sugar concentrations were less than 2 g/L. Under fermentation condition, S. cerevisiae tends to utilise glucose at the beginning of fermentation, and once glucose is depleted, the cells start to consume fructose and other preferred carbon sources [39]. Our data suggest that fermentation stop time can influence the consumption of major sugars by wine yeasts during fermentation.
All the ferments had less than 12% v/v of alcohol, which is slightly lower than a typical “full-strength” New Zealand SB (12.5–13.5% v/v) [40]. As the TSS of the starting juice was 19.2 °Brix, the ethanol content reported here was within expectation. Although no statistically significant change was observed in the alcohol contents of the resulting wines because of the different treatments used in this study, we noted a trend of reduced alcohol when increased numbers of yeast cells were inoculated in the ferments (both RY and PI) (Table 1). Potential reasons behind this pattern could be the formation of other fermentation end products instead of ethanol or the metabolism of alcohol by higher number of yeast cells used during the experiment. However, as we found no statistical difference between the alcohol measurements, we did not explore this further here.

3.3. Inoculation Methods Altered the Overall Metabolite Composition of the Resulting Wines

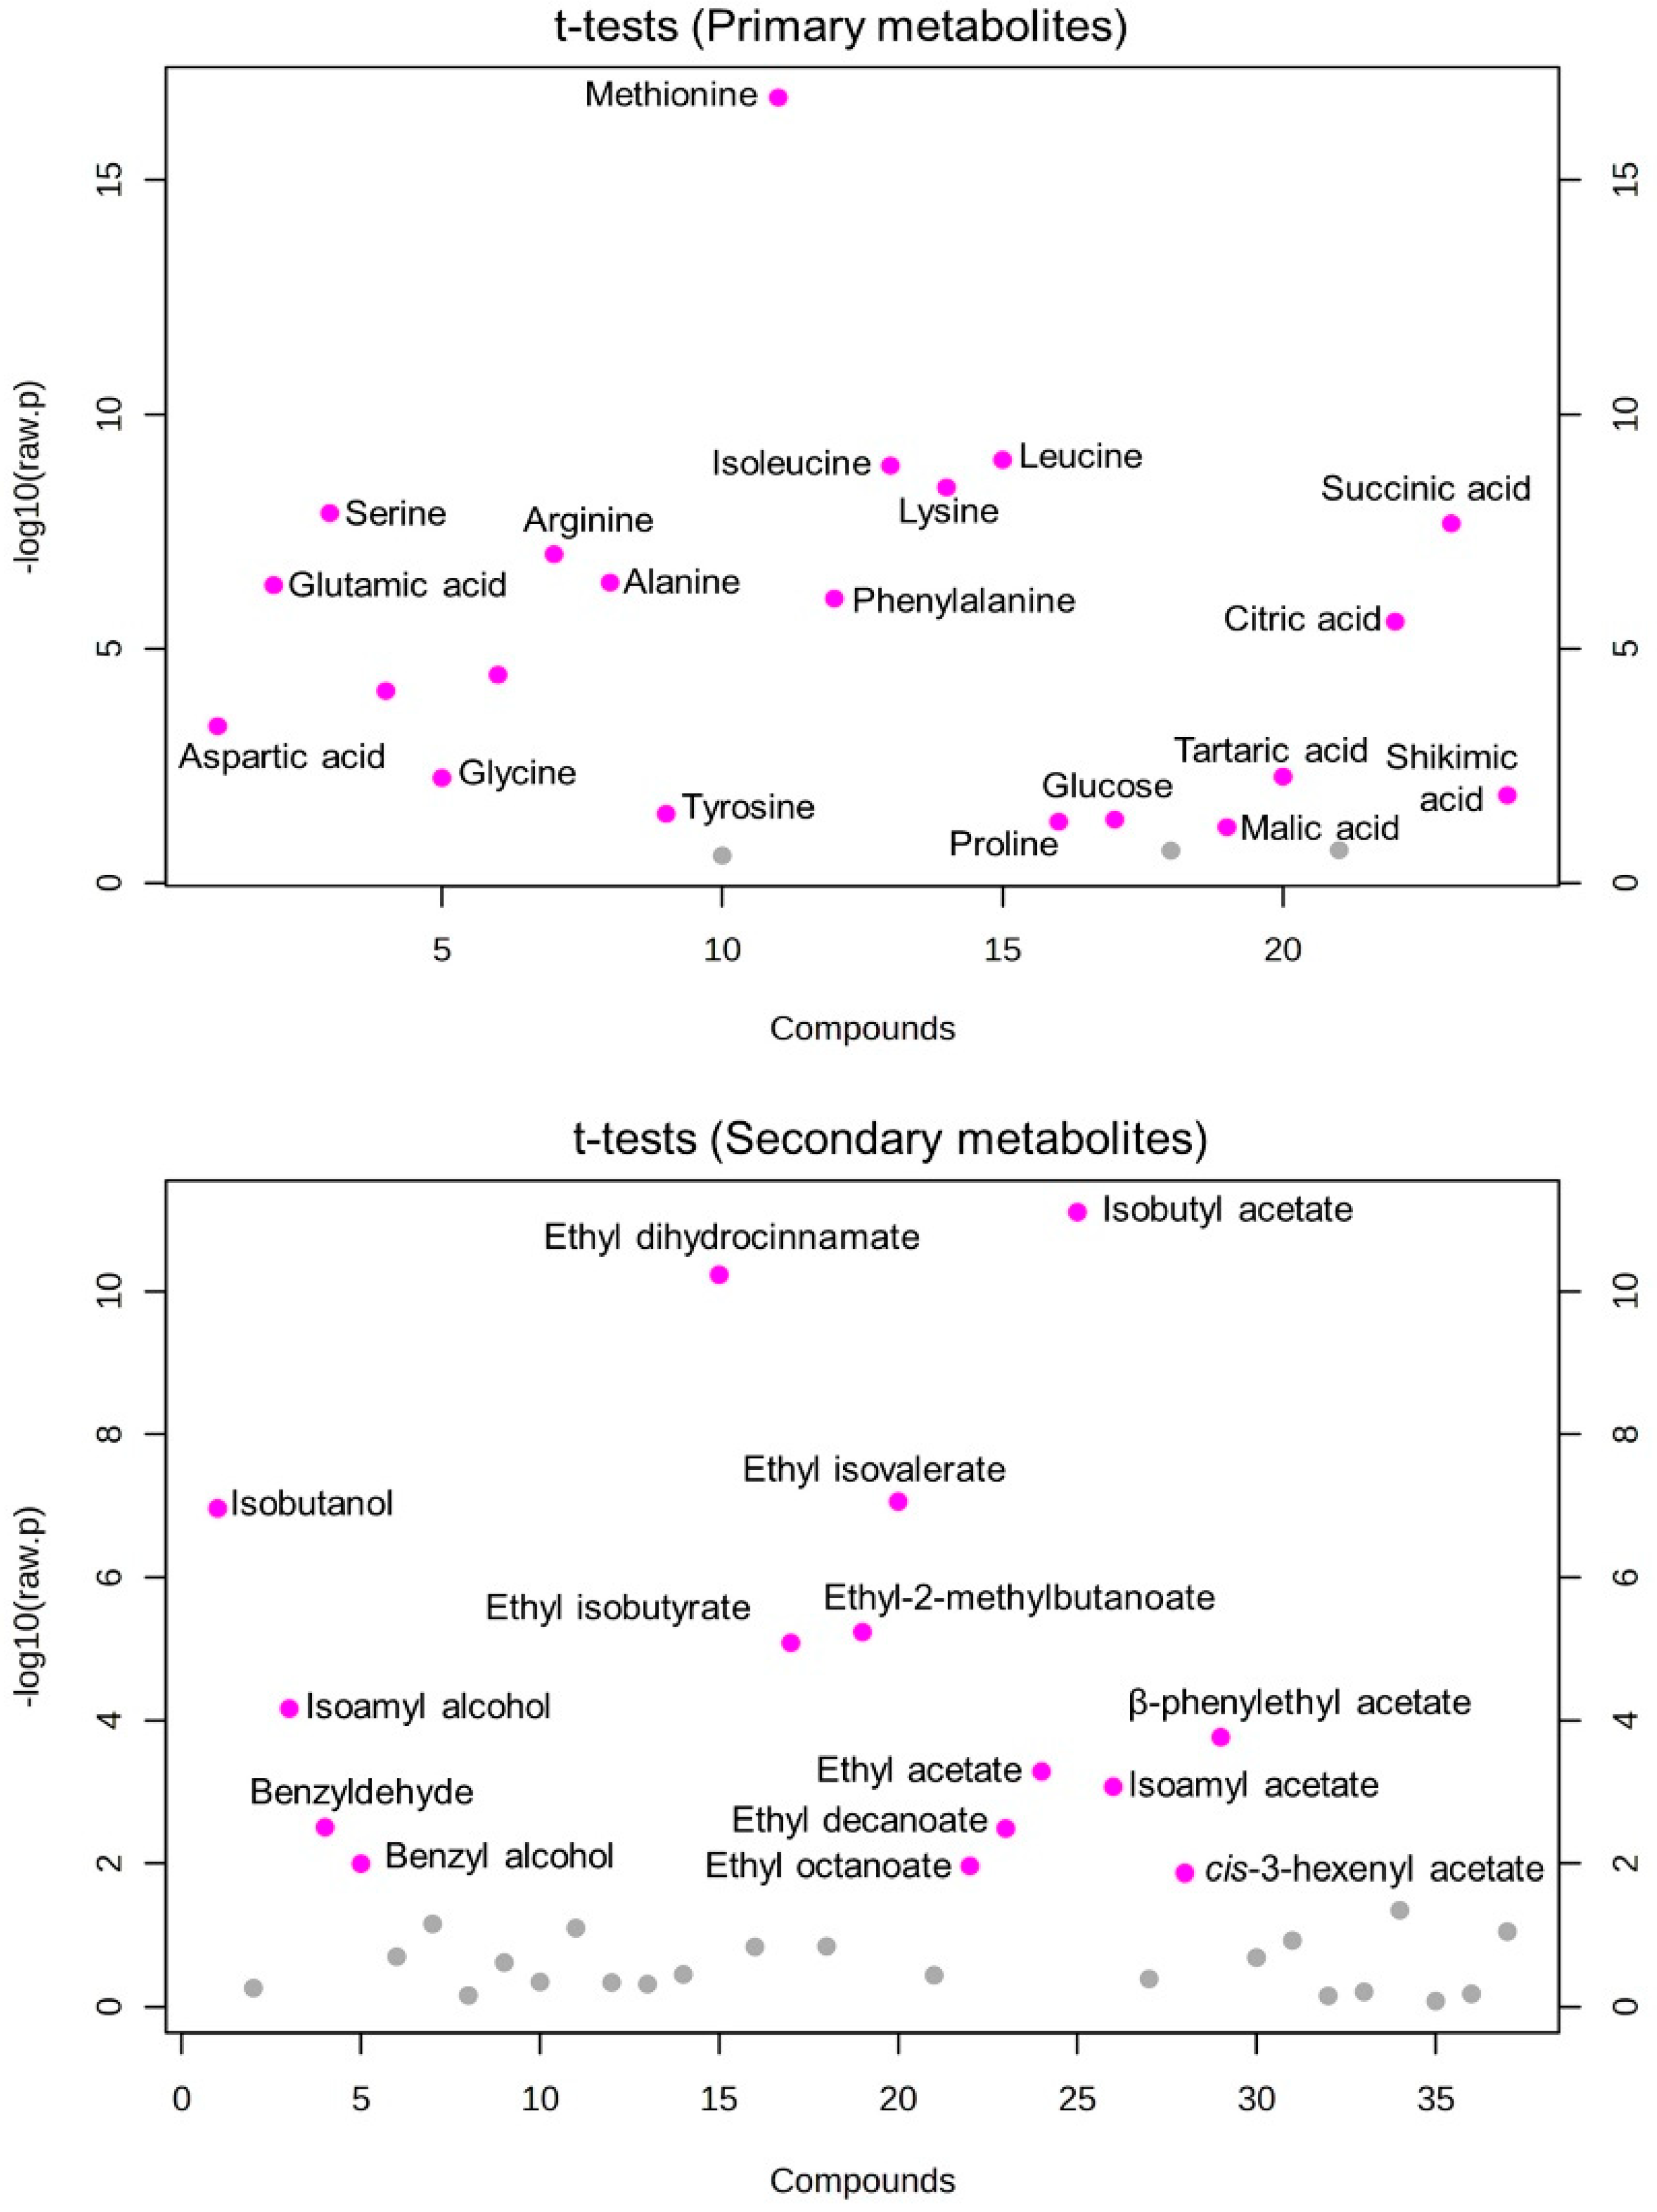
To understand the effect of different wine yeast inoculation strategies, we determined absolute quantification of 24 primary metabolites (2 major sugars, and16 amino and 6 carboxylic acids) and 37 aroma compounds, including varietal thiols, higher alcohols, esters, terpenoids, and norisoprenoids. We analysed varietal thiol data separately given that they are key aroma compounds for SB wines (see Section 3.4). The concentrations of these compounds were within the ranges of previously published data of SB wines [22,40,41]. While comparing controls from two inoculation methods, we found that 21 primary metabolites were significantly different. The evaluation of secondary metabolites revealed that 15 aroma compounds, including 11 esters, 3 alcohols, and 1 aldehyde, were significantly different (p < 0.05, Figure 2).
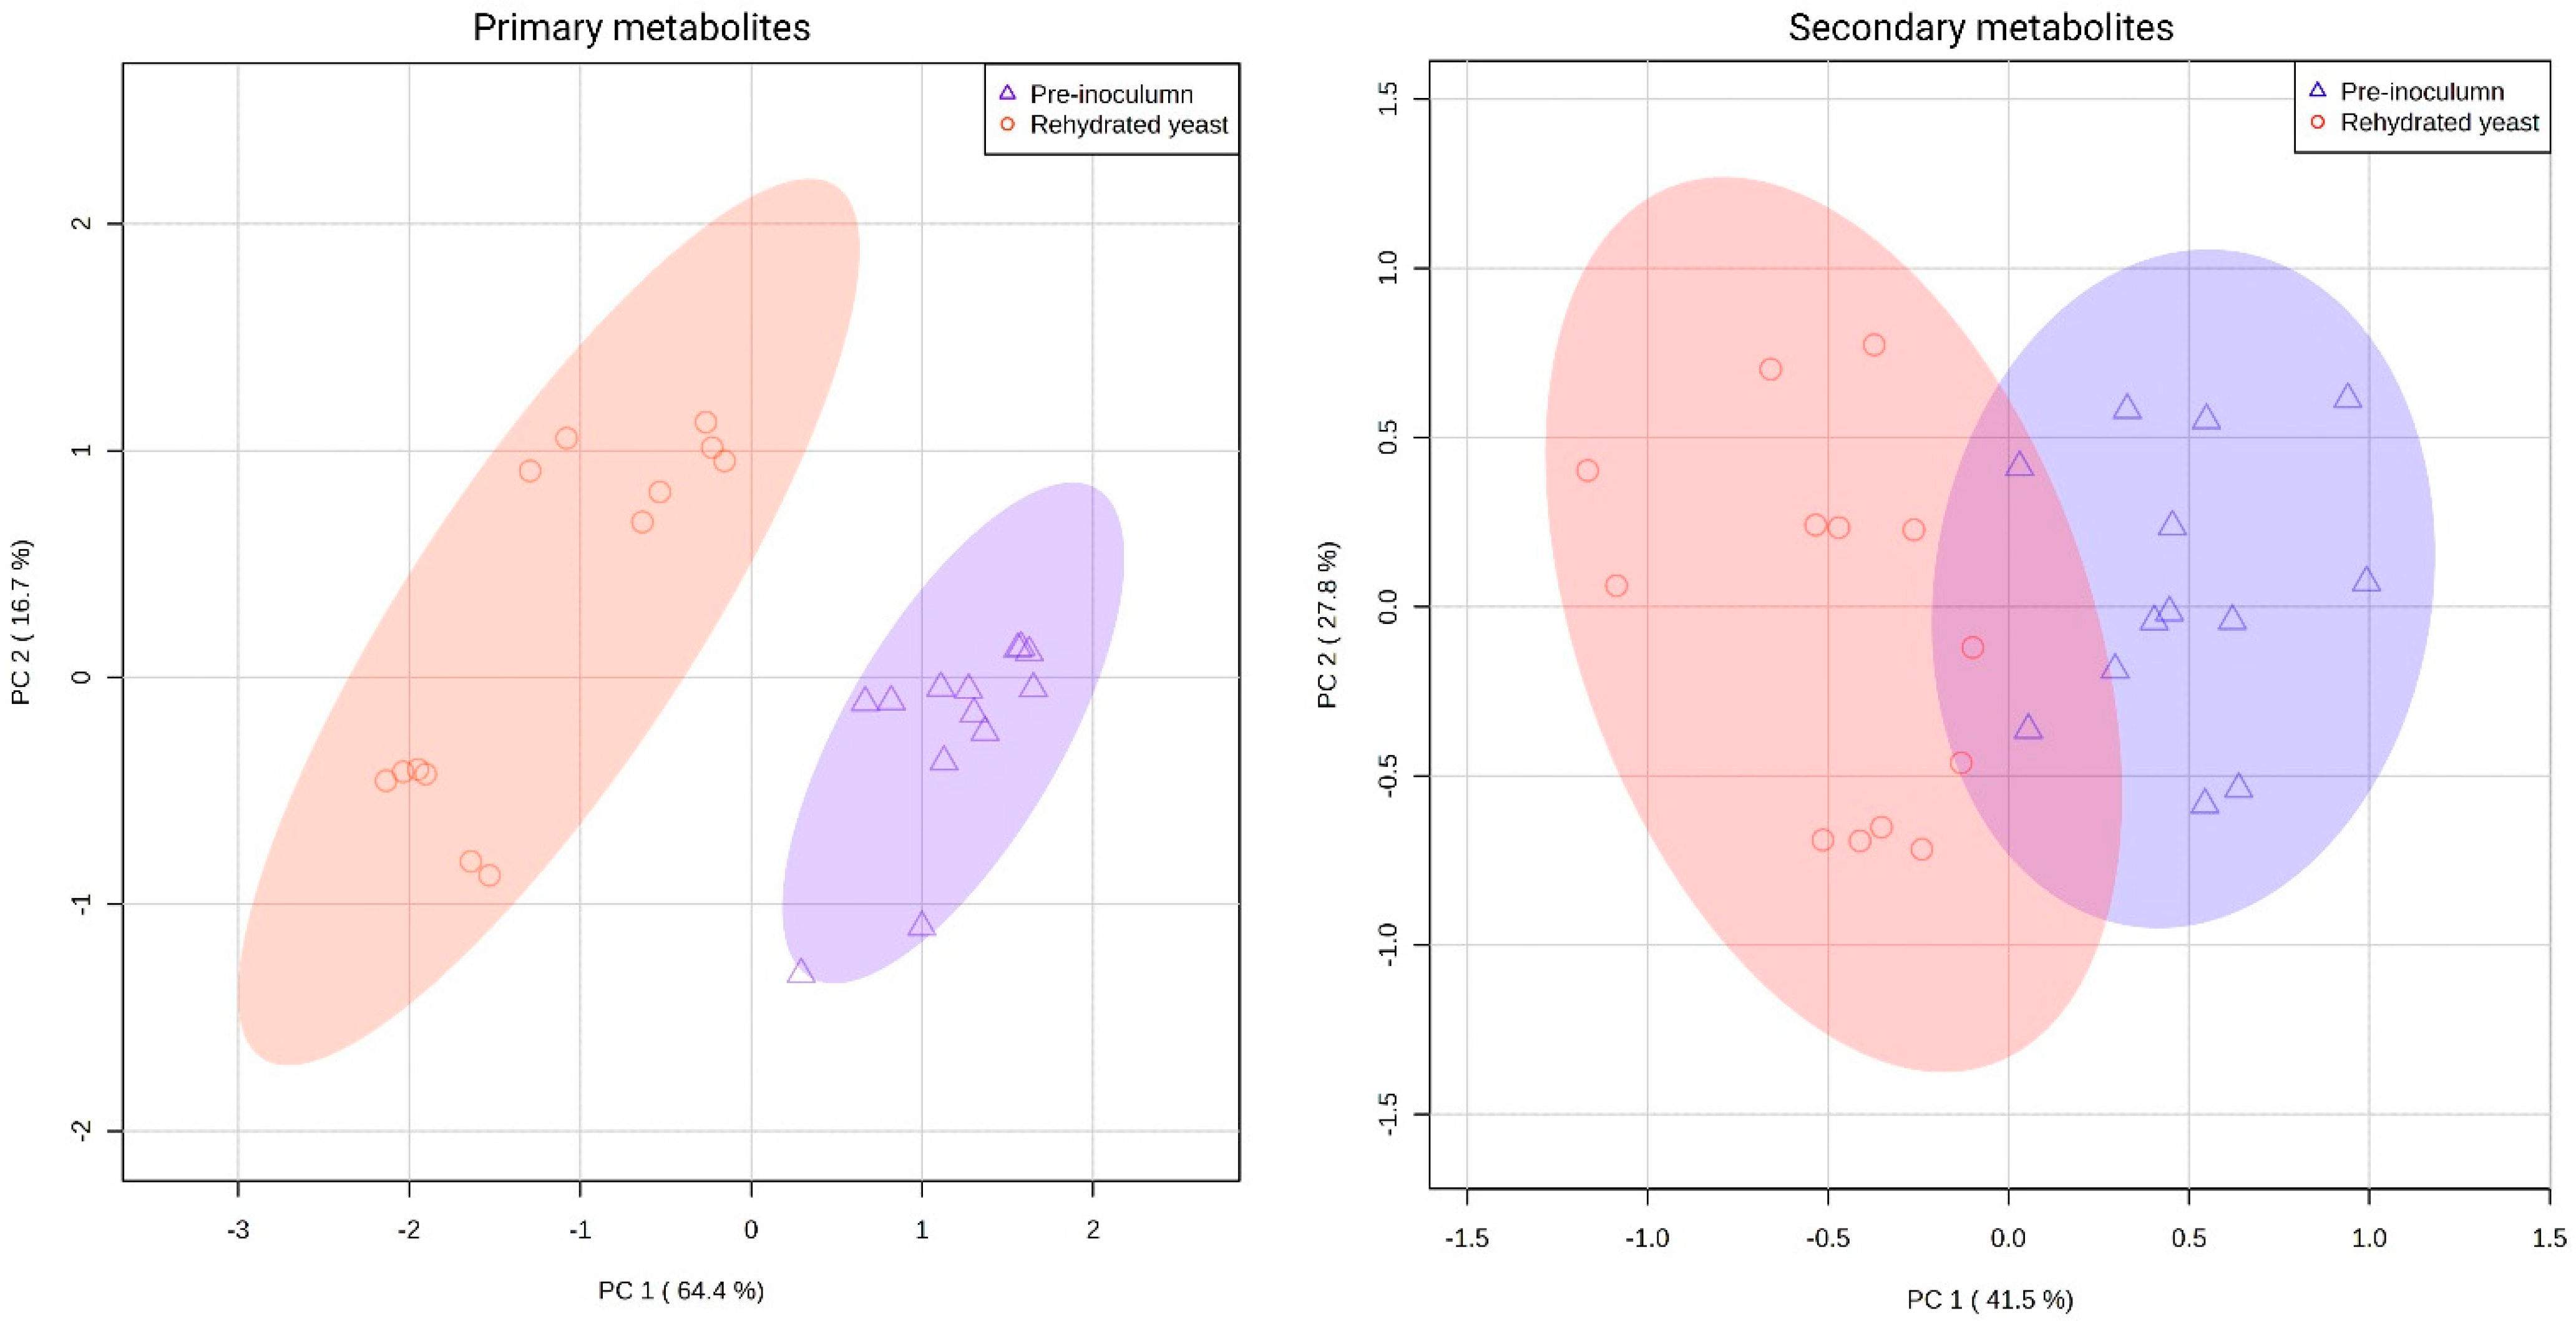
We performed PCAs using all the metabolites quantified in the resulting wines (Figure 3), where the clustering pattern of wines produced from both inoculation strategies was more prominent for primary metabolites (PC1 and PC2 accounted for 80% of total variance). On the other hand, the PCA score plot of secondary metabolites showed a separation pattern with a slight overlap between the wine profiles produced from two inoculation strategies (PC and PC2 accounted 69% of total variance). This type of difference based on types of metabolites is not unusual, as production of primary metabolites is more regulated in a cell system compared with the secondary metabolites [42,43]. Many primary metabolites directly and indirectly contribute as precursors for many secondary metabolites, and that is particularly true for the production of volatile compounds [44]. Moreover, the primary metabolites analysed in this study are considered more stable during analysis than aroma compounds. Altogether, our data indicated that inoculation methods indeed influenced the metabolite composition of the wines (Figure 3).
During commercial winemaking, little attention is usually paid towards the inoculated yeast cell numbers, while research winemaking is different, where similar numbers of yeast cells are inoculated. Published data that compare metabolites produced from commercial and research wines are limited. Therefore, we also investigated if inoculated yeast cell numbers had any impact on the metabolite composition of the resulting wines. As shown in Figure 4, the impact of inoculated cell numbers on metabolite composition varied between inoculation methods. For example, separation patterns were more visible for wines produced by different inoculum levels for RY, where PC1 and PC2 accounted for more than 60% of total variance. On the other hand, higher or lower levels of inoculum had little impact on wines produced from PI, which was evident by lack of separations based on cell numbers (Figure 4). Although this is an interesting observation, the reason behind this is not clear and will require further studies in future. Typically, it is recommended to use at least 105–106 CFU per mL [45]; in this experiment, we used 106 CFU per mL for the control wines, while other ferments were inoculated with higher cell numbers ranging from 108 to 1012 cells/mL. These are relatively high amounts of inoculation, and our data indicated that we should consider the inoculation method and the number of inoculated cells while conducting fermentation to achieve the expected outcomes.

3.4. Varietal Thiols Are Affected by the Inoculation Methods

Varietal thiols are one of the most important aroma compounds in SB wines, and New Zealand SBs are known to have higher concentration of these tropical aroma compounds [40]. As their concentration in the wines is well within ng/L as compared to µg or mg/L for other aroma compounds analysed in this study, we analysed the varietal thiols data separately to determine the real impact of wine yeast preparation on this group of compounds. The perception threshold of these varietal thiols is very small: 0.8 ng/L for 4MMP, 4 ng/L for 3MHA, and 60 ng/L for 3MH [41], and OAV well-exceeded the ranges where the human olfactory system can detect them: OAV- 30–165 for 4MMP, 730–828 for 3MH, and 202–254 for 3MH. It is noteworthy that even if there was a difference of 20–30 ng/L of these thiols in wine, it would influence the overall aroma of the resulting wines.
Varietal thiol production, specifically 3MH and 4MMP, during fermentation was affected by the method of inoculum preparation (Table 2). The control wines produced using the PI contained almost 3000 ng/L more 3MH than the control wines inoculated with RY. The opposite was found for 4MMP, and its concentration was much higher in all the wines produced from RY. Moreover, we observed a positive correlation between the numbers of yeast cells inoculated and 3MH production regardless of the inoculation method, although this increase was not linear. In the case of 4MMP, this increase was linear for all the wines produced from RY when higher numbers of cells were inoculated. For 3MHA, the inoculation method and numbers of inoculated cells had little impact. However, successive inoculation seemed to have increased the concentration of 3MHA while reducing the concentration of 4MMP in wines for RY treatments. However, this was not the case for PI wines. All these observations suggest that the influence of method of inoculation and numbers of inoculated cells is dependent on the individual varietal thiol.

3.5. Interactions between Inoculation Methods and Inoculated Cell Numbers on Metabolite Composition

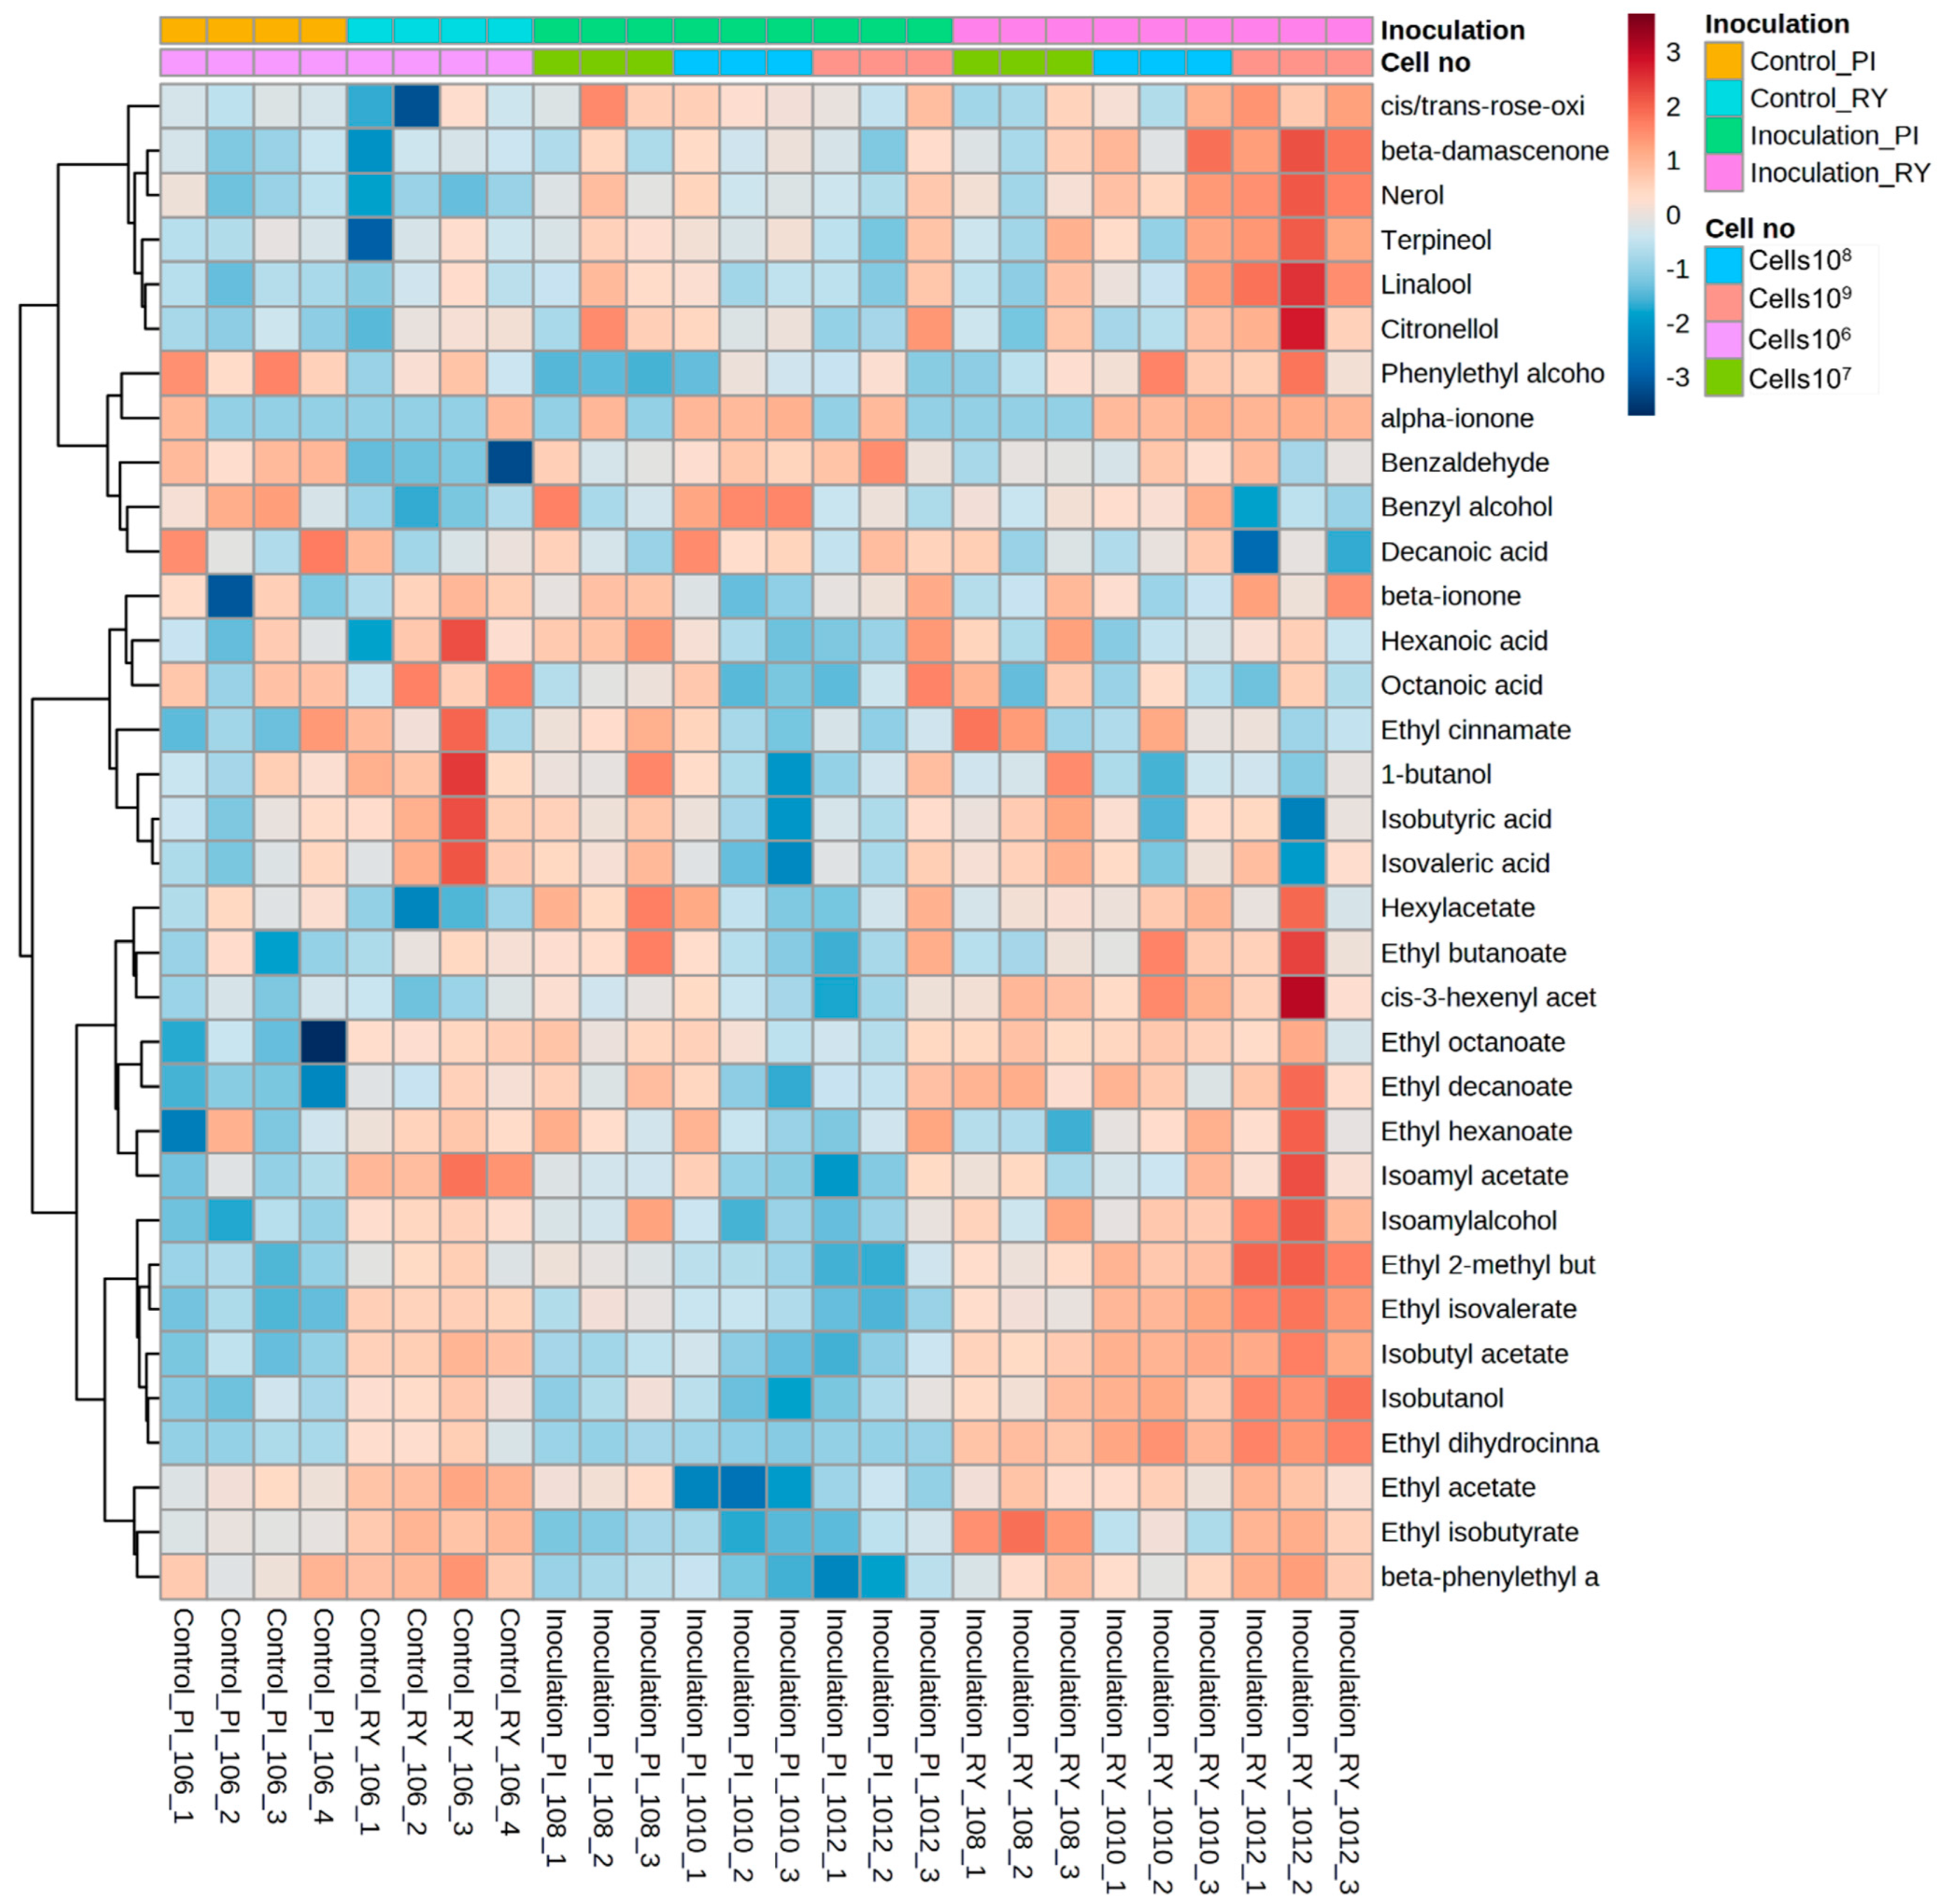
As we observed differences in metabolite composition based on inoculation methods, and a method depended on the influence of inoculated cell numbers, we carefully looked at both primary and secondary metabolite data to determine which compounds are more affected by these factors. Figure 5 and Figure 6 show the heatmaps produced using primary and secondary metabolites, respectively. When interaction between inoculation methods and inoculated cell numbers was considered using a two-way ANOVA, 9 out of 24 quantified primary metabolites, including lysine, arginine, leucine, isoleucine alanine, glutamic acid, glycine, glucose, and tartaric acid, were statistically different (p-value < 0.05) between treatments. However, the method of inoculation affected 19 of them, as discussed earlier (see Section 3.3), while cell numbers influenced 10 of the primary metabolites. This indicated that the method of inoculation (wine yeast preparation) was a more important factor than the number of inoculated cells that drives the differentiation in primary metabolite composition of wines. We observed a general trend of increased concentration of most of the amino acids in wines produced from cells grown in rich medium (shown as PI in Figure 5). Amino acid concentrations in these wines also increased when a higher number of cells were inoculated. This was expected and may result from the released amino acids from yeast autolysis at the end of fermentation [46]. The concentration of proline and valine was relatively higher in wines produced using RY. As proline is one of the most abundant amino acids in wines, total amino acid contents of resulting wines did not vary significantly between the inoculation methods and cell numbers used as inoculum.
We determined the OAV of all the aroma compounds analysed in this study to evaluate if these compounds can be perceived by the human olfactory system [41]. Out of 34 aroma compounds belonging to esters, higher alcohols, volatile fatty acids, monoterpenoids, and norisoprenoids, 16 of them had OAV > 1 (Table S2), indicating their importance in the overall aroma perception of wine. As expected, OAVs for most of the monoterpenoid and norisoprenoid aroma compounds were below 1, while esters, higher alcohols, and a few volatile fatty acids were the compounds with higher levels of OAV (>1). The results we observed here in terms of relevance to aroma perception are in accordance with previously published data on SB wine aroma [41,47]. Results from the two-way ANOVA using secondary metabolites showed that 6 out of 34 aroma compounds were affected when the interaction between inoculation methods and inoculated cell numbers was considered. These compounds were ethyl dihydrocinnamate (spicy, fruity notes), ethyl isovalerate (apple note), ethyl isobutyrate (fruity note), ethyl acetate (nail polish remover), ethyl 2-methyl butanoate (berries and apples), and nerol (sweet rose odour) [30]. Similar to what we observed for primary metabolites, 18 aroma compounds were influenced by the inoculation method used, while only 3 (ethyl dihydrocinnamate, ethyl isovalerate, and ethyl acetate) of the aroma compounds were affected by cell numbers. This again suggested that choice of suitable inoculation method was important to produce different aroma compounds, while cell numbers should also be considered, as this factor seemed to affect the production of a few important ethyl esters.
As shown in Figure 6, we observed another general trend that inoculation method using RY increased the production of most of the aroma compounds in the resulting wines, particularly the concentrations of esters that contributed towards the fruity and sweet note of the wines. In comparison, the concentration of most of these aroma compounds was generally lower in the PI wines. The reason behind these observations could be traced back to the primary metabolite data, where we found higher concentration of most of the amino acids in PI wines and lower concentration in RY wines. As mentioned earlier, the primary and secondary metabolisms are interlinked [42]. In central carbon metabolism, different types of amino acids (e.g., leucine, isoleucine, valine, and phenylalanine) contribute to the production of various intermediate molecules (e.g., acetyl-CoA) and aroma compounds, including higher alcohols and medium-chain volatile fatty acids [48]. These groups of compounds then result in the production of esters either by condensation reactions between acetyl-CoA and higher alcohols (acetate esters) or by the esterification of ethanol and acyl-CoA intermediates because of esterase and transferase enzyme activity (ethyl esters) [48]. One reason behind observing higher esters and lower amino acids in RY wines could be the metabolic activity of the wine yeasts during fermentation, where conditions in the RY ferments were more suitable for producing relevant aroma compounds [18,19,37,38]. In the case of PI ferments, the opposite trend was found, indicating the impact of tailoring different parameters, including fermentation conditions, media, and yeast preparation, on the development of targeted aroma compounds in the resulting wines.

3.6. Pathway Analysis Indicates the Changes in Metabolic Pathways Due to the Differences in Inoculation Methods

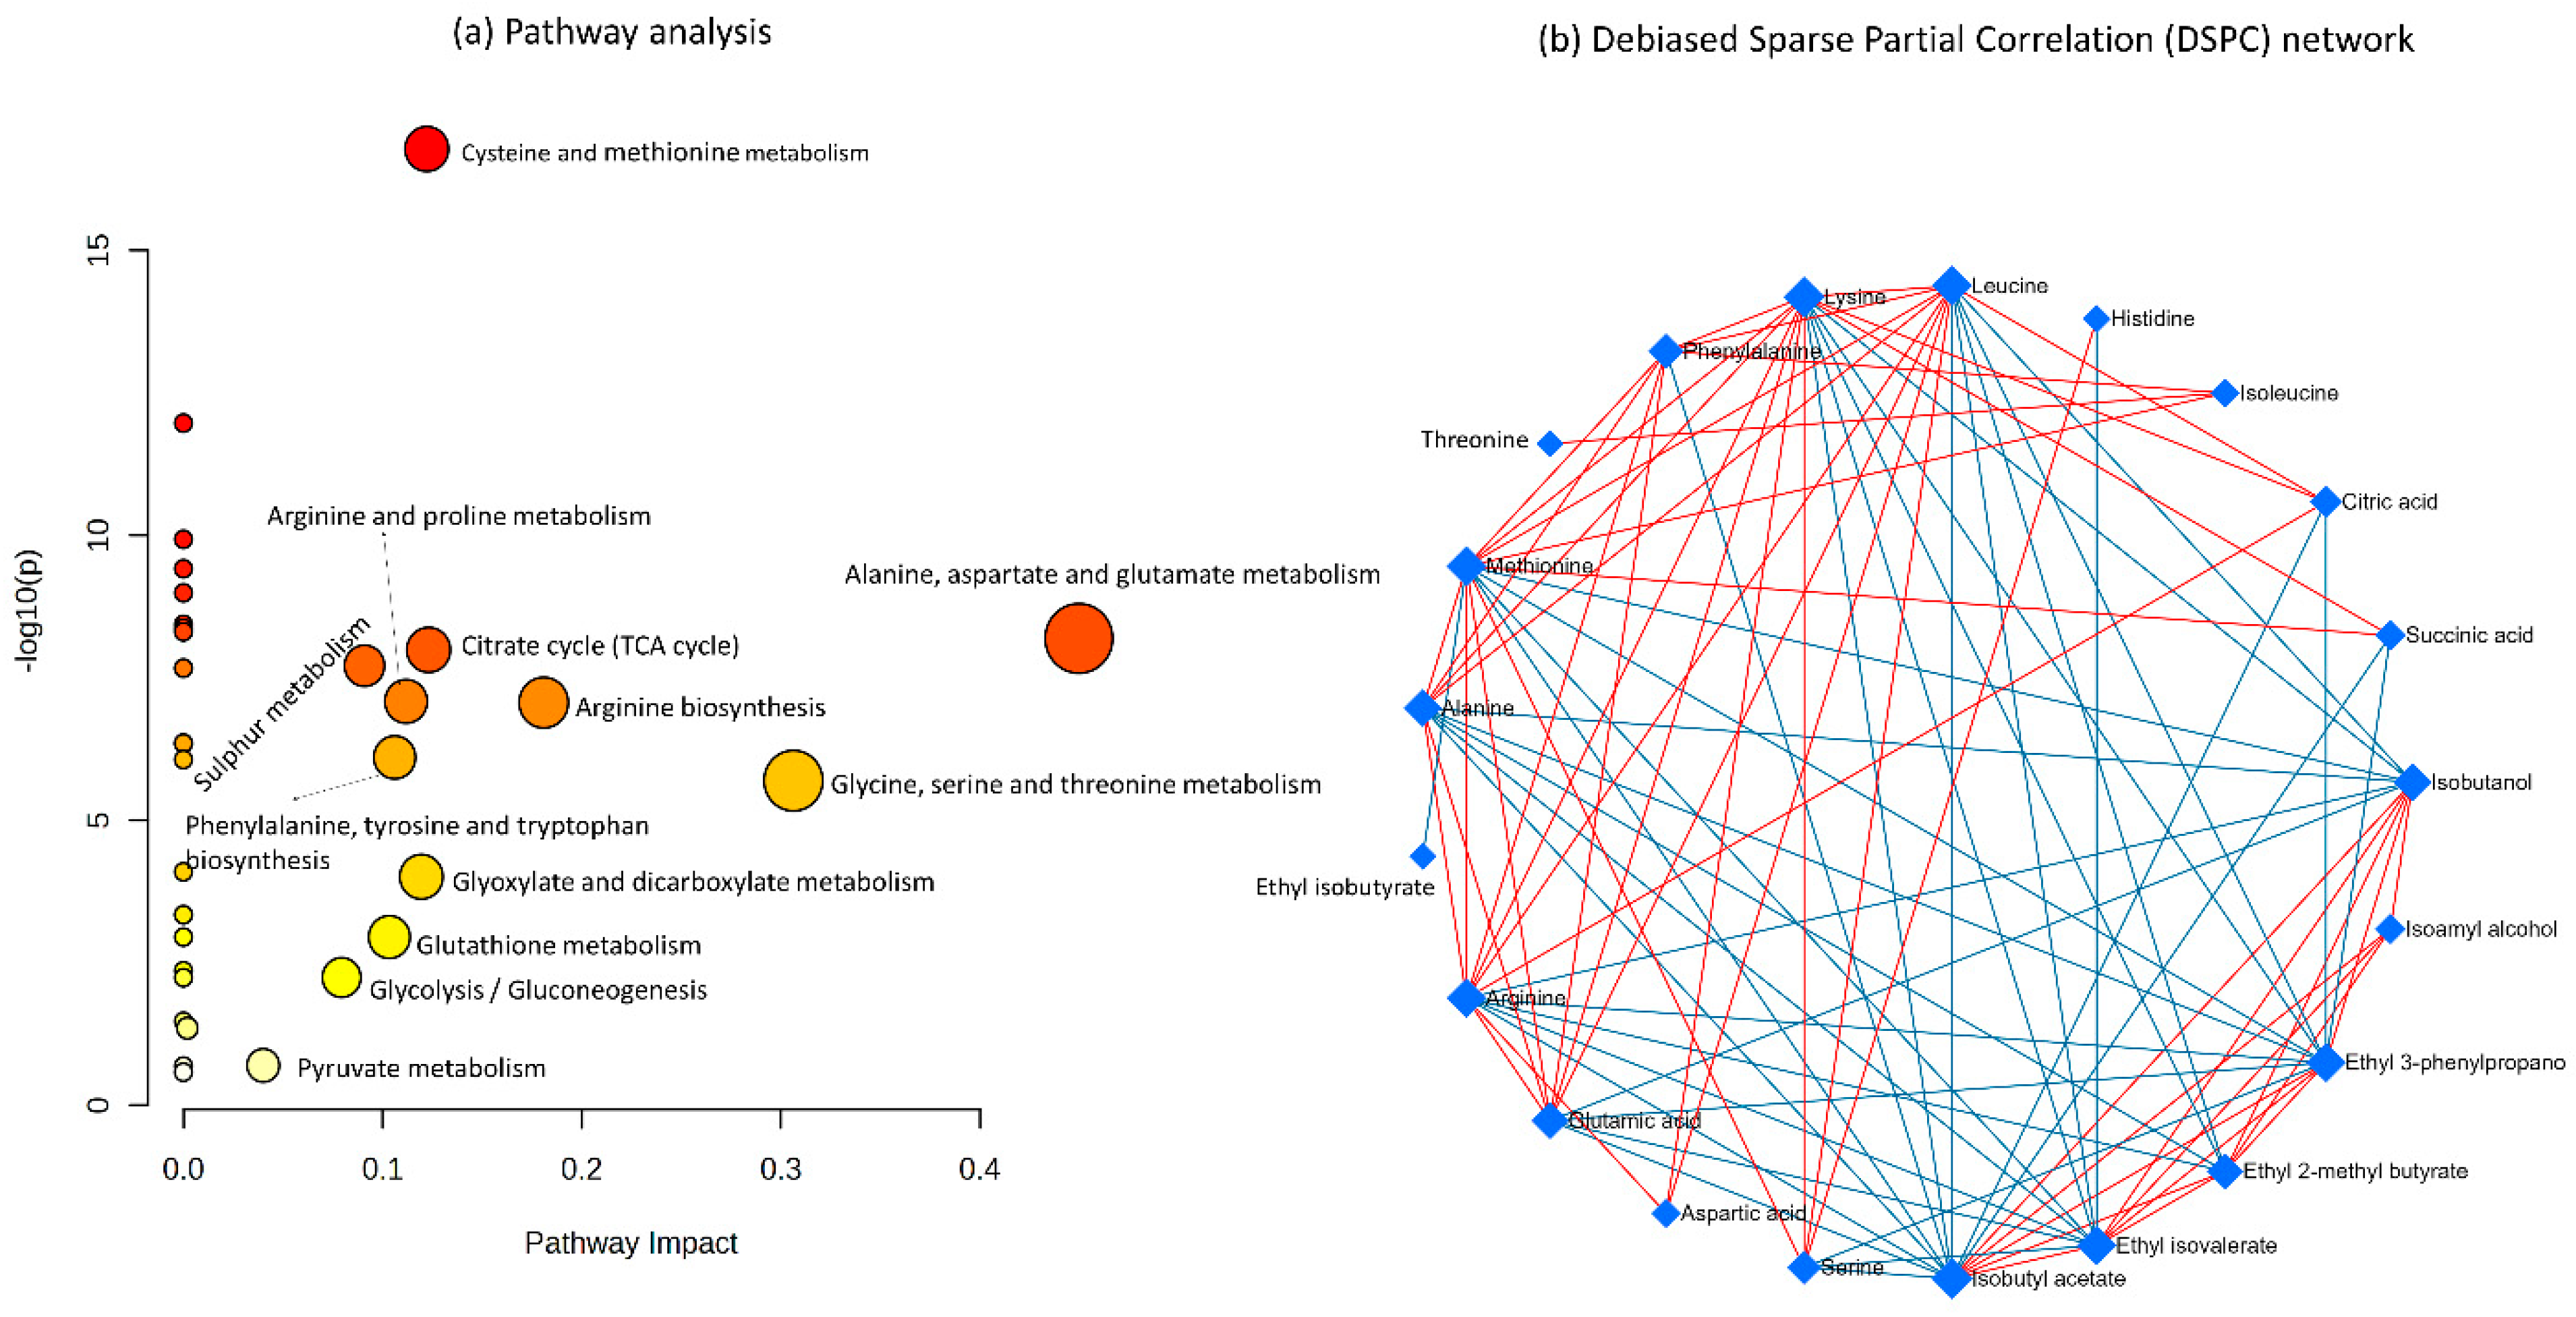
Our data suggest that inoculation methods indeed influence the overall metabolite composition of the resulting wines; therefore, metabolic pathways are most likely to be affected as well. As inoculation methods seemed to affect wine composition more than the inoculated cell numbers, we only performed pathway analysis to gain insights on the changes in yeast metabolism due to the two wine yeast preparation methods. As shown in Figure 7a, 11 metabolic pathways related mainly to nitrogen and sulphur metabolism were significantly influenced by the inoculation methods (p < 0.05).
Two metabolic pathways, aspartate and glutamate metabolism and cysteine methionine metabolism, particularly stood out compared with other pathways when their impact (shown in the x-axis in Figure 7a) and significance (shown in the y-axis in Figure 7a) were taken into account. Both pathways were upregulated for PI, which could be traced back to the presence of relatively higher concentrations of amino acids (nitrogen compounds) and varietal thiols (sulphur-containing compounds) in the wines produced using PI. On the other hand, the metabolic pathway related to aromatic amino acids (phenylalanine, tyrosine, and tryptophan biosynthesis) was slightly upregulated for RY, even though the concentration of most of these amino acids was comparatively lower in RY wines than PI. However, levels of esters, medium-chain fatty acids, and higher alcohols were higher in RY wines, indicating these amino acids were catabolized and aided in the production of these aroma compounds [49]. We also performed DSPC network analysis to determine the relationship between the metabolites analysed in the wines. There were 3 subnetworks: subnetwork 1 with 21 different notes (Figure 7b), subnetwork 2 with 5 nodes, and subnetwork 3 with 3 nodes. Subnetwork 1 provided the comprehensive picture that supported our observation from the pathway analysis, as we could see the positive correlation (red lines) among most of the primary metabolites and negative correlation of primary metabolites with the major aroma compounds (blue lines). This again confirmed that most of the primary metabolites were consumed by the wine yeasts during the fermentation that ultimately resulted in the production of the associated aroma compounds, including esters and higher alcohols (Figure 7b).

4. Conclusions

Based on previously published studies, we know that wine yeast metabolism during fermentation changes depending on the pre-fermentative manipulations, fermentation medium, and conditions [18,27,38,50]. Our investigation here involved the use of two different inoculation strategies to generate understanding of how two wine yeast preparation methods either used commercially (RY) or in a research laboratory (PI) affect overall metabolism of wine yeasts. We indeed found differences in fermentation time, metabolite composition, and related metabolic pathways depending on inoculation methods. Although the impact of inoculum size during wine fermentation is a less-studied area, we provided some insights on how differences in inoculated cell numbers also affect the production of different classes of aroma compounds. Our findings agreed with Carrau, Medina, Farina, Boido, and Dellacassa [18], who also found an unpredictable pattern of impacts on wine composition based on inoculated cells in two different wine yeast strains. We found that the method of inoculation was a more impactful determinant of fermentation end-product formation than inoculum quantity. Interestingly, and in contrast to previously published work, inoculation with RY increased the fermentation performance of wine yeasts, as evident from the fermentation completion time [6]. While wines produced by RY contained a higher amount of esters, higher alcohols, and 4MMP, 3MH and amino acid concentrations were considerably higher in PI wines. Successive inoculation also resulted in the production of higher concentration of varietal thiols in the wines. Altogether, these data suggest that production of wines with desirable aroma compounds is achievable via adopting a suitable wine yeast inoculation protocol, while attention should also be paid towards inoculum size wherever possible.

Supplementary Materials

The following supporting information can be downloaded at: https://www.mdpi.com/article/10.3390/fermentation9080759/s1. Table S1: Viability testing carried out for each ferments and treatments using Neubauer hemocytometer and methylene blue (0.1%) dye. Table S2: Title: Odour activity value (OAV) of aroma compounds quantified in Sauvignon blanc wines. RY, rehydrated active dry yeast; PI, pre-inoculum prepared in rich medium.

Author Contributions

Conceptualisation, F.R.P.; methodology, F.R.P., C.G., L.S., A.A. and T.T.; formal analysis, F.R.P.; investigation, F.R.P., C.G. and L.S.; resources, F.R.P. and D.M.; data curation, F.R.P.; writing—original draft preparation, F.R.P.; writing—review and editing, F.R.P., L.S., A.A., C.G. and D.M.; visualisation, F.R.P.; project administration, F.R.P.; funding acquisition, F.R.P. and D.M. All authors have read and agreed to the published version of the manuscript.

Funding

This research was funded as part of New Zealand Lighter Wines Programme (P/471777/04) co-funded by New Zealand Winegrowers, and the Ministry for Primary Industries Primary Growth Partnership.

Institutional Review Board Statement

Not applicable.

Informed Consent Statement

Not applicable.

Data Availability Statement

Access to data can be requested by contacting the corresponding author.

Acknowledgments

Our sincere thanks to Andy Frost, Pernod Ricard Winery (Marlborough, New Zealand), for providing the Sauvignon blanc juice. We also thank the Plant and Food Research research winery members during the 2017 vintage, Franzi Grab, Victoria Raw, Judy Zhao, Linlin Yang, Giulia Decordi, and Alessandro Serughetti for their help with daily monitoring of the ferments. We are grateful to Gert-Jan Moggre, Kevin Sutton, and Plant and Food Research’s Science Publishing Unit for providing feedback on the manuscript.

Conflicts of Interest

The authors declare no conflict of interest.

References

  1. Antalick, G.; Perello, M.C.; de Revel, G. Esters in Wines: New Insight through the Establishment of a Database of French Wines. Am. J. Enol. Vitic. 2014, 65, 293–304. [Google Scholar] [CrossRef]
  2. Hirst, M.B.; Richter, C.L. Review of Aroma Formation through Metabolic Pathways of Saccharomyces cerevisiae in Beverage Fermentations. Am. J. Enol. Vitic. 2016, 67, 361–370. [Google Scholar] [CrossRef] [Green Version]
  3. Cardona, F.; Carrasco, P.; Perez-Ortin, J.E.; del Olmo, M.L.; Aranda, A. A novel approach for the improvement of stress resistance in wine yeasts. Int. J. Food Microbiol. 2007, 114, 83–91. [Google Scholar] [CrossRef] [PubMed]
  4. Pizarro, F.; Vargas, F.A.; Agosin, E. A systems biology perspective of wine fermentations. Yeast 2007, 24, 977–991. [Google Scholar] [CrossRef] [PubMed]
  5. Diaz-Hellin, P.; Ubeda, J.; Briones, A. Improving alcoholic fermentation by activation of Saccharomyces species during the rehydration stage. LWT-Food Sci. Technol. 2013, 50, 126–131. [Google Scholar] [CrossRef]
  6. Jenkins, D.M.; Powell, C.D.; Fischborn, T.; Smart, K.A. Rehydration of Active Dry Brewing Yeast and its Effect on Cell Viability. J. Inst. Brew. 2011, 117, 377–382. [Google Scholar] [CrossRef]
  7. Schmidt, S.A.; Henschke, P.A. Production, reactivation and nutrient requirements of active dried yeast in winemaking: Theory and practice. Aust. J. Grape Wine Res. 2015, 21, 651–662. [Google Scholar] [CrossRef]
  8. Monk, P.R. Rehydration and propagation of active dry wine yeast. Aust. Wine Ind. J. 1986, 1, 35. [Google Scholar]
  9. Redon, M.; Guillamon, J.M.; Mas, A.; Rozes, N. Effect of active dry wine yeast storage upon viability and lipid composition. World J. Microbiol. Biotechnol. 2008, 24, 2555–2563. [Google Scholar] [CrossRef]
  10. Kontkanen, D.; Inglis, D.L.; Pickering, G.J.; Reynolds, A. Effect of yeast inoculation rate, acclimatization, and nutrient addition on icewine fermentation. Am. J. Enol. Vitic. 2004, 55, 363–370. [Google Scholar] [CrossRef]
  11. Diaz-Hellin, P.; Ubeda, J.; Briones, A. Study of two wine strains rehydrated with different activators in sluggish fermentation conditions. Eur. Food Res. Technol. 2013, 237, 547–554. [Google Scholar] [CrossRef]
  12. Andujar-Ortiz, I.; Chaya, C.; Martin-Alvarez, P.J.; Moreno-Arribas, M.V.; Pozo-Bayon, M.A. Impact of using new commercial glutathione enriched inactive dry yeast oenological preparations on the aroma and sensory properties of wines. Int. J. Food Prop. 2014, 17, 987–1001. [Google Scholar] [CrossRef] [Green Version]
  13. Novo, M.; Beltran, G.; Rozes, N.; Guillamon, J.M.; Sokol, S.; Leberre, V.; Francois, J.; Mas, A. Early transcriptional response of wine yeast after rehydration: Osmotic shock and metabolic activation. FEMS Yeast Res. 2007, 7, 304–316. [Google Scholar] [CrossRef] [PubMed] [Green Version]
  14. Winter, G.; Henschke, P.A.; Higgins, V.J.; Ugliano, M.; Curtin, C.D. Effects of rehydration nutrients on H2S metabolism and formation of volatile sulfur compounds by the wine yeast VL3. AMB Express 2011, 1, 11. [Google Scholar] [CrossRef] [PubMed] [Green Version]
  15. Soubeyrand, V.; Julien, A.; Sablayrolles, J.M. Rehydration protocols for active dry wine yeasts and the search for early indicators of yeast activity. Am. J. Enol. Vitic. 2006, 57, 474–480. [Google Scholar] [CrossRef]
  16. Vaudano, E.; Noti, O.; Costantini, A.; Garcia-Moruno, E. Effect of additives on the rehydration of Saccharomyces cerevisiae wine strains in active dry form: Influence on viability and performance in the early fermentation phase. J. Inst. Brew. 2014, 120, 71–76. [Google Scholar] [CrossRef]
  17. Rodriguez-Porrata, B.; Novo, M.; Guillamon, J.; Rozes, N.; Mas, A.; Otero, R.C. Vitality enhancement of the rehydrated active dry wine yeast. Int. J. Food Microbiol. 2008, 126, 116–122. [Google Scholar] [CrossRef]
  18. Carrau, F.; Medina, K.; Farina, L.; Boido, E.; Dellacassa, E. Effect of Saccharomyces cerevisiae inoculum size on wine fermentation aroma compounds and its relation with assimilable nitrogen content. Int. J. Food Microbiol. 2010, 143, 81–85. [Google Scholar] [CrossRef]
  19. Erten, H.; Tanguler, H.; Cabaroglu, T.; Canbas, A. The influence of inoculum level on fermentation and flavour compounds of white wines made from cv. Emir. J. Inst. Brew. 2006, 112, 232–236. [Google Scholar] [CrossRef]
  20. Deed, N.K.; van Vuuren, H.J.J.; Gardner, R.C. Effects of nitrogen catabolite repression and di-ammonium phosphate addition during wine fermentation by a commercial strain of S. cerevisiae. Appl. Microbiol. Biotechnol. 2011, 89, 1537–1549. [Google Scholar] [CrossRef]
  21. Harsch, M.J.; Benkwitz, F.; Frost, A.; Colonna-Ceccaldi, B.; Gardner, R.C.; Salmon, J.M. New Precursor of 3-Mercaptohexan-1-ol in Grape Juice: Thiol-Forming Potential and Kinetics during Early Stages of Must Fermentation. J. Agric. Food Chem. 2013, 61, 3703–3713. [Google Scholar] [CrossRef] [PubMed]
  22. Pinu, F.R.; Edwards, P.J.B.; Jouanneau, S.; Kilmartin, P.A.; Gardner, R.C.; Villas-Boas, S.G. Sauvignon blanc metabolomics: Grape juice metabolites affecting the development of varietal thiols and other aroma compounds in wines. Metabolomics 2014, 10, 556–573. [Google Scholar] [CrossRef]
  23. Shekhawat, K.; Bauer, F.F.; Setati, M.E. Impact of oxygenation on the performance of three non-Saccharomyces yeasts in co-fermentation with Saccharomyces cerevisiae. Appl. Microbiol. Biotechnol. 2017, 101, 2479–2491. [Google Scholar] [CrossRef] [PubMed]
  24. Ancin-Azpilicueta, C.; Jimenez-Moreno, N.; Moler, J.A.; Nieto-Rojo, R.; Urmeneta, H. Effects of reduced levels of sulfite in wine production using mixtures with lysozyme and dimethyl dicarbonate on levels of volatile and biogenic amines. Food Addit. Contam. Part A-Chem. 2016, 33, 1518–1526. [Google Scholar] [CrossRef] [PubMed]
  25. Pinu, F.R.; Jouanneau, S.; Nicolau, L.; Gardner, R.C.; Villas-Boas, S.G. Concentrations of the Volatile Thiol 3-Mercaptohexanol in Sauvignon blanc Wines: No Correlation with Juice Precursors. Am. J. Enol. Vitic. 2012, 63, 407–412. [Google Scholar] [CrossRef]
  26. Iland, P.; Bruer, N.; Wilkes, E. Chemical Analysis of Grapes and Wine: Techniques and Concepts; Patrick Iland Wine Promotions: Adelaide, Australia, 2004. [Google Scholar]
  27. Pinu, F.R.; Villas-Boas, S.G.; Martin, D. Pre-fermentative supplementation of fatty acids alters the metabolic activity of wine yeasts. Food Res. Int. 2019, 121, 835–844. [Google Scholar] [CrossRef]
  28. Martin, D.; Grose, C.; Fedrizzi, B.; Stuart, L.; Albright, A.; McLachlan, A. Grape cluster microclimate influences the aroma composition of Sauvignon blanc wine. Food Chem. 2016, 210, 640–647. [Google Scholar] [CrossRef]
  29. Hansen, E.H.; Nissen, P.; Sommer, P.; Nielsen, J.C.; Arneborg, N. The effect of oxygen on the survival of non-Saccharomyces yeasts during mixed culture fermentations of grape juice with Saccharomyces cerevisiae. J. Appl. Microbiol. 2001, 91, 541–547. [Google Scholar] [CrossRef]
  30. Pinu, F.R. Sauvignon Blanc Metabolomics: Metabolite Profile Analysis before and after Fermentation. Ph.D. Thesis, University of Auckland, Auckland, New Zealand, 2013. [Google Scholar]
  31. Green, J.A.; Parr, W.V.; Breitmeyer, J.; Valentin, D.; Sherlock, R. Sensory and chemical characterisation of Sauvignon blanc wine: Influence of source of origin. Food Res. Int. 2011, 44, 2788–2797. [Google Scholar] [CrossRef]
  32. Herbst-Johnstone, M.; Araujo, L.D.; Allen, T.A.; Logan, G.; Nicolau, L.; Kilmartin, P.A. Effects of Mechanical Harvesting on ‘Sauvignon Blanc’ Aroma; International Society for Horticultural Science (ISHS): Leuven, Belgium, 2013; pp. 179–186. [Google Scholar]
  33. Shi, S.; Condron, L.; Larsen, S.; Richardson, A.E.; Jones, E.; Jiao, J.; O’Callaghan, M.; Stewart, A. In situ sampling of low molecular weight organic anions from rhizosphere of radiata pine (Pinus radiata) grown in a rhizotron system. Environ. Exp. Bot. 2011, 70, 131–142. [Google Scholar] [CrossRef]
  34. Henderson, J.W.J.; Brooks, A. Improved Amino Acid Methods using Agilent ZORBAX Eclipse Plus C18 Columns for a Variety of Agilent LC Instrumentation and Separation Goals; Agilent Application Note 5990–4547EN; Agilent Technologies, Inc.: Wilmington, NC, USA, 2010. [Google Scholar]
  35. Pang, Z.; Chong, J.; Zhou, G.; de Lima Morais, D.A.; Chang, L.; Barrette, M.; Gauthier, C.; Jacques, P.-É.; Li, S.; Xia, J. MetaboAnalyst 5.0: Narrowing the gap between raw spectra and functional insights. Nucleic Acids Res. 2021, 49, W388–W396. [Google Scholar] [CrossRef] [PubMed]
  36. Basu, S.; Duren, W.; Evans, C.R.; Burant, C.F.; Michailidis, G.; Karnovsky, A. Sparse network modeling and metscape-based visualization methods for the analysis of large-scale metabolomics data. Bioinformatics 2017, 33, 1545–1553. [Google Scholar] [CrossRef] [PubMed] [Green Version]
  37. Pinu, F.R.; Stuart, L.; Grose, C. Effects of Different Yeast Preparation, Inoculation Timing and Ferment Oxygenation Methodologies on Ethanol Yield and Varietal Aroma Compound Formation; A Plant & Food Research Report; New Zealand Winegrowers: Auckland, New Zealand, 2019. [Google Scholar]
  38. Rollero, S.; Bloem, A.; Camarasa, C.; Sanchez, I.; Ortiz-Julien, A.; Sablayrolles, J.M.; Dequin, S.; Mouret, J.R. Combined effects of nutrients and temperature on the production of fermentative aromas by Saccharomyces cerevisiae during wine fermentation. Appl. Microbiol. Biotechnol. 2015, 99, 2291–2304. [Google Scholar] [CrossRef]
  39. Pinu, F.R.; Edwards, P.J.B.; Gardner, R.C.; Villas-Boas, S.G. Nitrogen and carbon assimilation by Saccharomyces cerevisiae during Sauvignon blanc juice fermentation. FEMS Yeast Res. 2014, 14, 1206–1222. [Google Scholar] [CrossRef]
  40. Pinu, F.R.; Tumanov, S.; Grose, C.; Raw, V.; Albright, A.; Stuart, L.; Villas-Boas, S.G.; Martin, D.; Harker, R.; Greven, M. Juice Index: An integrated Sauvignon blanc grape and wine metabolomics database shows mainly seasonal differences. Metabolomics 2019, 15, 3. [Google Scholar] [CrossRef]
  41. Benkwitz, F.; Takatoshi, T.; Kilmartin, P.A.; Lund, C.; Wohlers, M.; Nicolau, L. Identifying the Chemical Composition Related to the Distinct Aroma Characteristics of New Zealand Sauvignon blanc Wines. Am. J. Enol. Vitic. 2012, 63, 62. [Google Scholar] [CrossRef]
  42. Pinu, F.R.; Villas-Boas, S.G.; Aggio, R. Analysis of Intracellular Metabolites from Microorganisms: Quenching and Extraction Protocols. Metabolites 2017, 7, 53. [Google Scholar] [CrossRef] [Green Version]
  43. Drew, S.W.; Demain, A.L. Effect of Primary Metabolites on Secondary Metabolism. Annu. Rev. Microbiol. 1977, 31, 343–356. [Google Scholar] [CrossRef] [PubMed]
  44. Nielsen, J. Cell factory engineering for improved production of natural products. Nat. Prod. Rep. 2019, 36, 1233–1236. [Google Scholar] [CrossRef] [PubMed] [Green Version]
  45. Pinu, F.R.; Villas-Boas, S.G. Extracellular Microbial Metabolomics: The State of the Art. Metabolites 2017, 7, 43. [Google Scholar] [CrossRef] [PubMed] [Green Version]
  46. Lombardi, S.J.; De Leonardis, A.; Lustrato, G.; Testa, B.; Iorizzo, M. Yeast Autolysis in Sparkling Wine Aging: Use of Killer and Sensitive Saccharomyces cerevisiae Strains in Co-Culture. Recent Pat. Biotechnol. 2015, 9, 223–230. [Google Scholar] [CrossRef] [PubMed]
  47. Tumanov, S.; Pinu, F.R.; Greenwood, D.R.; Villas-Bôas, S.G. Effect of free fatty acids and lipolysis on Sauvignon Blanc fermentation. Aust. J. Grape Wine Res. 2018, 24, 398–405. [Google Scholar] [CrossRef]
  48. Prusova, B.; Humaj, J.; Sochor, J.; Baron, M. Formation, Losses, Preservation and Recovery of Aroma Compounds in the Winemaking Process. Fermentation 2022, 8, 93. [Google Scholar] [CrossRef]
  49. Cordente, A.G.; Schmidt, S.; Beltran, G.; Torija, M.J.; Curtin, C.D. Harnessing yeast metabolism of aromatic amino acids for fermented beverage bioflavouring and bioproduction. Appl. Microbiol. Biotechnol. 2019, 103, 4325–4336. [Google Scholar] [CrossRef] [PubMed]
  50. García-Ríos, E.; Gutiérrez, A.; Salvadó, Z.; Arroyo-López, F.N.; Guillamon, J.M. The Fitness Advantage of Commercial Wine Yeasts in Relation to the Nitrogen Concentration, Temperature, and Ethanol Content under Microvinification Conditions. Appl. Environ. Microbiol. 2014, 80, 704. [Google Scholar] [CrossRef] [PubMed] [Green Version]
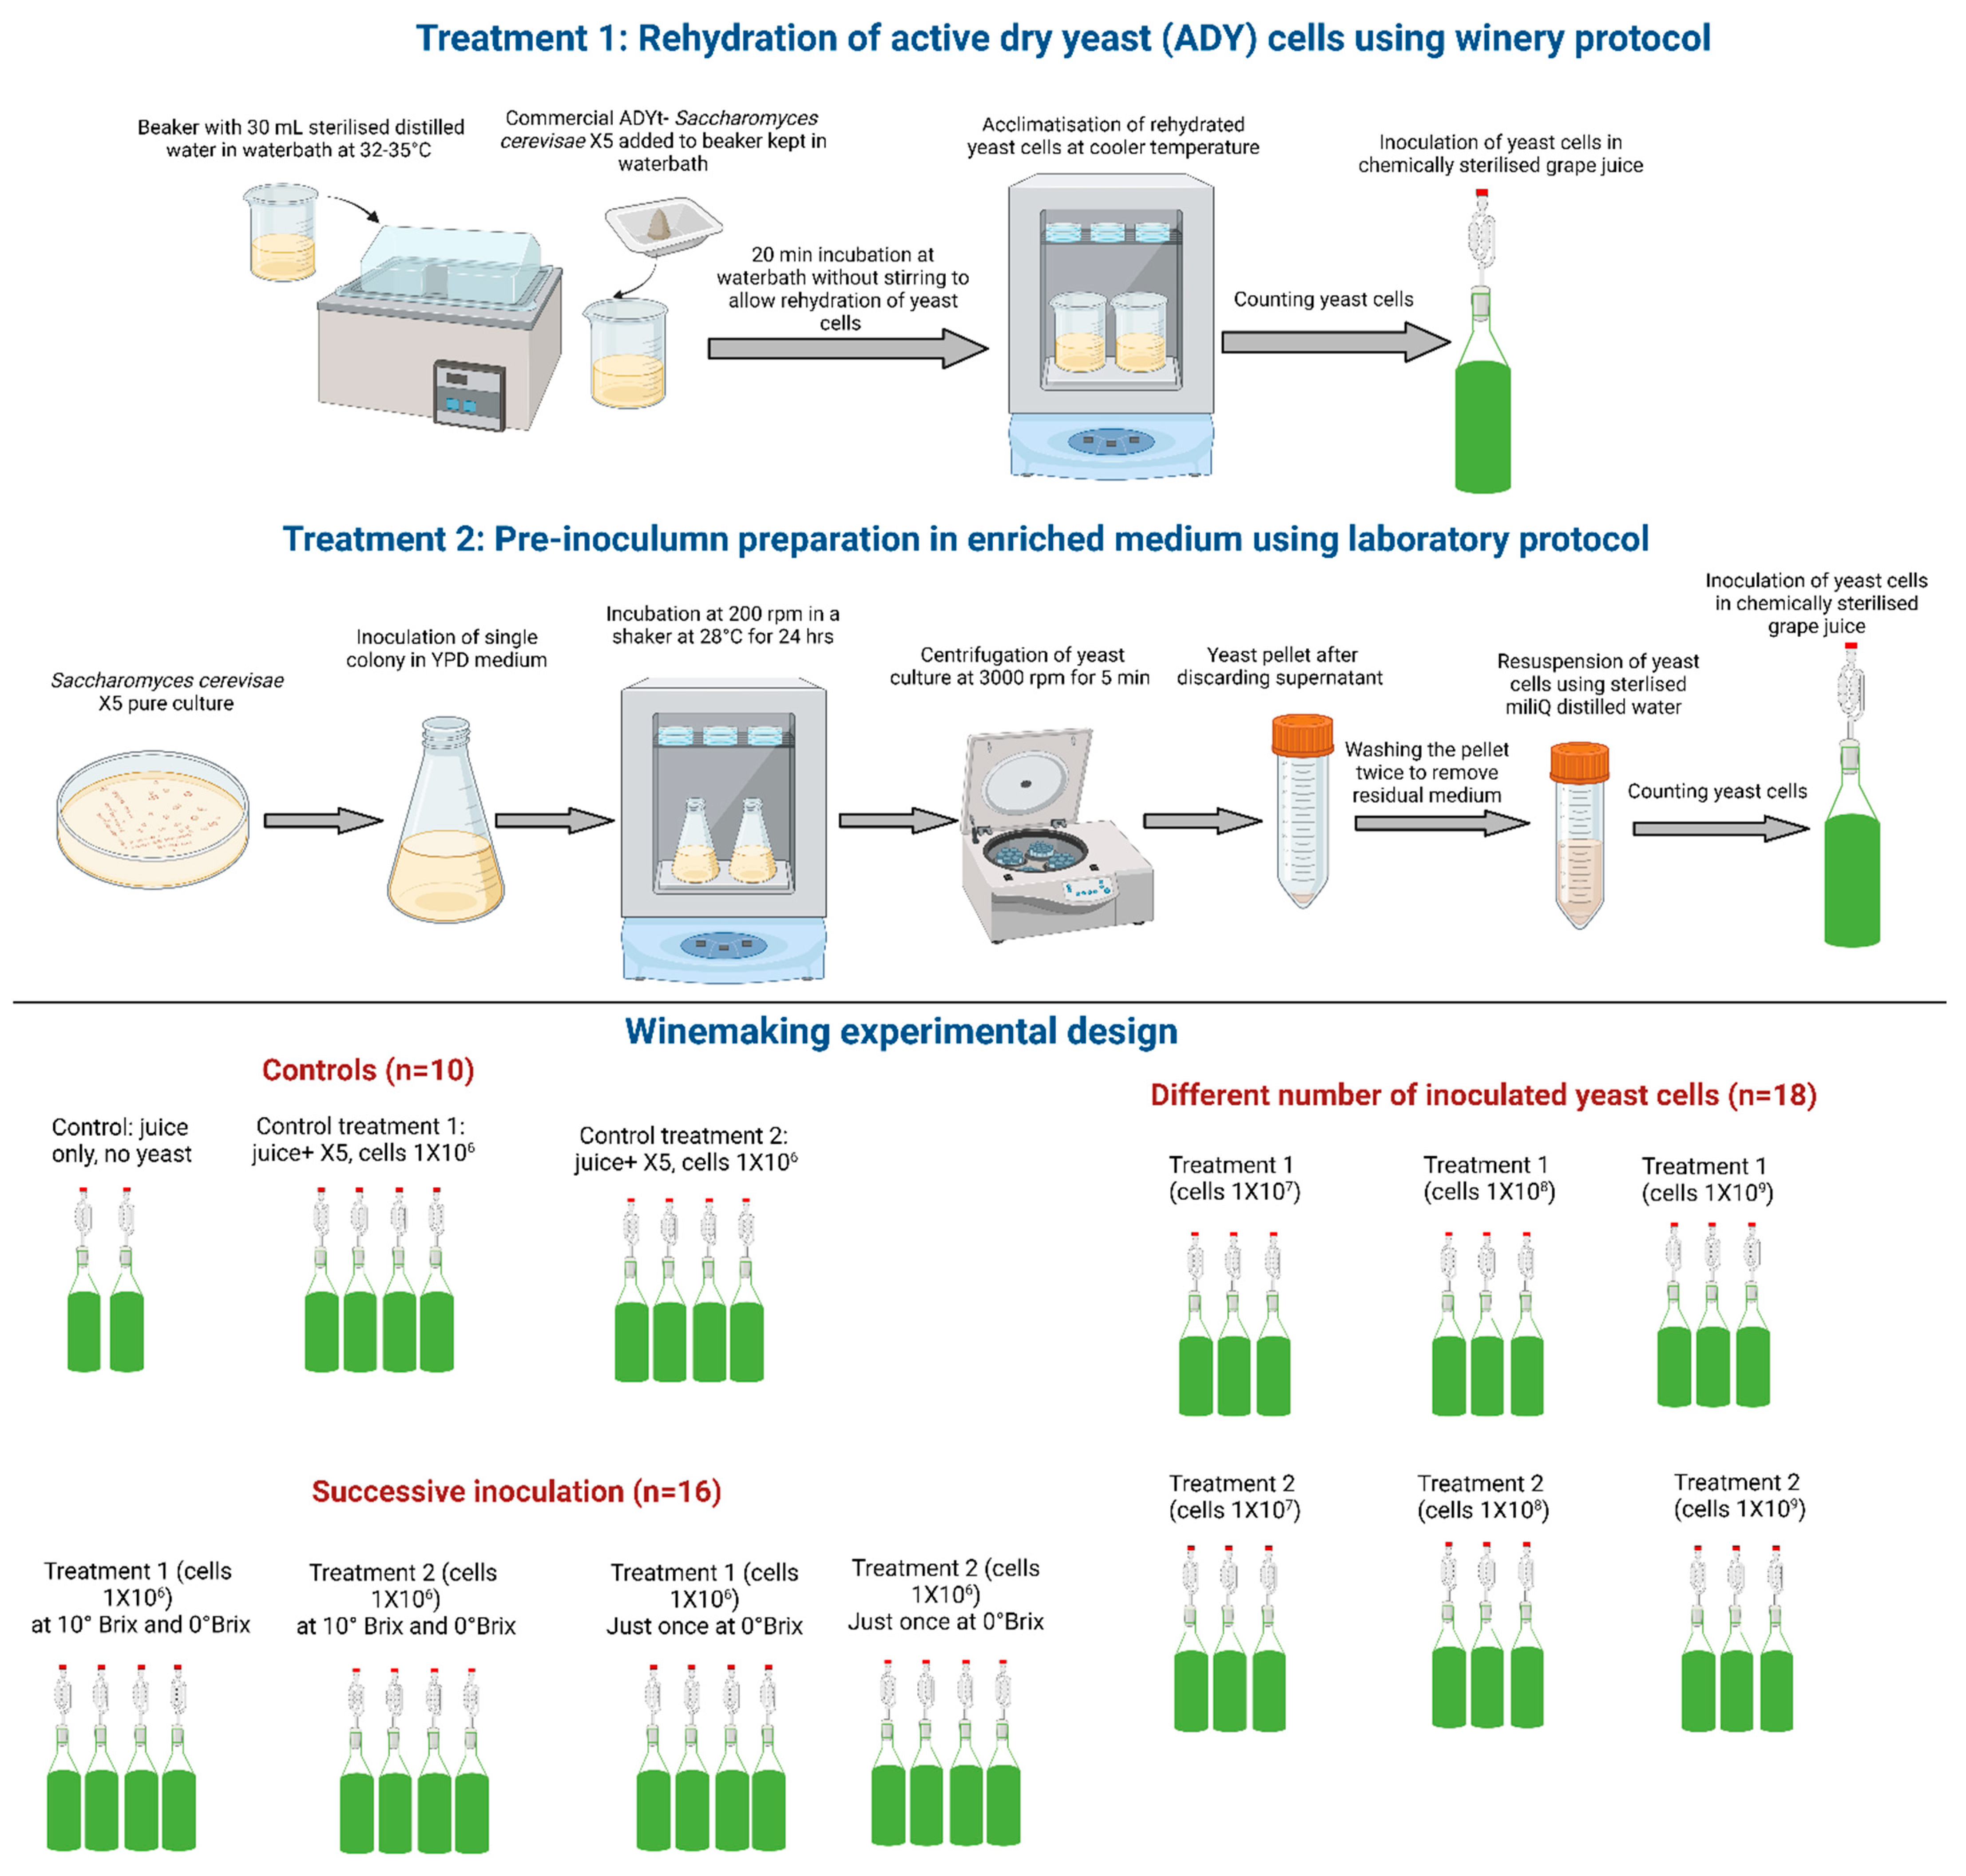
Figure 1. Two yeast inoculation preparation methods and winemaking experimental design used in this study. Yeast cells were counted as cells/mL.
Fermentation 09 00759 g001
Figure 2. Primary and secondary metabolites that were significantly different between two inoculation methods used in the study. Pink dots with names indicate the metabolites that were statistically significant (p < 0.05) between two inoculation methods, while grey dots indicate insignificant metabolites (p > 0.05).
Fermentation 09 00759 g002
Figure 3. Two-dimensional projection of principal component analysis score plots based on primary and secondary metabolites showing the differences in the Sauvignon blanc wine composition produced by commercial Saccharomyces cerevisiae X5 strain using two different inoculation methods: pre-inoculum in rich medium and rehydrated active dry yeasts.
Fermentation 09 00759 g003
Figure 4. Two-dimensional projection of principal component analysis (PCA) score plots based on primary and secondary metabolites showing the effect of inoculated cell numbers during Sauvignon blanc fermentation by commercial Saccharomyces cerevisiae X5. ADY, active dry yeasts.
Fermentation 09 00759 g004
Figure 5. Heatmaps showing the concentration of primary metabolites in different Sauvignon blanc wines produced by using commercial Saccharomyces cerevisiae X5. Two different inoculation methods were used: pre-inoculum prepared in rich media (noted as PI) and rehydrated active dry yeasts (noted as RY). Inoculated cell numbers are also shown as: Cells106, Cells 106 (control wines); Cells108, Cells 108; Cells1010, Cells 1010; Cells1012, Cells 1012.
Fermentation 09 00759 g005
Figure 6. Heatmaps showing the concentration of secondary metabolites in different Sauvignon blanc wines produced by using commercial Saccharomyces cerevisiae X5. Two different inoculation methods were used: pre-inoculum prepared in rich media (noted as PI) and rehydrated active dry yeasts (noted as RY)). Inoculated cell numbers are also shown as: Cells106, Cells 106 (control wines); Cells108, Cells 108; Cells1010, Cells 1010; Cells1012, Cells 1012.
Fermentation 09 00759 g006
Figure 7. Impact of inoculation methods on different metabolic pathways and associated metabolites. Pathway analysis (a) was carried out using all the quantified metabolites with Kyoto Encyclopedia of Genes and Genomes (KEGG) ID using Saccharomyces cerevisiae as the pathway library from KEGG. Colour gradient is based on p-values: yellow (lower) and red (higher). Debiased sparse partial correlation (DSPC) network (b) showing the correlation between significant primary and secondary metabolites. The red line indicates a positive correlation, while the blue line shows the negative correlation.
Fermentation 09 00759 g007
Table 1. Fermentation completion time and basic oenological properties of all experimental wines.
WineInoculated Yeast CellsCompletion TimeAlcohol (%v/v)pHTitratable Acidity (g/L)Glucose (g/L)Fructose (g/L)Total Residual Sugar (g/L)Phenolics (mg Gallic Acid/L)
Rehydrated ADY
Control RY1 × 1061311.81 (0.01)3.20 (0.01)8.46 (0.13)0.03 (0.01)0.60 (0.28)0.63 (0.27)207.62 (6.50)
RY 11 × 1081211.76 (0.00)3.21 (0.01)8.41 (0.06)0.05 (0.01)1.09 (0.03) a1.14 (0.03)210.41 (3.38)
RY21 × 10101111.65 (0.01)3.19 (0.01)9.52 (0.17)0.001.62 (0.32) a1.62 (0.32)201.19 (2.50)
RY31 × 10121111.64 (0.02)3.19 (0.01)9.51 (0.09)0.00 b0.87 (0.10) b0.87 (0.10) b204.95 (1.17)
SI RY 11 × 106, then 1 × 10⁶ at 10 and 0 °Brix14 *11.86 (0.03)3.28 (0.01)8.48 (0.04)0.000.04 (0.03) a0.04 (0.03)207.93 (4.47)
SI RY 21 × 106, then 1 × 10⁶ at 0 °Brix14 *11.91 (0.00)3.24 (0.01)8.38 (0.11)0.03 (0.04)0.02 (0.02) a0.05 (0.06)211.37 (0.61)
Pre-inoculum
Control PI1 × 1061711.91 (0.02)3.24 (0.02)9.01 (0.16)0.05 (0.05)0.87 (0.28)0.92 (0.28)209.82 (3.55)
PI 11 × 1081611.80 (0.08)3.20 (0.02)8.68 (0.10)0.04 (0.01)1.73 (0.74)1.77 (0.74)212.81 (2.83)
PI 21 × 10101711.83 (0.03)3.24 (0.02)8.56 (0.13)0.01 (0.01)1.05 (0.37)1.06 (0.37)209.70 (2.80)
PI 31 × 10121611.79 (0.01)3.19 (0.04)8.41 (0.06)0.08 (0.02) b1.54 (0.24) b1.62 (0.21) b212.64 (4.27)
SI PI 11 × 106, then 1 × 10⁶ at 10 and 0 °Brix17 *11.90 (0.00)3.28 (0.02)8.29 (0.04)0.02 (0.00)0.06 (0.02) a0.08 (0.02)212.04 (2.73)
SI PI 21 × 106, then 1 × 10⁶ at 0 °Brix17 *11.92 (0.01)3.26 (0.02)8.29 (0.10)0.02 (0.00)0.02 (0.01) a0.04 (0.01)206.93 (4.61)
Here, ADY, active dry yeast; RY, rehydrated yeast; SI, successive inoculation; PI, pre-inoculum. * denotes the ferments whose fermentation was not stopped although the residual sugar was below 2 g/L. a indicates the statistically significant differences in comparison to control (p < 0.05); b indicates the statistical differences between RY and PI when comparison was made with the same inoculated cell numbers.
Table 2. Three major varietal thiols in Sauvignon blanc wines made after different yeast fermentations.
WineNo of Inoculated
Yeast Cells
3MH
(ng/L)
3MHA
(ng/L)
4MMP
(ng/L)
Inoculation of rehydrated ADY
Control RY1 × 10611,498 (2717)3242 (843)62 (41)
RY 11 × 10812,657 (1414) a3197 (250)69 (14)
RY21 × 101014,217 (829) b3146 (175)105 (15) a
RY31 × 101214,066 (742) b2943 (77)157 (59) b
SI RY 11 × 106, then 1 × 10⁶ at 10 and 0 °Brix13,947 (1210) a3588 (492)29 (5) b
SI RY 21 × 106, then 1 × 10⁶ at 0 °Brix14,626 (636) b4037 (131)a27 (9) b
Inoculation of pre-inoculum
Control PI1 × 10614,382 (802)3147 (335)20 (8)
PI 11 × 10815,573 (596) a3131 (216)25 (2)
PI 21 × 101014,502 (2010)3095 (301)21 (8)
PI 31 × 101215,914 (692) a3078 (117)38 (8) b
SI PI 11 × 106, then 1 × 10⁶ at 10 and 0 °Brix13,879 (2846)3091 (522)17 (5)
SI PI 21 × 106, then 1 × 10⁶ at 0 °Brix15,679 (859) a3382 (305)24 (4)
p-values are shown as superscripts that were calculated by comparing with respective control wines; a < 0.05 and b < 0.01. ADY, active dry yeast; RY, rehydrated yeast; SI, successive inoculation; PI, pre-inoculum; 3MH, 3-mercaptohexanol; 3MHA, 3-mercaptohexylacetate; 4MMP, 4-methyl-4-mercaptopentan-2-one. Standard deviations of replicates in each treatment and control wines are shown within brackets. Numbers shown in italics indicate the statistical differences when comparison was made between RY and PI with same inoculated cell numbers (RY vs. PI).
Disclaimer/Publisher’s Note: The statements, opinions and data contained in all publications are solely those of the individual author(s) and contributor(s) and not of MDPI and/or the editor(s). MDPI and/or the editor(s) disclaim responsibility for any injury to people or property resulting from any ideas, methods, instructions or products referred to in the content.