1. Introduction
The global fermentation-based chemical industry was valued at USD 71.16 billion in 2022 and is expected to grow [
1]. The use of renewable resources as feedstocks and the development of biorefineries to establish a circular economy significantly boosts this growth [
2]. While such renewable resources often aim to supply commodity chemicals for the chemical, polymer, coating, agricultural, food/feed, and fuel industries, biobased specialty chemicals for the pharmaceutical industry, for example, can be synthesized by fermentation, often without the use of bulk renewable resources [
3,
4,
5,
6,
7,
8]. Over the past decade, many microorganisms have been investigated with regard to their industrial robustness, genetic tractability, and production capacity to develop industrially viable fermentation processes [
9,
10]. The baker’s yeast
Saccharomyces cerevisiae is of particular interest due to its historic track record in beer, wine, and bread production, placing it on the forefront of the fermentation-based industry. In addition to its traditional use, at present, this yeast is employed mainly in bio-ethanol production (e.g., Cargill [
11]), but other industrial applications are also surfacing, such as the production of artemisinin (Amyris [
12]), malonic acid (Lygos [
13]), and opioids (Antheia [
14]), and other functional molecules, such as resveratrol, nootkatone, and stevia sweeteners (Evolva [
15]).
In order to obtain an economically viable fermentation process, the yeast strain often needs modification. Metabolic engineering and synthetic biology have allowed us to optimize its production [
16,
17,
18]. For example, the adaptation of baker’s yeast to efficiently produce ethanol from lignocellulosic biomass required several genetic modifications to allow the efficient fermentation of the sugars L-xylose and L-arabinose [
19,
20]. Adapting the yeast’s metabolic profile, for example, by introducing heterologous genes, can occur through the transformation of a plasmid or through recombination into the chromosomal DNA, the latter being more robust, as plasmids are self-replicating mobile elements that need selection pressure to be maintained and that can occur in multiple (variable) copies in the yeast’s nucleus. The maintenance of this extrachromosomal DNA often gives rise to a greater metabolic burden [
21], resulting in a production decrease and fluctuations [
22]. The prerequisite of a selection marker, be it auxotrophic or antibiotic, is also a disadvantage for industrial processes, as it is not compatible with several waste stream materials [
23]. A viable yeast strain for industrial fermentation requires modifications of the genome itself. The question, hence, arises as to where in the genome these alterations should be established. Although information is available regarding the output level obtained at certain genomic locations [
24], no information can be found regarding the robustness in time of these output levels. Generally, a lack of robustness originating from host genomic instability is perceived only at a point where economic feasibility is in jeopardy. Indeed, there is a gap between the optimization of a microbial producer engineered in the lab and its final application in industry [
25].
We believe this gap can be decreased by implementing host parameters alongside well-known process parameters, such as titer, yield, and productivity. These host parameters, introduced in this paper, are based on the behavior of the modified microorganism, characterize the microbial host’s (in)stability, and they allow the visualization of potential improvement in the production capacity. To do so, we employed the reporter gene yeast-enhanced cyan fluorescent protein (yECFP), which synthesizes a fluorescent protein gene. The number of yECFP proteins is positively correlated with the fluorescent signal, thus allowing us to track the production and visualize (the lack of) strain robustness. The yECFP reporter gene was introduced in a single- to multi-copy set-up on several genomic loci for over 100 generations, uncovering beneficial and detrimental effects. The 100 generations were set as a target to mimic the time required for a yeast-based industrial production process [
12]. In practice, the number of generations is dependent on the overall process developed, with factors such as the seed train, production volume, or type of fermentation. Our preliminary study reveals the effect of different genomic locations, both on an output and a stability level. To the best of our knowledge, such host parameters and stability effects have not been examined previously, although they are of vital importance to further exploit yeast, and by extension, to other microorganisms as a modern production host for chemically complex molecules.
2. Materials and Methods
2.1. Materials
Tryptone, yeast extract, yeast nitrogen base without amino acids, and Agar NOBLE were procured from LED-Techno (Heusden-Zolder, Belgium), Cargill (Gent, Belgium), and Becton Dickinson (Erembodegem, Belgium), respectively. Complete supplement mixture was purchased from MP Biomedicals (Groot-Bijgaarden, Belgium). Glucose and fructose were procured from VWR (Leuven, Belgium), while galactose was obtained from Carbosynth (Compton, UK). All other chemicals were purchased from Sigma-Aldrich (Diegem, Belgium), unless stated otherwise.
Oligonucleotides were purchased from Integrated DNA Technologies (Leuven, Belgium). Sequencing services were conducted by Macrogen (Amsterdam, The Netherlands) or LGC Genomics (Berlin, Germany). Deoxynucleotides, agarose, and ethidium bromide were purchased from ThermoFisher Scientific (Aalst, Belgium). QIAprep Spin Miniprep kit (QIAgen, Antwerp, Belgium) was used for plasmid isolation. Analytik Jena kits were used for PCR purification (Jena, Germany).
Amplification of DNA fragments for cloning, sequencing, or transformation purposes was performed by the high-fidelity DNA polymerase PrimeSTAR HS (Takara, Westburg, Leusden, The Netherlands). In the case of verification of E. coli colonies following electroporation, standard Taq polymerase from NEB (Bioké, Leiden, The Netherlands) was used. Yeast colonies underwent a freeze/microwave/freeze cycle prior to PCR. Polymerases used for checking S. cerevisiae colonies were standard Taq (NEB, Ipswich, MA, USA), OneTaq® 2X Mastermix (NEB), and EmeraldAmp (Takara, Saint-Germain-en-Laye, France).
2.2. Strains
E. coli One Shot Top10 Electrocomp™ cells (ThermoFisher Scientific) were used for cloning purposes only, as were electrocompetent MDS™ 42LowMut ΔrecA Scarab cells (Scarab Genomics LLC, Madison, WI, USA). Saccharomyces cerevisiae S288C (MATa HIS3Δ1 LEU2Δ0 LYS2Δ0 URA3Δ0) BY4742 was obtained from Euroscarf (University of Frankfurt, Frankfurt am Main, Germany) and used as the wild-type strain.
2.3. Media and Culture Conditions
The culture medium lysogeny broth (LB) consisting of 1% tryptone, 0.5% yeast extract, and 0.5% sodium chloride (VWR) was used for growth of E. coli. Lysogeny broth agar (LBA) was similarly composed, with the addition of 12 g·L−1 agar (Biokar Diagnostics, Pantin Cedex, France). Media were supplemented with the antibiotics ampicillin (100 μg·mL−1) or kanamycin (50 μg·mL−1) for plasmid maintenance.
Growth medium for S. cerevisiae was based on the synthetic-defined yeast medium with complete supplement mixture (SD-CSM), containing 6.7 g.L−1 yeast nitrogen base without amino acids, 20 g·L−1 Agar NOBLE when solid cultures are used, 22 g·L−1 fructose, 0.22 g·L−1 glucose, 0.22 g·L−1 galactose, and 0.79 g·L−1 CSM. The addition of CSM varied depending on which auxotrophies were needed in the growth medium. All strains were incubated at 30 °C and shaken at 200 rpm.
2.4. Strain Construction
Homologous regions (HR) to guide the yECFP transcription unit to the desired locus were amplified from yeast genomic DNA with the PrimeSTAR HS polymerase, according to the manufacturer’s protocol. This polymerase was also used for Circular Polymerase Extension Cloning (CPEC) to clone the homologous regions into an
E. coli storage vector backbone, with an annealing temperature of 55 °C and an elongation time of 1 min/kb [
26]. Colonies obtained after electroporation were verified by PCR with OneTaq
® 2X mastermix (manufacturer’s protocol) prior to cryovial storage and plasmid isolation. The yECFP gene was ordered from IDT as gBlock. The
TEF1 promoter and
CYC1 terminator are native to
Saccharomyces cerevisiae and were amplified from genomic DNA similar to the HR. The transcription unit was assembled by CPEC and replaced the coding sequence of the target location within the HR plasmids. Downstream of the yECFP transcription unit, a selection marker was incorporated to select correct transformants after genomic integration.
From these assembled plasmids, linear DNA was amplified, encompassing the homologous regions, transcription unit, and selection marker, with the high fidelity PrimeSTAR HS polymerase and introduced into yeast cells according to the high efficiency Gietz transformation [
27]. Sequences of the linear integration cassettes are provided in
Supplementary Figure S1 and Supplementary Table S1. Colonies were verified by EmeraldAmp (manufacturer’s protocol) to confirm the replacement of the coding sequence with the yECFP transcription unit and selection marker. The presence of LoxP sites neighboring the selection marker allowed its excision by the Cre recombinase. This recombinase was introduced in the yeast strains on a plasmid (pSH47, Euroscarf), also according to the Gietz transoformation. Galactose induction to express the Cre recombinase was performed overnight with a galactose concentration of 20 g·L
−1. In the morning, a 10
−5 dilution series was plated on medium selective for pSH47 (SD-CSM lacking uracil) but not selective for the marker present in the genome. Colonies were subsequently checked for presence/absence of growth on medium selective for the genomic marker by spotting them on (non-)selective SD-CSM plates. Correct colonies were verified by PCR, and pSH47 was removed by means of counterselection with 5-fluoroorotic acid (1 g·L
−1). An overview of all strains is given in
Figure 1.
2.5. In Vivo Fluorescence Measurements
Yeast strains were grown in a black 96-well plate (Greiner, Vilvoorde, Belgium), where the medium was refreshed approximately every 12 h (sequential batch set-up). The medium used for all strains was SD-CSM medium devoid of auxotrophies. Prior to the start of the experiment, strains were grown in two batches to allow for medium adaptation. For every batch, 10 µL (5%) grown culture was used to inoculate the next batch. Plates were continuously shaken at 30 °C in an orbital mode. At the start and end of each batch, the optical density (OD) was measured at 600 nm, as well as the yECFP fluorescence (435 nm/485 nm) with the Tecan Infinite machine 200 Pro. Prior to measurement, the 96-well plate was shaken for 60 s, with an amplitude of 2 mm and a frequency of 280.8 rpm. The gain for yECFP measurement was manually set at 100.
2.6. Calculations
The number of generations a culture reached was estimated through the correlation of the optical density and cell number:
where
n represents the number of generations,
c the number of cells at the end of the batch, and
C the number of cells at the beginning of the batch. A correlation between the colony-forming units and the optical density was used to calculate the number of cells in the culture (
Supplementary Figure S2).
The GST value was obtained by performing a two-tailed standard t-test of the yECFP/OD600 compared against all previous data points. In cases where the null hypothesis H0: µ1 = µ2 was rejected (p ≤ 0.05), the previous data point was chosen as GST value. Prior to the two-tailed standard t-test, the normal distribution was checked by means of the Shapiro–Wilk test and an F-test for homo- or heteroscedasticity (H0: ).
3. Results
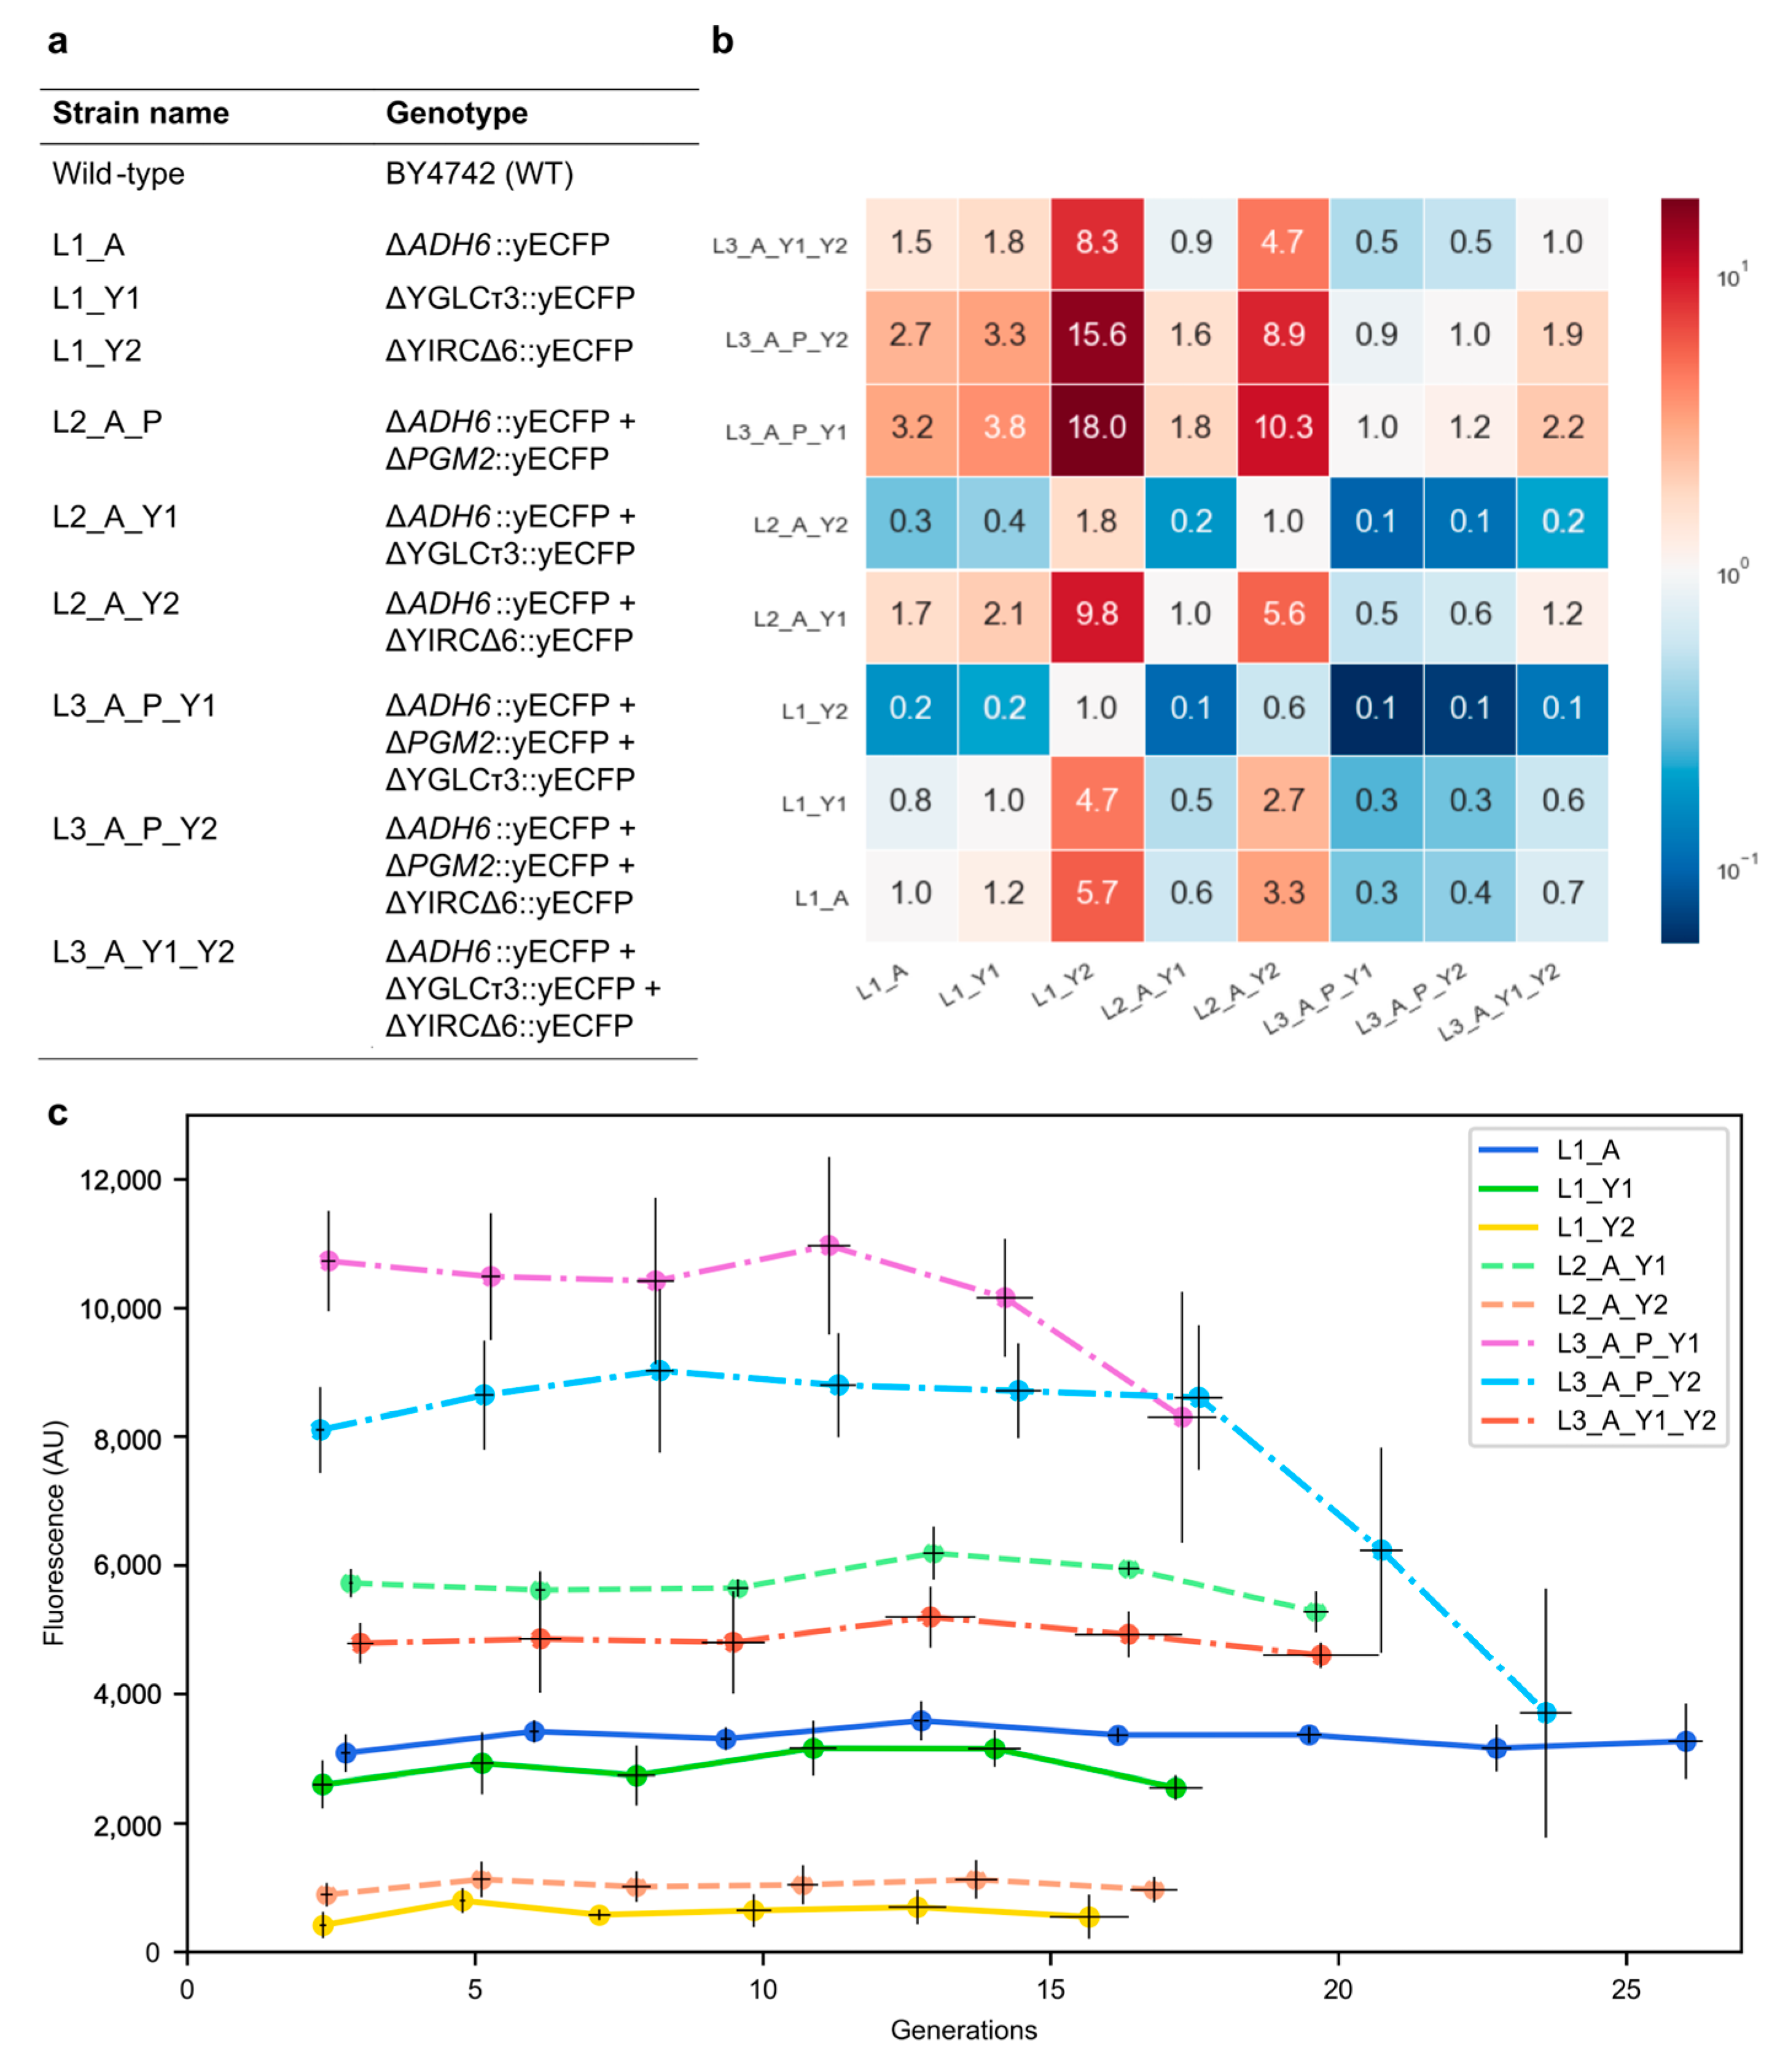
To investigate the production stability of genetically engineered baker’s yeast over time (generations), the yeast-enhanced cyan fluorescent protein (yECFP) reporter gene was introduced into the genome of the wild-type yeast BY4742 at one or more locations (
Figure 1). A first experiment was conducted by examining several strains carrying one to three copies of yECFP on different genomic locations, potentially giving rise to genetic instability. The coding sequences or retrotransposons present at these locations were knocked out, and a transcription unit for yECFP was knocked in simultaneously. First, the alcohol dehydrogenase gene
ADH6, located on chromosome 13, was chosen, as industrial processes often want a maximal product yield and, thus, no loss of carbon through side products such as ethanol [
28]. Aside from this gene, two retrotransposon locations, YIRCΔ6 (chromosome 9) and YGLCτ3 (chromosome 7), were examined. Retrotransposons are mobile elements that can propagate in the genome, thus potentially giving rise to strain instability [
29]. Both retrotransposon locations were previously investigated pertaining to their initial output level by Flagfeldt and colleagues [
24]. As a preliminary study, experiments were carried out in a sequential batch set-up on a 96-well plate with medium replacement every 12 h to allow for sufficient replicates and to minimize the effects of process conditions.
As can be observed from
Figure 1, differences in yECFP expression between single-copy strains were present, with the
ADH6 and YGLCτ3 locations resulting in a higher expression level than the YIRCΔ6 location. The effect of a second copy was examined by introducing the same TU for yECFP at the
ADH6 locus in strains L1_Y1 and L1_Y2. Elevated fluorescence levels were observed, although the fluorescence of strain L2_A_Y2 was only slightly enhanced. Moreover, the double-copy strain L2_A_Y2 had a lower fluorescence level than the single-copy strain L1_A. The selection of the YIRCΔ6 locus for efficient production in an industrial set-up is, thus, not recommended. In the case of the Y1 locus, the addition of an extra copy had almost exactly doubled the output (2.06 times L1_Y1), as expected. Increasing the copy number to three revealed several interesting fluorescence profiles. We selected the phosphoglucomutase locus
PGM2 (located on chromosome 13), which was active in the central carbon metabolism [
30], as an additional location to examine intrachromosomal stability; this gene was located on the same chromosome as
ADH6. The strains L3_A_P_Y1 and L3_A_P_Y2 could, thus, be compared to L3_A_Y1_Y2, which contained three TUs on three different chromosomes. At first glance, a lower output of the latter strain compared with the intrachromosomal strains was observed, confirming the fact that the Y2 locus is not recommended. Adding a third copy of the TU at the
PGM2 locus elevated the output 1.8-fold compared with the L2_A_Y1 combination. However, compared with the L2_A_Y2 combination, the improvement was 9-fold. These results indicated that combinations were not predictable, as synergistic and antagonistic effects could be at play.
Aside from the initial fluorescence of yECFP on these loci, the stability of fluorescence was examined over 15 to 25 generations. For the single-copy strains, a stable output profile was observed within this timeframe. In addition, both two-copy strains showed a robust output over 15 generations or longer. Concerning the three copy strains, a more stable output pattern of the interchromosomal strain (L3_A_Y1_Y2) compared with both intrachromosomal strains (L3_A_P_Y1 and L3_A_P_Y2) was observed.
Based on the output profile, several novel parameters could be introduced with the aim to standardize the microbial host assessment pertaining to the stability of their output prior to scale-up to industrial fermentations. At a certain generation, it could be determined that this output deviated from all previous data points. We named the point prior to this the ‘last generation of stability’, the GST value, representing the generation from which the output digresses from the initial output. Taking into account the normal distribution of the replicates and homo- or heteroscedasticity, we used a two-tailed standard t-test to calculate this parameter for strains L3_A_P_Y1 and L3_A_P_Y2. Their GST values were 14.2 and 17.6, respectively. In practice this means that the output on these loci was stable until these generations, and host instability occurred from then on. Concerning the other engineered yeast strains, no instability was observed in the first 15 to 25 generations, and, thus, no GST value was calculated.
Moreover, the output of a microbial production host during a fermentation process should also be evaluated on a more global scale, in line with the process parameter ‘productivity’. Indeed, the ‘overall microbial robustness parameter’ (oR) can be introduced; this parameter is calculated as the difference in output between the beginning and the end of the fermentation divided by the number of generations in between. Ideally the output level of a microbial production host should not decrease over time. The desired oR values, thus, center around zero (stable profile) or are negative (output increasing over time). An oR value around zero was calculated for all strains except L3_A_P_Y1 and L3_A_P_Y2. These three-copy yeast strains, showing instability at some point during the fermentation, had positive oR values, indicating a decrease in output over time. The general trend was, thus, an elevated output instability for the higher-copy strains where the transcription units were located on the same chromosome. The (lack of) robustness observed with the GST values was, thus, confirmed in this oR value.
Although being the most unstable production strains, the three-copy strains overall had the highest output, which could be concluded by looking at their cumulative output (
Supplementary Figure S3). Considering this cumulative production, a straight line over the generations would be the desirable outcome. This was the case for all strains except for L3_A_P_Y1 and L3_A_P_Y2, indicating that these strains lost potential production capacity over generations. This can best be visualized by plotting a straight line based on the slope of all data points until the G
ST value in an output-versus-generations plot is reached, hereafter referred to as the maximal production capacity of a certain strain. In such a cumulative output graph, the effects of heterogeneity are visualized, as well as the extent of ‘potential product loss’ (PPL). The latter was calculated as the difference between the maximal production capacity and the actual production output at a given time point. In this case, the strains L3_A_P_Y1 and L3_A_P_Y2 had PPLs of 4.3% and 10.6%, respectively, compared with the maximal production capacity at the final data point. The PPL can be used as a measure for potential strain improvement regarding strain stability. In addition to visualizing the important PPL parameter, the cumulative plot is less susceptible to variations in production. The standard deviations presented in
Figure 1 were calculated on eight biological replicates on the same time point, while the standard deviations from the cumulative graph were calculated by the sums of each replicate until that time point.
The presence of three copies of a gene spread over the genome of the baker’s yeast clearly had its effect on the heterogeneity. However, one can expect a similar effect of strains carrying two copies, or even a single copy, given the burden they can cause. To study this, a second sequential batch experiment was performed for over 100 generations with the strains L1_A and L2_A_P. The latter strain contained two copies of the yECFP transcription unit on the same chromosome. The G
ST values for these strains were calculated as mentioned above and were 60.8 for L1_A and 54.1 for L2_A_P. These G
ST values were higher than those of the three-copy strains; this was in agreement with the previous experiment, where it was shown that increased copy numbers led to increased instability. The cumulative output of both strains is given in
Figure 2. Similar to the first experiment, the actual cumulative titers were lower than the estimated maximal production capacity, indicating room for improvement during the strain optimization pertaining to robustness. The PPL of strain L1_A was 34.7% at generation 123, while that of L2_A_P was 42.7% at generation 129.
Aside from determining the G
ST value, the overall robustness parameter oR, and the potential product loss (PPL), the ‘rate of output change’ (ROC) was also important. In order to visualize this change, the output over generations data was fitted to a third-degree polynomial from which the first derivative was taken, resulting in a parabolic plot. As we have observed from the second sequential batch experiment, the initial fluorescence was stable until the G
ST, declined afterwards, and ‘stabilized’ at a lower output, which conformed to our parabolic first derivative. This parameter is represented in
Figure 2 for strains L1_A and L2_A_P during the second sequential batch experiment. These plots give an in-depth description of the course of the output during the fermentation, as the curvature of the parabola is representative for the robustness of a strain’s output. A robust strain has a rate of output change near the zero-line, indicating that the single-copy strain L1_A was more robust than the double-copy strain L2_A_P, as was concluded earlier. This curvature of the parabola could be represented by the rate of output change at the vertex, resulting in -116 for L1_A and -191 for L2_A_P. A higher ROC value for a strain, thus, indicates a more robust strain. Aside from determining the rate of output change of a strain, the potential product loss (PPL) was also visualized by the area between the curve and the zero-line from the G
ST time point on. An overview of the values of the novel parameters for each strain during both experiments is given in
Figure 2.
4. Discussion
To the best of our knowledge, no analogous studies have been performed, and no parameters pertaining to strain robustness and population heterogeneity for industrial fermentation processes have been described. In the case of
E. coli, Goormans et al. investigated 49 intergenic regions throughout its genome pertaining to their expression capacity [
31], while Flagfeldt and colleagues investigated the expression level of 20 genomic locations of baker’s yeast by using LacZ as a reporter gene and observed differences among integration sites [
24]. Our study incorporated two of those genomic locations, the retrotransposon sites YIRCΔ6 and YGLCτ3, and employed the same
TEF1 promoter and
CYC1 terminator for the expression of the reporter gene but differed in the reporter gene (yECFP instead of LacZ), the growth medium (defined SD-CSM compared with complex YPD), and the wild-type yeast used (S288c versus CEN.PK113-5D). Flagfeldt et al. noted a comparable expression level of LacZ at the YIRCΔ6 and YGLCτ3 integration sites, while our study clearly indicated a higher yECFP fluorescence for YGLCτ3. This discrepancy could be due to experimental differences, such as complex versus defined media. However, the variations of the single-copy strains at the start of the fermentation (
Figure 1b) were in the range with the maximal 8.7-fold difference published by Flagfeldt and colleagues.
In addition to the initial output of (single-copy) strains, the microbial population should homogenously express the desired protein or compound to ensure reproducibility and output stability, which is crucial for industrial processes. As was observed in this study, an increasing number of gene copies or generations had a negative effect on the yECFP output of the yeast strains. While various biological factors, such as mutations and epigenetics [
32], or physicochemical factors, such as environmental spatiotemporal changes [
33], could contribute to varying extents to this decrease in output, the baker’s yeast’s native homologous recombination machinery was highly efficient [
34] and could play a major role. It was, thus, essential to take into account the genetic tractability of microorganisms and their robustness pertaining to industrial fermentation processes. Our results confirmed previous expectations that a higher-copy-number strain is more likely to show more variation in output, as it is more prone to genetic instability [
35]. The introduction of heterologous genes and the knock-out of native genes introduces a burden upon the cells, which is being counter-selected by growth [
36]. Therefore, cells diminishing their target output have an advantage over cells spending resources on this target output, resulting in biological heterogeneity. During DNA replication, for example, double-stranded DNA breaks can, in a multi-copy strain, be wrongly repaired by one of the additional copies, altering the genome of the cell [
35]. This type of heterogeneity was observed not only for our fluorescent output but also for most other industrial processes, as the microbial hosts are being pushed towards maximal production of a desired compound instead of towards maximal growth [
37].
As this was a preliminary study with a simple, fluorescent reporter gene to showcase the need for strain robustness and the characterization thereof, future studies should elaborate on these findings and validate them with more representative genomic modifications. The yECFP is a short protein, requiring plain post-translational modifications and structural folding [
38]. On the one hand, more complex proteins, such as monoclonal antibody fragments, could be used to investigate the effect of production over time and to validate the strain-specific parameters postulated in this manuscript. On the other hand, the biosynthesis of metabolites might tax the microbial cell in a different way than do proteins [
39]. Therefore, biochemical pathways of β-carotene or violacein, for example, two pharmaceutically interesting pigments requiring a multi-gene pathway for their biosynthesis [
40,
41], could be introduced at one or more genomic locations. Due to the increased complexity of biochemical pathways compared with single transcription units, the lack of robustness in output is expected to be more pronounced for such studies.
A final remark on the employed set-up revolves around the fermentation conditions. This study was performed on a very small scale with 96-well plates, while industrial fermentations require large capacities, meaning that the conditions experienced by the yeast strains differ significantly from bioreactor conditions. Typically, microbial populations are more strictly controlled in a bioreactor environment, as the pH, dissolved oxygen, agitation, and respiration are monitored and could be used to steer the fermentation process. In addition, the shear stress experienced by the microorganisms in a bioreactor is higher due to the mechanical stirring, and spatiotemporal heterogeneity often occurs due to compartmentalization in the vessel, leading to fluctuating concentrations of nutrients, dissolved gases, and metabolites [
42]. Nevertheless, this preliminary study clearly demonstrated that yeast strains might drop their productivity over time, jeopardizing the industrial fermentation processes.
5. Conclusions
It is clear that the robustness of the output of a microbial host over the generations is an important issue to consider in the development of a biotechnological production process. The difference in initial output between strains containing a sole copy of the reporter gene yECFP was in line with the current literature; however, no results were previously published about the temporal heterogeneity of the yeast strains engineered to produce a heterologous protein. At a multi-copy level, the outcome became unpredictable, as both synergistic and antagonistic effects were observed. While validation with the production of more complex proteins or pathways for the biosynthesis of metabolites, as well as in bioreactor conditions, is still warranted, the results presented here aimed to open the debate on strain robustness and the gap between strain engineering and their application in industrial processes. To the best of our knowledge, this study is the first of its kind, and no analogous studies have been published.
To standardize the observed lack of robustness, new and host-specific parameters were introduced. The ‘last generation of stability’ (GST) is determined as the generation after which the output digresses from the previous output level and, thus, becomes unstable. The ‘rate of output change’ (ROC) describes the manner in which a strain produces a desired product, while the ‘overall robustness’ (oR) is calculated as the difference between the initial and final output divided by the number of generations between both. Finally, the ‘potential product loss’ (PPL) parameter indicates the difference between the maximal production capacity and the actual production output. Together with the process parameters titer, yield, and productivity, these strain-specific parameters aim to speed up strain development in a robust manner.
To overcome a drop in production over time, the time between strain construction and industrial application is often kept as short as possible. The results presented here postulate that the location of genomic integration of heterologous genes significantly influences the robustness of newly developed strains and should, thus, be carefully considered during the design of microbial cell factories. Not only does such a design warrant closer inspection of integration sites, it should also examine the combinatorial effect in cases where multiple copies of the heterologous gene(s) are desired. A streamlined strategy between the fermentation process set-up and strain development should be targeted to establish robust microbial cell factories, leading to improved bioprocesses for the synthesis of proteins as well as bulk and specialty chemicals by means of microbial fermentation.


 ,
, 

