Article

Dual Emerging Applications of Solid-State Fermentation (SSF) with Aspergillus niger and Ultrasonic-Assisted Extraction (UAE) for the Obtention of Antimicrobial Polyphenols from Pineapple Waste

by
Sarah L. Paz-Arteaga
1,
Edith Cadena-Chamorro
2,
Liliana Serna-Cock
3,
Harlen Torres-Castañeda
3,
Omar V. Pabón-Rodríguez
3,
Carlos E. Agudelo-Morales
4,
Nathiely Ramírez-Guzmán
5,
Juan A. Ascacio-Valdés
6,
Cristóbal N. Aguilar
6 and
Cristian Torres-León
7,*
1
Faculty of Sciences, Universidad Nacional de Colombia, Medellín 050034, Colombia
2
Faculty of Agricultural Sciences, Universidad Nacional de Colombia, Medellín 050034, Colombia
3
Faculty of Engineering and Administration, Universidad Nacional de Colombia, Palmira 763533, Colombia
4
Faculty of Agricultural Sciences, Universidad Nacional de Colombia, Palmira 763533, Colombia
5
Center for Interdisciplinary Studies and Research, Universidad Autonoma de Coahuila, Saltillo 25280, Mexico
6
Bioprocesses & Bioproducts Research Group, School of Chemistry, Universidad Autonoma de Coahuila, Unidad Saltillo, Saltillo 25280, Mexico
7
Research Center and Ethnobiological Garden (CIJE), Universidad Autonoma de Coahuila, Unidad Torreón, Viesca 27480, Mexico
*
Author to whom correspondence should be addressed.
Fermentation 2023, 9(8), 706; https://doi.org/10.3390/fermentation9080706
Submission received: 23 June 2023 / Revised: 9 July 2023 / Accepted: 18 July 2023 / Published: 26 July 2023
(This article belongs to the Section Fermentation Process Design)

Abstract

:
The exploration of natural antimicrobial compounds is necessary due to the current bacterial resistance to synthetic antibiotics. For this reason, pineapple residues were evaluated as a natural source of phenolic compounds with antimicrobial capacity. Pineapple residues were fermented with A. niger GH1 and subjected to ultrasound for the extraction of phenolic compounds. In the solid-state fermentation (SSF), the peel and the core (70:30) were fermented for 32 h. Ultrasonic-assisted extraction (UAE) was optimized. The factors solid–liquid ratio (X1), ethanol concentration (X2), and extraction cycle (X3) were optimized through a Box–Behnken statistical design, using the total phenol content (TPC) as a response variable. The optimized and pre-purified extract with amberlite was characterized using HPLC-MS and we measured the antimicrobial activity against Listeria monocytogenes, Staphylococcus aureus, and Escherichia coli. The optimal values for X1, X2, and X3 were 82 mg/mL, 26%, and two cycles, respectively. The extract was effective as an antimicrobial agent against S. aureus and L. monocytogenes, with MICs of 50 mg/mL and 12.5 mg/mL, respectively; the bacterial growth curve and transmission electron microscopy (TEM) confirmed the antimicrobial activity. The main compounds identified in the antimicrobial extract were 3,4-DHPEA-EA, Phloretin 2′-O-xylosyl-glucoside, and Feruloyl tartaric acid. Overall, the combination SSF-UAE showed to be a promising strategy to recover phenolic compounds from pineapple residues, exhibiting great potential as a natural antimicrobial agent.

1. Introduction

The pineapple is one of the most produced fruits in tropical and subtropical countries. The largest pineapple producer in the world is Costa Rica, followed by the Philippines and Brazil. Approximately 60% of pineapple is by-products. Pineapple waste consists mainly of peel (29–42%), core (9.4–20%), and crown (2.7–5.9%) [1]. Much of these by-products are burned and disposed of in landfills. The decomposition of these residues produces greenhouse gases and bad odors, among other complications [2]. This is why the incorporation of these wastes into circular economy processes has been studied. Due to their chemical composition, pineapple by-products can be used in the food and pharmaceutical industry to produce high-value-added compounds such as phenolics [3], proteins [4], and polyhydroxyalkanoates [5].
Phenols have been extensively studied as antimicrobial agents due to increasing cases of bacterial resistance to synthetic antimicrobials. Some of the phenolic structures present in pineapple residues are linalool, α-terpineol, and furfural, studied for their inhibitory effect against Escherichia Coli, Listeria monocytogenes, and Staphylococcus aureus [6].
The problem with phenolic compounds is that they are bound to the biological matrix of the waste. One of the environmentally friendly ways of extraction is solid-state fermentation (SSF). SSF breaks the covalent bonds that hold together the phenolic compounds of other compounds in the biological matrix such as lignin, cellulose, and hemicellulose. Although fermentation allows the release of phenolic compounds, it is often sought to improve the extraction process with other methodologies [7].
Currently, assisted extraction with unconventional methods is widely used. Some of these methods are ultrasound, microwave-assisted extraction, pressurized liquid extraction, and supercritical fluid extraction. These techniques include less use of hazardous solvents, high extraction yields, and fewer hours to achieve satisfactory recoveries [8].
A simple solid–liquid extraction, although effective in many cases, can be improved if assisted by the unconventional techniques mentioned above [9]. The ultrasonic waves produced in ultrasound are highly efficient for the release of compounds within cells because they damage cell walls. This phenomenon occurs because the waves cause cavities inside the plant material via the contraction and expansion of the molecule [10].
Other studies have worked on ultrasound-assisted fermentation [11], but no literature has been found that worked on ultrasound as a second treatment after SSF. As a result of the above and following the twelfth Sustainable Development Goal adopted in 2015 by the United Nations, “responsible production and consumption” establishes the efficient management of waste; this work aims to evaluate the antimicrobial activity against Listeria monocytogenes, Staphylococcus aureus, and Escherichia coli of phenolic compounds extracted from fermented pineapple residues via ultrasound.

2. Materials and Methods

2.1. Reagents

In the extraction process, analytical grade of ethanol was used, Sigma-Aldrich (St. Louis, MO, USA). For microbiological tests, palcam Oxoid agar, bear parker Merck KGaA (Darmstadt, Germany) y Mueller–Hinton Merck KGaA, and nutrient broth were used. For transmission microscopy, glutaraldehyde, sodium bisphosphate (NaH2PO4), osmium tetroxide from Sigma-Aldrich, and resin preparation kit from Ted Pella, INC. (Redding, CA, USA) were used.

2.2. Microorganisms

For this study, the strain GH1 of A. niger belonging to the DIA-UAdeC collection and deposited in the Micoteca of the University of Minho with number MUM:23.16 was used. The fungus was reactivated by adding 1 mL of the frozen solution to PDA agar, then incubated for 7 days at 30 °C.
Listeria monocytogenes ATCC 7644, Staphylococcus aureus ATCC 29213, and Escherichia coli OM757876 were obtained from the bioconversion laboratory at Universidad Nacional de Colombia. The strains were reactivated on palcam, bear parker, and Mueller–Hinton agar at 37 °C for 24 h, respectively.

2.3. Obtaining the Fermented Material

2.3.1. Tests of Support in Solid-State Fermentation

In previous studies published by Paz-Arteaga et al. [12], to determine the percentage of humidity necessary for the good growth of A. niger, Water Absorption Index (WAI) and Critical Humidity Point (CHP) tests were carried out on three different particle sizes of pineapple residues (1: small < 0.25 mm, 2: medium 0.25–2.3 mm, and 3: all material < 0.25–2.3 mm).
In addition, invasion capacity was evaluated by measuring the growth kinetics of Aspergillus niger GH1 in Petri dishes, with a humidity of 65% (above the critical humidity point and below the maximum moisture). An 8 mm fragment of mycelium was inoculated in the center of the Petri dish, previously activated in PDA agar. The fragment was obtained using a sterile punch and we measured its radial growth every 12 h. The value was reported as mm/h.

2.3.2. Solid-State Fermentation

Petri dishes (10 cm diameter) were used as reactors for fermentation, 2 × 10⁷ spores per g and 8 g of dry material between pineapple peel and core (70:30) with a particle size between <0.25 and 2.3 mm, a humidity of 65% was used. In a previous study [12], the release of phenolic compounds during fermentation time was evaluated. It was found that after 32 h of fermentation, there is no significant increase in phenolic compounds. The fermentation was carried out until 32 h and the material was refrigerated (4 °C) until it was used in the optimization process.

2.4. Extraction of Phenolic Compounds

The samples were homogenized using a vortex (Kinematica AG, Lucerna, Switzerland) at 9000 rpm for 1 min. All extractions were performed with ultrasound (Branson Scientific Ultrasonic 2510) at 37 °C and with a frequency of 40 kHz. The temperature of the water in the ultrasound was continuously monitored with a mercury thermometer, which allowed exact temperature control during the extraction process. The extraction was carried out in 2 mL Eppendorf containers.

2.5. Preliminary Analysis of Extraction of Bioactive Compounds

Tests were carried out to determine the extraction time in the ultrasound equipment. The phenolic content was evaluated every 5 min until 90 min, using 120 mg/mL and 50% of ethanol. It was determined that after 45 min of ultrasound extraction, the amount of phenolic content did not have a significant difference; therefore, for future experiments, the extraction time was established at 45 min.
Preliminary analyses were performed to determine the limits and center points that were used in the optimization process (Section 2.6). For the center point of the solid–liquid ratio (X1), tests were performed every 30 mg/mL between 30 and 120 mg/mL with X2 of 50% and X3 of 3 cycles. Similarly, for the center point of the ethanol concentration (X2), tests were performed every 20% between 0 and 100% with X1 of 120 mg/mL and X3 of 3 cycles. Finally, at the center point of the extraction cycles (X3), tests were performed every 1 cycle between 1 and 5 with X1 of 120 mg/mL and X3 of 50%.
To measure the TPC of each sample, at the end of each cycle the supernatants were combined in test tubes, and at the end of the total cycles each sample was brought to 5 mL so that all the samples evaluated had the same volume. The extracts obtained were stored at −60 °C until the evaluations of phenolic content and antimicrobial capacity were carried out. Each extraction process was performed in triplicate.

2.6. Box–Behnken Design

The results obtained in the previous numeral were used as a reference to carry out a Box–Behnken statistical design with three factors, three levels, and one response variable. The factors were established in three codified levels, as observed in Table 1. The design consisted of 15 randomized runs (n = 45, and each extraction process was performed in triplicate). The content of phenolic compounds was chosen as the dependent variable because other authors have verified their antimicrobial activity [13]. The Box–Behnken data were approximated to a second-order polynomial equation and an analysis of variance was generated (ANOVA) to determine individual linear, quadratic, and interaction regression coefficients.

2.7. Total Phenolic Content (TPC)

The TPC was determined following the methodology described by Molyneux [14]. The measurement was carried out in a 96-well microplate. A volume of 20 µL of each of the samples was taken and mixed for 5 min with 20 µL of Folin–Ciocalteu reagent. After 5 min, the samples were mixed with 20 µL of sodium carbonate (0.01 M) for 5 min and, finally, 125 µL of distilled water was added. Subsequently, the reading was carried out at 750 nm in a microplate reader (Biotek ELx800). Results were expressed as mg gallic acid/g dry matter. The calibration curve was made by measuring the absorbance of known concentrations of gallic acid to obtain the phenolic content of the extract of each sample.

2.7.1. Identification of Compounds Using RP-HPLC-ESI-MS

The extract obtained with the conditions optimized in Section 2.5 was dried in a convective oven at 60 °C and reconstituted in distilled water. Then, the extract was pre-purified with amberlite XAD 16 and filtered through a 0.45 µm nylon filter.
For the identification of compounds using RP-HPLC-ESI-MS, 1.5 mL of the filtered extract was taken and injected into the HPLC (C18 column: 150 mm × 2.1 mm, 3 µm) (Grace, Deerfield, IL, USA). The Varian HPLC system consisted of an autosampler (Varian Pro Star, CA, USA), a PDA detector (Varian Pro Star, CA, USA) (eluents: formic acid and acetonitrile), and a ternary pump (Varian Pro Star, CA, USA) [15].

2.8. Antimicrobial Activity

2.8.1. Determination of Minimum Inhibitory Concentration (MIC)

The antimicrobial activity was evaluated through the MIC using the microdilution method [16]. In each well, 20 µL of the optimized extract, 20 µL of pathogenic bacteria, and 160 µL of culture medium were added (nutrient broth). The optimization sample was dried in an oven at 40 °C (Binder, Tuttlingen, Germany) for 6 h, then the sample was diluted in distilled water, pre-purified with amberlite XAD 16, dried again, and reconstituted in sterile water to obtain concentrations between 100 mg/mL and 3 mg/mL. To obtain a known concentration of colony-forming units (CFU) for each pathogen (L. monocytogenes, S. aureus, and E. coli), a NaCl solution (8.5%) was adjusted to an optical density (OD600) between 0.15 and 0.20. The positive control had a culture medium with the bacteria and the negative control (sterility) had a culture medium and saline without the bacteria. Penicillin (500 mg) was used as a reference standard. The microdilution plates were then incubated at 37 °C for 24 h under aerobic conditions. Then, 5 μL of each well was transferred to the specific agar for each bacterium to check the inhibition resulting from the interaction of the optimized extract with the pathogen. The culture media was incubated at 37 °C for 24 h. The MIC was established as the concentration at which the growth of the least amount of colonies was identified.

2.8.2. Bacterial Growth Curve

The bacterial growth curve was performed following the methodology described by Babii et al. [17]. In this assay, only the bacteria that presented inhibition with the optimized extract in Section 2.7.1 were evaluated. In each well, 20 µL of MIC was added according to the test bacteria (50 mg/mL and 12.5 mg/mL), 20 µL of pathogenic bacteria (L. monocytogenes and S. aureus), and 160 µL of culture medium (nutrient broth). The positive control had a culture medium with the bacteria. The concentration of the antimicrobial and the CFU of each bacterium were standardized in the same way as in Section 2.7.1. Subsequently, the microdilution plates were incubated at 37 °C for 10 h. The reading of the microplates to evaluate the growth of the bacteria was carried out every hour in a microplate spectrometer at 630 nm.

2.8.3. Observation with a Transmission Electron Microscope (TEM)

The modified methodology described by Zeng et al. [18] was used to perform experiments with a TEM. In this assay, only bacteria that showed inhibition with the optimized extract in Section 2.7.1 were evaluated. A total of 300 µL of the optimized extract with MIC according to the test bacteria (50 mg/mL and 12.5 mg/mL), 300 µL of pathogenic bacteria (L. monocytogenes and S. aureus), and 2400 µL of culture medium (nutrient broth) were added to each test tube, and the positive control had a culture medium with the bacteria. They were incubated for 16 h at 37 °C and prepared for TEM analysis. Briefly, the four samples (L. monocytogenes with the optimized extract, S. aureus with the optimized extract, L. monocytogenes without the optimized extract, and S. aureus without the optimized extract) were centrifuged at 4500 rpm at 25 °C for 10 min, then 500 µL of fixative solution (2.5% glutaraldehyde) was added to the sediment and kept for 4 h, and the sediments were washed three times with phosphate-buffered solution (0.1 M, pH 7.1). Subsequently, bacterial cells were collected via centrifugation at 4500 rpm at 25 °C for 10 min; treated with 3% glutaraldehyde, 1% osmium tetroxide, acetone, and epoxy; washed four times with phosphate buffer (0.1 M, pH 7.1); and dehydrated with 5 concentrations of ethanol (100%, 90%, 70%, 50%, and 30%). Finally, samples were embedded in resin, cross-sectioned, and observed with a transmission microscope (H-600IV, Hitachi, Japan).

2.9. Statistical Analysis

All assays were performed in triplicate with independent samples, and all analyses were reported using means and standard deviations. The results were analyzed with ANOVA, and Tukey’s test was used to analyze the significant difference. Statistical analysis and experimental design were performed using Minitab 21.1.1 software and response surface plots were performed in MATLAB 2021b.

3. Results

3.1. Solid-State Fermentation

The particle size between <0.25 and 2.3 mm was chosen for the SST due to the results of WAI capacity (4.706 ± 0.117), CPH (61.950 ± 6.140 g/g), and radial growth (0.688 ± 0.054 mm/h) evaluated in the article [12] (Figure 1).
At 32 h of SSF of pineapple peel and core with A. niger GH1, 3.2 mgGAE/g dry matter was obtained. Polyphenols increased 75% concerning time 0.

3.2. Preliminary Analyses for Optimization

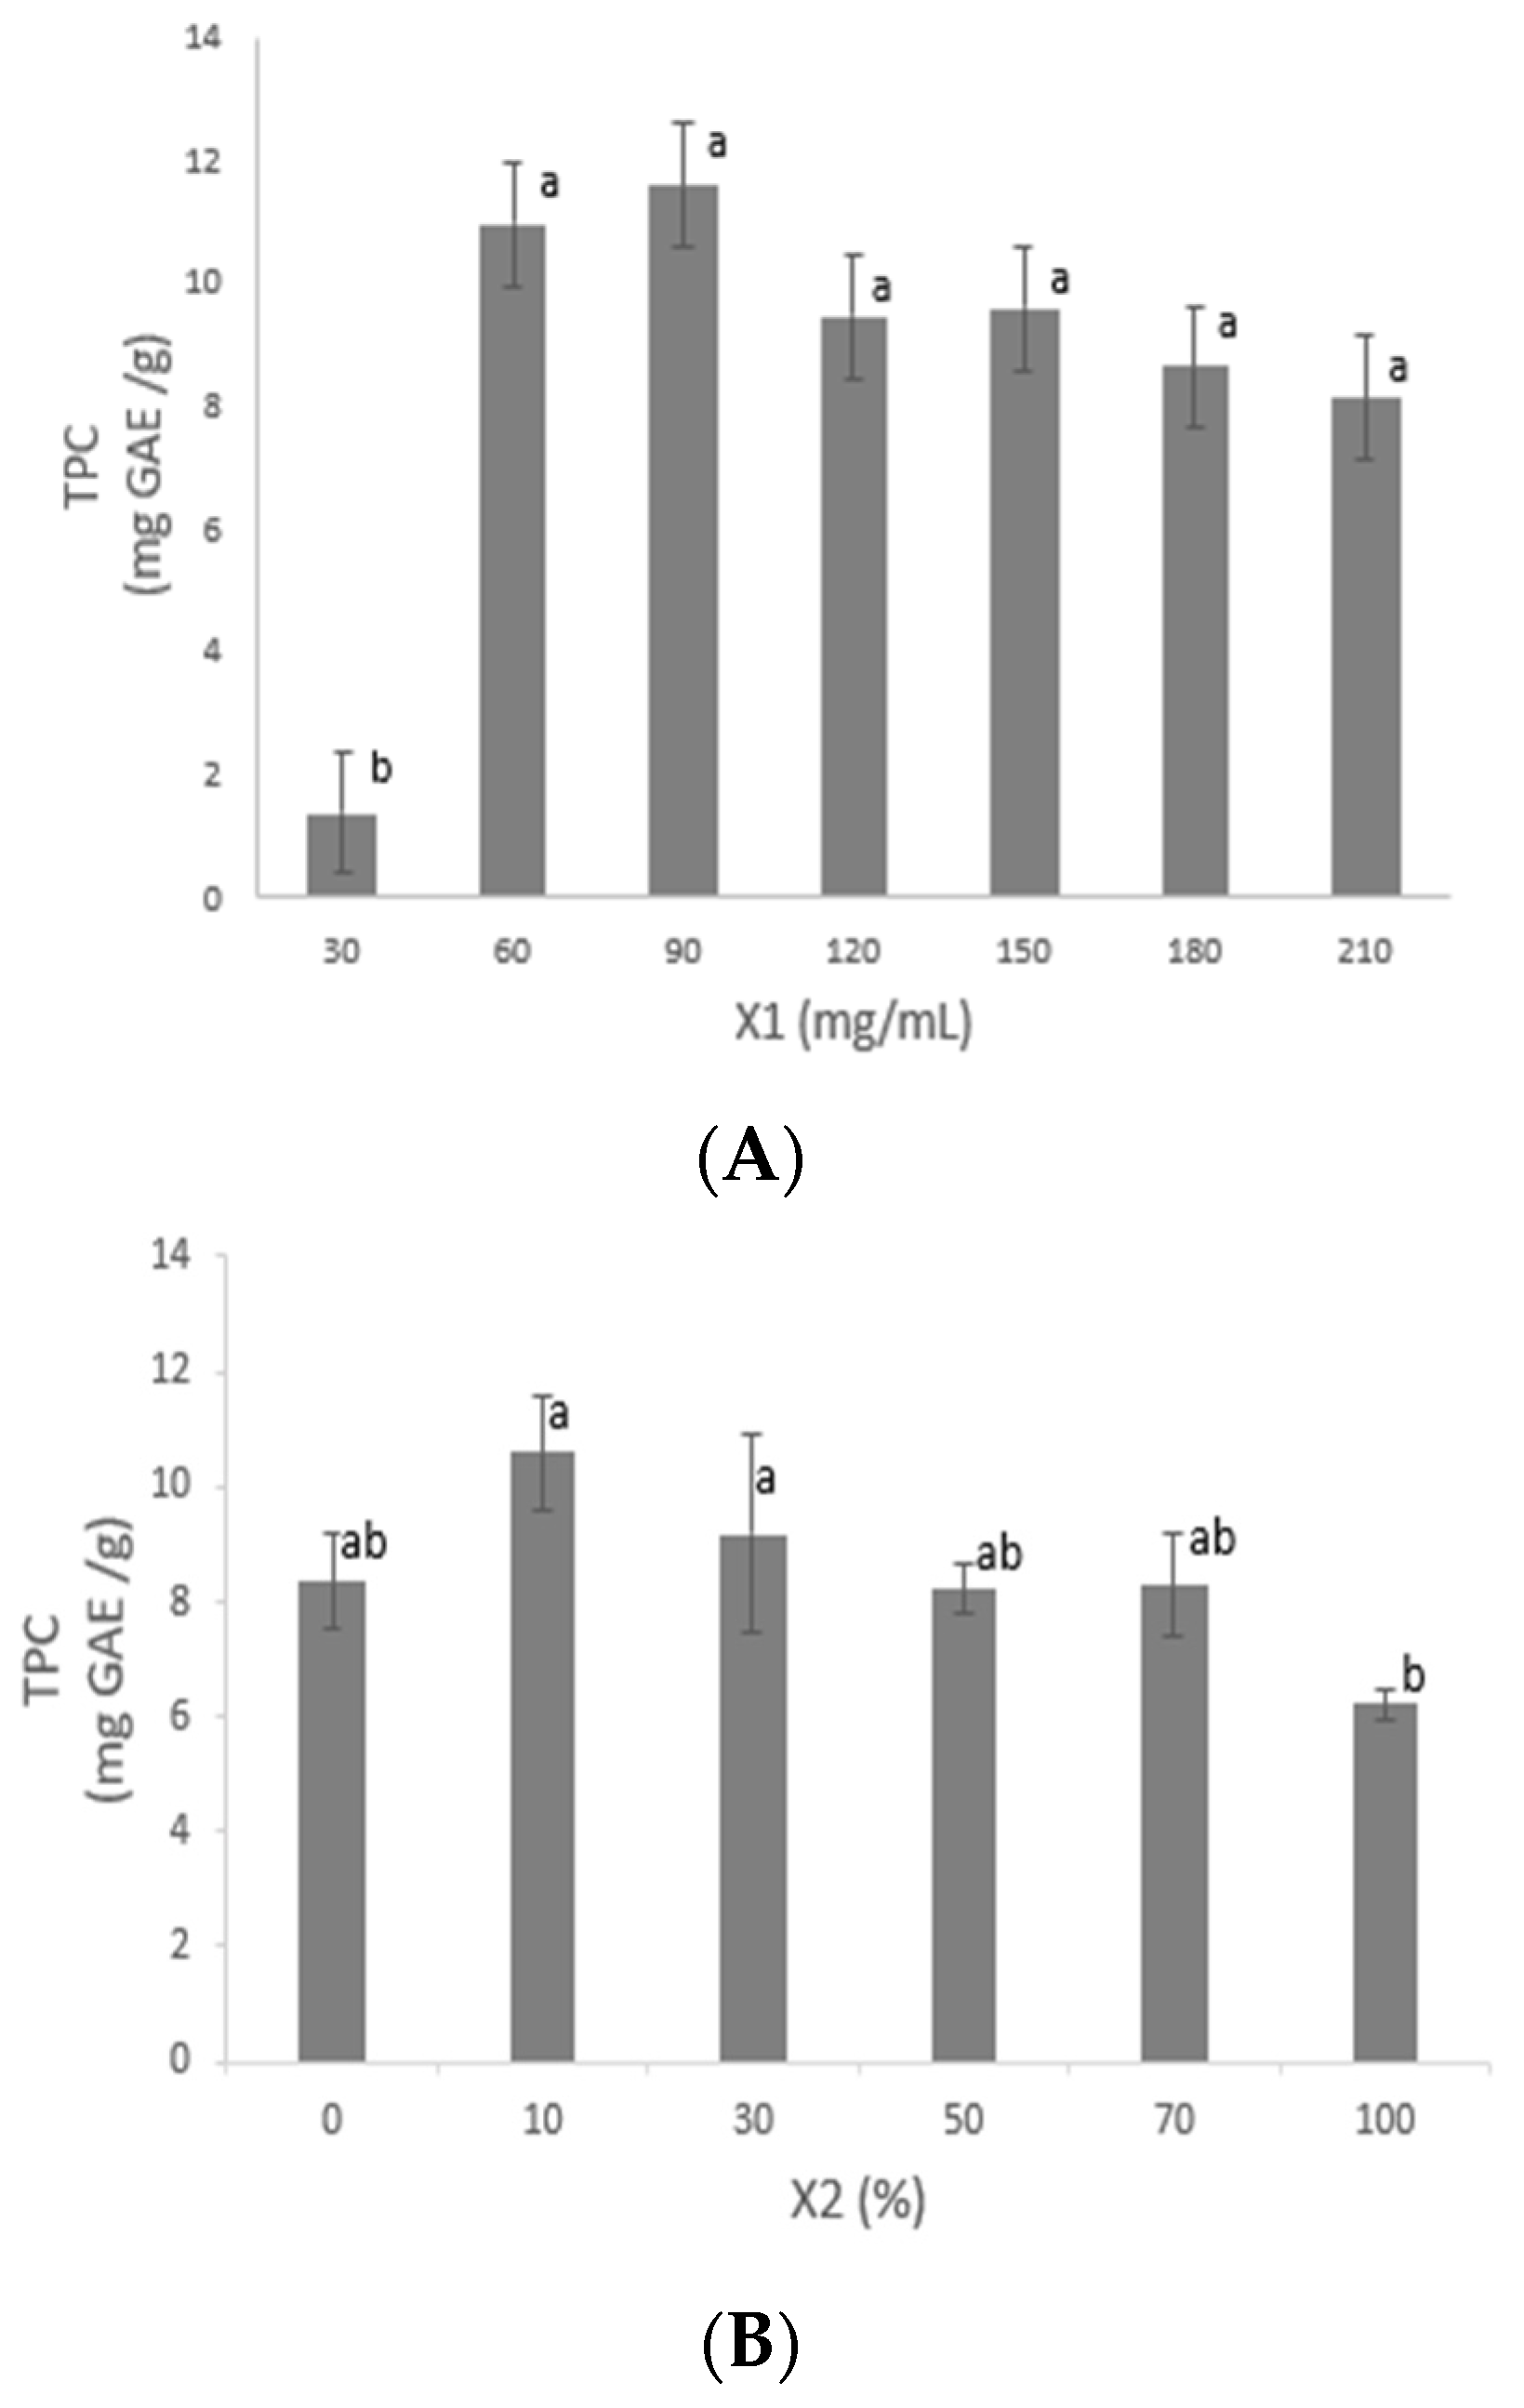
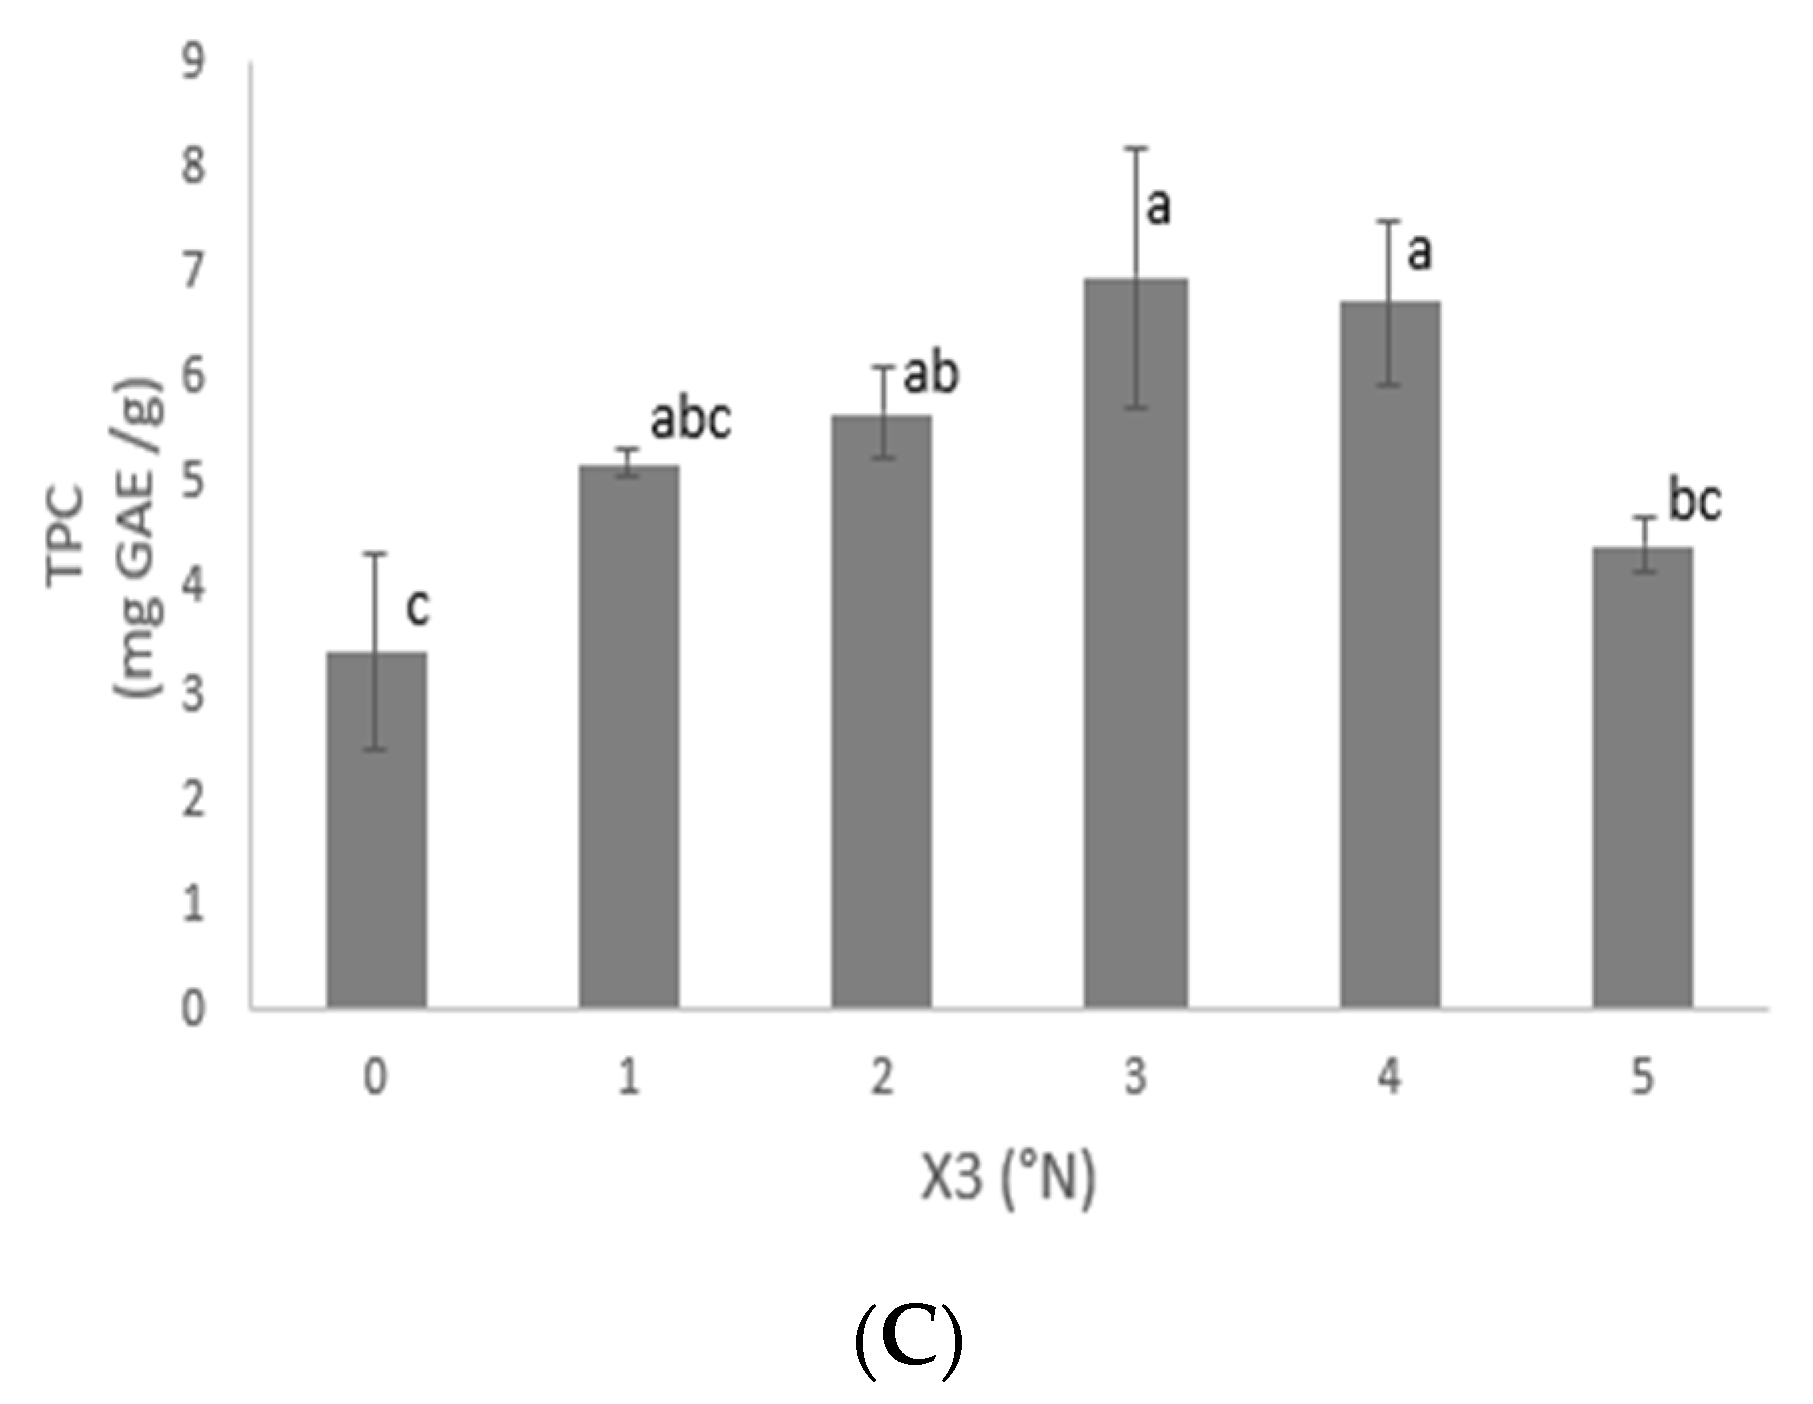
Figure 2 shows the results of the preliminary analysis of the interaction between the response variable (TPC) and the three factors evaluated (X1, X2, and X3). In addition, it was obtained that the TPC for the three factors evaluated first went up and then went down. Figure 2A–C show the samples where the best extraction was obtained, marked with the letter “a” by the Tukey test in the standard deviation bar. The analysis of the behavior of these figures made it possible to choose the center points (middle (0)) of the Box–Behnken design. For X1 it was 90 mg/mL, for X2 it was 50%, and for X3 it was three cycles (each 45 min cycle).

3.2.1. Solid–Liquid Ratio X1

Figure 2A shows the amount of TPC depending on X1. The highest X1 was between 60 and 90 mg/mL of ethanol. With X1 greater than 90 mg/mL, the phenol content decreased because the average viscosity started to increase. The lowest value of X1 evaluated (30 mg/mL) had a significant difference from the other values. The behavior of X1 concerning the TPC made it possible to establish the limits of this variable in the Box–Behnken design (Table 1).

3.2.2. Ethanol Concentration (X2)

The TPC as a function of X2 differed significantly (Figure 2). TPC extraction with 100% ethanol had a significant difference concerning extraction with 10% and 30% ethanol. Extraction was higher when between 10 and 30% ethanol was used. The behavior of X2 for the TPC made it possible to establish the limits of this variable in the Box–Behnken design (Table 1).

3.2.3. Extraction Cycle (X3)

Among the factors that affect TPC extraction is X3. As shown in Figure 2C, the highest amount of phenolic compounds was obtained in the third cycle and there was a significant difference between the extraction without cycles and that with five cycles. The behavior of X3 for TPC made it possible to establish the limits of this variable in the Box–Behnken design (Table 1).

3.3. Box–Behnken Design

The effect of X1, X2, and X3 on the dependent variable or response (TPC) were optimized with a Box–Behnken design. The multiple regression analysis on the experimental data (Table 2) is expressed with the following quadratic polynomial equation.
T P C = 9.31214 + 0.0253535 × X 1 + 0.0855959 1.06166 × X 3 0.000341706 × X 1 + 0.0000568958 × X 1 × X 2 + 0.0190796 × X 1 × X 3 0.000601747 × X 2 2 0.0379684 × X 2 × X 3 + 0.153779 × X 3 2
X1: solid–liquid ratio; X2: ethanol concentration; X3: extraction cycle.
The coefficients of the factors in Equation (1) reveal the importance of each parameter. That the sign is positive means that the factor directly affects the TPC, such as the effect of X1, X2, the interaction of X1 and X2 (X1:X2), the interaction of X1 and X3 (X1:X3), and the quadratic relationship of X3.
The analysis of variance shows (ANOVA), in Table 3, the coefficient of determination (R2 = 0.9381), the adjusted coefficient of determination (adjusted R2 = 0.8266), and the lack of fit test value (0.12). This table also shows factors with significant effects and factors with non-significant effects.
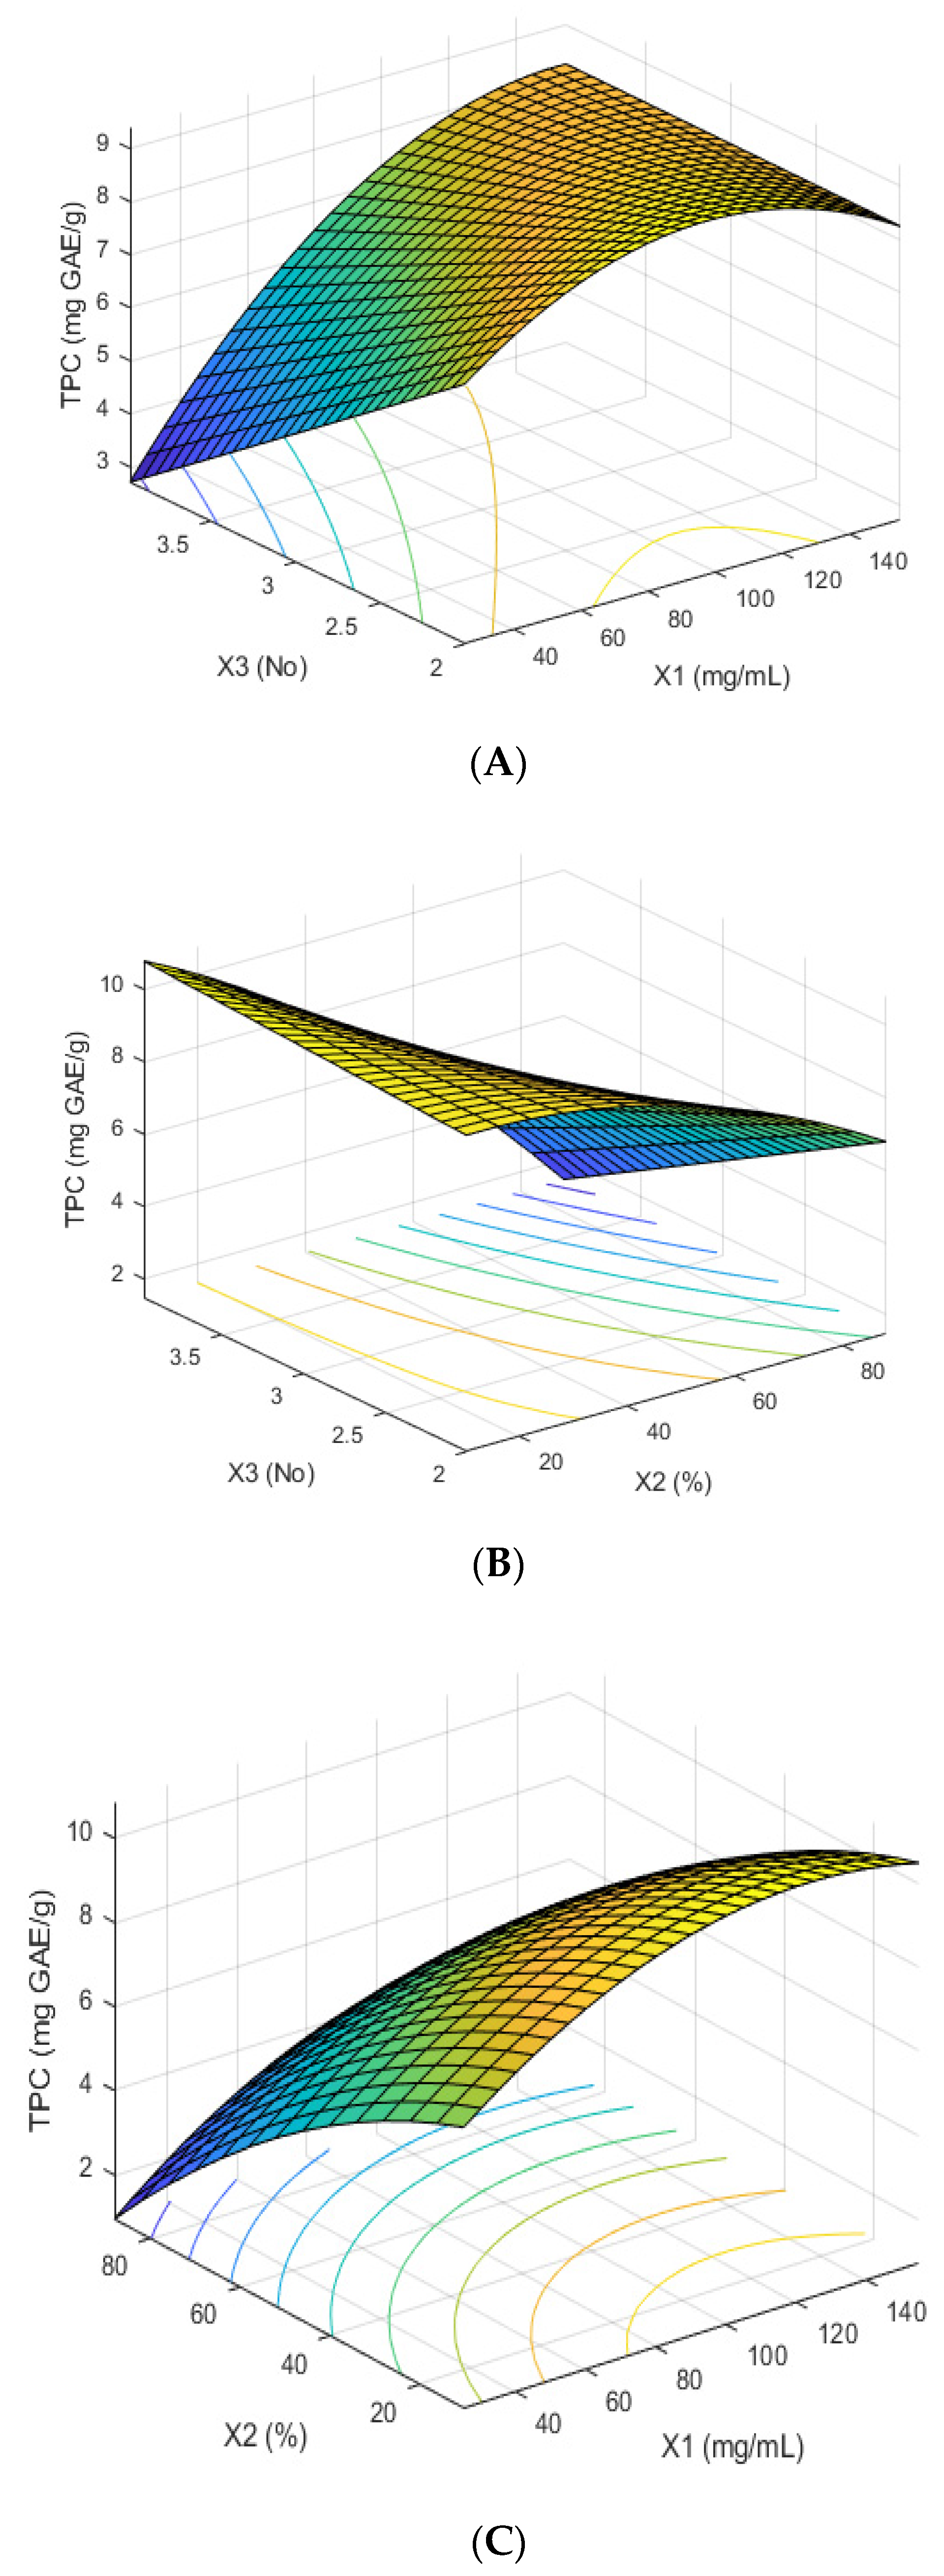
Figure 3 shows the response surfaces of the relationship between the three factors evaluated and the response variable (TPC). Figure 3A shows that as X3 increases and X1 increases, the amount of TPC increases, because more free phenols are present and most of these are being extracted. Figure 3B shows that as X2 decreases and X3 increases, the amount of TPC increases; this may be due to the chemical nature of the compounds present in the fermented material, which are more compatible with low ethanol concentrations. Figure 3C shows that as X2 and X1 decrease, the amount of TPC increases, because the greater the amount of fermented material, the greater the amount of free TPC.

3.4. Model Verification

The optimized results were an X1 of 82 mg/mL, X2 of 10% of ethanol, and X3 of two cycles, and with these results, a TPC amount of 12 mg GAE/g dry material was obtained, which is close to the amount predicted by the model (12.33 mg GAE/g dry material). The optimized extract contained 350% more phenolic compounds than the untreated fermented extract. These results are related to those analyzed in Section 3.2, where the highest amount of TPC was obtained with an X1 between 60 and 90 mg/mL, X2 of 30%, and X3 of three.

3.5. Compounds Present in the Optimized Extract

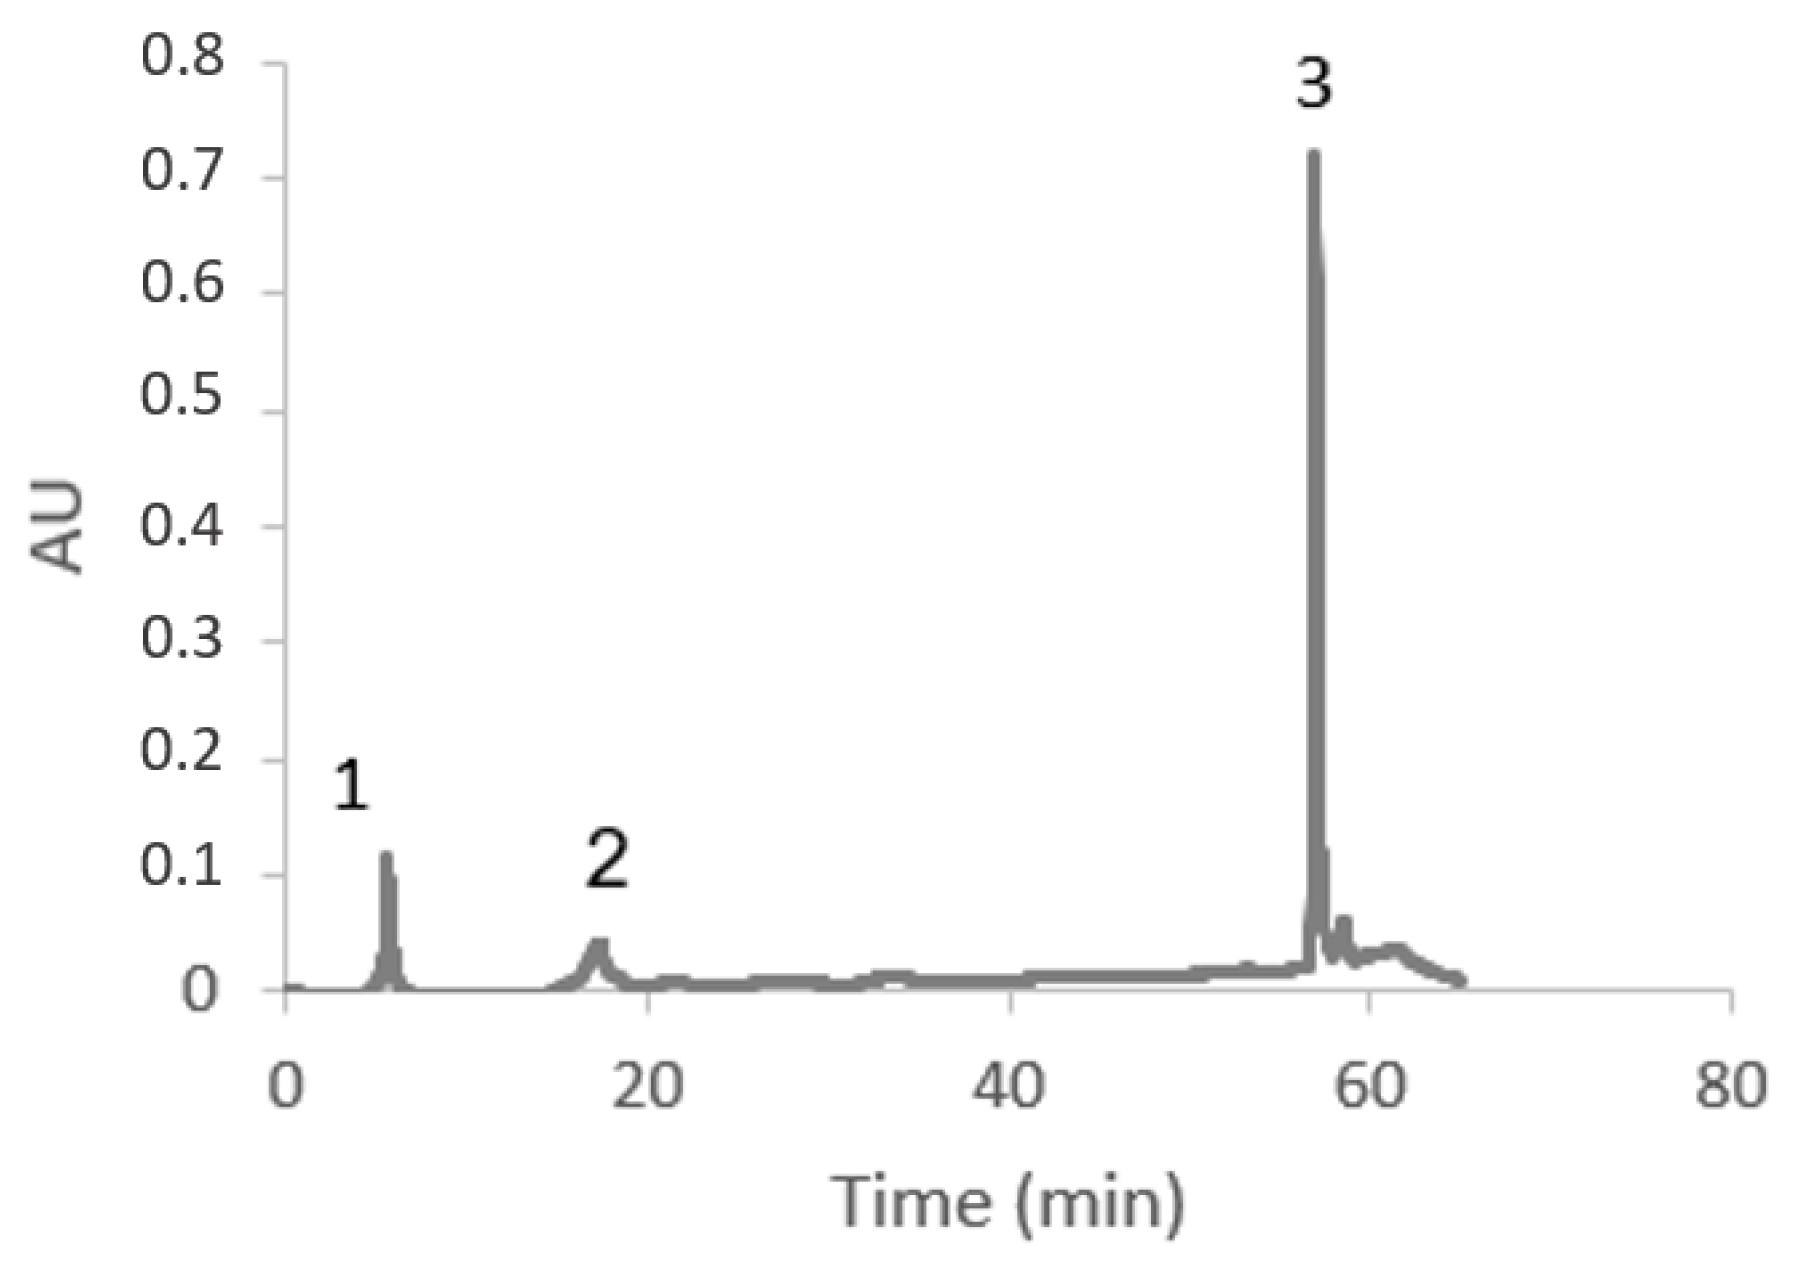
Figure 4 shows the compounds present in the optimized extract obtained from the fermented MD2 pineapple residue material (EFP), 3.4-DHPEA-EA of the tyrosol family, floretin 2′-O-xylosyl-glucoside of the dihydrochalcone family, and feruloyl tartaric acid of the methoxycinnamic acid family. Feruloylartaric acid showed the highest absorbance and the longest retention time among the three compounds identified in the EFP.

3.6. Antimicrobial Activity

3.6.1. Determination of Minimum Inhibitory Concentration (MIC)

The MIC of EFP against the three pathogenic microorganisms evaluated in the microplate showed inhibition against S. aureus and L. monocytogenes, but not against E. coli. The MIC for S. aureus was 50 mg/mL and that of L. monocytogenes was 12.5 mg/mL.

3.6.2. Bacterial Growth Curve

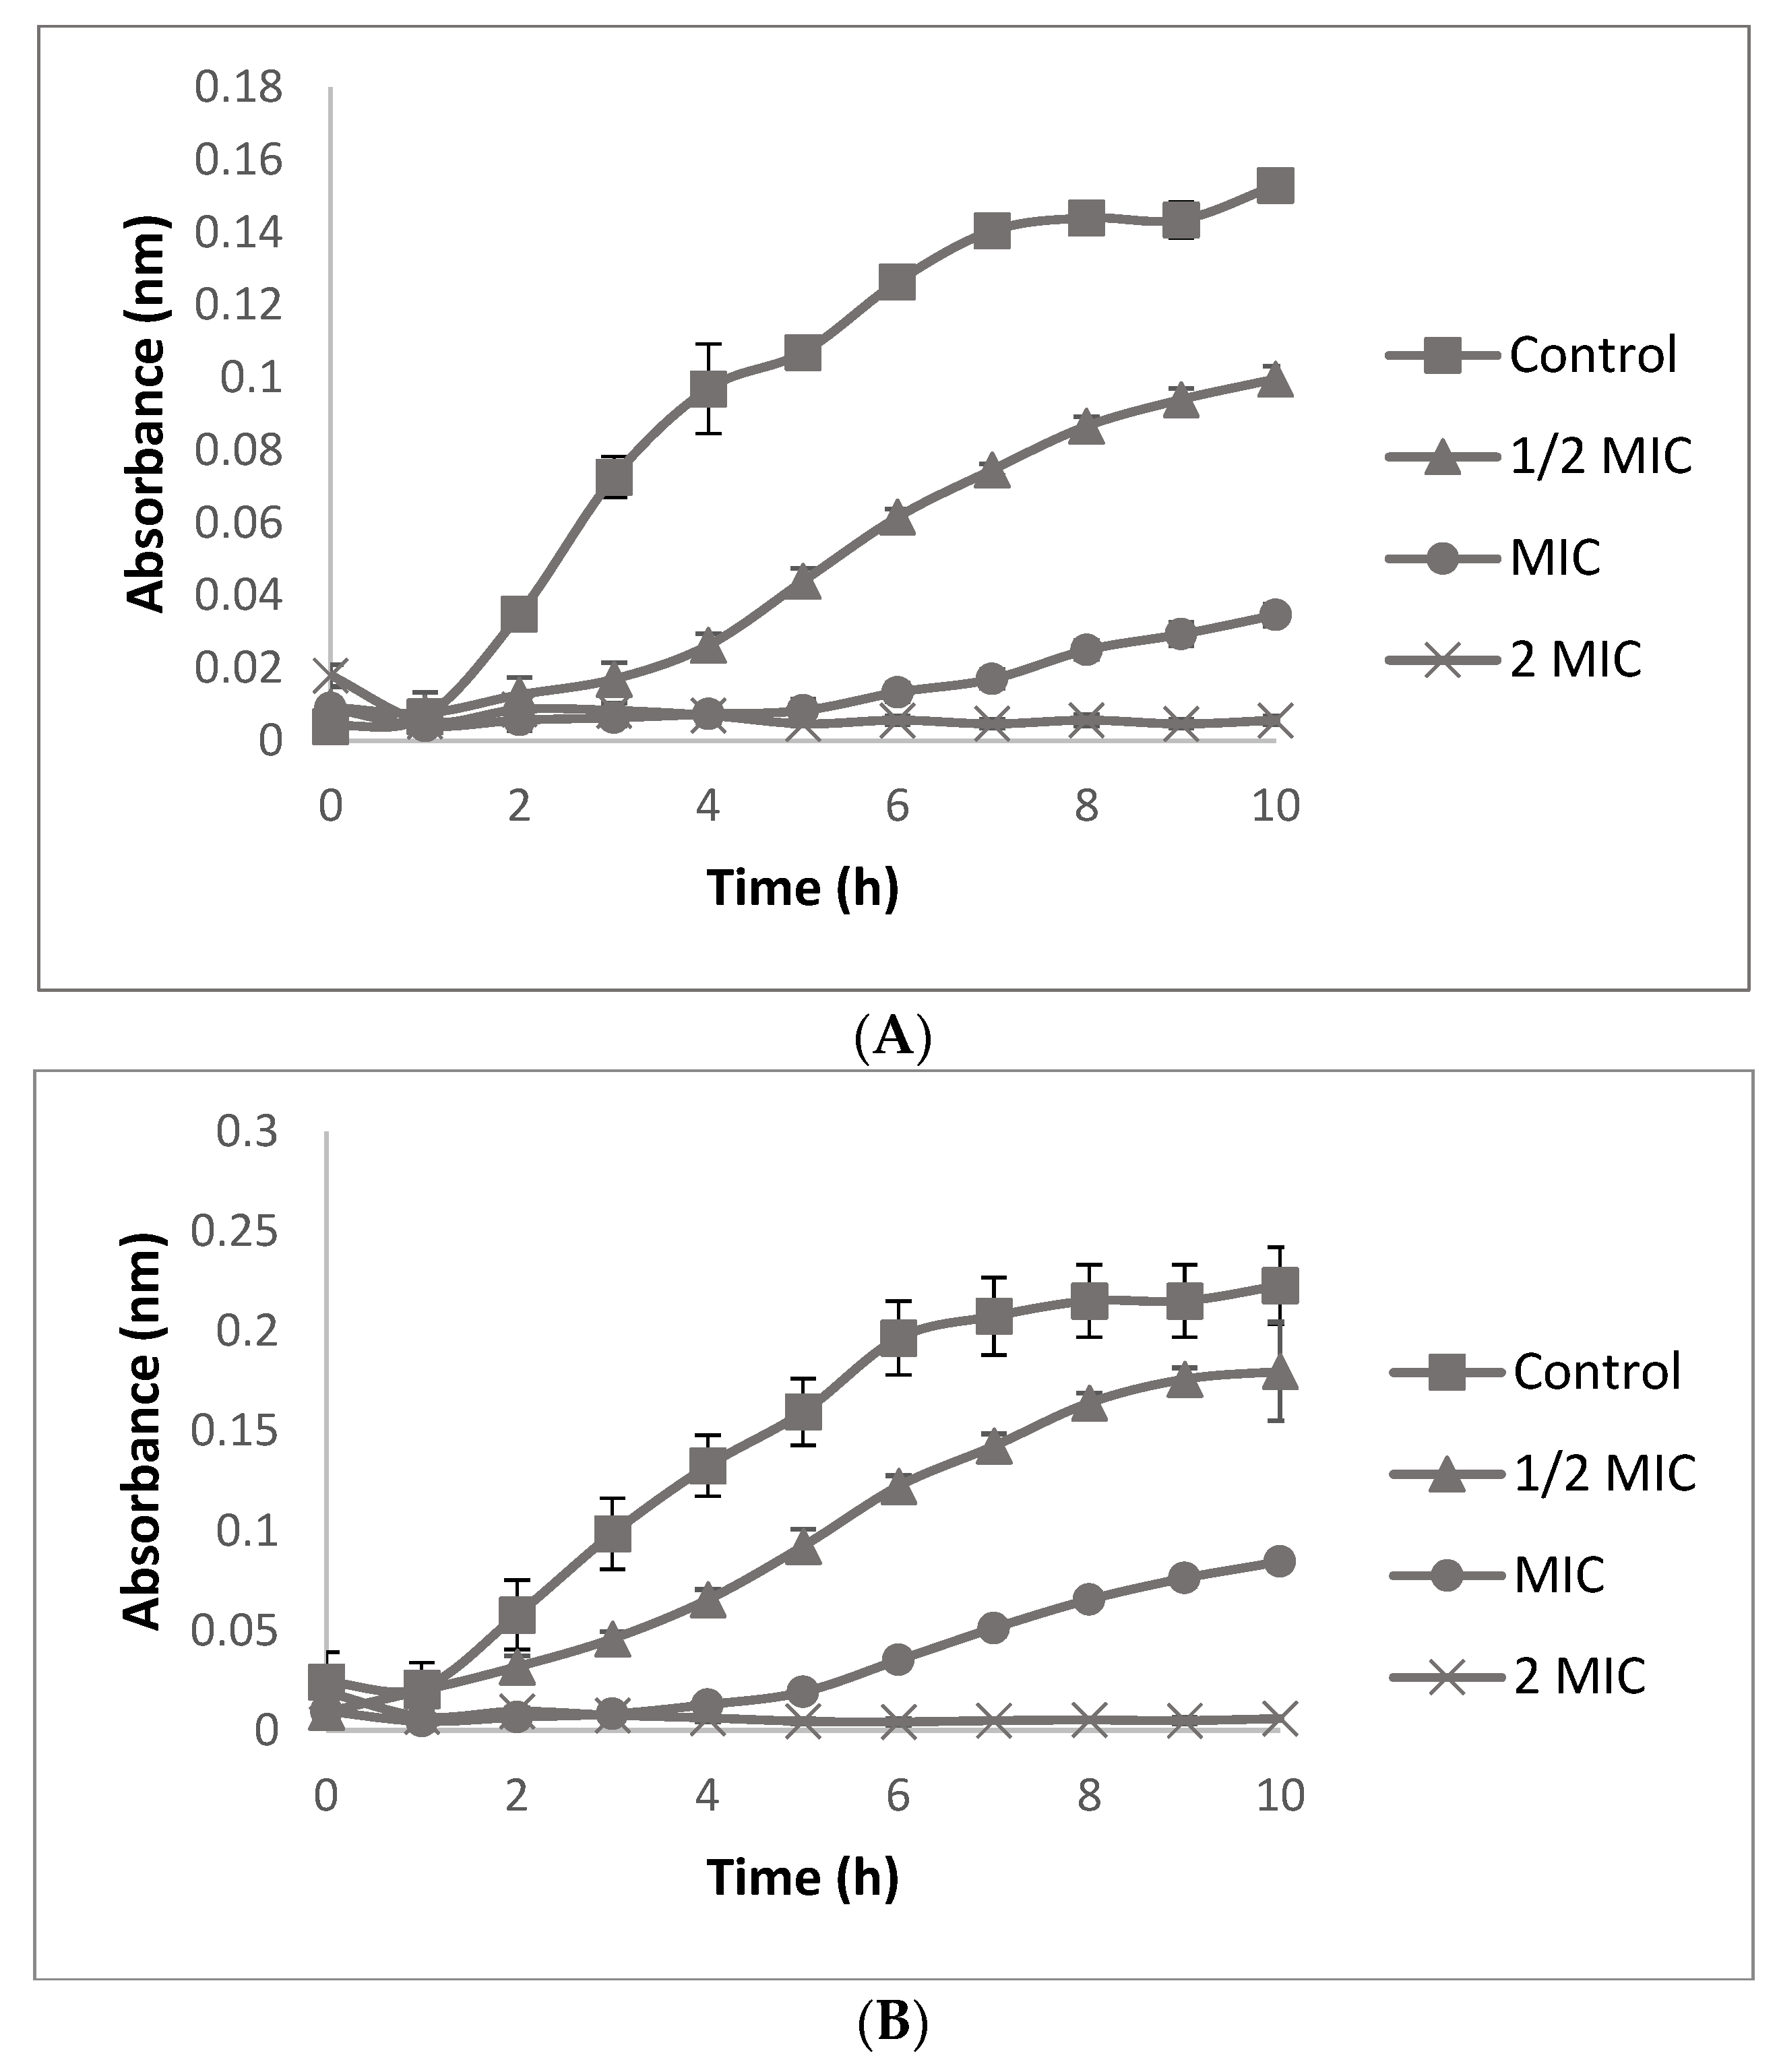
To evaluate the efficacy of EFP as an antimicrobial agent, additional experiments were carried out using nutrient broth supplemented with different concentrations of the optimized extract, ½ MIC, MIC, and 2 × MIC. As shown in Figure 5, the EFP significantly inhibited the growth of both bacteria for all concentrations used; the inhibitory effect was lower in the case of S. aureus compared with L. monocytogenes.
The EFP used in this experiment caused a significant delay in the growth of both bacteria, with the latency phase being longer in the bacteria with the optimized extract compared with the control. Different responses were recorded between these two microorganisms. In S. aureus and L. monocytogenes with ½ MIC, no latency state was presented, while MIC growth was evidenced after a prolonged delay period of 4 and 6 h, respectively. Furthermore, it is necessary to emphasize that the antimicrobial properties of the optimized extract led not only to the inhibition of bacterial growth but also to bacterial cell death at concentrations equivalent to 2x MIC for the two bacteria studied. The dynamics of bacterial growth also revealed that increasing concentrations of the EFP progressively inhibited the growth of S. aureus and L. monocytogenes.

3.6.3. Observation with a Transmission Electron Microscope (TEM)

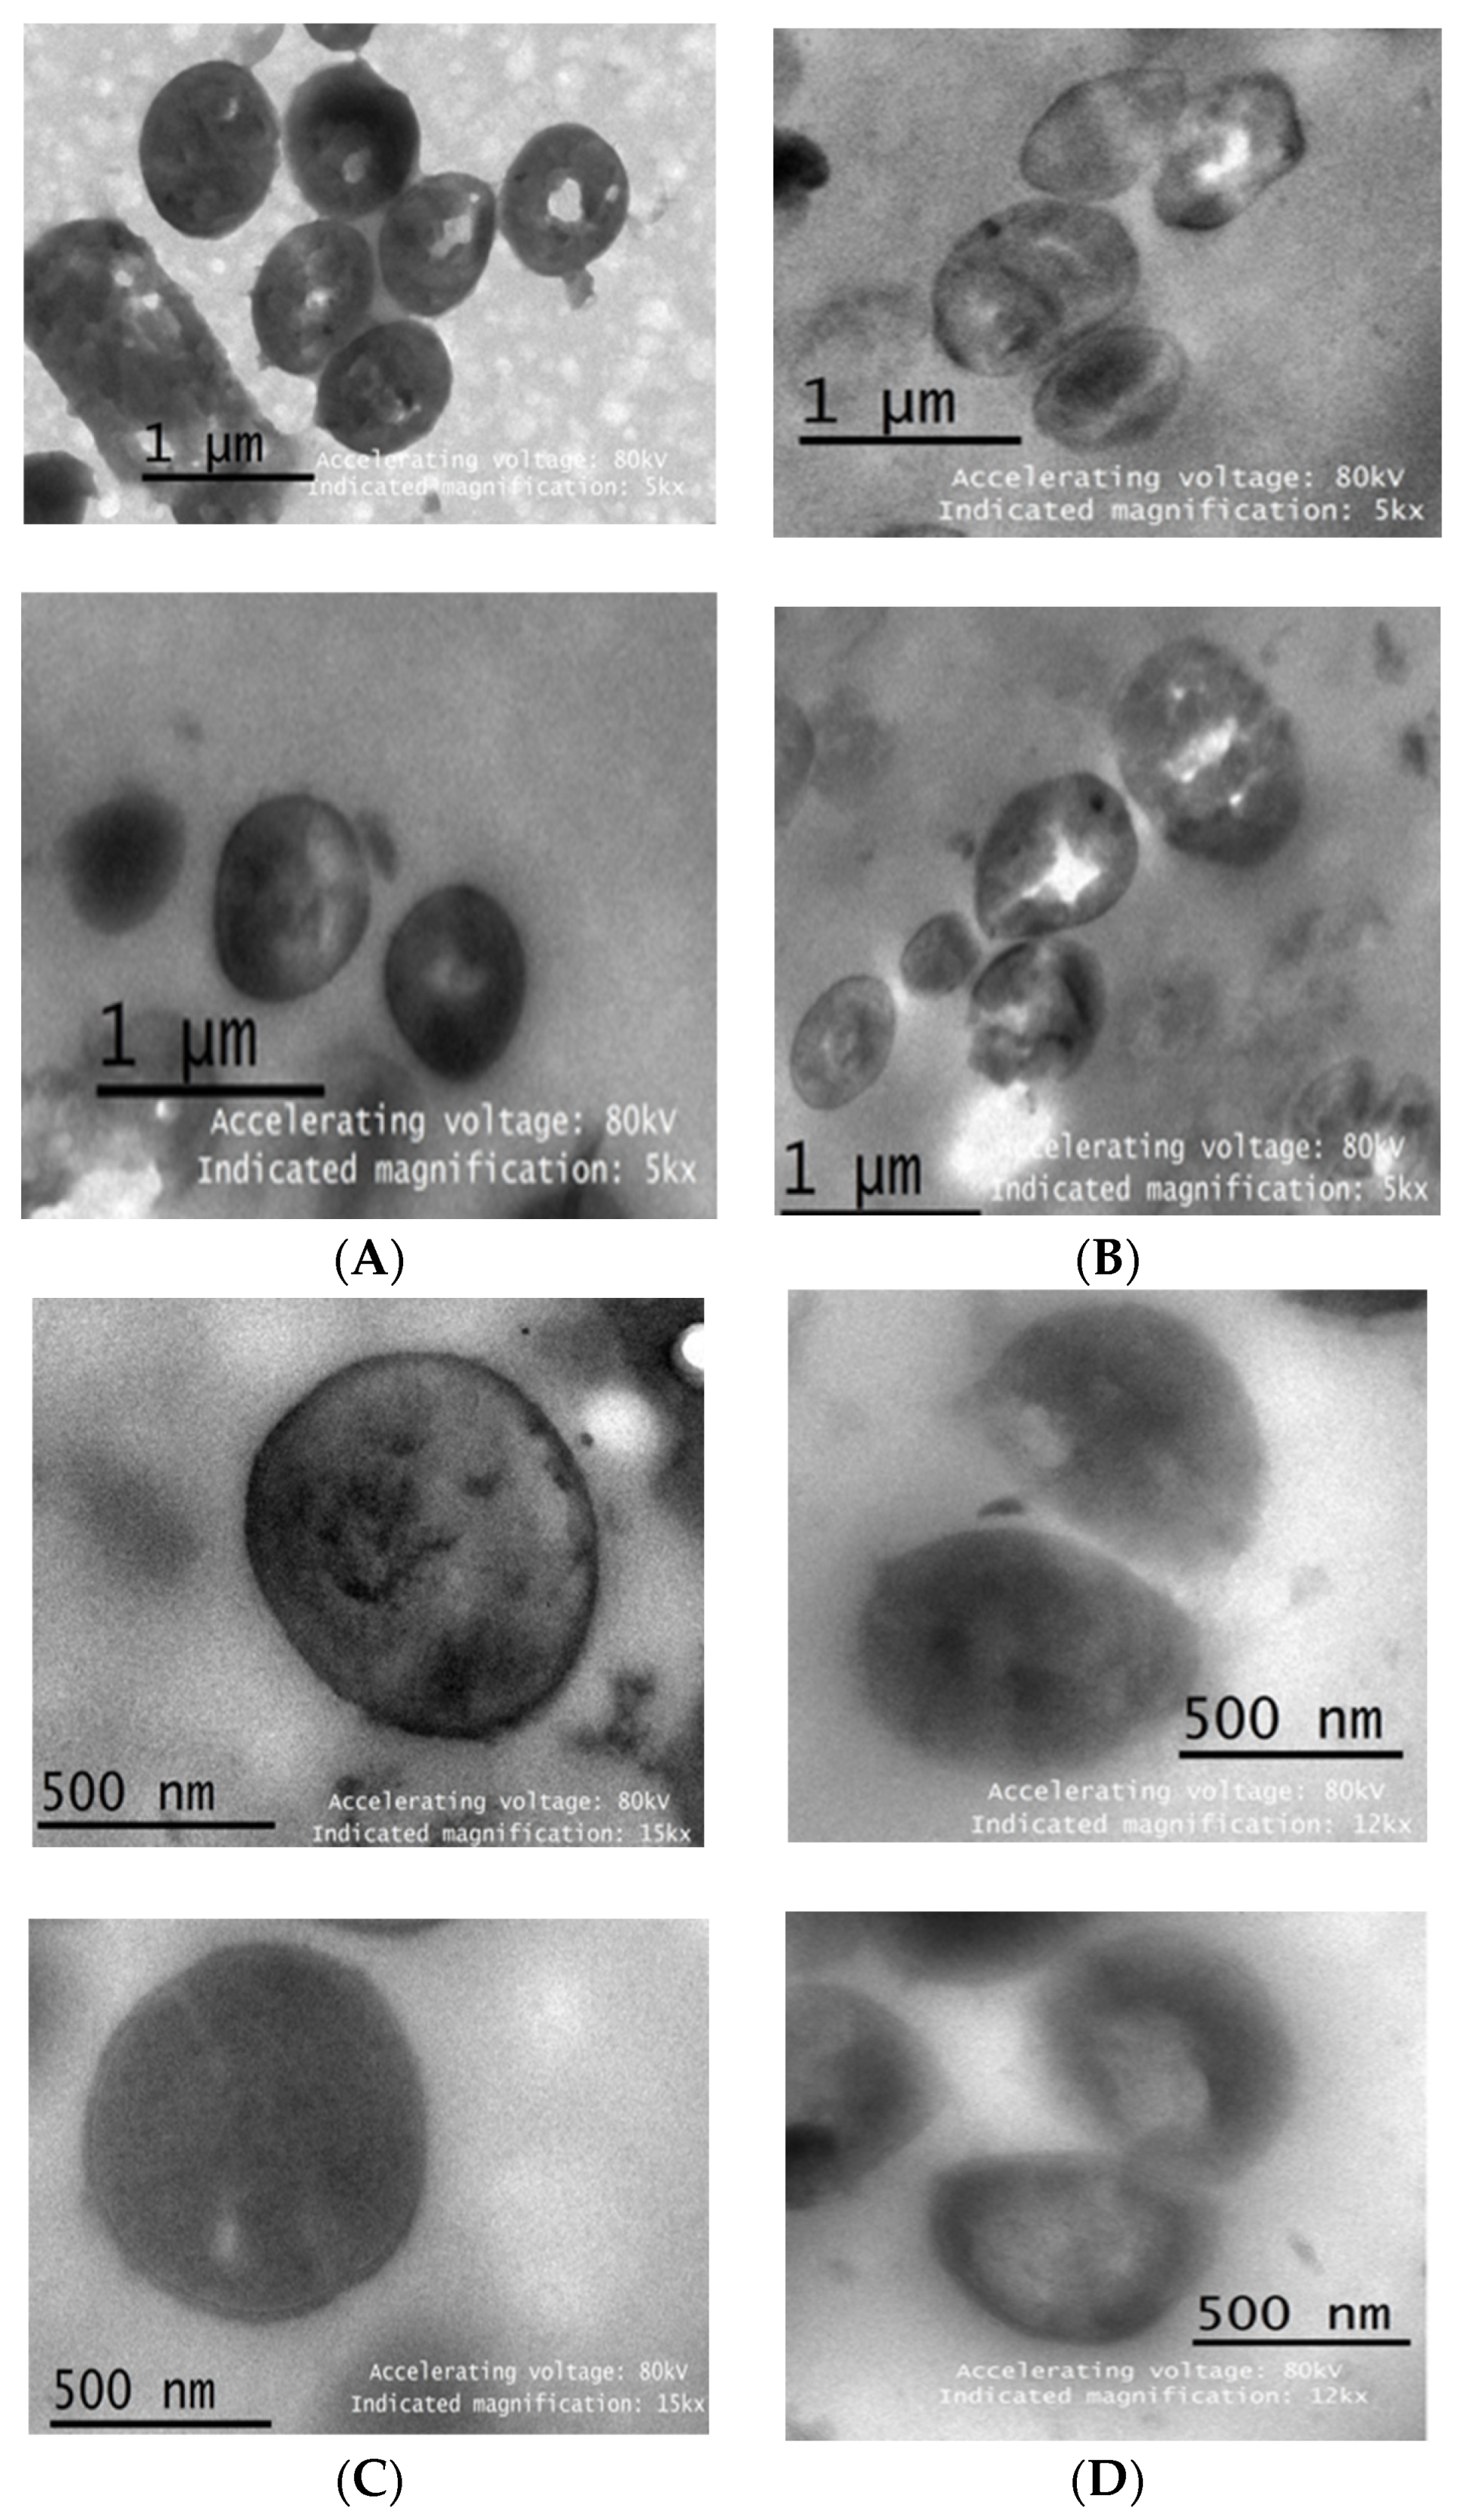
To determine whether EFP treatments exert their antibacterial action by de-stabilizing the membrane, TEM observations were performed. In this study, it was observed that disruption of bacterial cell-membrane integrity leads to the release of cell contents and cell death.
TEM photographs of EFP-treated L. monocytogenes and S. aureus revealed that the cell walls of the Gram-positive bacteria were ruptured. Swelling, cell lysis, and leakage of intracellular substances are observed in Figure 6B,D, whereas L. monocytogenes and S. aureus remained intact in the control groups (Figure 6A,C), indicating that EFP generates severe structural problems on cell walls.

4. Discussion

4.1. Solid-State Fermentation

The evaluation of the particle size of the substrate is important for the development of the fungus. A very small particle size impedes the passage of gases and a very large particle size hinders the metabolism of the microorganism. The particle size chosen for this study had large and small particles and represented the total material obtained in the milling [19].
The CHP represents the water bound to the plant matrix as the water that the microorganisms cannot use for their metabolism. The WAI is the amount of water that can be absorbed by the support. Low values of CHP benefit microbial growth. High WAI values benefit the fermentation process because moisture can be modified to benefit fungal growth. Research using residues for SST reports values like those of this study for the WAI and CHP. Buenrostro-Figueroa et al. [20] reported WAI amounts of 3.74 ± 0.10 g/g dry matter for agro-industrial fig residues and CHP values of 58% for cork oak bark, and Torres-León et al. [21] report CHP values of 56.5% for mango seed.
Different kinds of enzymes are produced in the TSS that catalyze the breaking of the covalent bonds that hold together phenolic compounds from other compounds in the biological matrix. Other authors have shown that A. niger is a good producer of lignocellulosic enzymes [12]. The results of this study are superior to those obtained by Rashad et al. [3] with Kluyveromyces marxianus NRRL Y-8281 (7.14%) and those obtained with conventional techniques (30.2%) by de Oliveira et al. [22]. The difference between SSF concerning conventional methods is the impossibility of breaking bonds for the release of compounds. The increase in polyphenols may be due to the enzymatic activity that, during SSF, breaks the ester bonds that bind the polyphenols to the biological matrix [3].

4.2. Preliminary Analysis for Optimization

Previous research has shown the relevance of X1, X2, and X3 in TPC extraction processes [23]. As for variable X1, high amounts of fermenting material per mL of solvent can hinder the acoustic cavitation effect because the negative pressure in the region of rarefaction (bubble expansion) has to overcome the strong cohesion between particles [24]. Contrary to this, with an X1 less than 30 mg/mL, the phenol content is low because the TPC available at this point is very low. It is convenient that, until the extraction is finished, the solvent overcomes the solid phase [25]. The study by Rasheed et al. [26] evidenced that a similar X1 was effective in obtaining TPC from fruit residues. Rasheed et al. [26] optimized the extraction process of TPC from pineapple residues and showed that the best ratio is 50 mg/mL of solvent.
The behavior of X2 in Figure 2 can be explained by the combination of ethanol and water, which allows for the extraction of a large amount of TPC. This extraction is due to the affinity of the solvents with the TPC. Ethanol, besides being a GRAS (Generally Recognized As Safe) solvent, has a lower polarity than water, which ensures a good range of extracted TPC. In addition, the high pH phenolic acids present in pineapple residues, such as benzoic acid and cinnamic acids, cannot be completely extracted with pure organic solvents, so a mixture of alcohol and water or acetone and water is recommended [26]. A higher affinity of the phenols present in the extract evaluated in a solution containing 10–30% ethanol suggests that most of the extracted phenols are polar. Studies with unfermented organic residues show that other ethanol/water combinations are effective for TPC extraction. Lourenço et al. [8] and M’hiri et al. [27] demonstrated that 80% ethanol is the best concentration for the extraction of TPC from pineapple peel and citrus peel, respectively. Meanwhile, Brahmi et al. [28] demonstrated that 40% ethanol is the best concentration for the extraction of TPC from Opuntia ficus-indica [L.] Mill. This difference may be because the TPC profile changes due to the effect of SSF, as evidenced by Paz-Arteaga et al. [12].
Finally, regarding the cycles, more than three cycles generate unnecessary energy expenditure and damage to the TPC due to pyrolysis and oxidation due to the release of hydroxyls triggered by exposing the plant material to long UAE times [24]. Several authors recommend consecutive cycles to increase the number of bioactive compounds obtained in the extraction process. Authors such as Garmus et al. [29], Pérez-Jiménez et al. [30] and Ozsefil & Ziylan-yavas [31] recommend the use of between three and two cycles as a minimum to obtain TPC, respectively.

4.3. Optimization: Box–Behnken Design

In the analysis of variance (ANOVA) in Table 3, the coefficient of determination (R2 = 0.9381) and the adjusted coefficient of determination (adjusted R2 = 0.8266) indicate that the model fits the laboratory data well. The value of the coefficient of determination reflects the percentage of the experimental results that the model can explain. In addition, the lack of fit test value (0.12) is not significant (p > 0.05), which corroborates that the fit model is adequate to describe the experimental data. This table also shows that only the linear effects, X1 and X2, were significant (p < 0.05). None of the quadratic effects or interactions were significant (p > 0.05).
In this study, 12 mg GAE/g dry, higher than the fermented material, was obtained. Other optimization studies with pineapple residues obtained lower TPC than those reported in this study. Lourenço et al. [8] obtained 11.10 ± 0.01 mg GAE/g dry material with simple solid–liquid extraction, with 80% ethanol, a solid–liquid ratio of 1 mg/mL, one extraction cycle, and 25 min extraction at room temperature, and Rasheed et al. [26] obtained 1.17 mg GAE/g dry material with simple solid–liquid extraction, with 80% methanol, a solid–liquid ratio of 1 mg/20 mL, one extraction cycle, and 90 min extraction at room temperature. Similarly, an investigation using UAE with other agro-industrial wastes obtained lower amounts of TPC. Selahvarzi et al. [25] obtained the highest amount of TPC from pomegranate peel (2.70 mg GAE/g) and citrus (1.86 mg GAE/g) in a UAE with a solid/liquid ratio of 1000 mg/40 mL, 40 min extraction, and 70 °C. Sepúlveda et al. [32] used autohydrolysis at 200 °C, 30 min, and a solid–liquid ratio of 1:10 w/v for the extraction of polyphenols (1.75 g/L) and Harith et al. [33] used microwaves with ethanol for the extraction of polyphenols (197.776 mg GAE/g) from pineapple residues. In the first instance, the difference between the results of this study and those obtained in other pineapple studies may be due to the use of ultrasound, which makes the extraction more efficient, and concerning other studies with other agro-industrial wastes, it may be due to the difference in the phenolic profiles of each organic material. Other emerging technologies have been used for the extraction of phenols with other agro-industrial wastes, such as supercritical fluids [34].

4.4. Antimicrobial Activity

The EFP was evaluated as an antimicrobial agent against three pathogenic microorganisms that can be found in foods (meats, vegetables, milk, and ready-to-eat foods): E. coli, S. aureus, and L. monocytogenes.
The use of XAD16 amberlite allowed for the separation of phenolic groups from other compounds that were not of interest to this study, such as carbohydrates. XAD16 amberlite is a polymeric adsorbent used in the adsorption and pre-purification of organic compounds from aqueous solutions. Although pre-purification of the EFP using XAD amberlite leaves fewer bioavailable molecules than in the original extract, it makes it possible to recognize which compounds are acting on the biological activity analyzed and allows the extract’s shelf-life to be extended [35].
Among the compounds identified in the EFP was Tyrosol. This compound is a phenethyl alcohol present in different natural sources as a natural phenolic antioxidant. This compound has been shown to produce elongation of the latency phase and slowing of microbial growth of S. aureus [36]. Floretin 2′-O-xylosyl-glucoside is a hydroxybenzoic acid that belongs to the group of flavonoids, has antioxidant and anti-inflammatory effects, and is used for the prevention of cardiovascular diseases [37]. Feruloyl tartaric acid is a phenol derived from tetraric acid; this compound has been directly related to the treatment of diabetes. The functionality of this compound has been related to cinnamic acid. These acids have been shown to effectively inhibit the growth of Gram-positive and Gram-negative bacterial strains at concentrations below 1 mg/g [38].
Studies with other agro-industrial wastes such as avocado seed and peel [39] and coffee residues [40] with similar phenolic compounds identified in this study (Figure 4) obtained via solid–liquid extraction have also been shown to be antimicrobial against L. monocytogenes and S. aureus. In general, phenols accumulate on the surface of bacteria through the interaction of hydroxyl radicals with the cell membrane, which induces the depolarization of bacteria, loss of cell content, and, thus, pH gradient across the membrane, leading to the ATP level also decreasing and causing cell death. There are two reported cellular mechanisms used by phenols on bacteria; the first involves changing cell membrane permeability, and the second involves interfering with basic cell functions [41].
Gomes et al. [42] evidenced that extracts rich in flavonoid derivatives inhibit the growth of S. aureus ATCC 25923, such as Juglans regia L. extract with an MIC of 0.78 mg/mL and Eucalyptus globulus Labill with an MIC of 0.19 mg/mL. Monente et al. [43] evidenced that coffee ground extracts contain hydroxycinnamic acid compounds similar in structure to methoxycinnamic acids present in fermented pineapple extract, anthocyanidins, flavan-3-ols, and flavonols, and had antimicrobial activity against L. monocytogenes (MIC = 20 mg/mL) due to the negative effect on bacterial membrane permeability that hydroxyl groups of phenolic compounds have. Diarra et al. [44] studied the effect of blueberry pomace extract as an important source of anthocyanins, flavonols, and phenolic acids, as reported in Figure 3 against L. monocytogenes showing an MIC of 2 mg/mL.
The difference in the amount of extract needed to inhibit the growth of each of the Gram-(+) bacteria may be due to the resistance mechanism of these bacteria through the production of enzymes. Similarly, other research shows that the discrepancy in the binding sites of phenols to the cell wall of each microorganism may explain why S. aureus needs more extract than L. monocytogenes to be inhibited [40].
According to Salman et al. [9], the negative effect of EFP on E. coli may be because Gram-negative bacteria are more resistant to phenolic compounds due to their cell wall structure. The less complex cell wall structure of Gram-positive bacteria makes them more permeable to antimicrobial compounds. The authors of [9] and Zaidan et al. [45] showed that the phenols present in the tea plant are not useful as antimicrobial agents against E. coli.
Babii et al. [17] obtained similar results with the use of tricyclic flavonoid obtained through chemical synthesis as an antimicrobial agent, with a latency phase of 9 h and with an MIC of 0.24 µg/mL. Azi et al. [46], as in the present investigation, in the time-to-death curves, showed that the antibacterial activity of polyphenols from fermented kefir whey extracted with the use of ultrasound depends on their exposure time and concentration.
As for the results obtained with a TEM, Ren et al. [47] report similar results using pterostilbene as an antimicrobial agent against E. coli and S. aureus. The results suggest that EFP is capable of destroying and altering the internal structure of the tested bacterial cells.

5. Conclusions

It can be concluded that ultrasound-assisted solid–liquid extraction is an effective technique to increase the release of TPC in fermented pineapple residues. In this work, a response surface design was successfully employed to optimize TPC extraction conditions. Extraction was significantly affected by the linear effects of the solid–liquid ratio and ethanol concentration. The optimum TPC extraction factors were: 86 mg of fermented material per mL of solvent, 26% ethanol, and two cycles. The extracts of fermented material obtained from optimized ultrasound-assisted extraction were effective as an antimicrobial agent against S. aureus and L. monocytogenes, pathogenic bacteria present in food. This work provides evidence that fermented pineapple residues are an important organic source of biologically active phenolic compounds. This research opens the door to the evaluation in future research of other biological properties of phenolic compounds, such as antioxidant, antiproliferative, and immunomodulatory capacity.

Author Contributions

Conceptualization, S.L.P.-A. and C.T.-L.; methodology, S.L.P.-A., J.A.A.-V., N.R.-G. and C.T.-L.; validation, C.E.A.-M., S.L.P.-A. and C.T.-L.; investigation, S.L.P.-A., H.T.-C., E.C.-C. and C.T.-L.; visualization, C.N.A.; writing—original draft preparation, S.L.P.-A.; writing—review and editing, L.S.-C. and C.E.A.-M.; visualization, S.L.P.-A.; software, J.A.A.-V.; supervision, O.V.P.-R. and N.R.-G.; project administration, O.V.P.-R., E.C.-C., H.T.-C. and L.S.-C. All authors have read and agreed to the published version of the manuscript.

Funding

This research received no external funding.

Institutional Review Board Statement

Not applicable.

Informed Consent Statement

Not applicable.

Data Availability Statement

This research has no research data to share.

Acknowledgments

Sarah L. Paz-Arteaga thanks the Universidad Nacional de Colombia for the scholarship granted to develop her master’s studies in biotechnological sciences (Resolution 012 of 2020) and the financial support to carry out her stay at the Universidad Autónoma de Coahuila (Resolution F.C 0349 of 2022).

Conflicts of Interest

The authors declare no conflict of interest.

References

  1. Rico, X.; Gullón, B.; Alonso, J.L.; Yáñez, R. Recovery of high value-added compounds from pineapple, melon, watermelon and pumpkin processing by-products: An overview. Food Res. Int. 2020, 132, 109086. [Google Scholar] [CrossRef] [PubMed]
  2. Qdais, A.H.; Abdulla, F.; Qrenawi, L. Solid Waste Landfills as a Source of Green Energy: Case Study of Al Akeeder Landfill. Jordan J. Mech. Ind. Eng. 2010, 4, 69–74. [Google Scholar]
  3. Rashad, M.M.; Mahmoud, A.E.; Ali, M.M.; Nooman, M.U.; Al-Kashef, A.S. Antioxidant and anticancer agents produced from pineapple waste by solid state fermentation. Int. J. Toxicol. Pharmacol. 2015, 7, 287–296. [Google Scholar]
  4. Aruna, T.E. Production of value-added product from pineapple peels using solid state fermentation. Innov. Food Sci. Emerg. Technol. 2019, 57, 102193. [Google Scholar] [CrossRef]
  5. Vega-Castro, O.; Contreras-Calderon, J.; León, E.; Segura, A.; Arias, M.; Pérez, L.; Sobral, P.J. Characterization of a polyhydroxyalkanoate obtained from pineapple peel waste using Ralsthonia eutropha. J. Biotechnol. 2016, 231, 232–238. [Google Scholar] [CrossRef]
  6. Brito, T.B.N.; Lima, L.R.; Santos, M.B.; Moreira, R.A.; Cameron, L.; Fai, A.C.; Ferreira, M.S. Antimicrobial, antioxidant, volatile and phenolic profiles of cabbage-stalk and pineapple-crown flour revealed by GC-MS and UPLC-MSE. Food Chem. 2021, 339, 127882. [Google Scholar] [CrossRef] [PubMed]
  7. Acosta-Estrada, B.A.; Gutiérrez-Uribe, J.A.; Serna-Saldívar, S.O. Bound phenolics in foods, a review. Food Chem. 2014, 152, 46–55. [Google Scholar] [CrossRef]
  8. Lourenço, S.C.; Campos, D.A.; Gómez-García, R.; Pintado, M.; Oliveira, M.C.; Santos, D.I.; Corrêa-Filho, L.C.; Moldão-Martins, M.; Alves, V.D. Optimization of natural antioxidants extraction from pineapple peel and their stabilization by spray drying. Foods 2021, 10, 1255. [Google Scholar] [CrossRef]
  9. Safdar, M.N.; Kausar, T.; Jabbar, S.; Mumtaz, A.; Ahad, K.; Saddozai, A.A. Extraction and quantification of polyphenols from kinnow (Citrus reticulate L.) peel using ultrasound and maceration techniques. J. Food Drug Anal. 2017, 25, 488–500. [Google Scholar] [CrossRef]
  10. Luque-Garcia, J.; de Castro, M.L. Ultrasound: A powerful tool for leaching. TrAC Trends Anal. Chem. 2003, 22, 41–47. [Google Scholar] [CrossRef]
  11. Wang, Z.; Ahmad, W.; Zhu, A.; Geng, W.; Kang, W.; Ouyang, Q.; Chen, Q. Ultrasonics Sonochemistry Identification of volatile compounds and metabolic pathway during ultrasound-assisted kombucha fermentation by HS-SPME-GC/MS combined with metabolomic analysis. Ultrason. Sonochem. 2023, 94, 106339. [Google Scholar] [CrossRef] [PubMed]
  12. Paz-Arteaga, S.L.; Ascacio-Valdés, J.A.; Aguilar, C.N.; Cadena-Chamorro, E.; Serna-Cock, L.; Aguilar-González, M.A.; Ramírez-Guzmán, N.; Torres-León, C. Bioprocessing of pineapple waste for sustainable production of bioactive compounds using solid-state fermentation. Innov. Food Sci. Emerg. Technol. 2023, 85, 103313. [Google Scholar] [CrossRef]
  13. Salman, S.; Öz, G.; Felek, R.; Haznedar, A.; Turna, T.; Özdemir, F. Effects of fermentation time on phenolic composition, antioxidant and antimicrobial activities of green, oolong, and black teas. Food Biosci. 2022, 49, 101884. [Google Scholar] [CrossRef]
  14. Molyneux, P. The Use of The Stable Free Radical Diphenylpicryl-Hydrazyl (DPPH) for Estimating Anti-Oxidant Activity. Songklanakarin J. Sci. Technol. 2004, 26, 211–219. [Google Scholar]
  15. Ascacio-Valdés, J.A.; Aguilera-Carbó, A.F.; Buenrostro, J.J.; Prado-Barragán, A.; Rodríguez-Herrera, R.; Aguilar, C.N. The complete biodegradation pathway of ellagitannins by Aspergillus niger in solid-state fermentation. J. Basic Microbiol. 2016, 56, 329–336. [Google Scholar] [CrossRef]
  16. Torres-León, C.; de Azevedo Ramos, B.; dos Santos Correia, M.T.; Carneiro-da-Cunha, M.G.; Ramirez-Guzman, N.; Alves, L.C.; Brayner, F.A.; Ascacio-Valdes, J.; Álvarez-Pérez, O.B.; Aguilar, C.N. Antioxidant and anti-staphylococcal activity of polyphenolic-rich extracts from Ataulfo mango seed. LWT 2021, 148, 111653. [Google Scholar] [CrossRef]
  17. Babii, C.; Bahrin, L.G.; Neagu, A.; Gostin, I.; Mihasan, M.; Birsa, L.M.; Stefan, M. Antibacterial activity and proposed action mechanism of a new class of synthetic tricyclic flavonoids. J. Appl. Microbiol. 2016, 120, 630–637. [Google Scholar] [CrossRef] [Green Version]
  18. Zeng, W.; He, Q.; Sun, Q.; Zhong, K.; Gao, H. International Journal of Food Microbiology Antibacterial activity of water-soluble extract from pine needles of Cedrus deodara. Int. J. Food Microbiol. 2012, 153, 78–84. [Google Scholar] [CrossRef]
  19. Pandey, A.; Soccol, C.R.; Mitchell, D. Pre-treatment of agro-industrial residues. In Biotechnology for Agro-Industrial Residues Utilisation: Utilisation of Agro-Residues; Springer: Cham, Switzerland, 2009; pp. 13–33. [Google Scholar]
  20. Buenrostro-Figueroa, J.J.; Velázquez, M.; Flores-Ortega, O.; Ascacio-Valdes, J.A.; Huerta-Ochoa, S.; Aguilar, C.N.; Prado-Barragán, L. Solid state fermentation of fig (Ficus carica L.) by-products using fungi to obtain phenolic compounds with antioxidant activity and qualitative evaluation of phenolics obtained. Process. Biochem. 2017, 62, 16–23. [Google Scholar] [CrossRef]
  21. Torres-León, C.; Ramírez-Guzman, N.; Ascacio-Valdes, J.; Serna-Cock, L.; dos Santos Correia, M.T.; Contre-ras-Esquivel, J.C.; Aguilar, C.N. Solid-state fermentation with Aspergillus niger to enhance the phenolic contents and antioxidative activity of Mexican mango seed: A promising source of natural antioxidants. LWT 2019, 112, 108236. [Google Scholar] [CrossRef]
  22. De Oliveira, A.C.; Valentim, I.B.; Silva, C.A.; Bechara, E.J.H.; de Barros, M.P.; Mano, C.M.; Goulart, M.O.F. Total phenolic content and free radical scavenging activities of methanolic extract powders of tropical fruit residues. Food Chem. 2009, 115, 469–475. [Google Scholar] [CrossRef]
  23. Torres-León, C.; Rojas, R.; Serna-Cock, L.; Belmares-Cerda, R.; Aguilar, C.N. Extraction of antioxidants from mango seed kernel: Optimization assisted by microwave. Food Bioprod. Process. 2017, 105, 188–196. [Google Scholar] [CrossRef]
  24. Venkateswara, M.; Singh, A.; Sunil, C.K.; Rawson, A. Trends in Food Science & Technology Ultrasonication—A green technology extraction technique for spices: A review. Trends Food Sci. Technol. 2021, 116, 975–991. [Google Scholar]
  25. Selahvarzi, A.; Ramezan, Y.; Reza, M.; Namdar, B. Food Bioscience Optimization of ultrasonic-assisted extraction of phenolic compounds from pomegranate and orange peels and their antioxidant activity in a functional drink. Food Biosci. 2022, 49, 101918. [Google Scholar] [CrossRef]
  26. Rasheed, A.; Cobham, E.; Zeighami, M.; Ong, S. Extraction of phenolic compounds from pineapple fruit. In Proceedings of the 2nd International Symposium on Processing & Drying of Foods, Vegetables and Fruits (ISPDFVF 2012), Semenyih, Malaysia, 18–19 June 2012. [Google Scholar]
  27. M’hiri, N.; Ioannou, I.; Ghoul, M.; Boudhrioua, N.M. Extraction Methods of Citrus Peel Phenolic Compounds. Food Rev. 2014, 30, 265–290. [Google Scholar] [CrossRef]
  28. Brahmi, F.; Blando, F.; Sellami, R.; Mehdi, S.; De Bellis, L.; Negro, C.; Haddadi-Guemghar, H.; Madani, K.; Makhlouf-Boulekbache, L. Optimization of the conditions for ultrasound-assisted extraction of phenolic compounds from Opuntia ficus-indica [L.] Mill. flowers and comparison with conventional procedures. Ind. Crops Prod. 2022, 184, 114977. [Google Scholar] [CrossRef]
  29. Garmus, T.T.; Paviani, L.C.; Queiroga, C.L.; Cabral, F.A. Extraction of phenolic compounds from pepper-rosmarin (Lippia sidoides Cham.) leaves by sequential extraction in fixed bed extractor using supercritical CO2, ethanol and water as solvents. J. Supercrit. Fluids 2015, 99, 68–75. [Google Scholar] [CrossRef]
  30. Pérez-Jiménez, J.; Arranz, S.; Tabernero, M.; Díaz-Rubio, M.E.; Serrano, J.; Goñi, I.; Saura-Calixto, F. Updated methodology to determine antioxidant capacity in plant foods, oils and beverages: Extraction, measurement and expression of results. Food Res. Int. 2008, 41, 274–285. [Google Scholar] [CrossRef]
  31. Ozsefil, I.C.; Ziylan-yavas, A. Green approach for polyphenol extraction from waste tea biomass: Single and hybrid application of conventional and ultrasound-assisted extraction. Environ. Res. 2023, 235, 116703. [Google Scholar] [CrossRef] [PubMed]
  32. Sepúlveda, L.; Romaní, A.; Aguilar, C.N.; Teixeira, J. Valorization of pineapple waste for the extraction of bioactive compounds and glycosides using autohydrolysis. Innov. Food Sci. Emerg. Technol. 2018, 47, 38–45. [Google Scholar] [CrossRef] [Green Version]
  33. Harith, N.S.; Rahman, N.A.; Zamanhuri, N.A.; Hashib, S.A. Materials Today: Proceedings Microwave-based antioxidant extraction from pineapple peel waste. Mater. Today Proc. 2023. [Google Scholar] [CrossRef]
  34. Mushtaq, M.; Sultana, B.; Anwar, F.; Adnan, A.; Rizvi, S.S.H. The Journal of Supercritical Fluids Enzyme-assisted supercritical fluid extraction of phenolic antioxidants from pomegranate peel. J. Supercrit. Fluids 2015, 104, 122–131. [Google Scholar] [CrossRef]
  35. Li, F.; Chen, B.; Han, Y.; Cao, Y.; Hong, X.; Xu, M. Enhanced adsorption of caprolactam on phenols-modified Amberlite XAD16. Reactve Funct. Polym. 2021, 161, 104850. [Google Scholar] [CrossRef]
  36. Casadey, R.; Challier, C.; Altamirano, M.; Spesia, M.B.; Criado, S. Antioxidant and antimicrobial properties of tyrosol and derivative- compounds in the presence of vitamin B2. Assays of synergistic antioxidant e ff ect with commercial food additives. Food Chem. 2021, 335, 127576. [Google Scholar] [CrossRef]
  37. Yuste, S.; Ludwig, I.A.; Rubió, L.; Romero, M.; Pedret, A. In vivo biotransformation of (poly) phenols and anthocyanins of red-fleshed apple and identification of intake biomarkers. J. Funct. Foods 2019, 55, 146–155. [Google Scholar] [CrossRef] [Green Version]
  38. Ordonez, R.; Atares, L.L.; Chiralt, A. Physicochemical and antimicrobial properties of cassava starch films with ferulic or cinnamic acid. LWT 2021, 144, 111242. [Google Scholar] [CrossRef]
  39. Calder, M.; Iztapalapa, U. Food Science and Technology Optimization of the antioxidant and antimicrobial response of the combined effect of nisin and avocado byproducts. LWT 2016, 65, 46–52. [Google Scholar]
  40. Pastoriza, S.; Ru, A.; Jim, A. Food Science and Technology Revalorization of coffee by-products. Prebiotic, antimicrobial and antioxidant properties. LWT 2015, 61, 12–18. [Google Scholar]
  41. Bouarab-Chibane, L.; Forquet, V.; Lantéri, P.; Clément, Y.; Léonard-Akkari, L.; Oulahal, N.; Degraeve, P.; Bordes, C. Antibacterial properties of polyphenols: Characterization and QSAR (Quantitative structure-activity relationship) models. Front. Microbiol. 2019, 10, 829. [Google Scholar] [CrossRef] [Green Version]
  42. Gomes, F.; Martins, N.; Barros, L.; Rodrigues, M.E.; Oliveira, M.B.P.; Henriques, M.; Ferreira, I.C. Industrial Crops & Products Plant phenolic extracts as an e ff ective strategy to control Staphylococcus aureus, the dairy industry pathogen. Ind. Crops Prod. 2018, 112, 515–520. [Google Scholar]
  43. Monente, C.; Bravo, J.; Vitas, A.I.; Arbillaga, L.; De Peña, M.P.; Cid, C. Coffee and spent coffee extracts protect against cell mutagens and inhibit growth of food-borne pathogen microorganisms. J. Funct. Foods. 2015, 12, 365–374. [Google Scholar] [CrossRef]
  44. Diarra, M.S.; Hassan, Y.I.; Block, G.S.; Drover, J.C.G.; Delaquis, P.; Oomah, B.D. Antibacterial activities of a polyphenolic-rich extract prepared from American cranberry (Vaccinium macrocarpon) fruit pomace against Listeria spp. LWT 2020, 123, 109056. [Google Scholar] [CrossRef]
  45. Zaidan, M.R.; Rain, A.N.; Badrul, A.R.; Adlin, A.; Norazah, A.; Zakiah, I. In vitro screening of five local medicinal plants for antibacterial activity using disc diffusion method. Trop. Biomed. 2005, 22, 165–170. [Google Scholar] [PubMed]
  46. Azi, F.; Li, Z.; Xu, P.; Dong, M. Transcriptomic analysis reveals the antibacterial mechanism of phenolic compounds from kefir fermented soy whey against Escherichia coli 0157: H7 and Listeria monocytogenes. Int. J. Food Microbiol. 2022, 383, 109953. [Google Scholar] [CrossRef] [PubMed]
  47. Ren, X.; An, P.; Zhai, X.; Wang, S.; Kong, Q. Food Science and Technology The antibacterial mechanism of pterostilbene derived from xinjiang wine grape: A novel apoptosis inducer in Staphyloccocus aureus and Escherichia coli. LWT 2018, 101, 100–106. [Google Scholar] [CrossRef]
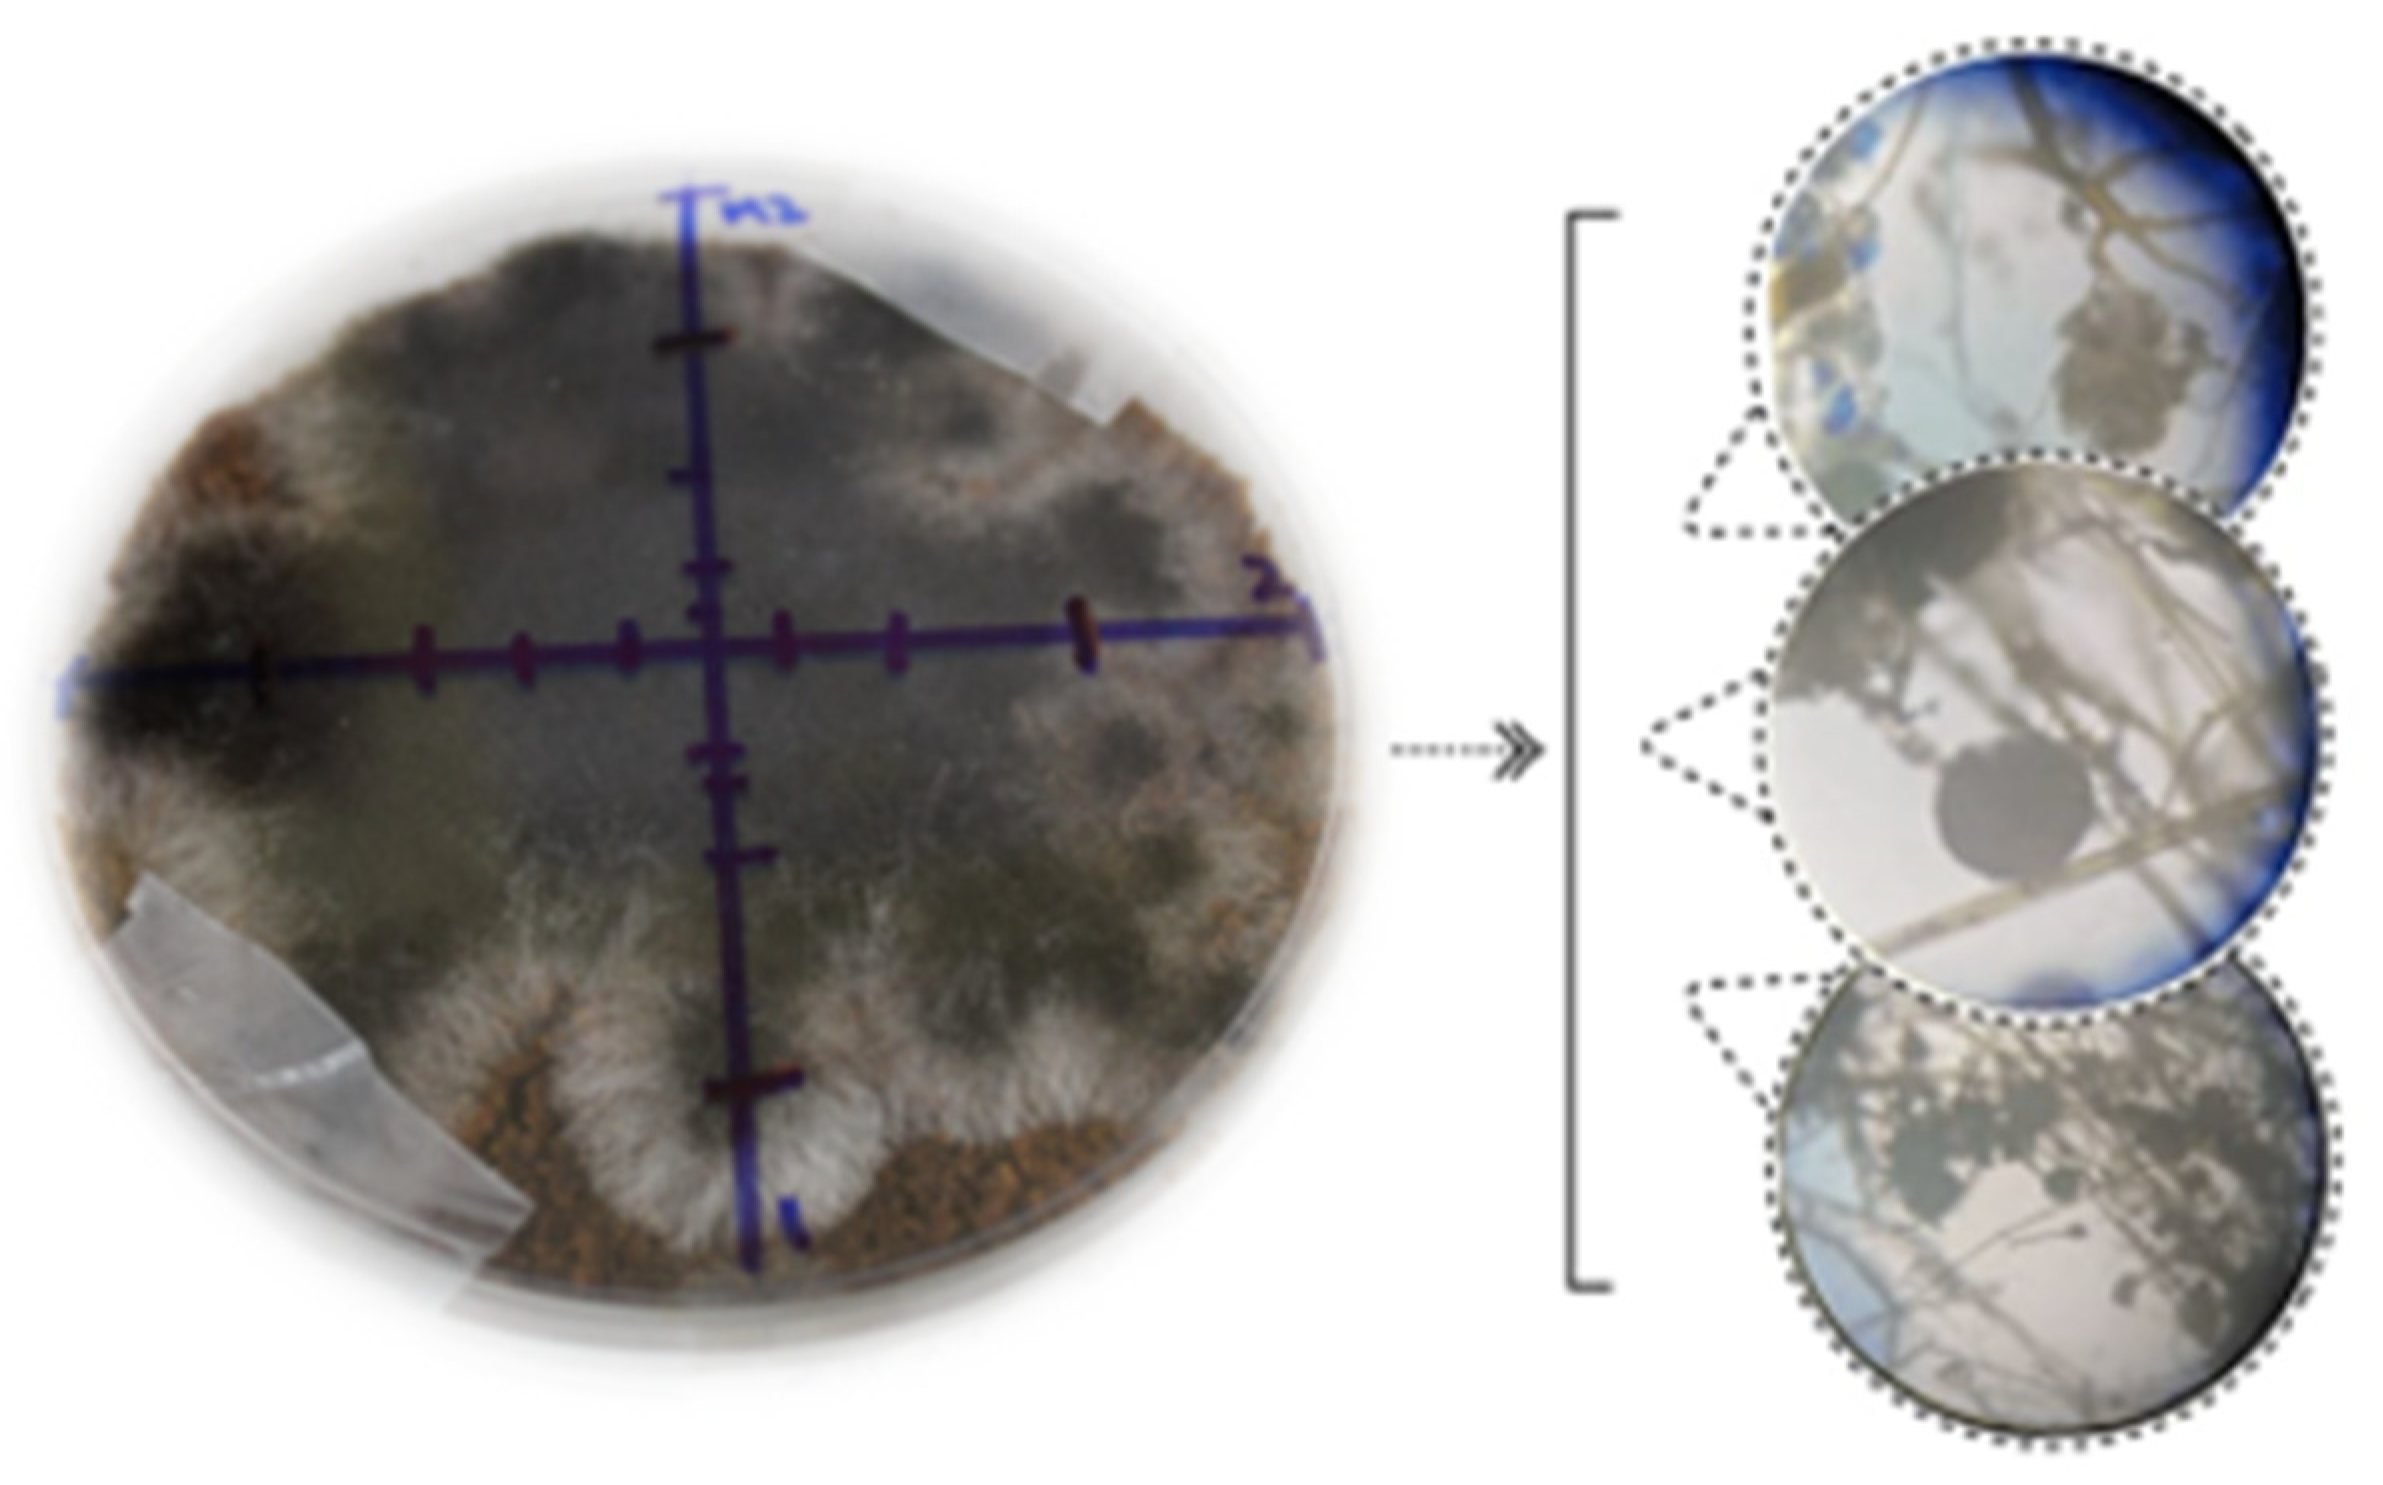
Figure 1. Radial growth test of A. niger on pineapple residues (peel and core) and growth of A. niger at 40×.
Fermentation 09 00706 g001
Figure 2. Effect on total phenolic content (TPC) in mg gallic acid equivalents (GAE) per g of fermented material of three ultrasound-assisted solid–liquid extraction factors. (A) solid–liquid ratio (X1); (B) ethanol concentration (X2); and (C) extraction cycle (X3). Letters correspond to Tukey’s test. Shared letters have no significant difference.
Fermentation 09 00706 g002aFermentation 09 00706 g002b
Figure 3. Response surfaces corresponding to the interaction between the three factors evaluated (X1, X2, and X3). (A) X3 and X1 (50% of ethanol), (B) X3 and X2 (90 mg of fermented material per mL), and (C) X2 and X1 (3 cycles).
Fermentation 09 00706 g003
Figure 4. Compound identification of optimized extract compounds using high-performance chromatography (RP-HPLC-ESI-MS 1. A total of 376.8 [M−H] m/z Tyrosol (3.4-DHPEA-EA). 2. A total of 568.1 [M−H] m/z Dihydrochalcone (Floretin 2′-O-xylosyl-glucoside) 3. A total of 324.9 acid of the methoxycinnamic (Feruloylartaric acid).
Fermentation 09 00706 g004
Figure 5. Bacterial growth curve in nutrient broth at different concentrations of the optimized extract. (A) L. monocytogenes; (B) S. aureus (■ control, ▲ ½ MIC, ● MIC, ✕ 2 MIC).
Fermentation 09 00706 g005
Figure 6. TEM micrographs of L. monocytogenes and S. aureus treated with the optimized extract obtained from the fermented MD2 pineapple residue material (EFP) (5000×). (A) L. monocytogenes treated without EFP (control); (B) L. monocytogenes treated with EFP; (C) S. aureus treated without EFP (control); and (D) S. aureus treated without EFP.
Fermentation 09 00706 g006
Table 1. Independent variables and their levels for Box–Behnken design.
Independent VariablesNomenclatureLevels
Low (−1)Medium (0)High (1)
Solid–liquid ratio (g/mL)X12590155
Ethanol concentration (%)X2105090
Extraction cycle (No)X3234
Table 2. Experimental and predicted values were obtained for the TPC (mgGAE/g dry matter) of fermented pineapple-residue extracts.
RunExperimental ResultsPredicted Results
114.262 ± 1.5711.718
29.580 ± 0.456.988
312.17 ± 1.5211.996
49.346 ± 1.949.458
57.239 ± 1.976.347
69.290 ± 1.1110.098
76.183 ± 0.835.689
810.06 ± 1.519.512
99.604 ± 2.289.512
106.069 ± 1.125.327
114.289 ± 0.815.049
1210.081 ± 0.1412.358
138.865 ± 2.679.512
141.741 ± 0.392.216
158.440 ± 3.048.885
Table 3. ANOVA results for the second-order polynomial equation.
FactorDFSSMCF-Valuep-Value
X1119.35619.35510.830.022
X2188.95388.95349.750.001
X310.8200.8200.460.528
X1 × X117.6967.6964.300.093
X2 × X213.4233.4231.910.225
X3 × X310.0870.0880.050.834
X1:X210.0880.0880.050.834
X1:X316.1526.1523.440.123
X2:X319.2269.2265.160.072
Lack of fit38.2042.7357.430.121
R20.938
R2 adj0.826
SS: sum of squares; DF: degree of freedom; MS: mean square.
Disclaimer/Publisher’s Note: The statements, opinions and data contained in all publications are solely those of the individual author(s) and contributor(s) and not of MDPI and/or the editor(s). MDPI and/or the editor(s) disclaim responsibility for any injury to people or property resulting from any ideas, methods, instructions or products referred to in the content.