Article

Diversity of Indigenous Saccharomyces cerevisiae Yeast Strains in Cabernet Sauvignon Fermentations from Utiel-Requena Region (Spain) as a Resource to Improve Wine Distinctiveness

1
Institut Universitari de Biotecnologia i Biomedicina, Universitat de València, C/Dr. Moliner, 50, Burjassot, 46100 València, Spain
2
Departament de Microbiologia i Ecologia, Facultat de Ciències Biològiques, Universitat de València, C/Dr. Moliner, 50, Burjassot, 46100 València, Spain
3
Institut Universitari d’Enginyeria d’Aliments-FoodUPV, Universitat Politècnica de València, Camino de Vera, s/n., 46022 València, Spain
*
Author to whom correspondence should be addressed.
Fermentation 2023, 9(7), 654; https://doi.org/10.3390/fermentation9070654
Submission received: 5 June 2023 / Revised: 23 June 2023 / Accepted: 26 June 2023 / Published: 12 July 2023
(This article belongs to the Special Issue Recent Applications of Biotechnology in Wine and Beer Production)

Abstract

:
The aim of this study was to isolate and characterize autochthonous Saccharomyces cerevisiae yeasts from Cabernet Sauvignon grape must and to analyze how they impacted the final characteristics of the wines obtained from the same type of must. This work was carried out in a “Pago” winery located in Requena, Spain. Twenty-two isolates were obtained from grape must. After molecular identification and typing, 11 different strains were determined. Growth-related parameters and metabolic characteristics (glucose and fructose consumption and ethanol, glycerol and acetic acid production) were determined via laboratory-scale fermentations (50 mL) of Cabernet Sauvignon must. From 2 L fermentation batches, the residual sugar, density, ethanol concentration, titratable and volatile acidities, pH and polyphenolic and volatile compounds were determined, as well as the sensory attributes of the produced wines. Differences between strains in the growth and metabolic parameters were observed. Eleven S. cerevisiae strain profiles were characterized to establish which strain or strains of the selected yeasts would produce the highest polyphenolic and aromatic concentrations of the red Cabernet wines made in the “Pago winery”, to then multiply them for their use to make the red wines of this winery.

1. Introduction

Wine characteristics depend on numerous factors related to geography, geology, climatology, agronomic practices, vine clone, enology, biochemistry, microbiology and technology. Variation in these factors leads to the high diversity of wines that are produced around the world [1].
“Terroir” includes specific soil, topography, climate, landscape characteristics and biodiversity features. Vitivinicultural “terroir” is a concept that refers to an area in which the collective knowledge of the interactions between the identifiable physical and biological environments and applied vitivinicultural practices develop, and it provides distinctive characteristics for the products that originate from this area. Another concept connected to it is “Pago” wines, which is a Spanish Geographical Indication [2,3]. “Pago” wine is understood as coming from a rural site with its own edaphic and microclimate characteristics that differentiate it from wine from other surrounding areas. It is linked with traditional vineyard cultivation techniques, which are followed to obtain wines of unique quality [2]. A “Pago” winery needs to select its own yeast or yeasts from among those that carry out their fermentations [4,5].
The microbial species found in grapes depend on the weather, phytosanitary status and ripeness, as well as on the microbiota present in the winery. Although there are a larger number of yeast species belonging to non-Saccharomyces genera (Hanseniaspora, Metschnikowia, Pichia, Candida, etc.) than to Saccharomyces cerevisiae on the grape surface and in fresh must [6], this yeast overcomes the rest of the species a few hours after fermentation begins. It is well-reported that non-Saccharomyces can impact the aroma composition of wines, because they have hydrolytic enzymes that interact with grape precursor compounds, so the importance of their effect is related to their persistence during fermentation [6]. S. cerevisiae does not have as many hydrolytic enzymes as non-Saccharomyces yeasts, but, in addition to ethanol, it is able to produce many compounds that influence the final characteristics of wines [7]; furthermore, its persistence in wine is longer than that of non-Saccharomyces yeasts. The activities of different yeast strains have an impact on the sensorial profile of wine through increasing its complexity, influencing its phenolic and aromatic composition and considerably contributing to its organoleptic richness [8,9,10].
Fermentation can be performed using commercial yeast starters or spontaneous microbiota. As each strategy has advantages and disadvantages, the use of commercial yeast, thus, provides the security of good fermentation control and guarantees the production of wine without organoleptic defects [11]. However, employing commercial yeasts that were developed in the 1980s has involved the homogenization of the profile of wines, which may result in high-quality wines, though with very little differentiation [12]. Furthermore, the addition of commercial yeasts in fermentation can inhibit the action of indigenous grape yeasts [13]. Spontaneous fermentation provides a higher typicity and distinctiveness of wines, but fermentation control and the final results are difficult to manage. This is why many wineries are currently attempting to select their own yeasts to produce wines in compliance with the requirements [3]. Through improving the distinctiveness of the wines of “Pago” winemakers, it is possible to put the microbial diversity associated with their cultivars and the fermentation process to good use [4,5].
One of the requirements for a yeast strain to be selected is that it is well-adapted to the must characteristics that are going to be fermented; it is well-known that one yeast isolated from the same must and winery is better adapted to this medium than a foreign yeast is. It should have good fermentative power, produce compounds that favor sensory quality and confer the wines with a typical character. This selection implies directly isolating a large number of yeasts from the grapes of a certain vineyard or wine region or from the fermentation process [14], as well as an enological characterization process that ensures the selected yeasts’ good technological and enological behavior [15]. Viticultural practices can modify yeast diversity, and different strains appear depending on the vintage characteristics [16]. Therefore, to perform a significant isolation of the population of yeast strains, it is interesting to study different plots and fermentations from the same winery.
This procedure was used to select indigenous strains of S. cerevisiae in Cabernet Sauvignon grapes in China [17,18]; Cabernet Sauvignon and Malbec grapes harvested from vineyards in Lujan de Cuyo (Mendoza, Argentina) by Maturano et al. [19]; Malbec grapes in Patagonia vineyards by Lopes et al. [20]; “Gioia del Coll” DOC grapes in Apulia, Southern Italy [21]; and in Merlot and Garnacha musts from the same region as our Cabernet Sauvignon [4,5].
The aim of this study was to isolate and characterize autochthonous S. cerevisiae yeasts from Cabernet Sauvignon grape must and to analyze how they impacted the final characteristics of the wines obtained from the same type of must.

2. Materials and Methods

2.1. Winery Characteristics and Yeast Isolation

The “Chozas Carrascal” winery, located in Requena (Valencia, Spain), has a vineyard of 80 hectares, of which 7 ha are planted with the Cabernet variety. This “Pago” produces approximately 500,000 kg of grapes per year, of which 35,000 kg (7%) are of the Cabernet variety. Spontaneous fermentation is currently carried out by the winery and commercial yeasts have never been used. The yeasts were isolated from the fermentation of a 20,000 L vat of Cabernet Sauvignon grape must. The characteristics of this must were 23.40 ± 0.7 °Brix; 7.00 ± 0.43 g/L titratable acidity expressed as tartaric acid; pH 3.61 ± 0.09. Triplicate samples were taken at three different times during the winemaking process: from the grape must (GM), halfway (HAF) at a density (in g/L) between 1020–1030, and at the end of alcoholic fermentation (EAF) at a density (in g/L) between 990–993. The samples appropriately diluted in saline solution were spread on Yeast extract, Peptone, and Dextrose (YPD) plates (CECT Spanish Type Culture Collection Catalogue https://www.uv.es/uvweb/spanish-type-culture-collection/en/cect/strains/culture-media-catalogue-/media-search-engine-1285893135114.html (accessed on 20 June 2023)), and incubated at 28 °C for 48–72 h. The colonies grown on the plates were counted. The counts were expressed as colony-forming units per milliliter (CFU/mL). Twelve colonies from the GM samples, 15 from the HAF samples and 16 from the EAF samples were randomly picked from the triplicate plates and were then streaked onto the YPD plates. After purity assurance, they were grown in YPD broth and stored glycerinated at −20 °C in equal volumes of 30% glycerol.

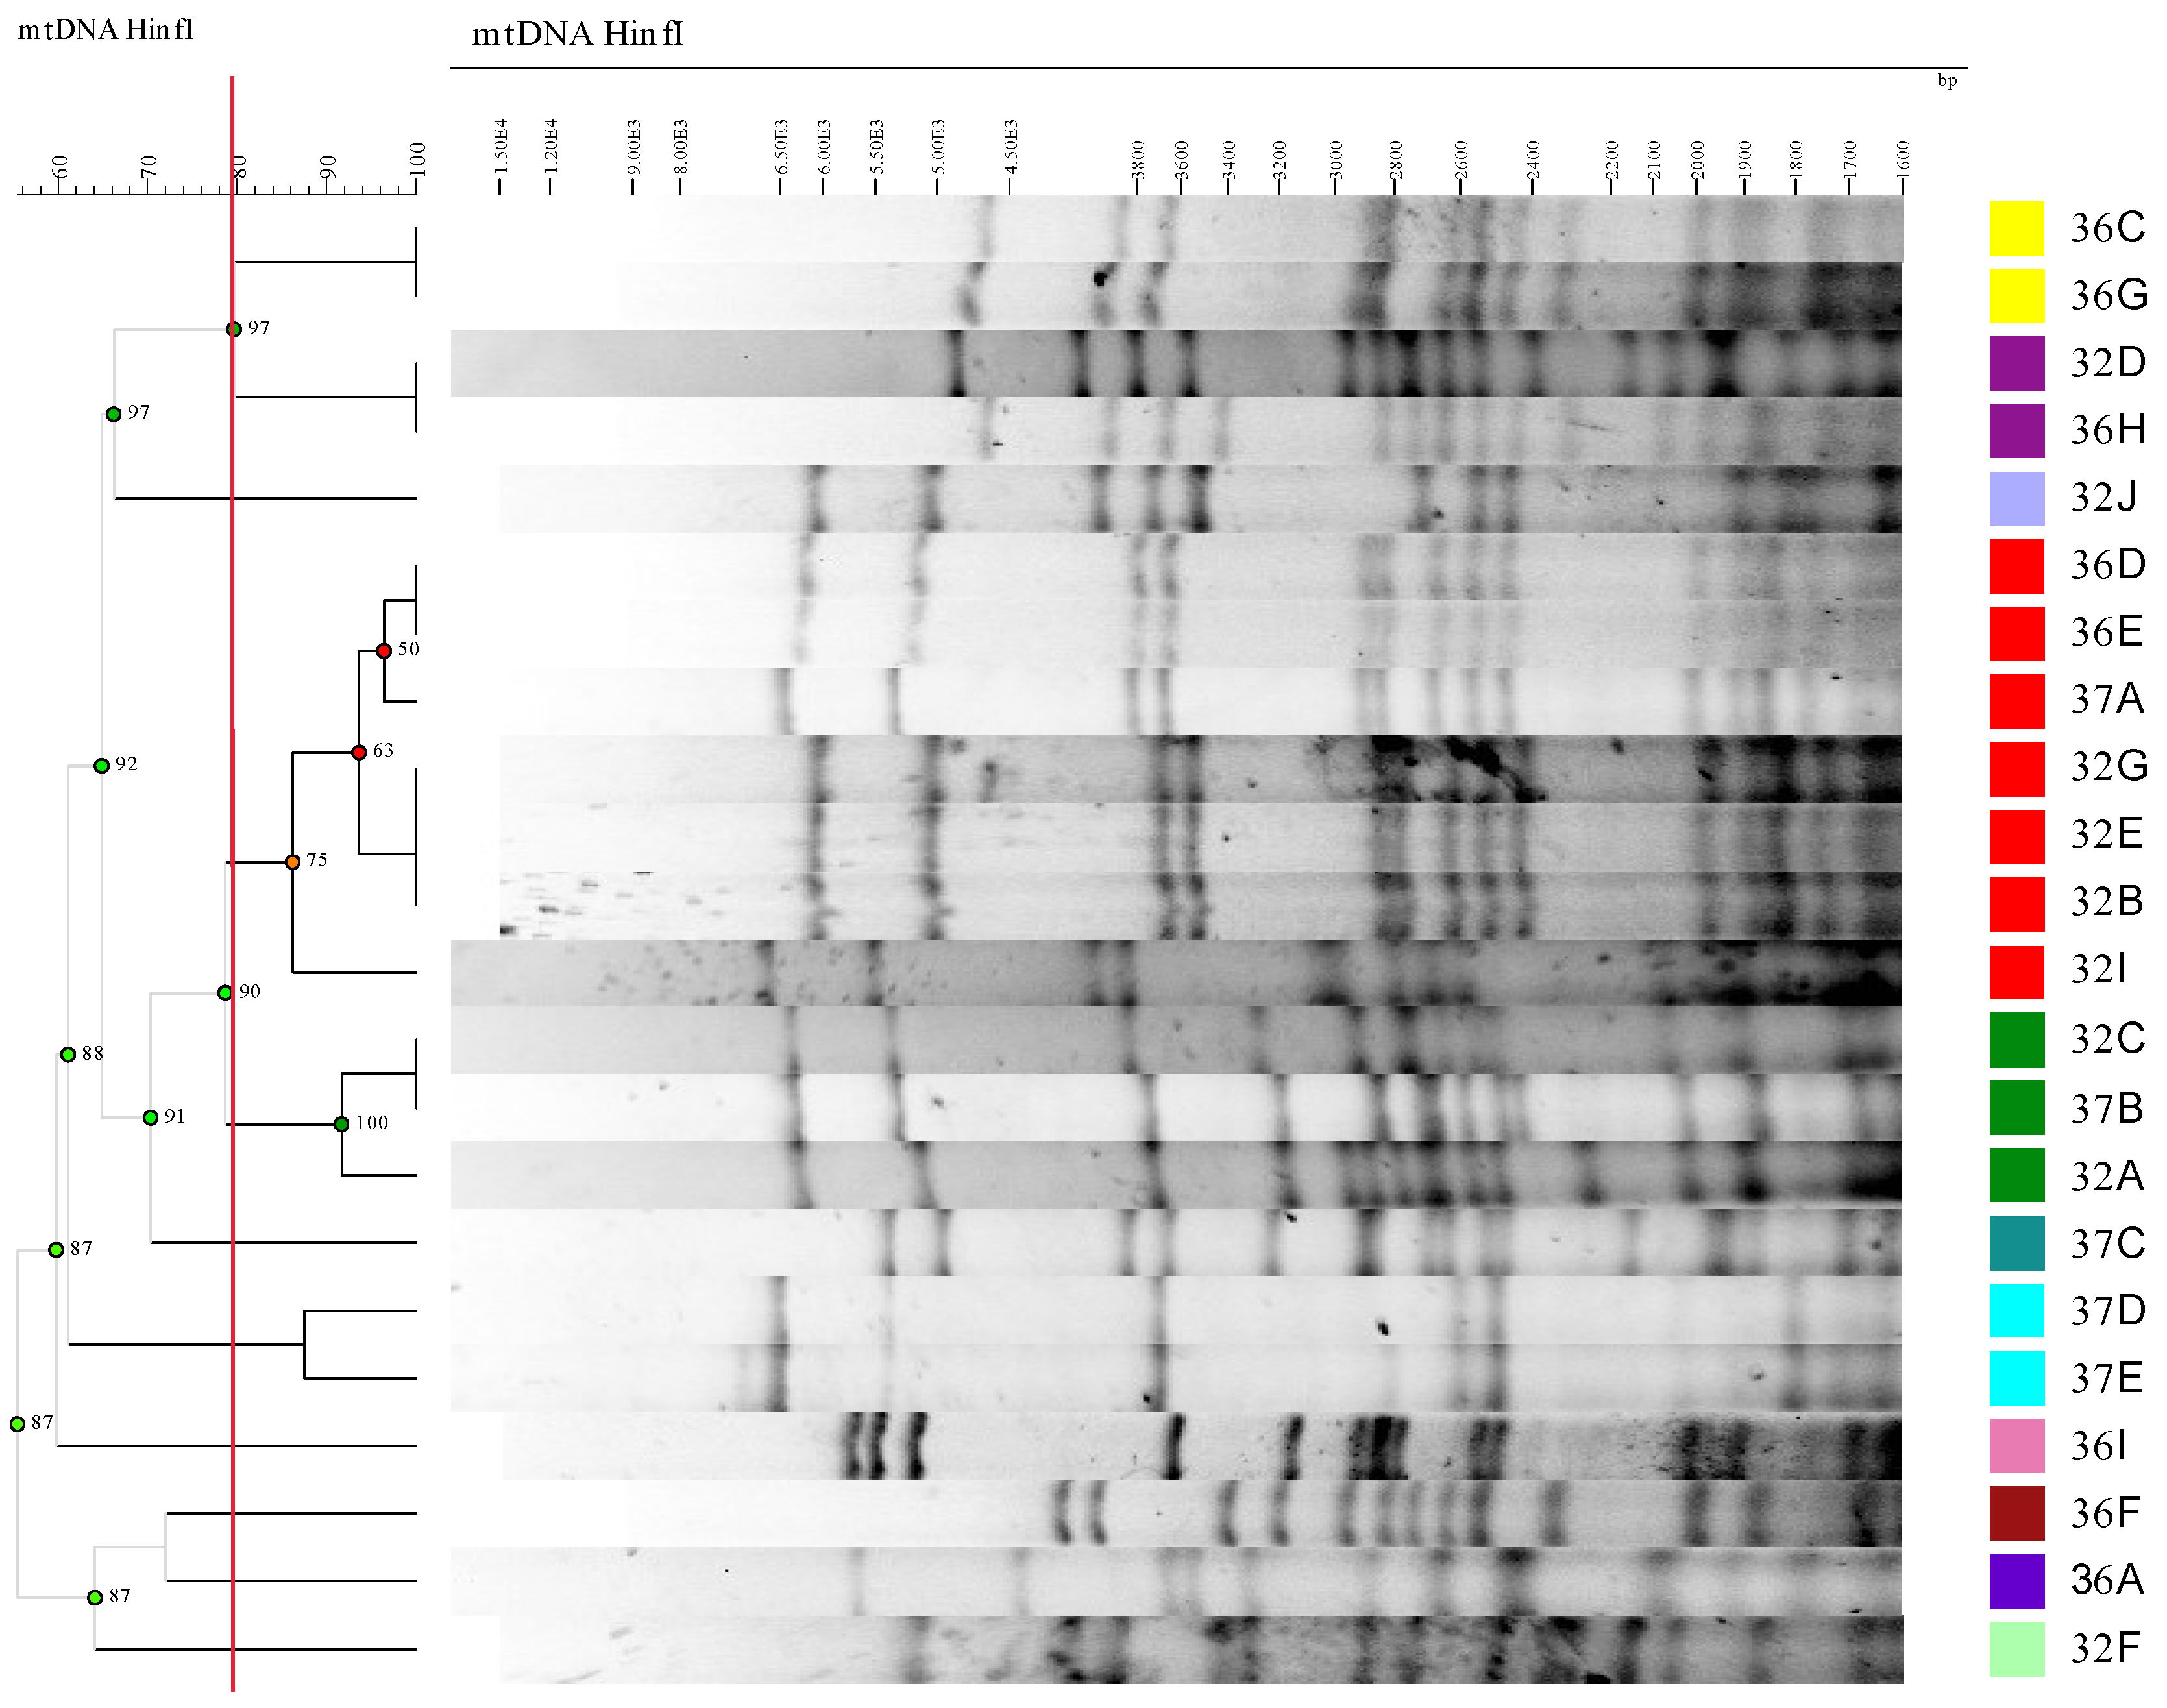
2.2. Yeast Identification and Molecular Discrimination at the Strain Level

Forty-three isolates were identified via Internal Transcribed Sequences (ITS) analysis of the ribosomal operon. The ITS1 and ITS4 primers, and the procedure described by Esteve-Zarzoso et al. [22] with slight modifications, were used to amplify a region of the rRNA gene repeat unit. The modifications to the procedure were: a reaction volume of 50 instead of 100 μL, and a MgCl2 concentration of 2 mM instead of 1.5 mM. One colony was resuspended in 50 μL of the reaction mixture containing EuroTaq Taq Polymerase (0.05 U/mL), 5 μL of the enzyme buffer, the ITS1 and ITS4 primers (1 mM each) and the dNTPs mixture (0.2 mM each). ITS sequencing was performed at the Servei Central de Suport a la Investigació Experimental (SCSIE) of the Universitat de València. Identity was determined using BLAST.
All the isolates identified as S. cerevisiae were discriminated at the strain level through analyzing the mitochondrial DNA digest (mDNA) band profile using HinfI as the restriction enzyme under the conditions described by Querol et al. [23]. Modifications to the procedure were: sorbitol and SDS concentrations at 0.9 M and 0.26% instead of at 1 M and 1%, respectively; Zymolyase 20T solution at a final concentration of 0.07 mg/mL; 30 and 5 min times at 65 °C and on ice, respectively; increase of centrifugation time from 5 to 10 min to remove cell debris; finally, purified DNA was dissolved in 50 μL Tris-EDTA (pH 8) buffer. HinfI restriction digestion was performed using 10 μL of extracted DNA, 2 μL of reaction buffer R and 1 μL of HinfI (10 U/μL) from Sigma-Aldrich (St. Louis, Missouri, USA), 1 μL of RNAase (4 mg/mL) from Roche (Darmstadt, Germany) and 6 μL of Milli-Q water. The reaction mixture was incubated overnight at 37 °C. Restricted DNA was electrophoresed on 0.8% agarose gel in 0.5× TBE buffer at 20 V for 16 h before staining with ethidium bromide. Gels were digitized and the HinfI mDNA restriction profiles were compared using BioNumerics 5 software (Applied Maths, Kortrijk, Belgium) to classify isolates based on profile similarity. The Unweighted Pair Group Method with Arithmetic Mean (UPGMA) was used as the comparison method through employing Pearson’s Product-Moment Coefficient. All the isolates belonging to the same mDNA restriction group were considered to be the same strain. One representative isolate from each mDNA restriction profile was selected for characterization as described below.

2.3. Yeast Characterization

The parameters used to evaluate the strains were growth-related (growth kinetics, maximum growth rate, Area Under the Curve (AUC)) and metabolism-related (glucose and fructose consumption; ethanol, glycerol, and acetic acid production, and ethanol yields at 3, 7, and 21 days). Yeast characterization was carried out in the same Cabernet grape must from which the yeasts were isolated.
Cabernet Sauvignon grape must was pretreated to eliminate any existing microorganisms prior to yeast inoculation. Solids and most native microorganisms were removed from must via centrifugation at 17,696× g and 4 °C for 40 min in a Beckman coulter Avanti J-E, JA10 rotor. The supernatant was treated with 0.25 g/L of Velcorin® (Lanxess, Cologne, Germany) to kill any possible remaining microorganisms. The antiseptic was allowed to act for 5–6 h at room temperature before inoculation of the yeast. Yeasts were grown in YPD broth at 28 °C for 48 h, and yeast concentrations were determined via microscopic counting in a Thoma chamber and through inoculation of YPD plates. Yeasts were inoculated into 50 mL of Cabernet Sauvignon must at a final concentration of 2 × 10⁵ cells/mL. The inoculated musts were incubated at 28 °C for 21 days. Fermentations were carried out in triplicate. Samples were taken on days 1, 3, 7, 14 and 21. One must sample before inoculation (time 0) was analyzed. Yeast growth was monitored via plate counting of samples collected on the fermentation days described above. Growth kinetics was used to calculate the maximum growth rate (μmax) and the AUC. The μmax values were calculated as the rate between the increase in viable cell counts and the time in the exponential growth phase (Δ CFU/mL/h). The AUC measures the total two-dimensional area under the entire growth curve [24], taking into account, in our case, three interval growth times: from 0 to 3, from 0 to 7, and from 0 to 21 days. The concentrations of glucose, fructose, ethanol, glycerol and acetic acid concentrations of the samples were determined via high-performance liquid chromatography (HPLC) using the method described by Frayne [25]. The glucose and fructose consumed, and the ethanol, glycerol and acetic acid produced after 3, 7 and 21 days, were used to establish the correlations between growth and metabolic parameters.

2.4. Microvinification

The influence of yeast on the polyphenolic composition, aroma characteristics and sensory attributes of Cabernet Sauvignon wines was determined through microvinification of Cabernet Sauvignon grapes added with SO2 g/L as described below.
The grapes were harvested in 10 kg boxes. They were manually destemmed and frozen in the experimental winery of the Institute of Food Engineering for Development of the Universitat Politècnica de València. The day before vinification, they were taken out of the freezer and processed. Then, 1.6 kg of grapes were weighed, crushed and immediately covered in 2 kg jars fitted with airlocks. Next, 200 mg/kg of Velcorin® (Lanxess, Cologne, Germany) was added to destroy the native microbiota of the grapes. After Velcorin® treatment, 0, 1 and 1 yeast UFC/mL were found in triplicate samples inoculated with 100 μL of the undiluted samples. The microvinifications were then sulfited with potassium metabisulfite (100 mg/kg) (E-224, Agrovin, Alcazar de San Juan, Spain) at a rate of 50 mg/kg SO2.
Twenty-four hours later, the previously selected S. cerevisiae yeast strains were inoculated. Eleven microvinifications were carried out in triplicate fermentations with 1.6 kg of the stemmed and crushed grapes. Alcoholic fermentation (AF) took place at 25–26 °C and lasted about 10 days. During fermentation, manual punching down was carried out twice a day, the main aim being to promote the extraction of polyphenolic compounds.
The fermentation was monitored daily through measuring both the temperature and the density in order to verify the proper fermentation kinetics and the absence of fermentation arrest. At a density of 992–993 g/L, fermentation was considered complete when the concentration of reducing sugars in the wines was between 1 and 2 g/L.
At the end of AF, Viniferm Œ104 Oenococcus oeni lactic bacteria (Agrovin, Alcazar de San Juan, Spain) were inoculated at the rate recommended by the supplier; the wines took between 15 and 20 days to complete malolactic fermentation (MLF). This fermentation was monitored via paper chromatography [26]. At the end of MLF, the wines were racked and sulfited with potassium bisulfite (E-224, Agrovin, Alcazar de San Juan, Spain) to obtain a free SO2 concentration of 30 mg/L. The wines were bottled in 500 mL bottles and aged for 2 months at between 16–18 °C before the chemical and sensory analyses were carried out.

2.5. Chemical Analysis

2.5.1. Common Parameters

The common parameters (sugar concentration in the must, density and specific gravity, titratable acidity, volatile acidity, pH, reducing sugars) were determined according to the Official Regulation Methods established by the OIV [27]. The pH was measured with a Crison 507 pHmeter (Barcelona, Spain). The general parameters were analyzed in triplicate and the results were expressed as the mean of the three determinations ± standard deviation. The ethanol content of the treated wines was determined using a Salleron-Dujardin ebulliometer (Paris, France) [28].

2.5.2. Phenolic Composition of Wines

A JASCO V-630 UV-Visible spectrophotometer (JASCO, Tokyo, Japan) was used for the phenolic measurements. All the spectrophotometric measurements were performed in triplicate. Color intensity (CI), hue and the Total Polyphenol Index (TPI) were determined according to the method of Glories [29]. The method of Ribéreau-Gayon and Stonestreet [30] was followed for the determination of bisulfite-decolored anthocyanins and total anthocyanins. Commercial standards were used to establish calibration curves for the phenolic quantification: flavan-3-ols (Fluka, Milwaukee, WI, USA) and malvidin-3-glucoside Sigma-Aldrich, (St. Louis, Missouri, USA) for anthocyanins. Catechins were quantified according to the method reported by Sun et al. [31]. The total tannin concentration was estimated according to Ribéreau-Gayon et al. [32]. The degree of polymerization of tannins was calculated using the DMACH Index [33]. The content of proanthocyanidins combined with polysaccharides was estimated using the Ethanol Index [29].

2.5.3. Analysis of Aromatic Volatile Compounds

Twenty-five volatile compounds were determined in the wines via Gas Chromatography (GC). The extraction method used was that proposed by Ortega et al. [34], with some modifications to optimize it [35]. The gas chromatograph was an HP 6890 Series PLUS (Hewlett-Packard, Palo Alto, CA, USA), equipped with a flame ionization detector (FID). Separation was performed in a ZB-Wax plus column (60 m × 0.25 mm × 0.25 µm) from Phenomenex (Torrance, CA, USA). The injector and detector temperatures were 300 °C. The flow rate of the helium gas vector was 3 mL/min and the oven temperature followed this program: the column was initially held at the 40 °C isotherm for 5 min; from 40 °C to 102 °C at a rate of 4 °C/min, and then to 112 °C at a rate of 2 °C/min; to 125 °C at a rate of 3 °C/min and held at this temperature for 5 min before rising to 160 °C at a rate of 3 °C/min; to 200 °C at a rate of 6 °C/min, which was maintained for 30 min. Injection was performed in the split mode 1:20 (injection volume 2 μL) using an FID.

2.5.4. Sensory Evaluation

A descriptive analysis of the Cabernet Sauvignon wines fermented with different S. cerevisiae strains was carried out by a trained sensory panel of 12 people, previously selected and trained [36]. Initially, the three microvinifications resulting from each trial with a particular yeast were subjected in triplicate to a triangular test according to ISO Standard 4120:2004 [37] and were mixed in the same proportion before this sensory analysis. The wines were evaluated in individual temperature-controlled tasting booths. Water and unsalted crackers were provided for palate cleansing. The tasting took place under standardized conditions in a tasting room with standard booths according to ISO Standard 8589:2007 [38]. Wine aliquots (30 mL) were served at 18–19 °C in tasting glasses according to ISO Standard 3591:1977 [39], labeled with a 3-digit code, in a completely randomized order. Dark tasting glasses were used to avoid interference from visual sensations and to allow panelists to pay attention to gustatory sensations. Between tastings, panelists chewed on a cracker and then rinsed their mouths with water. The quantitative and descriptive sensory analysis [40] was carried out in a single session to avoid the influence of the tasters’ physical conditions on the wine evaluation.

2.6. Statistical Analysis

Analysis of variance (ANOVA) was performed with yeast strain as the main factor. All the analyses were performed in triplicate for each fermentation replicate. The results are expressed as mean values ± SD. The objective was to determine, on the one hand, whether a yeast strain significantly affected the behavior of the AUC, μmax, glucose and fructose consumption as well as ethanol, glycerol and acetic acid production at 3, 7 and 21 days and, on the other hand, whether a yeast strain significantly affected the physico-chemical composition, phenolic compounds and aromatic volatiles of the wines. In both cases, a simple ANOVA analysis was carried out with a confidence level of 95%. When a determination was statistically significant at p < 0.05, the differences between yeast strains were evaluated using Duncan multiple range tests at p < 0.05. Both statistical analyses were performed using Statgraphics Centurion XVI software (Statgraphics Technologies, The Plains, VA, USA). Spearman correlation analysis was performed among growth parameters (μmax and AUC), glucose and fructose consumption and ethanol, glycerol and acetic acid production at days 3, 7 and 21. Calculations were performed using GraphPad 5 software (GraphPad Software, San Diego, CA, USA).
A Principal Components Analysis (PCA) and orthogonal projections to the latent structure discriminant analysis were performed to simplify the results, using version 10 of SIMCA software (MKS Data Analytics Solutions, Malmö, Sweden). A PCA was used to identify the main factors explaining most of the observed variance from a much larger number of manifest variables.

3. Results and Discussion

3.1. Yeast Isolation and Identification

Forty-three isolates were obtained from the GM, HAF and EAF samples. The ITS lengths found in the isolates were 775, 800 and 850 bp. As a result of ITS sequencing, the isolates with 775 bp were identified as Hanseniaspora valbyensis and Hanseniaspora uvarum, those with 800 bp were taken as Torulaspora delbrueckii and those with 850 bp as S. cerevisiae. In order to know whether different S. cerevisiae strains were present during AF, a HinfI restriction mDNA analysis was performed on the isolates belonging to this species. The results obtained through comparing the restriction profiles are shown in Figure 1 and Table 1.
The grape must obtained from an industrial fermentation vat had a total yeast count of 1.3 × 10⁴ ± 2.1 × 10² CFU/mL. The microbiota was mainly composed of T. delbrueckii (53.9%) and H. uvarum (38.5%), while a low percentage of H. valbyensis (7.7%) was found. The yeast population increased to 4.3 × 10⁷ ± 4.2 × 10⁶ CFU/mL at HAF and decreased slightly to 1.1 × 10⁷ ± 7.1 × 10⁵ CFU/mL at EAF. At HAF and EAF, all the isolates belonged to S. cerevisiae (100%). The absence of S. cerevisiae isolates at GM was not surprising, as some authors [41,42] have not found them on grape surfaces, and only at a very low concentration in grape must [41]. The relatively low concentration of S. cerevisiae compared to the non-Saccharomyces species was the reason why it was not easy to recover it when diluted grape must was spread on solid media. The presence of H. uvarum or its anamorph Kloeckera apiculata is common in fresh must, as well as T. delbrueckii, although the latter yeast has been less reported [6,41,43,44,45].
The results of the mDNA analysis showed that the 22 isolates were grouped into 11 different patterns at the 79.5% cut-off level (Figure 1). Isolates grouped in the same profile were considered to belong to the same strain. The most represented patterns (strains) in the Cabernet fermentations were patterns 2 (represented by isolate 32E) and 4 (represented by strain 32C), which consisted of seven and three isolates, respectively. The other groups contained one isolate or two isolates (Table 1). At HAF, only profiles (representative strains) 1 (32F), 2 (32E), 3 (32D) and 4 (32C) were present. At EAF, all these profiles remained, except profile 1 (representative isolate 32F), whereas seven different profiles appeared (from 5 to 11, respectively represented by isolates 36I, 32J, 36F, 36C, 36A, 37E and 37C). Some profiles were detected only at one fermentation time point: profile 1 was exclusively present at HAF, whereas profiles 5 to 11 were recovered only at EAF. The most abundant profile at HAF was profile 2 (50%), followed by profile 4 (25%), and profiles 1 and 3 were the least abundant (12.5% each). At EAF, profile 2 was still the most common (21%), but with at a lower percentage than at HAF. The same was true for profile 4, whose percentage dropped from 25% at HAF to 7% at EAF, while the newly appearing profiles 8 and 10 reached the same percentage as profile 4. Other profiles (5, 6, 7, 9 and 11) that were not recovered at HAF were present at low percentages at EAF (7% for all of them). All the recovered S. cerevisiae strains were considered autochthonous strains, as the winery had never used commercial yeasts. This high diversity of S. cerevisiae in a single fermentation has been reported previously [46,47]. Could the vineyard be the origin of the high diversity found in the fermentation? Some authors have reported significant genetic diversity in S. cerevisiae isolated directly from vineyards [48,49], while Mercado et al. [48] reported different levels of S. cerevisiae biodiversity in Malbec vineyards of the “Zona Alta del Río Mendoza” (Argentina). These authors attributed such differences to different vineyard practices. Other authors have stated that S. cerevisiae strains originate from winery equipment [41]. We do not have an answer for the origin of the strains isolated during the fermentation of Cabernet, as we were not able to recover any S. cerevisiae isolate at GM that would have more clearly reflected the microbiota of the vineyard. In our case, strains 32F and 32C were dominant during fermentation. The greater number of strains found at EAF could reflect differences in the growth behavior of the yeasts. We found differences in the growth kinetics of the different strains when they had grown alone in sterile Cabernet Sauvignon grape must (Figure 2A). Strains 32C and 32E, isolated from HAF, grew rapidly during the first three days in sterile grape must, but later died off more rapidly than other strains, such as 36A, 36I, 37C and 37E. This difference in growth dynamics could explain why strains 32C and 32E were dominant at HAF but not at EAF during industrial fermentation. A similar picture of dominance and succession of the S. cerevisiae strains during fermentation has been reported previously [46,47,50].

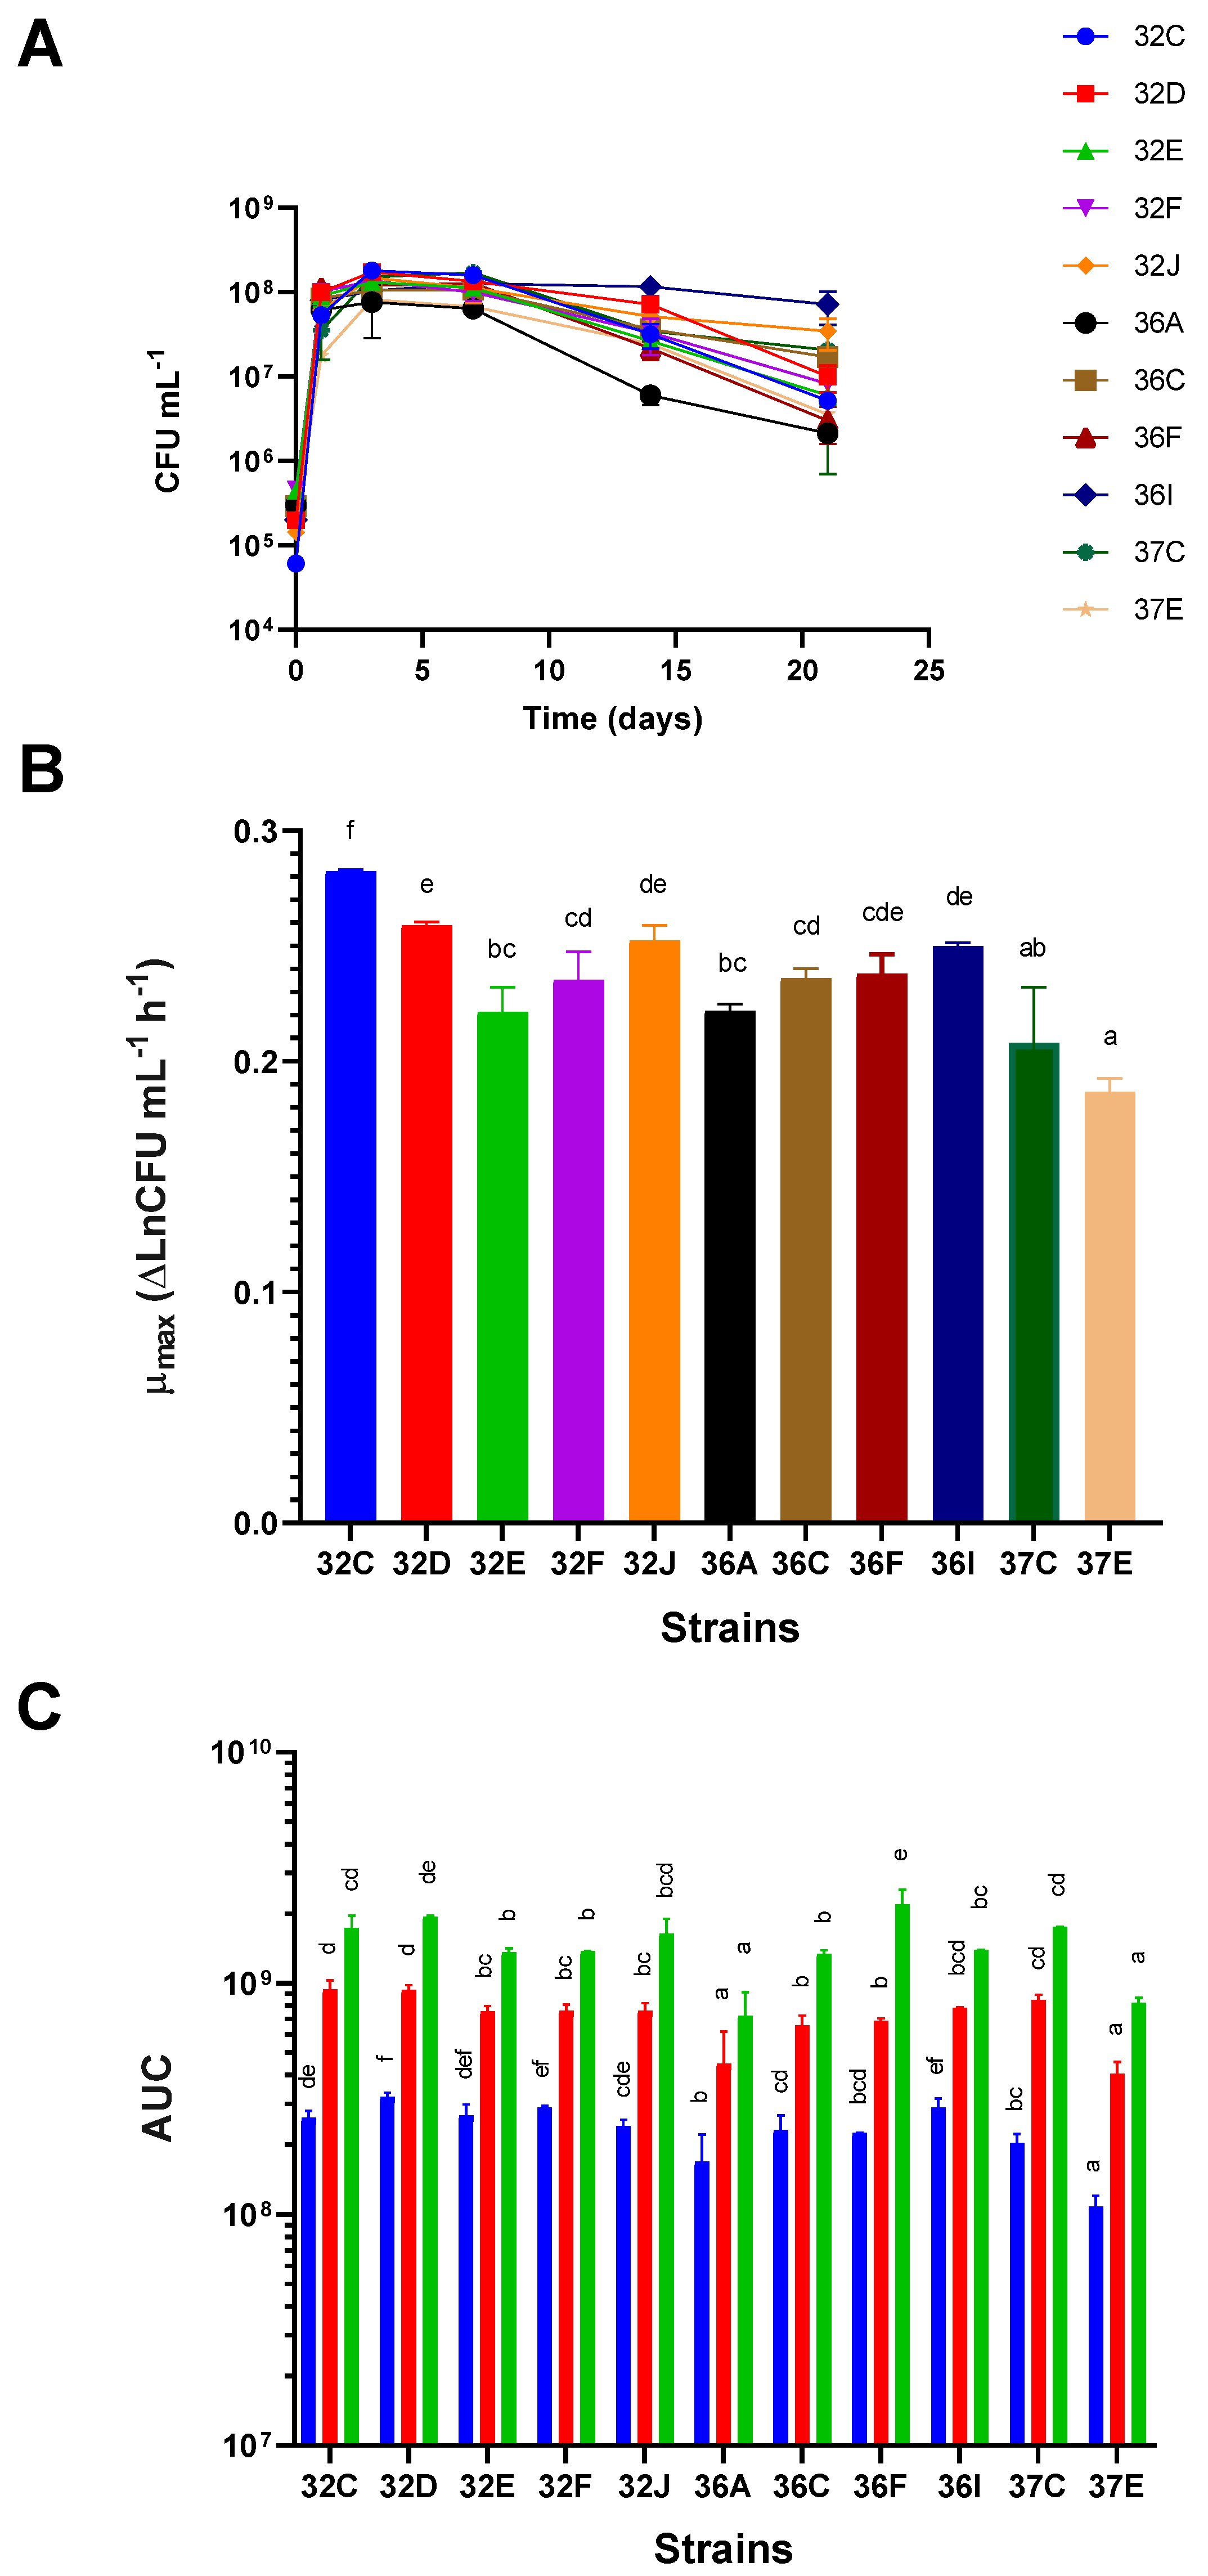
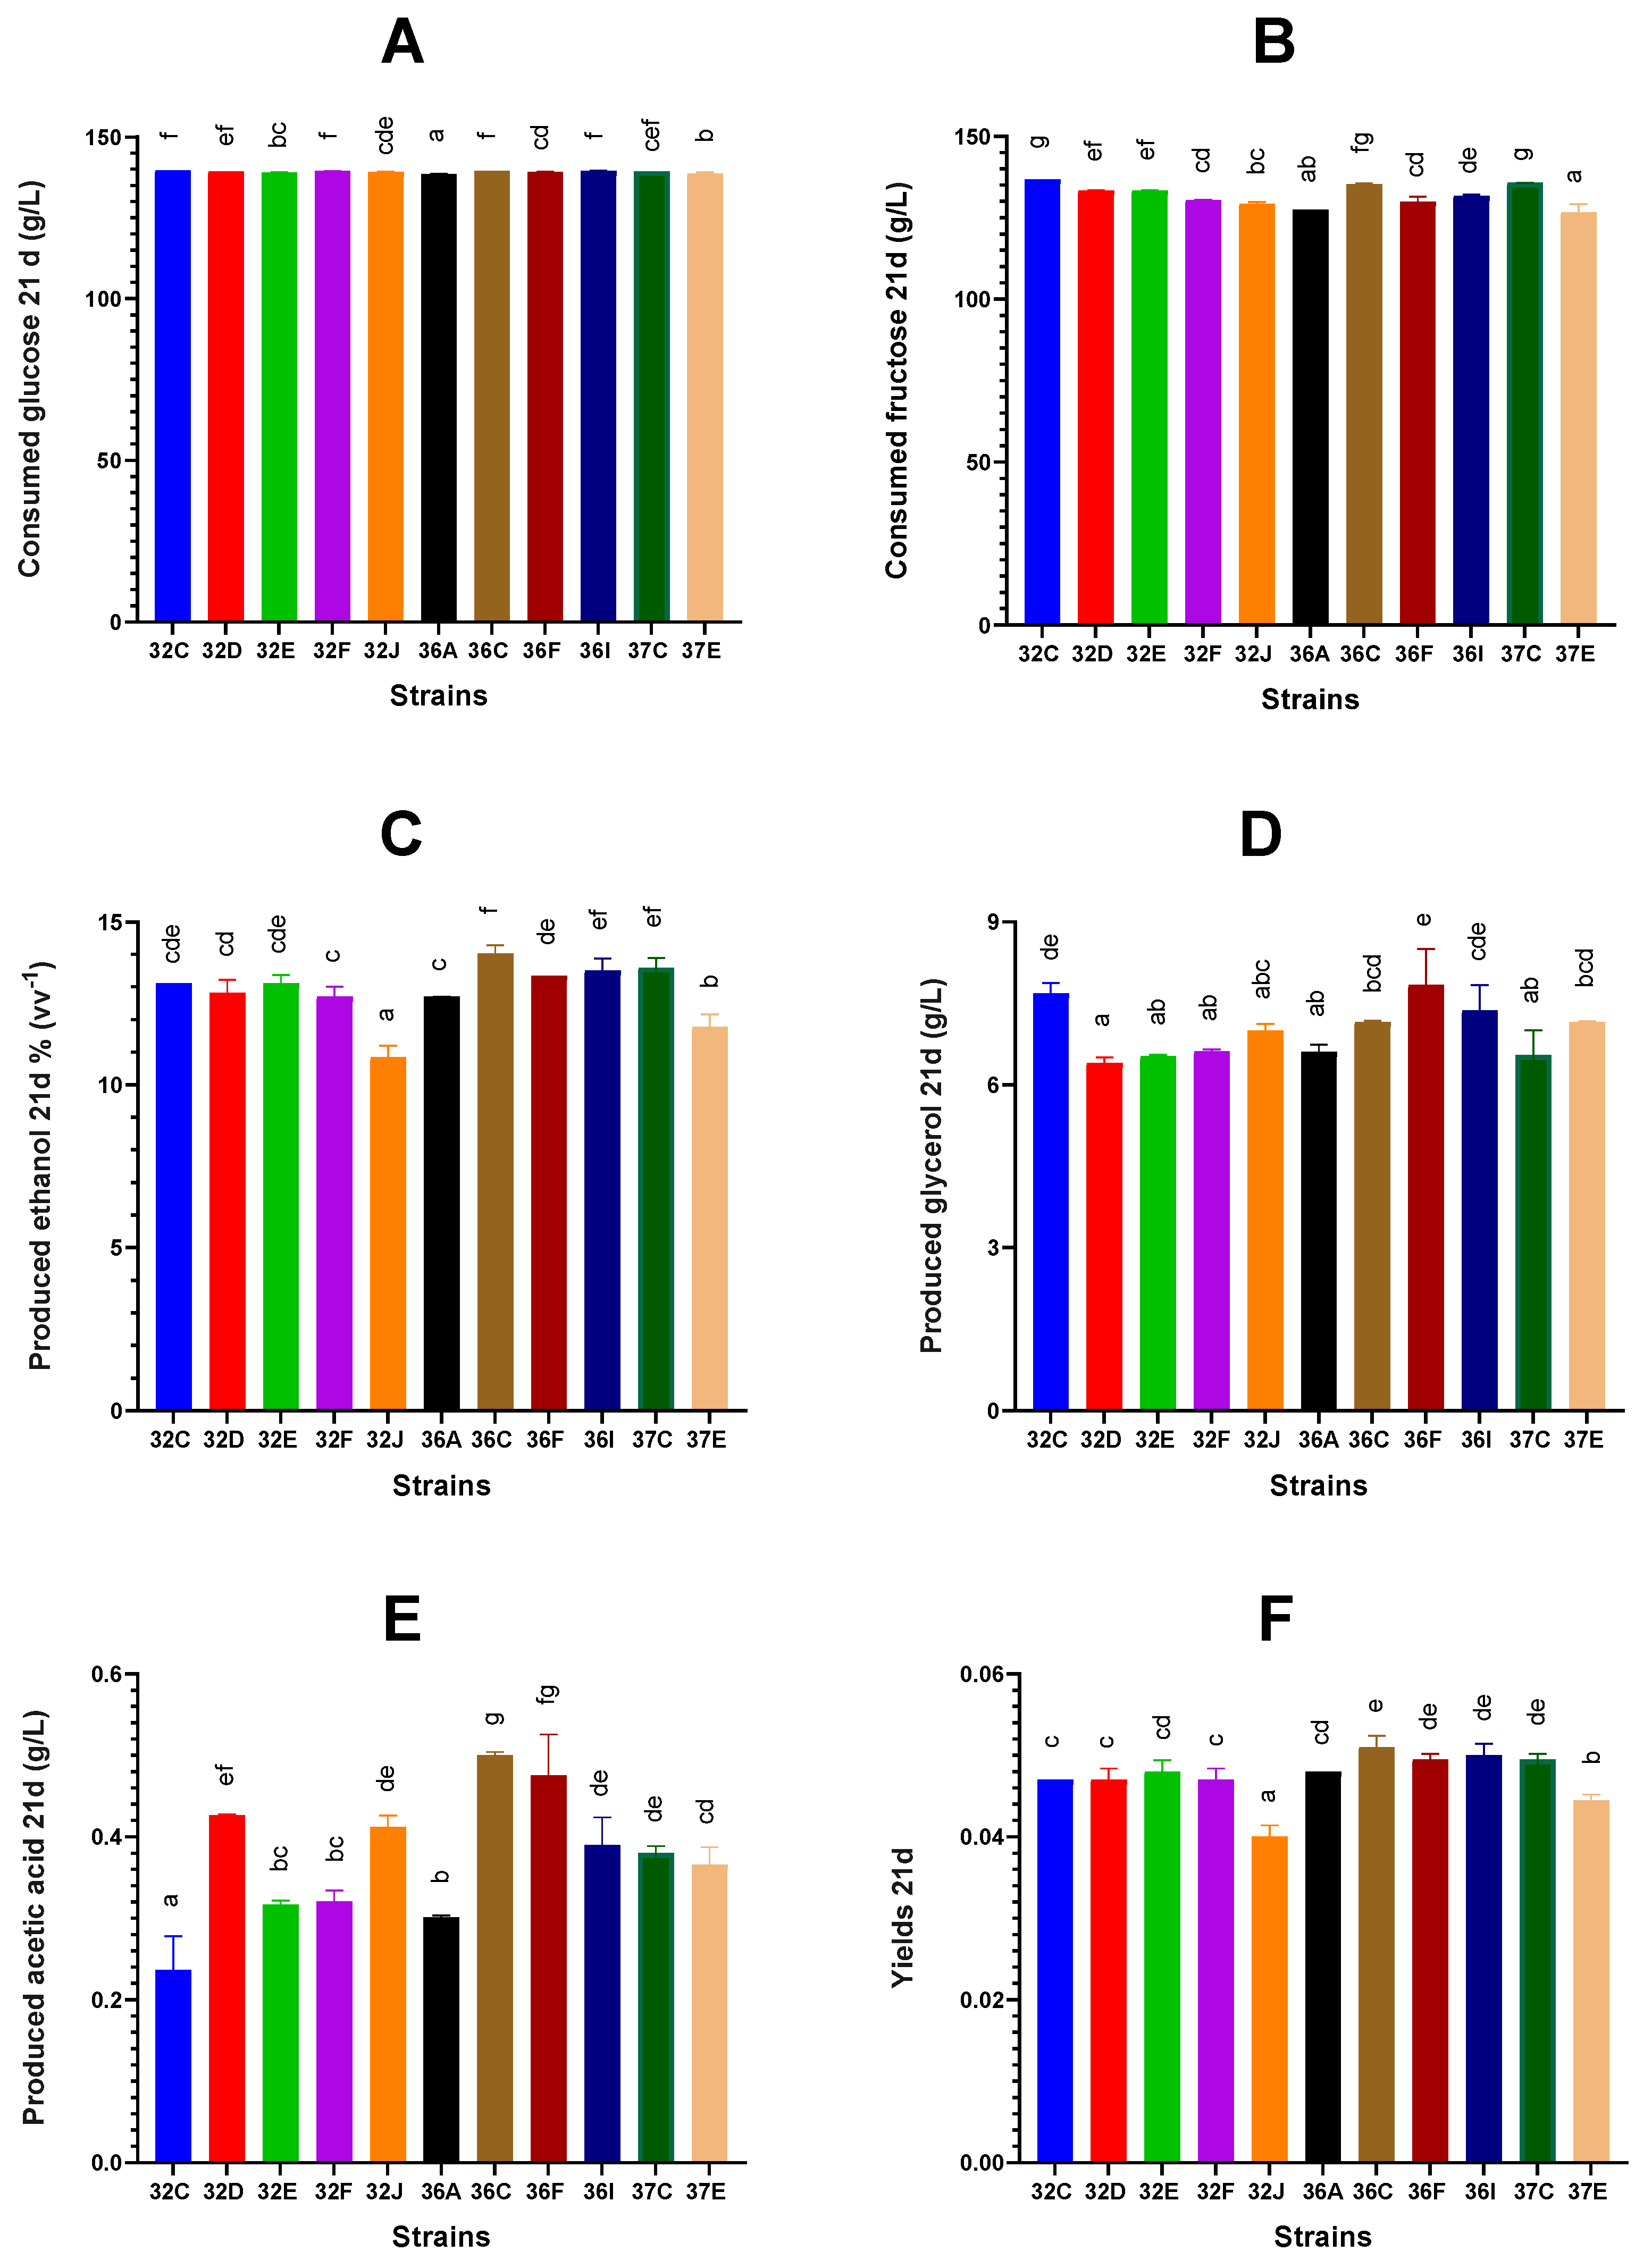
3.2. Characterization of S. cerevisiae Yeasts

The growth kinetics and fermentative characteristics of the 11 S. cerevisiae strains were tested in the same industrial Cabernet Sauvignon grape must from which they were isolated. This allowed the results to be better extrapolated to industrial fermentation than if they had been carried out in synthetic grape must.
The yeast strains showed different growth capabilities in terms of their growth kinetics, μmax and the AUC at the different growth time points. Differences in the growth kinetics of the different yeasts were observed (Figure 2A). They were related to different μmax, maximum viable cell concentrations at the end of the logarithmic growth phase, and with different behavior in the stationary and death phases (Figure 2A). The strains with higher μmax were 32C, 32D, 32I and 36J, whereas the slower ones were 37E, 37C, 32E and 36A, in ascending order. Significant differences were found between 32C and the other strains (Figure 2B). Considering the AUC values at 3, 7 and 21 days as a measure of overall growth at these time points, we observed that, despite the contemplated time points, the yeasts with significantly lower AUC values were 36A and 37E (poor growth capabilities). The strain with the highest AUC values at each time point was 32D (good growth abilities), although the differences with some other strains were not significant. Other strains, such as 32F and 36I, had the highest AUC values at 3 days but did not stand out at later time points (Figure 2C).
For the glucose and fructose consumption at the end of the experiment (21 days after inoculation), differences between strains were minimal, especially for glucose (Figure 3A,B). At this time, the strains that consumed more fructose were 32C, 37C, 36C, 32D and 32D, in decreasing order, while those that consumed significantly less were 37E and 36A (Figure 3B). The largest differences for both sugars were observed on day 3, but the differences became smaller later (Supplementary Figures S1 and S2). In the first 3 days, the most-glucose-consuming strains were 32F, 36I, 32D and 32E, in decreasing order, while the least-glucose-consuming strains were 37E, 37C, 32C and 36F (Supplementary Figure S1A). After 7 days, strains 32C, 36I, 37C, 36C and 32F had consumed the most glucose, while 37E, 36, 32E and 36A had consumed the least (Supplementary Figure S1B). At the end of the experiment (21 days), glucose consumption was similar for all the strains (Supplementary Figure S1C). Greater differences were found in fructose consumption: after 3 days, the strains that consumed the most fructose were 32C, 32F, 36F and 36I, while 37E and 32J consumed the least (Supplementary Figure S2A). On day 7, 32C remained the most-fructose-consuming strain (Supplementary Figure S2B). On day 21, 32C, 37C and 36C were the most-fructose-consuming strains, while 37E, 36A and 32J were the least-fructose-consuming strains (Supplementary Figure S2C). After 21 days of fermentation, the residual glucose concentrations varied between 0 and 1.1 g/L, while that of fructose ranged from 0 to 10.2 g/L, demonstrating the glucose preference of the majority of our S. cerevisiae strains, as previously reported by several authors [51,52]. High residual fructose concentrations increase the risk of microbial spoilage [51] as it is a substrate that supports the growth of harmful Brettanomyces bruxellensis or lactic acid bacteria.
The strains that produced the most ethanol at the end of the experiment were 36C, 37C, 36I and 36F, in decreasing order, while those that produced the least were 32J, 37E, 32F and 36A (Figure 2C). However, this order varied over time. The strains that produced the most ethanol during the first 3 days were 32C, 32D, 32E and 36F, whereas the strains that produced the least ethanol were 37E, 36C and 36I (Supplementary Figure S3A). Interestingly, 36C was the most-ethanol-producing strain at the end of the experiment (along with 37C and 36I), whereas 37E remained the least-ethanol-producing strain over time (Supplementary Figure S3B,C).
The strains producing the highest glycerol concentration at the end of the experiments were 36F, 32C and 36I, while those producing the lowest glycerol concentration were 32D, 37C, 32F and 32E (Figure 3D). Regarding their production time point, 32C and 36F were the highest producers and 32E and 32F were the lowest producers, regardless of the fermentation time point (Supplementary Figure S4A–C). Orlić et al. [53] described that the maximum glycerol release in synthetic grape must occurred in the decay phase for S. cerevisiae and Saccharomyces paradoxus. In our case, however, the maximum increase occurred after the first three days. Glycerol synthesis was the consequence of the NADH/NAD+ imbalance at the beginning of AF, when the enzymes pyruvate decarboxylase and alcohol dehydrogenase are not fully expressed and NADH cannot be re-oxidized via the alcoholic fermentation pathway. In these circumstances, NADH re-oxidation is achieved through the reduction of dihydroxyacetone-P to glycerol-P, which is ultimately dephosphorylated to glycerol [54,55]. Rodicio et al. [55] reported that differences in glycerol production between strains may be due to differences in the activity or concentration of the key enzyme triose phosphate isomerase, which catalyzes the exchange of triose phosphates.
The strains that produced more acetic acid after 21 days were 36C, 36I, 32D and 37E, while those that produced less were 32C, 32E, 32F and 36A (Figure 3E). When we considered the fermentation time point at which the strains produced the most acetic acid, strains 36C, 36I and 32D stood out as being the highest producers, while strains 32C, 32E and 32F were the lowest producers throughout fermentation (Supplementary Figure S5A–C). The differences in acetic acid production may be related to the different acetyl-CoA synthetase capacities of the strains. Thus, low activities of this enzyme caused acetate overflow [55]. Regarding yields, strain 37E produced a significantly lower yield on day 3, whereas no significant differences were found among strains 32F, 36A, 36C and 36I, nor among 32C, 32D, 32E, 32F, 32J, 36A, 36C, 36F and 37C (Supplementary Figure S6A). The differences in yield between strains increased as fermentation progressed. Significantly lower yields were recorded for strain 32J on day 7 and for strains 32J and 37E on day 21 (Supplementary Figure S6B,C).
In terms of growth and metabolic characteristics, strain 32C was one of those that produced less acetic acid, more glycerol and moderate ethanol. It also showed high fructose and glucose consumption. This strain obtained high μmax and AUC values and maintained a high viable cell concentration for up to 21 days from the start of fermentation when grown in sterile Cabernet Sauvignon grape must.

3.3. Correlation Analysis

The Spearman correlation analysis was applied to the growth and metabolic data obtained on days 3, 7 and 21. On day 3, the AUC correlated significantly with the μmax, glucose and fructose consumption and ethanol production, whereas μmax only showed a significant correlation value with AUC (Supplementary Table S1). Significant correlation values were found between glucose consumption and glycerol production but not for fructose consumption. Glycerol synthesis occurs mainly at the onset of AF when the enzymes pyruvate decarboxylase and alcohol dehydrogenase are not fully expressed [54,55]. Consistent with this, greater amounts of glycerol were produced at the onset of AF in our experiments (Supplementary Figure S5). The discrepancy in glucose/fructose utilization may be related to fructose phosphorylation activity at physiological fructose levels in vivo and may explain the preference of S. cerevisiae for this hexose [56]. Ethanol production correlated with AUC, μmax and fructose consumption, but not with glucose consumption. This may seem strange, but Karaoglan et al. [57] reported that their statistical data analysis showed that increasing or changing the amount of glucose or fructose consumed did not result in the same increase in the amount of ethanol produced. On day 7, the significant correlations were the same as on day 3, except for ethanol production, which did not correlate with the other parameters (Supplementary Table S2). At this time, the correlations between glucose and fructose consumption were significant. On day 21, significant correlations were found between μmax and glucose consumption; μmax and AUC; glucose and fructose consumption (as on day 7); fructose consumption and ethanol production (Supplementary Table S3). The correlation between fructose consumption and ethanol production was logical, as glucose was almost depleted on day 7 and, hence, ethanol was produced exclusively from residual fructose. Neither glycerol nor acetic acid production correlated with any of the other parameters at any fermentation time point. A positive correlation between μmax and both glucose depletion and ethanol production was expected because S. cerevisiae obtains energy for growth from sugar fermentation (two moles of ATP per mole of glucose) [55]. Therefore, the faster the cell growth, the higher alcohol production and glucose consumption. The correlation values between these parameters decreased as the fermentation progressed, which is a logical trend since μmax mainly affected the AUC on day 3, whereas the AUC corresponding to later time points reflected the stationary phase behavior. Although μmax should be considered as one of the main criteria for the selection of a starter for the alcoholic beverage industry, while some strains had a high μmax, they were neither the highest glucose consumers nor the highest ethanol producers.

3.4. Physico-Chemical Characteristics of the Microvinified Cabernet Sauvignon Wines

The eleven microvinifications were performed in triplicate for each yeast strain, as described in the Section 2. The wines were analyzed 2 months after bottling, at the end of the MLF, which was not the same in all the trials.
The composition in terms of physicochemical parameters is shown in Table 2, which shows that significant differences appeared in all the parameters analyzed (p-value < 0.05), except for density. The density values did not show statistically significant differences because all the wines were finished. The density of 993–992 g/L was reached 10 days after the start of fermentation, which was carried out at a temperature between 22–23 °C.
All the yeasts tested had completely consumed the sugars; the residual sugars in the wines ranged between 2.20 and 2.70 g/L, which is in line with those usually reported for wines [58]. The volatile acidity of the wines 2 months after EAF was acceptable in all the tests [59], with significant differences (p < 0.05) and the lowest values corresponding to the wines obtained in the 32E and 37E strains, with volatile acidity values close to 0.4 g/L acetic acid. The rest had acceptable values with a maximum of 0.66 g/L (strain 36C). The rejection of strain 36C was not considered a criterion as it was within the normal wine values after AF and was lower than acetic acid. In addition, although there were significant differences in the pH values, they were all sufficient to avoid subsequent microbiological problems. For the titratable acidity values obtained, the strains of profiles 32C, 32D, 32E, 36F, 37C and 37E still had values above 7 g/L (tartaric acid), which is an ideal situation, especially if they are to be used in hot climates. Wine acidity and pH affect color, flavor, degree of oxidation, etc. [60]. There were significant differences between the yeast strains in terms of alcoholic yield, with alcoholic degrees ranging from 13.2% to 14.1%. These differences are due, on the one hand, to the unavoidable heterogeneity of the raw materials used in vinifications and, on the other hand, to the different sugar/ethanol yields. 32C, 32E and 32F can be used for vintages for insufficient glycometric ripeness due to unfavorable climatic conditions, as they offer higher alcoholic yields. Finally, 32J, 36F and 36I can be used in hot regions. In fact, Ilieva et al. [14] discovered a yeast that produces higher acidity during AF.
The color-related compounds are listed in Table 3 at 2 months after the end of the MLF, together with the 11 selected yeasts. When analyzing the results obtained, significant differences in CI were found (p-value < 0.05). Yeast strains 32C, 32F, 36A and 37C were those whose values remained around 11. Conversely, the lowest CI value was found in wines produced with yeast strains 32D, 36F and 37E, which gave less colored wines (8.92–9.15). This can be explained by possible color adsorption by the cell walls of the yeast strains due to the presence of enzymes with β-glucosidase activity, which breaks the β-gluglycosidic bond between anthocyanin and sugar, releasing anthocyanins and making them more oxidizable [61,62]. In addition, a decrease in CI is related to the adsorption capacity of anthocyanins on yeast walls [63]. A low hue level indicates less oxidation [64] and is, therefore, desirable in wines. The Cabernet Sauvignon wines fermented with yeast strains 32C, 36C and 37C had the lowest Hue levels (<than 60), mainly because the red color concentration in these wines was higher (A520) compared to the yellow color (A420). The highest concentration of anthocyanins corresponded to 32C and 32F, both in terms of total anthocyanins (648–676 mg/L) and colored anthocyanins (487–494 mg/L), and yeast strains 32J and 36C also showed good behavior in relation to anthocyanins.
For color-related compounds in wines, it is important to select a yeast strain that provides a high CI level, accompanied by a high number of total anthocyanins, preferably if they are colored anthocyanins, to obtain a wine with more color that remains stable over time [65]. The yeast strains that performed the fermentation had a strong effect on polyphenols, modifying not only the polyphenol content, but also the state and stability of the polyphenolic compounds in the wine [66,67,68]. Anthocyanins occur in wines in the free form and are associated with other compounds, mainly tannin molecules. Free anthocyanins are those with more color, the reddest, but are less stable and are decolorized by SO2. Their color varies with pH. In addition, most combined anthocyanins (colored) are insensitive to discoloration and are more stable over time [69]. Yeasts contribute to the stabilization of coloring matter during the fermentation process due to their ability to synthesize carbonyl compounds, such as acetaldehyde and pyruvic acid, which can act as precursors for the formation of pyranoanthocyanins, which are more stable molecules over time, are not discolored by SO2 and promote condensation between anthocyanins and tannins [68,69]. The release of both pyruvic acid and acetaldehyde varies between yeast strains [65,68]. In the present work, yeast strain 32C provided a high CI level in the wines with a higher concentration of colored anthocyanins, which made them more stable over time. Therefore, it could be said that strain 32C was the best in terms of color parameters in the Cabernet Sauvignon variety. Table 3 shows the results obtained from the tannic composition of the wines produced with the different selected yeast strain profiles. Proanthocyanidins are responsible for bitterness and astringency. Thus, tannins impart astringency and structure through complexing with salivary proteins [70], and they also act as antioxidants. The tannin concentration of the wines obtained ranged from 2.12 to 2.53 g/L, values that correspond to wines with high tannin content due to the optimal ripening of the grapes, with alcohol levels in the wines ranging from 13.2 to 14.1 (as shown in Table 2). It should be taken into account that the temperatures reached during fermentation (22–23 °C) did not allow a similar tannin extraction concentration as that obtained at temperatures close to 28 °C, which is used in traditional vinification. The degree of alcohol obtained and the kinetics of fermentation determine the extraction of tannins from the grape skins, since the wines were devatted and pressed at the same time. Therefore, the varieties that were able to ferment faster obtained greater tannin extraction. The differences in the tannin concentration of the different wines could be caused by slight variations in the raw material or by differences in the fermentation kinetics, since ethanol must be present in the medium for tannin extraction.
Statistically significant differences (p < 0.05) were found between the wines for all the compounds analyzed (see Table 3). The highest concentrations of condensed tannins corresponded to the wines fermented with yeast strains 32C, 32F, 32J and 36I. For tannins, the performance was reversed in relation to the concentration of catechins, because at the same time as tannins are formed through the polymerization of catechins, their concentration decreases [71]. Minimal catechin concentrations contribute to the reduction of wine bitterness [70,72]. All our wines had low concentrations of catechins (0.1 g/L). The DMACH Index is a measure of the average degree of polymerization of tannins with an inverse reading [33]. The tannins with the highest degree of polymerization appeared in the wines fermented with yeast strains 32C, 32F, 36A and 36I (16.81–21.56%).
The Ethanol Index is the percentage of tannins that can combine with wine’s polysaccharides (see Table 3). It evaluates the combination of tannins and polysaccharides and is very favorable for wine quality. The wines with the most polymerized tannins were yeast strains 32C and 36I, and they also had a higher Ethanol Index (58.2–59.1), which indicates a higher proportion of tannins combined with wine polysaccharides. Possibly, the strains that contributed to a high Ethanol Index level have pronounced β-glucanase activity. This would increase the presence of wine polysaccharides during their autolysis, which originates in the cell walls of these yeast strains [73]. Blazquez Rojas et al. and Rinaldi et al. [74,75] have shown that different S. cerevisiae strains reduce the content of flavonols, total tannins and the tannins responsible for astringency in wines through influencing the chemical state of anthocyanins and tannins insofar as the greater their reactivity, the more compounds that are lost, and this reactivity decreases with their polymerization. In addition, yeasts produce polysaccharides from their cell wall during fermentation and aging on lees via autolysis processes that vary depending on the nature of the yeast strain [73,76]. These polysaccharides react with the astringent tannins through polymerizing them, reducing the astringency sensation [70] and also promoting the growth of lactic bacteria.
Regarding the parameters related to total polyphenols and condensed tannins and their quality, the wine fermented with yeast strain 32C not only gave rise to wines that better maintained their polyphenolic and tannin concentration, but also to those with the best-quality tannins, being those that were most polymerized with each other and also with polysaccharides.

3.5. Wine Volatile Compounds

Among fermentative aromas, a distinction is made between those synthesized by yeast and those released by yeast from non-volatile precursors. The former are synthesized during yeast metabolism from the nutrients present in the must and are then released into the wine. The latter are released via enzymatic hydrolysis processes through the action of yeast from the precursors present in the must in a non-volatile form because they are bound to large molecules. The latter depend mainly on the grape variety used to make the wine and are therefore part of the varietal aroma [77]. Aroma compounds give wine its typical smell. The strain of S. cerevisiae is one of the most important factors influencing the fermentative volatile composition of wine [17].
Wine aroma is one of the most important characteristics in determining wine quality and its value. Different strains of S. cerevisiae can affect wine aroma [17,74,78]. More than 1000 aroma compounds have been detected in wine, including alcohols, esters, fatty acids, aldehydes, terpenes, etc. [79]. The volatile compounds synthesized by wine yeast include higher alcohols, medium- and long-chain volatile acids, acetate esters, ethyl esters, and aldehydes, among others. The ability to form flavors depends not only on the yeast species but also on the particular strain of an individual species [80,81,82].
Yeasts and their influence on the chemical composition of wines have been demonstrated through studying fermentations which, being carried out with different S. cerevisiae strains and using the same must, show wide variability in the compounds produced [83,84,85].
The aroma composition and the results of the ANOVA analysis are presented in Table 4. As we can see, yeast had a significant effect on the concentration of the different families of volatile compounds in the wines. This effect was different according to the type of compound analyzed.
The main types of fermentation aromas synthesized by S. cerevisiae are volatile organic acids, higher alcohols, esters and, to a lesser extent, aldehydes. Ketones and aldehydes are formed either through oxidative degradation of sugars and amino acids or through oxidation of corresponding alcohols. Aldehydes are the primary source of herbaceous compounds in wine.
Moderate concentrations of higher alcohols contribute to the desirable complexity of wine aroma [86]. Due to the close relationship with yeast metabolism, the levels of higher alcohols in wine are important variables for yeast strain differentiation and can be used as a basis for selection [17]. Alcohols are produced through the degradation of carbohydrates, amino acids and lipids [87]. It appears that the yeast strains produced a significant amount of higher alcohols in the Cabernet Sauvignon wines (124–224 mg/L). Significant amounts of isoamyl alcohol (mean values of 11–33 mg/L) were produced by yeasts. The lowest level was found in yeast strain 37E, and the highest levels were found in 32E and 36F.
2,3-Butanediol originates from the reduction of acetoin and its influence on wine aroma is limited [88]. The yeast strains tested produced very low concentrations of this compound. However, 2-phenylethanol is a glycosylated aromatic precursor that is synthesized in grapes and subsequently released through either enzymatic action or acid hydrolysis [88]. Unlike the other high alcohols in wine, it is characterized by a pleasant rose petal aroma [82]. The yeast strains with the highest concentrations synthesized in wine from the Cabernet Sauvignon wine were 32C, 32D, 32F and 36A.
In terms of lactones’ concentration, yeast strains 36F and 32C produced the highest level, and this effect was statistically significant for some of the strains studied. This effect is important because γ-lactones contribute to the peach aroma in some red wines [89].
Esters were the second most abundant class in terms of the number and concentration of volatiles. Ethyl esters of fatty acids are synthesized during fermentation and their concentration depends on sugar content, fermentation temperature, yeast strain and aeration degree. Esters (including acetate esters and ethyl esters of fatty acid) are important aroma compounds that positively contribute to the desired fruit aroma characteristics of the wine. Ethyl acetate, ethyl octanoate, ethyl decanoate and ethyl decanoate can positively contribute to the sweet, floral, fruity and pleasant aroma of a wine. In addition, all microvinifications contain low levels of ethyl acetate, which, when below 15 mg/L, play a positive role in wine quality [15].
The fact that strains 32C and 32F produced the highest total ester concentration in the prepared wines is important because their total concentration is a possible indicator of fruit aroma, since there are synergistic effects between compounds of the same chemical family [89]. 2-Phenylethyl acetate, formed via the esterification between a molecule of acetic acid and 2-phenylethanol, is also interesting for the aromatic quality of red wine. 2-Phenylethyl acetate is characterized by a fruity, honey and rose aroma [89]. The microvinifications 32C, 32E, 32F and 36F contained the highest levels of esters.
The Cabernet Sauvignon wines fermented with yeast strains 32C and 32F had the highest levels of volatile acids (2.59 and 2.75 mg/L, respectively). Fatty acids are compounds that are considered unpleasant but are aromatically important because they are the basis of fruity esters. The aromatic influence of these compounds has not been extensively studied in comparison to ethyl esters, although some (hexanoic acid, octanoic acid, decanoic acid, isovaleric acid) have been identified as chemical compounds with a strong aromatic influence on wine [90,91]. The wines fermented from Cabernet Sauvignon with yeasts 32C and 32F had the highest concentration of volatile acids.
High acetaldehyde production can be a drawback not only for its aroma, but also for its irreversible binding with SO2, which leaves the wine unprotected from oxidation and contamination by other microorganisms. Yeast strains 32E, 36A and 36F produced the highest levels of acetaldehyde, which is considered a drawback. However, yeast strains 32D, 32F, 36C and 37C produced the lowest levels (Table 4).
The Cabernet Sauvignon wines fermented with yeast strains 32C and 32F had the highest concentration of acids, while those fermented with strains 36F and 32C had the highest concentration of lactones. Strain 36A gave rise to the highest alcohol concentration and strain 37E produced wines with more aldehydes.

3.6. Sensory Profile of Cabernet Sauvignon Wines

The sensory profile of the wines was determined through a comparative sensory analysis of the wines fermented with different yeast strains in order to select the Saccharomyces cerevisiae strain that could improve their organoleptic characteristics. Table 5 shows that some descriptors were significantly influenced by yeast strain, aroma intensity and quality, and red fruit and vegetable aroma. The wines with the highest sensory scores were those fermented with 32C in terms of color (intensity and quality, 8.2 points out of 10 in both cases), aroma intensity and quality (8.1 and 8.2, respectively), red fruit aroma (7.3) and vegetable aroma (1.7). In addition, the wines fermented with S. cerevisiae strain 32F received the second highest scores from the sensory panel and had a similar aroma intensity and quality (8.4 in both cases) and vegetable aroma (1.1). Wines fermented with strains 36A, 36C and 36F scored high for aroma quality, red fruit aroma and vegetable aroma. Significant differences were found in aroma intensity, while aroma quality and red fruit aromas seemed to be related to sensorially favorable compounds, such as ethyl esters and 2-phenylethanol, among others, which are related to flower and fruit descriptors. These compounds may be responsible for the differences observed in the scores for red wine fruit aromas, which is in line with what was reported by [4,87]. A lower concentration of vegetable aromas is desirable [92]. Vegetable aromas are related to the presence of methoxypyrazines, which in turn are related to grapes with a low degree of ripeness [93]. However, they have also been linked to the yeast strain used during fermentation [94]. Yeast strains can reduce the concentrations of juice and wine-derived aromatic compounds through metabolic processes and sorption on the cell wall. The presence of plant aromas resulted in significant differences among the yeasts tested (Table 5). However, no significant differences were observed for the other descriptors analyzed.
The sensory analysis revealed that the highest scoring wines were those fermented with strains 32C and 32F, based on good color quality and intensity, higher aroma intensity, aroma quality, red fruit aroma and lower vegetable aroma. Wines fermented with yeast strains 32C and 32F had the highest concentration of esters and lactones, which gave the wines a fruity character. Strains 32C and 32F are good candidates for improving the flavor complexity of commercial Cabernet Sauvignon wines and can contribute to increasing the distinctiveness of the Cabernet Sauvignon wines from this “Pago” winery.

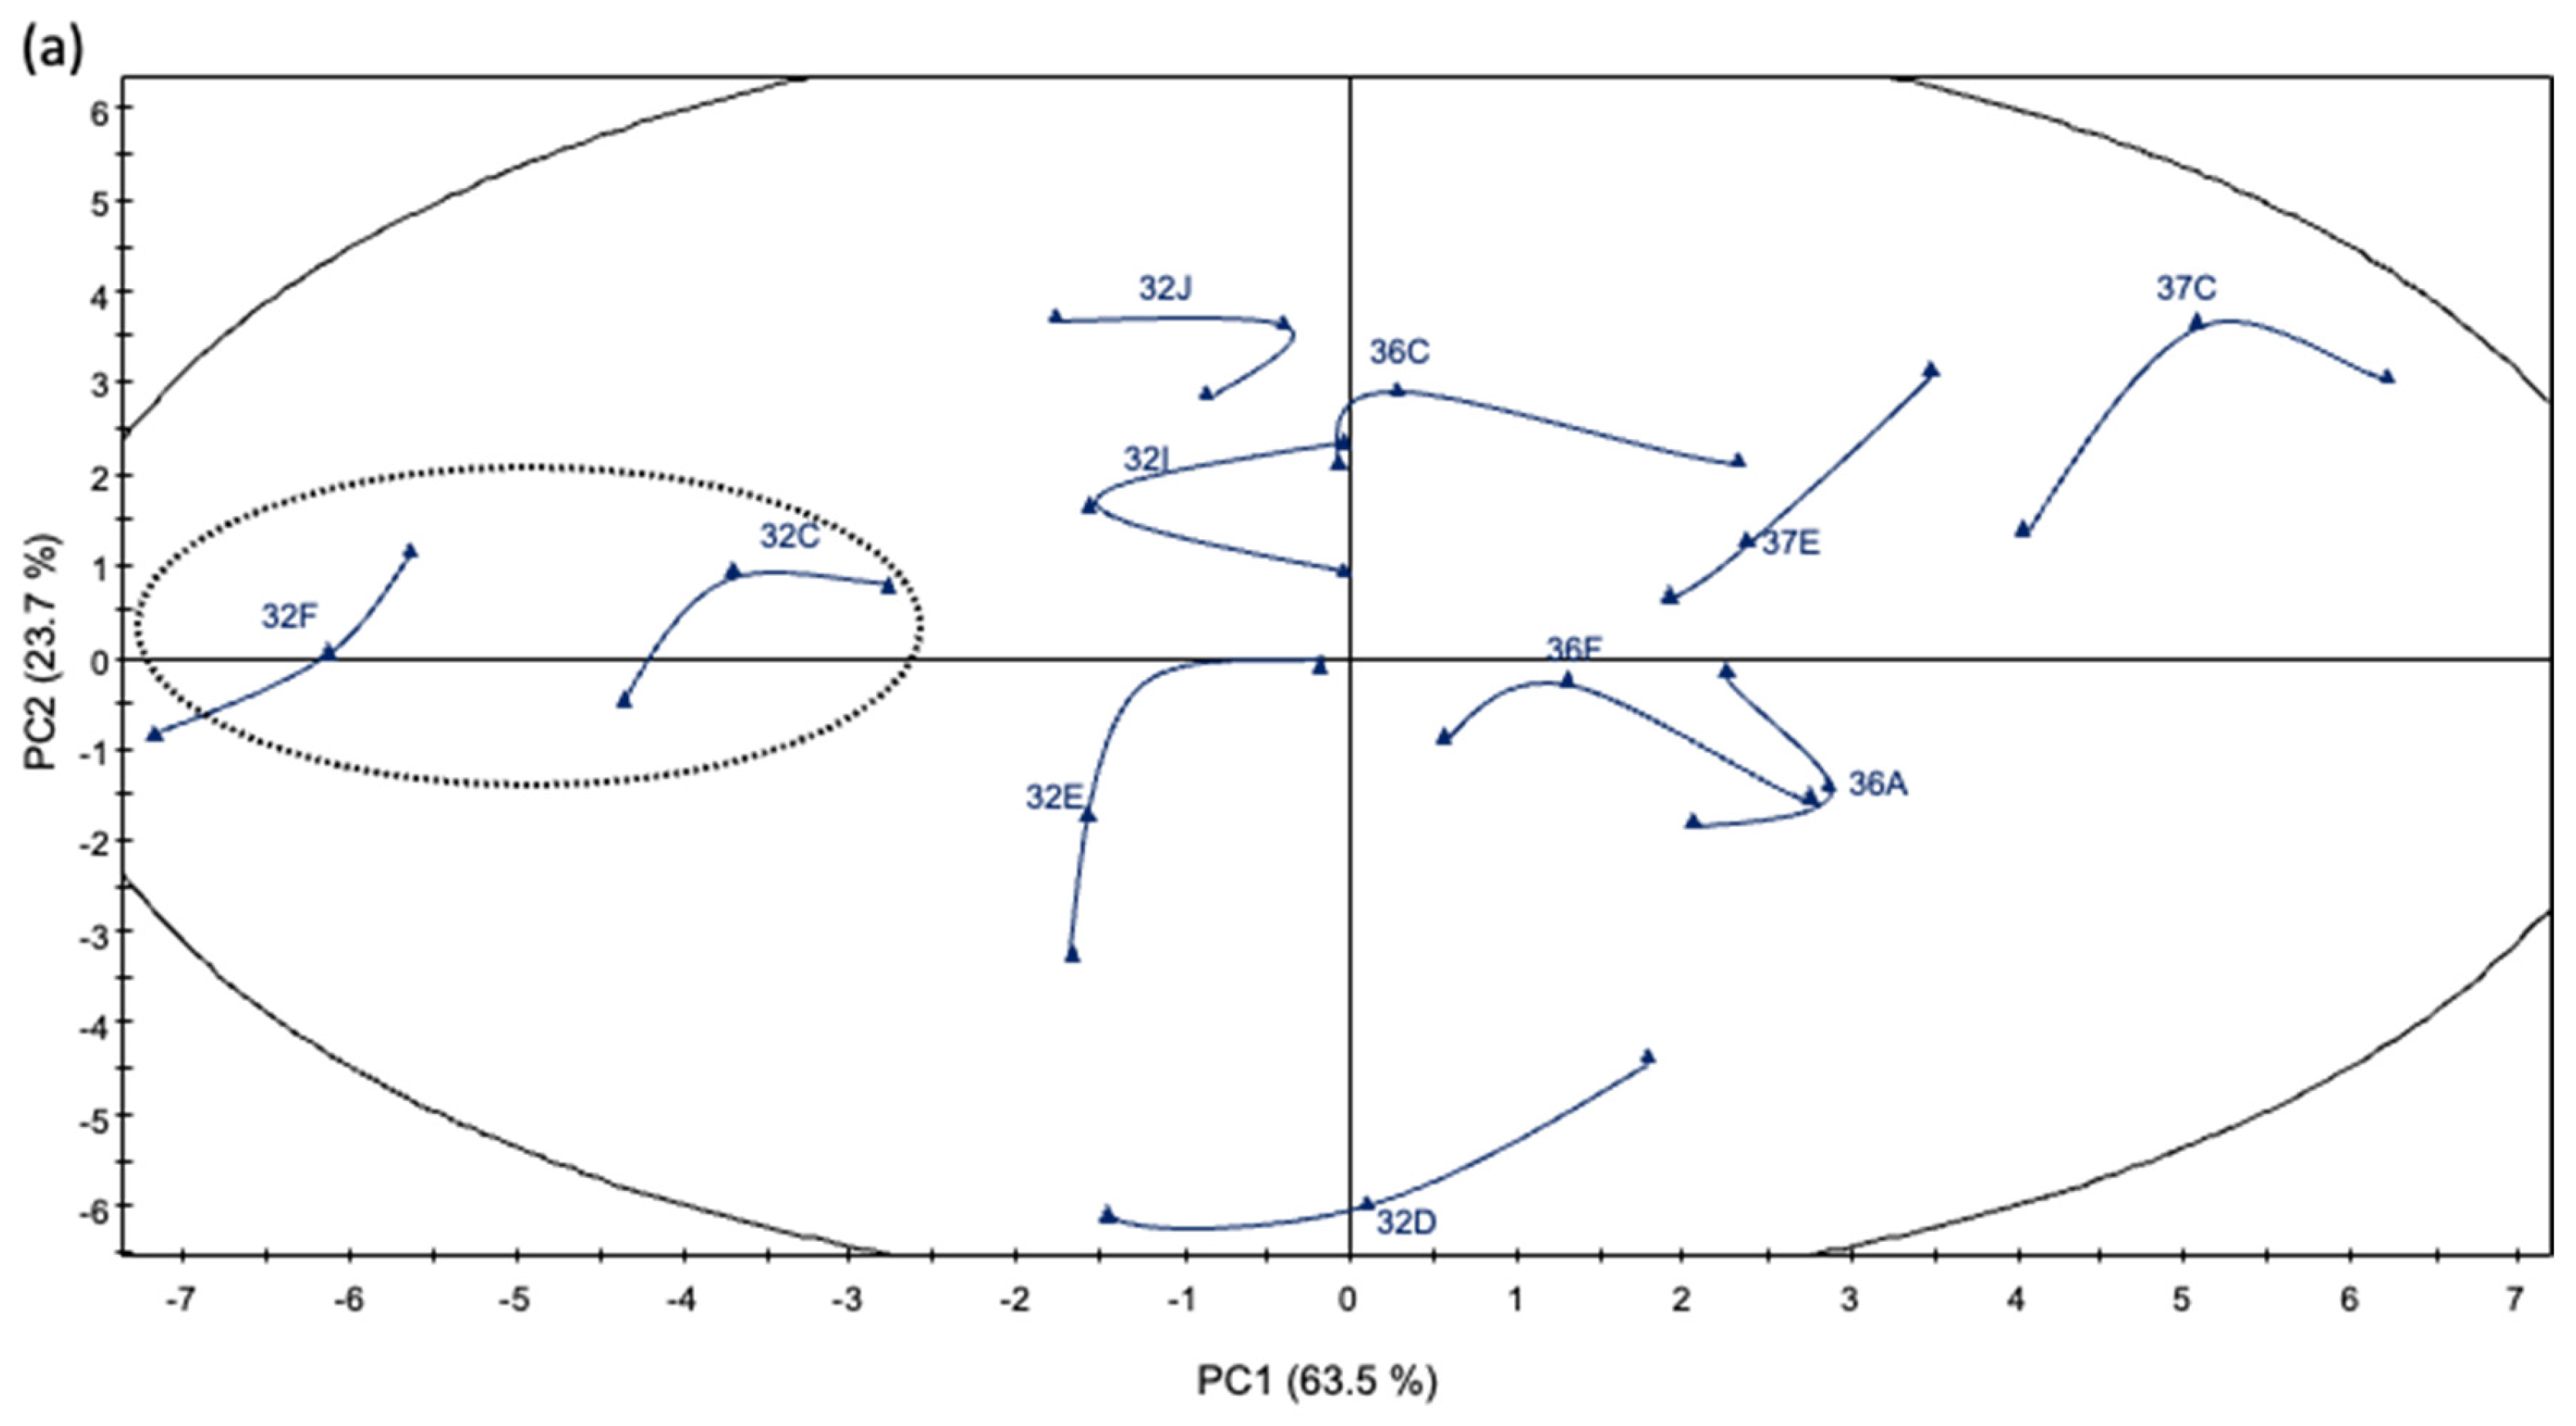
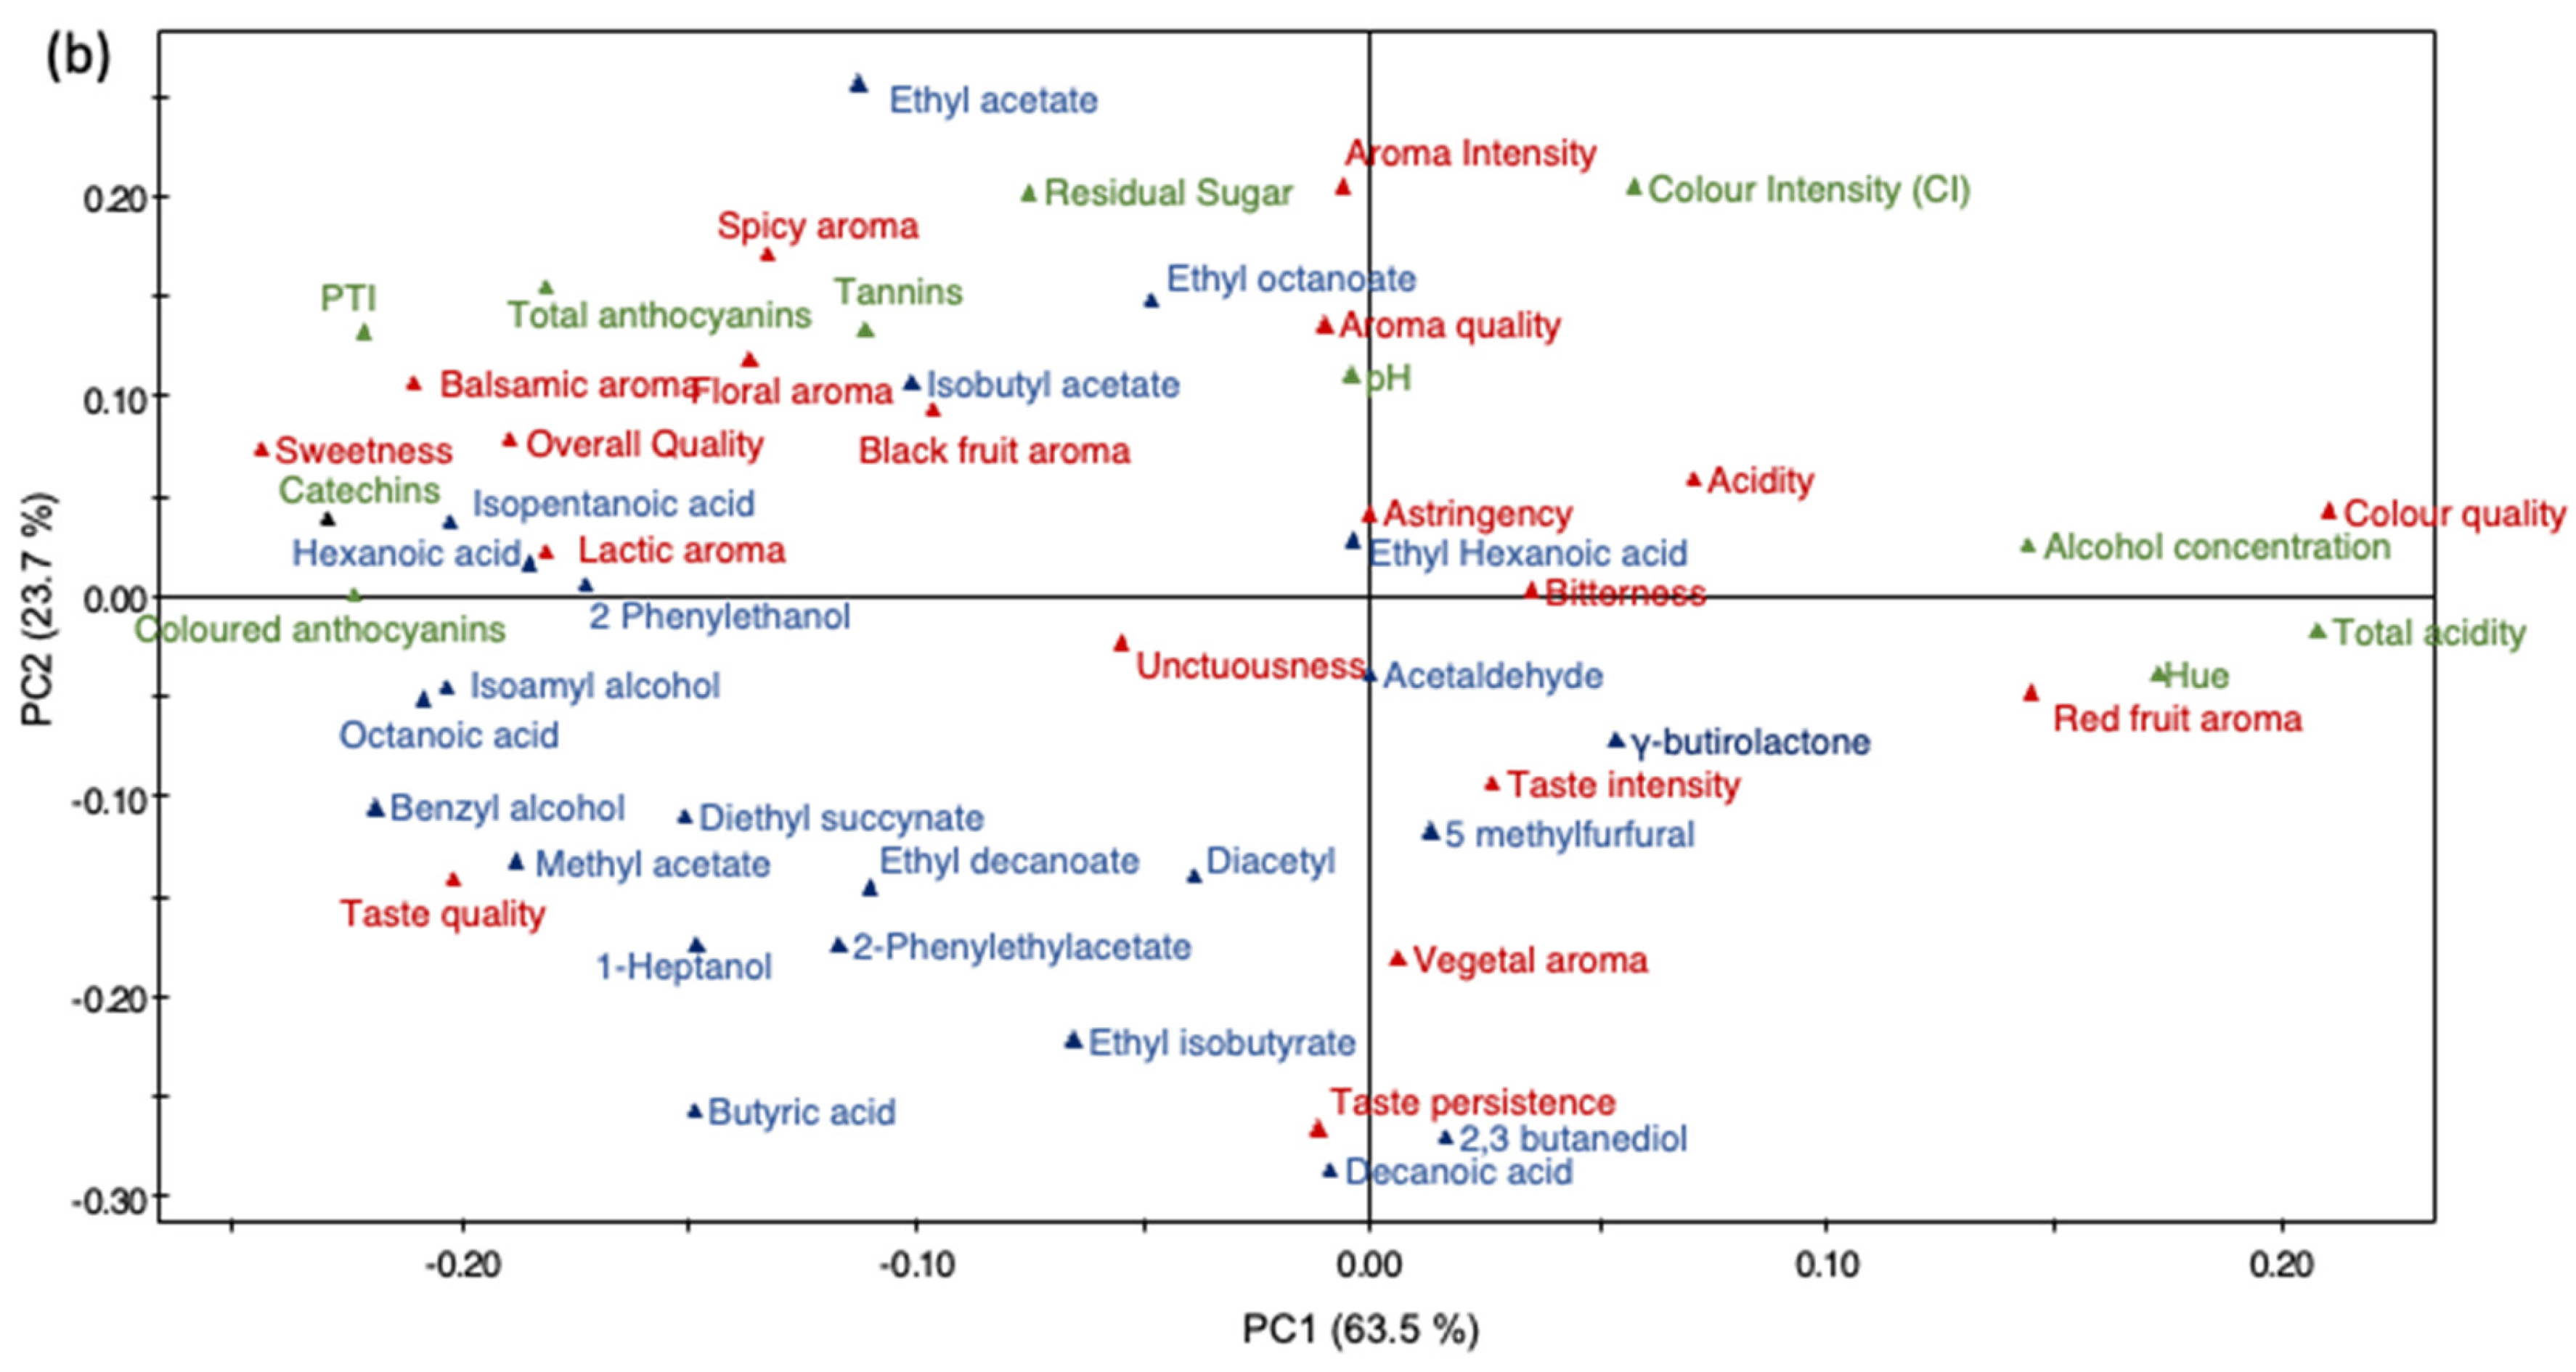
3.7. Multivariate Data Analysis of Cabernet Sauvignon Wines

To better understand the relationship between the wines fermented with the different yeast strains, a PCA was performed on the 33 wines using 64 variables (six physico-chemical parameters, 10 polyphenolic measurements, 23 volatile compound concentrations and 25 sensory parameters). The corresponding loading plots establish the relative importance of the different chemico-sensory parameters in the plane formed by PC1 and PC2 (Figure 4a). The PCA showed that the first principal components (PC1 and PC2) explained 87.3% of the total variance. The first PC (PC1 = 63.5% of variance) correlated positively with acetaldehyde, γ-butyrolactone, ethyl hexanoic acid concentration, taste intensity and red fruit aroma, and negatively with unctuousness, diacetyl and colored anthocyanins. The second PC (PC2 = 23.7% of variance) correlated positively with lactic aroma, black fruit aroma, astringency, bitterness and tannin concentration, and negatively with isoamyl alcohol and 2-phenylethanol concentration. The score plot shows the distribution of the yeast strains (Figure 4a) and represents the arrangement of the different parameters on the plane formed by PC1 and PC2. On the scores plot (Figure 4a), PC1 allowed to divide the wines into three groups. Strains 32F and 32C are on the left; 32J, 32I, 32E, 36C, 36F, 32D, 36F and 37E are in the center of the coordinates; 36A and 37C are on the right.
The corresponding load distribution of the wines fermented with yeast strains 37F and 32C are to the left of the coordinate axis, and they are perfectly separated by PC1 and are related to sweetness, overall quality, lactic aroma, colored anthocyanins, total polyphenols, catechins and isopentanoic acid concentration. Wines fermented with strains 32J, 32I, 32E, 36C, 36F, 32D, 36F and 37E are in the center of the coordinate axis and show black fruit aroma, isobutyl acetate, diacetyl, 2-phenylethyl acetate and acetaldehyde concentration, pH, aroma quality, unctuousness, color and aroma intensity. The loading graph shows that the wines fermented with yeast strain 37C are separated from the other wines based on red fruit aroma, alcohol concentration, titratable acidity, color quality and Hue (Figure 4b).

4. Conclusions

Eleven different S. cerevisiae strains were recovered from the industrial fermentation of Cabernet Sauvignon. These strains showed different growth and metabolic characteristics when grown in sterile Cabernet Sauvignon must. Strain 32C strain exhibited a high μmax and AUC and maintained a high viable cell concentration for up to 21 days from the start of fermentation. It was one of those that produced less acetic acid, more glycerol and moderate ethanol. It also showed high fructose and glucose consumption.
The results of this study showed that the differences found in the Pago Cabernet Sauvignon wines fermented with the different yeast strains were related to the S. cerevisiae strain used. The wines fermented at 32C and 32F obtained excellent values for color intensity and the Total Polyphenol Index. In addition, their anthocyanins and tannins concentration and tannin polymerization degree were high. The wines fermented with yeast strains 32C and 37F contained a high concentration of compounds related to pleasant aroma, such as esters and alcohols, especially 2-phenylethanol and γ-butyrolactone, which contribute to the quality of the aroma. In addition, both yeast strains produced low acetaldehyde (especially 32F) and diacetyl concentrations, as well as vegetal aroma, which negatively affected the wine aroma. However, strain 32F showed poorer growth ability than 32C, with a significant death phase from day 7. As positive aspects, 32F was one of the most glucose consuming, and its ability to produce ethanol and acetic acid were moderate to low. However, it left more residual fructose and produced less glycerol than 32C.
The wines scored with higher overall quality, color and taste quality were those fermented with 32C. Therefore, 32C is recommended for the fermentation of Cabernet Sauvignon wines in order to combine two objectives: the distinctiveness and fermentation control of these “Pago” wines.

Supplementary Materials

The following supporting information can be downloaded at: https://www.mdpi.com/article/10.3390/fermentation9070654/s1, Table S1: Pearson r correlation values among the Area Under Curve (AUC) values, maximum growth rate (μmax), consumed glucose and fructose and produced ethanol, glycerol, and acetic acid on day 3; Table S2: Pearson r correlation values among the Area Under Curve (AUC) values, maximum growth rate (μmax), consumed glucose and fructose and produced ethanol, glycerol, and acetic acid on day 7; Table S3: Pearson r correlation values among the Area Under Curve (AUC) values, maximum growth rate (μmax), consumed glucose and fructose and produced ethanol, glycerol, and acetic acid on day 21; Figure S1: Consumed glucose on days 3, 7 and 21; expressed as g/L Figure S2: Consumed fructose on days 3, 7 and 21, expressed as g/L; Figure S3: Ethanol produced on days 3, 7 and 21, expressed as % (vv−1); Figure S4: Produced glycerol on days 3, 7 and 21, expressed as g/L; Figure S5: Acetic acid produced on days 3, 7 and 21, expressed as g/L; Figure S6: Ethanol yields from consumed sugars (glucose +fructose) on days 3, 7 and 21.

Author Contributions

Conceptualization, V.L., I.Á., I.P. and M.J.G.-E.; methodology, C.B.,V.L., I.Á., I.P., M.J.G.-E., L.P., L.A. and S.F.; validation, C.B., L.P., I.Á., I.P. and S.F.; formal analysis, C.B., I.P. and V.L.; investigation, C.B., L.P., L.A., V.L. and M.J.G.-E.; writing—original draft preparation, I.P. and V.L.; writing—review and editing, I.P. and V.L.; visualization, I.Á. and S.F.; supervision, M.J.G.-E., I.Á., I.P., S.F. and V.L.; project administration, I.Á. and I.P.; funding acquisition, I.Á. and I.P. All authors have read and agreed to the published version of the manuscript.

Funding

This work was supported by the Instituto Valenciano de Competitividad Empresarial (IVACE) (Ref: IFIDUA/2015/13).

Institutional Review Board Statement

Not applicable.

Informed Consent Statement

Not applicable.

Data Availability Statement

Data will be provided by the authors upon request.

Acknowledgments

The authors thank the winery Chozas-Carrascal San Antonio de Requena, Spain, for providing the samples, grape musts and technical assistance.

Conflicts of Interest

The authors declare no conflict of interest.

References

  1. Belda, I.; Zarraonaindia, I.; Perisin, M.; Palacios, A.; Acedo, A. From vineyard soil to wine fermentation: Microbiome approximations to explain the “Terroir” concept. Front. Microbiol. 2017, 8, 821. [Google Scholar] [CrossRef] [Green Version]
  2. del Estado, J. Ley 6/2015 De 12 de Mayo, de Denominaciones de Origen e Indicaciones Geográficas Protegidas de Ámbito Territorial Supraautonómico. Boletín Of. Del Estado 2015, 114, 41158–41188. [Google Scholar]
  3. OIV. Resolution OIV/VITI 333/2010, Definition of Vitivinicultural “TERROIR”. 2010. Available online: https://www.oiv.int/public/medias/379/viti-2010-1-en.pdf (accessed on 10 June 2023).
  4. Ut, C.; Berbegal, C.; Lizama, V.; Polo, L.; García, M.J.; Andrés, L.; Pardo, I.; Álvarez, I. Isolation and characterisation of autochthonous Saccharomyces cerevisiae from ‘Pago’ Merlot wines of Utiel-Requena (Spain) Origin. Aust. J. Grape Wine Res. 2021, 28, 330–346. [Google Scholar] [CrossRef]
  5. Berbegal, C.; Polo, L.; Lizama, V.; Álvarez, I.; Ferrer, S.; Pardo, I.; García-Esparza, M.J. Influence of native S. cerevisiae strains on the final characteristics of “Pago” Garnacha wines from East Spain. Beverages 2023, 9, 17. [Google Scholar] [CrossRef]
  6. Ciani, M.; Comitini, F. Yeast Ecology of wine production. In Yeasts in the Production of Wine; Romano, P., Ciani, M., Fleet, G.H., Eds.; Springer: New York, NY, USA, 2019; pp. 1–42. ISBN 978-1-4939-9782-4. [Google Scholar]
  7. Mas, A.; Guillamón, J.M.; Beltran, G. Editorial: Non-Conventional Yeast in the Wine industry. Front. Microbiol. 2016, 7, 1494. [Google Scholar] [CrossRef] [Green Version]
  8. Comitini, F.; Gobbi, M.; Domizio, P.; Romani, C.; Lencioni, L.; Mannazzu, I.; Ciani, M. Selected non-Saccharomyces wine yeasts in controlled multistarter fermentations with Saccharomyces cerevisiae. Food Microbiol. 2011, 28, 873–882. [Google Scholar] [CrossRef] [PubMed]
  9. Holt, H.; Cozzolino, D.; McCarthy, J.; Abrahamse, C.; Holt, S.; Solomon, M.; Smith, P.; Chambers, P.J.; Curtin, C. Influence of yeast strain on Shiraz wine quality indicators. Int. J. Food Microbiol. 2013, 165, 302–311. [Google Scholar] [CrossRef] [PubMed]
  10. Morata, A.; Benito, S.; Loira, I.; Palomero, F.; González, M.C.; Suárez-Lepe, J.A. Formation of pyranoanthocyanins by Schizosaccharomyces pombe during the fermentation of red must. Int. J. Food Microbiol. 2012, 159, 47–53. [Google Scholar] [CrossRef]
  11. Ilieva, F.; Petrov, K.; Veličkovska, S.K.; Gunova, N.; Dimovska, V.; Rocha, J.M.F.; Esatbeyoglu, T. Influence of autochthonous and commercial yeast strains on fermentation and quality of wines produced from Vranec and Cabernet Sauvignon grape varieties from Tikveš Wine-Growing Region, Republic of North Macedonia. Appl. Sci. 2021, 11, 6135. [Google Scholar] [CrossRef]
  12. Álvarez-Pérez, J.M.; Campo, E.; San-Juan, F.; Coque, J.J.R.; Ferreira, V.; Hernández-Orte, P. Sensory and chemical characterisation of the aroma of Prieto Picudo rosé wines: The differential role of autochthonous yeast strains on aroma profiles. Food Chem. 2012, 133, 284–292. [Google Scholar] [CrossRef]
  13. Chambers, P.J.; Pretorius, I.S. Fermenting Knowledge: The History of Winemaking, Science and Yeast Research. EMBO Rep. 2010, 11, 914–920. [Google Scholar] [CrossRef] [Green Version]
  14. Ilieva, F.; Kostadinović Veličkovska, S.; Dimovska, V.; Mirhosseini, H.; Spasov, H. Selection of 80 newly isolated autochthonous yeast strains from the Tikveš region of Macedonia and their impact on the quality of red wines produced from Vranec and Cabernet Sauvignon grape varieties. Food Chem. 2017, 216, 309–315. [Google Scholar] [CrossRef]
  15. Nikolaou, E.; Soufleros, E.H.; Bouloumpasi, E.; Tzanetakis, N. Selection of indigenous Saccharomyces cerevisiae strains according to their oenological characteristics and vinification results. Food Microbiol. 2006, 23, 205–211. [Google Scholar] [CrossRef] [PubMed]
  16. Settanni, L.; Sannino, C.; Francesca, N.; Guarcello, R.; Moschetti, G. Yeast ecology of vineyards within Marsala wine area (western sicily) in two consecutive vintages and selection of autochthonous Saccharomyces cerevisiae strains. J. Biosci. Bioeng. 2012, 114, 606–614. [Google Scholar] [CrossRef] [PubMed] [Green Version]
  17. Liang, H.Y.; Chen, J.Y.; Reeves, M.; Han, B.Z. Aromatic and sensorial profiles of young Cabernet Sauvignon wines fermented by different Chinese autochthonous Saccharomyces cerevisiae Strains. Food Res. Int. 2013, 51, 855–865. [Google Scholar] [CrossRef]
  18. Liu, P.T.; Lu, L.; Duan, C.Q.; Yan, G.L. The contribution of indigenous non-Saccharomyces wine yeast to improved aromatic quality of Cabernet Sauvignon wines by spontaneous fermentation. LWT 2016, 71, 356–363. [Google Scholar] [CrossRef]
  19. Maturano, Y.P.; Mestre, M.V.; Esteve-Zarzoso, B.; Nally, M.C.; Lerena, M.C.; Toro, M.E.; Vazquez, F.; Combina, M. Yeast population dynamics during prefermentative cold soak of Cabernet Sauvignon and Malbec wines. Int. J. Food Microbiol. 2015, 199, 23–32. [Google Scholar] [CrossRef]
  20. Lopes, C.A.; Rodríguez, M.E.; Sangorrín, M.; Querol, A.; Caballero, A.C. Patagonian Wines: The selection of an indigenous yeast starter. J. Ind. Microbiol. Biotechnol. 2007, 34, 539–546. [Google Scholar] [CrossRef]
  21. Tufariello, M.; Maiorano, G.; Rampino, P.; Spano, G.; Grieco, F.; Perrotta, C.; Capozzi, V. Selection of an autochthonous yeast starter culture for industrial production of Primitivo “Gioia Del Colle” PDO/DOC in Apulia (Southern Italy). LWT 2019, 99, 188–196. [Google Scholar] [CrossRef]
  22. Esteve-Zarzoso, B.; Belloch, C.; Uruburu, F.; Querol, A. Identification of yeasts by RFLP analysis of the 5.8S rRNA gene and the two ribosomal internal transcribed spacers. Int. J. Syst. Bacteriol. 1999, 49, 329–337. [Google Scholar] [CrossRef] [Green Version]
  23. Querol, A.; Barrio, E.; Ramón, D. A comparative study of different methods of yeast strain characterization. Syst. Appl. Microbiol. 1992, 15, 439–446. [Google Scholar] [CrossRef]
  24. Lucio, O. Acidificación Biológica de Vinos de pH Elevado Mediante la Utilización de Bacterias Lácticas. PhD. Thesis, Universitat de València, Valencia, Spain, 2014. [Google Scholar]
  25. Frayne, R.F. Direct analysis of the major organic components in grape must and wine using high performance liquid chromatography. Am. J. Enol. Vitic. 1986, 37, 281–287. [Google Scholar] [CrossRef]
  26. Kean, C.E.; Marsh, G. Determination of organic acids chromatography several times as sensitive a s standard method in detecting acids in wine, juices. Calif. Agrigulture Novemb. 1951, 5, 3. [Google Scholar]
  27. OIV. Compendium of Internationals Methods of Wine and Must Analysis. In Organisation Internationale de la Vigne et du Vin (OIV); OIV: Paris, France, 2003. [Google Scholar]
  28. Blouin, J. Techniques d’analyses Des Moûts et Des Vins; Dujardin-Salleron: Paris, France, 1992; pp. 199–201. [Google Scholar]
  29. Glories, Y. La couleur des vins rouges. 2e partie: Mesure, origine et interprétation. OENO One 1984, 18, 253. [Google Scholar] [CrossRef]
  30. Ribéreau-Gayon, P.; Stonestreet, E. Le dosage des anthocyanes dans le vin rouge. Bull. De La Société Chim. 1965, 9, 119–142. [Google Scholar]
  31. Sun, B.; Ricardo-da-Silva, J.M.; Spranger, I. Critical factors of vanillin assay for catechins and proanthocyanidins. J. Agric. Food Chem. 1998, 46, 4267–4274. [Google Scholar] [CrossRef]
  32. Ribéreau-Gayon, P.; Stonestreet, E. Le dosage des tannins du vin rouge et la détermination de leur structure. Chim. Anal. 1966, 48, 188–196. [Google Scholar]
  33. Vivas, N.; Glories, Y.; Lagune, L.; Cédric, S.; Augustin, M. Estimation du degré de polymérisation des procyanidines du raisin et du vin par la méthode au ρ-dimethylaminocinnamaldéhyde. OENO One 1994, 28, 319. [Google Scholar] [CrossRef]
  34. Ortega, C.; López, R.; Cacho, J.; Ferreira, V. Fast analysis of important wine volatile compounds development and validation of a new method based on gas chromatographic-flame ionisation detection analysis of dichloromethane microextracts. J. Chromatogr. A 2001, 923, 205–214. [Google Scholar] [CrossRef]
  35. Hernández-Orte, P.; Cersosimo, M.; Loscos, N.; Cacho, J.; Garcia-Moruno, E.; Ferreira, V. The development of varietal aroma from non-floral grapes by yeasts of different genera. Food Chem. 2008, 107, 1064–1077. [Google Scholar] [CrossRef]
  36. ISO 8586:2012; Sensory Analysis-General Guidelines for the Selection, Training and Monitoring of Selected Assessors and Expert Sensory Assessors. International Organization for Standardization (ISO): Geneva, Switzerland, 2012.
  37. ISO 4120:2004; Sensory Analysis-Methodology-Triangle Test. International Organization for Standardization (ISO): Geneva, Switzerland, 2004.
  38. ISO 8589:2007; Sensory Analysis-General Guidance for the Design of Test Rooms. International Organization for Standardization (ISO): Geneva, Switzerland, 2007.
  39. ISO 3591:1977; Sensory Analysis-Apparatus—Wine-Tasting Glass. International Organization for Standardization (ISO): Geneva, Switzerland, 1977.
  40. NF ISO 11035; Analyse Sensorielle. Recherche et Sélection de Descripteurs Pour l’élaboration Dun Profil Sensoriel, Par Approche Multidimensionnelle. Association Française de normalisation: Paris, France, 1995.
  41. Martini, A.; Ciani, M.; Scorzetti, G. Direct enumeration and isolation of wine yeasts from grape surfaces. Am. J. Enol. Vitic. 1996, 47, 435. [Google Scholar] [CrossRef]
  42. Mortimer, R.; Polsinelli, M. On the origins of wine yeast. Res. Microbiol. 1999, 150, 199–204. [Google Scholar] [CrossRef] [PubMed]
  43. Albertin, W.; Setati, M.E.; Miot-Sertier, C.; Mostert, T.T.; Colonna-Ceccaldi, B.; Coulon, J.; Girard, P.; Moine, V.; Pillet, M.; Salin, F.; et al. Hanseniaspora Uvarum from winemaking environments show spatial and temporal genetic clustering. Front. Microbiol. 2016, 6, 1569. [Google Scholar] [CrossRef] [PubMed]
  44. Combina, M.; Elía, A.; Mercado, L.; Catania, C.; Ganga, A.; Martinez, C. Dynamics of indigenous yeast populations during spontaneous fermentation of wines from Mendoza, Argentina. Int. J. Food Microbiol. 2005, 99, 237–243. [Google Scholar] [CrossRef]
  45. Zara, S.; Mannazzu, I. Detection, quantification, and identification of yeast in winemaking. In Yeasts in the Production of Wine; Springer: New York, NY, USA, 2019; pp. 81–115. [Google Scholar]
  46. Granchi, L.; Ganucci, D.; Buscioni, G.; Mangani, S.; Guerrini, S. The biodiversity of Saccharomyces cerevisiae in spontaneous wine fermentation: The occurrence and persistence of winery-strains. Fermentation 2019, 5, 86. [Google Scholar] [CrossRef] [Green Version]
  47. Sabate, J.; Cano, J.; Querol, A.; Guillamón, J.M. Diversity of Saccharomyces strains in wine fermentations: Analysis for two consecutive years. Lett. Appl. Microbiol. 1998, 26, 452–455. [Google Scholar] [CrossRef] [Green Version]
  48. Mercado, L.; Sturm, M.E.; Rojo, M.C.; Ciklic, I.; Martínez, C.; Combina, M. Biodiversity of Saccharomyces cerevisiae populations in Malbec vineyards from the “Zona Alta Del Río Mendoza” Region in Argentina. Int. J. Food Microbiol. 2011, 151, 319–326. [Google Scholar] [CrossRef]
  49. Schuller, D.; Casal, M. The genetic structure of fermentative vineyard-associated Saccharomyces cerevisiae populations revealed by microsatellite analysis. Antonie Van Leeuwenhoek 2007, 91, 137–150. [Google Scholar] [CrossRef] [Green Version]
  50. Ribéreau-Gayon, J.; Dubordieu, D.; Donèche, B.; Lonvaud, A. Handbook of Enology. The Microbiology of Wine and Vinifications; John Wiley & Sons Ltd.: Chichester, UK, 2000; Volume 1. [Google Scholar]
  51. Berthels, N.J.; Cordero Otero, R.R.; Bauer, F.F.; Thevelein, J.M.; Pretorius, I.S. Discrepancy in glucose and fructose utilisation during fermentation by Saccharomyces cerevisiae wine yeast strains. FEMS Yeast Res. 2004, 4, 683–689. [Google Scholar] [CrossRef] [Green Version]
  52. Tronchoni, J.; Gamero, A.; Arroyo-López, F.N.; Barrio, E.; Querol, A. Differences in the glucose and fructose consumption profiles in diverse Saccharomyces wine species and their hybrids during grape juice fermentation. Int. J. Food Microbiol. 2009, 134, 237–243. [Google Scholar] [CrossRef] [Green Version]
  53. Orlić, S.; Arroyo-López, F.N.; Huić-Babić, K.; Lucilla, I.; Querol, A.; Barrio, E.A. Comparative study of the wine fermentation performance of Saccharomyces paradoxus under different nitrogen concentrations and glucose/fructose ratios. J. Appl. Microbiol. 2010, 108, 73–80. [Google Scholar] [CrossRef] [Green Version]
  54. Goold, H.D.; Kroukamp, H.; Williams, T.C.; Paulsen, I.T.; Varela, C.; Pretorius, I.S. Yeast’s balancing act between ethanol and glycerol production in low-alcohol wines. Microb. Biotechnol. 2017, 10, 264–278. [Google Scholar] [CrossRef]
  55. Rodicio, R.; Heinisch, J.J. Sugar metabolism in yeasts. In Biology of Microorganisms on Grapes, in Must and in Wine; König, H., Unden, G., Frölich, J., Eds.; Springer International Publishing AG: Cham, Switzerland, 2017; pp. 189–213. ISBN 978-3-319-60020-8. [Google Scholar]
  56. Berthels, N.J.; Cordero Otero, R.R.; Bauer, F.F.; Pretorius, I.S.; Thevelein, J.M. Correlation between glucose/fructose discrepancy and hexokinase kinetic properties in different Saccharomyces cerevisiae wine yeast strains. Appl. Microbiol. Biotechnol. 2008, 77, 1083–1091. [Google Scholar] [CrossRef] [PubMed]
  57. Karaoglan, H.A.; Ozcelik, F.; Musatti, A.; Rollini, M. Mild pretreatments to increase fructose consumption in Saccharomyces cerevisiae wine yeast strains. Foods 2021, 10, 1129. [Google Scholar] [CrossRef] [PubMed]
  58. Figueiredo-González, M.; Cancho-Grande, B.; Simal-Gándara, J. Effects on colour and phenolic composition of sugar concentration processes in dried-on- or dried-off-vine grapes and their aged or not natural sweet wines. Trends Food Sci. Technol. 2013, 31, 36–54. [Google Scholar] [CrossRef]
  59. Vigentini, I.; De Lorenzis, G.; Fabrizio, V.; Valdetara, F.; Faccincani, M.; Panont, C.A.; Picozzi, C.; Imazio, S.; Failla, O.; Foschino, R. The vintage effect overcomes the terroir effect: A three year survey on the wine yeast biodiversity in Franciacorta and Oltrepò Pavese, two northern Italian vine-growing areas. Microbiology 2015, 161, 362–373. [Google Scholar] [CrossRef] [PubMed] [Green Version]
  60. Gambuti, A.; Picariello, L.; Forino, M.; Errichiello, F.; Guerriero, A.; Moio, L. How the management of ph during winemaking affects acetaldehyde, polymeric pigments and color evolution of red wine. Appl. Sci. 2022, 12, 2555. [Google Scholar] [CrossRef]
  61. Morata, A.; Gómez-Cordovés, M.C.; Suberviola, J.; Bartolomé, B.; Colomo, B.; Suárez, J.A. Adsorption of anthocyanins by yeast cell walls during the fermentation of red wines. J. Agric. Food Chem. 2003, 51, 4084–4088. [Google Scholar] [CrossRef]
  62. Hernández, L.F.; Espinosa, J.C.; Fernández-González, M.; Briones, A. Beta-Glucosidase activity in a Saccharomyces cerevisiae wine strain. Int. J. Food Microbiol. 2003, 80, 171–176. [Google Scholar] [CrossRef]
  63. Echeverrigaray, S.; Scariot, F.J.; Menegotto, M.; Delamare, A.P.L. Anthocyanin adsorption by Saccharomyces cerevisiae during wine fermentation is associated to the loss of yeast cell wall/membrane integrity. Int. J. Food Microbiol. 2020, 314, 108383. [Google Scholar] [CrossRef]
  64. Sims, C.A.; Morris, J.R. A Comparison of the color components and color stability of red wine from Noble and Cabernet Sauvignon at various pH levels. Am. J. Enol. Vitic. 1985, 36, 181–184. [Google Scholar] [CrossRef]
  65. Morata, A.; Loira, I.; Heras, J.M.; Callejo, M.J.; Tesfaye, W.; González, C.; Suárez-Lepe, J.A. Yeast influence on the formation of stable pigments in red winemaking. Food Chem. 2016, 197, 686–691. [Google Scholar] [CrossRef] [PubMed]
  66. Minnaar, P.P.; du Plessis, H.W.; Paulsen, V.; Ntushelo, N.; Jolly, N.P.; du Toit, M. Saccharomyces cerevisiae, Non-Saccharomyces yeasts and lactic acid bacteria in sequential fermentations: Effect on phenolics and sensory attributes of South African Syrah wines. South Afr. J. Enol. Vitic. 2017, 38, 237–244. [Google Scholar] [CrossRef] [Green Version]
  67. Morata, A.; Gómez-Cordovés, M.C.; Colomo, B.; Suárez, J.A. Cell wall anthocyanin adsorption by different Saccharomyces strains during the fermentation of Vitis vinifera L. Cv Graciano grapes. Eur. Food Res. Technol. 2005, 220, 341–346. [Google Scholar] [CrossRef]
  68. Bautista-Ortín, A.B.; Romero-Cascales, I.; Fernández-Fernández, J.I.; López-Roca, J.M.; Gómez-Plaza, E. Influence of the yeast strain on Monastrell wine colour. Innov. Food Sci. Emerg. Technol. 2007, 8, 322–328. [Google Scholar] [CrossRef]
  69. Caboulet, D.; Ducasse, M.A.; Roy, A.; Dagan, L.; Fauveau, C.; Pellerin, P.; Schneider, R. The influence of yeast strains on the phenolic and aromatic qualities of red wines. Wine Vitic. J. 2012, 27, 35–42. [Google Scholar]
  70. Vidal, S.; Francis, L.; Guyot, S.; Marnet, N.; Kwiatkowski, M.; Gawel, R.; Cheynier, V.; Waters, E.J. The mouth-feel properties of grape and apple proanthocyanidins in a wine-like medium. J. Sci. Food Agric. 2003, 83, 564–573. [Google Scholar] [CrossRef]
  71. De Freitas, V.A.P.; Glories, Y.; Monique, A. Developmental changes of procyanidins in grapes of red Vitis vinifera varieties and their composition in respective wines. Am. J. Enol. Vitic. 2000, 51, 397–403. [Google Scholar] [CrossRef]
  72. Sacchi, K.L.; Bisson, L.F.; Adams, D.O. A review of the effect of winemaking techniques on phenolic extraction in red wines. Am. J. Enol. Vitic. 2005, 56, 197–206. [Google Scholar] [CrossRef]
  73. del Barrio-Galán, R.; Medel-Marabolí, M.; Peña-Neira, Á. Effect of different aging techniques on the polysaccharide and phenolic composition and sensory characteristics of Syrah red wines fermented using different yeast strains. Food Chem. 2015, 179, 116–126. [Google Scholar] [CrossRef]
  74. Blazquez Rojas, I.; Smith, P.A.; Bartowsky, E.J. Influence of choice of yeasts on volatile fermentation-derived compounds, colour and phenolics composition in Cabernet Sauvignon wine. World J. Microbiol. Biotechnol. 2012, 28, 3311–3321. [Google Scholar] [CrossRef]
  75. Rinaldi, A.; Blaiotta, G.; Aponte, M.; Moio, L. Effect of yeast strain and some nutritional factors on tannin composition and potential astringency of model wines. Food Microbiol. 2016, 53, 128–134. [Google Scholar] [CrossRef] [PubMed]
  76. Gonzalez-Ramos, D.; Cebollero, E.; Gonzalez, R. A recombinant Saccharomyces cerevisiae strain overproducing mannoproteins stabilizes wine against protein haze. Appl. Environ. Microbiol. 2008, 74, 5533–5540. [Google Scholar] [CrossRef] [Green Version]
  77. Slingsby, R.W.; Kepner, R.E.; Muller, C.J.; Webb, A.D. Some volatile components of Vitis vinifera variety Cabernet Sauvignon wine. Am. J. Enol. Vitic. 1980, 31, 360–363. [Google Scholar] [CrossRef]
  78. Patel, S.; Shibamoto, T. Effect of 20 different yeast strains on the production of volatile components in symphony wine. J. Food Compos. Anal. 2003, 16, 469–476. [Google Scholar] [CrossRef]
  79. Bonino, M.; Schellino, R.; Rizzi, C.; Aigotti, R.; Delfini, C.; Baiocchi, C. Aroma compounds of an Italian wine (Ruché) by HS–SPME analysis coupled with GC–ITMS. Food Chem. 2003, 80, 125–133. [Google Scholar] [CrossRef]
  80. Callejon, R.M.; Clavijo, A.; Ortigueira, P.; Troncoso, A.M.; Paneque, P.; Morales, M.L. Volatile and sensory profile of organic red wines produced by different selected autochthonous and commercial Saccharomyces cerevisiae strains. Anal. Chim. Acta 2010, 660, 68–75. [Google Scholar] [CrossRef]
  81. Fleet, G. Yeast interactions and wine flavour. Int. J. Food Microbiol. 2003, 86, 11–22. [Google Scholar] [CrossRef] [PubMed]
  82. Swiegers, J.H.; Bartowsky, E.J.; Henschke, P.A.; Pretorius, I.S. Yeast and bacterial modulation of wine aroma and flavour. Aust. J. Grape Wine Res. 2005, 11, 139–173. [Google Scholar] [CrossRef]
  83. Lambrechts, M.G.; Pretorius, I.S. Yeast and its Importance to Wine Aroma—A Review. S. Afr. J. Enol. Vitic. 2000, 21, 97–129. [Google Scholar] [CrossRef] [Green Version]
  84. Swiegers, J.H.; Pretorius, I.S. Modulation of volatile sulfur compounds by wine yeast. Appl. Microbiol. Biotechnol. 2007, 74, 954–960. [Google Scholar] [CrossRef] [PubMed]
  85. Ugliano, M.; Bartowsky, E.J.; McCarthy, J.; Moio, L.; Henschke, P.A. Hydrolysis and transformation of grape glycosidically bound volatile compounds during fermentation with three Saccharomyces yeast strains. J. Agric. Food Chem. 2006, 54, 6322–6331. [Google Scholar] [CrossRef] [PubMed]
  86. Suzzi, G.; Arfelli, G.; Schirone, M.; Corsetti, A.; Perpetuini, G.; Tofalo, R. Effect of grape indigenous Saccharomyces cerevisiae strains on Montepulciano d’Abruzzo red wine quality. Food Res. Int. 2012, 46, 22–29. [Google Scholar] [CrossRef]
  87. Antonelli, A.; Castellari, L.; Zambonelli, C.; Carnacini, A. Yeast influence on volatile composition of wines. J. Agric. Food Chem. 1999, 47, 1139–1144. [Google Scholar] [CrossRef] [PubMed]
  88. Jackson, R.S. Wine Science: Principles and Applications, 3rd ed.; Academic Press: London, UK, 2008. [Google Scholar]
  89. Ferreira, V. Volatile aroma compounds and wine sensory attributes. In Managing Wine Quality; Elsevier: Amsterdam, The Netherlands, 2010; pp. 3–28. [Google Scholar]
  90. Aznar, M.; López, R.; Cacho, J.F.; Ferreira, V. Identification and quantification of impact odorants of aged red wines from Rioja. GC−Olfactometry, quantitative GC-MS, and odor evaluation of HPLC fractions. J. Agric. Food Chem. 2001, 49, 2924–2929. [Google Scholar] [CrossRef] [PubMed]
  91. Komes, D.; Ulrich, D.; Kovacevic Ganic, K.; Lovric, T. Study of phenolic and volatile composition of white wine during fermentation and a short time of storage. Vitis 2007, 46, 77–84. [Google Scholar]
  92. Allen, M.S.; Lacey, M.J.; Boyd, S.J. Methoxypyrazines in red wines: Occurrence of 2-methoxy-3-(1-methylethy) pyrazine. J. Agric. Food Chem. 1995, 43, 769–772. [Google Scholar] [CrossRef]
  93. Koch, A.; Ebeler, S.E.; Williams, L.E.; Matthews, M.A. Fruit ripening in Vitis vinifera: Light intensity before and not during ripening determines the concentration of 2-Methoxy-3-Isobutylpyrazine in Cabernet Sauvignon Berries. Physiol. Plant. 2012, 145, 275–285. [Google Scholar] [CrossRef] [PubMed]
  94. Pickering, G.J.; Spink, M.; Kotseridis, Y.; Inglis, D.; Brindle, I.D.; Sears, M.; Beh, A.L. Yeast strain affects 3-isopropyl-2-methoxypyrazine concentration and Sensory Profile in Cabernet Sauvignon wine. Aust. J. Grape Wine Res. 2008, 14, 230–237. [Google Scholar] [CrossRef]
Figure 1. Dendrogram based on the similarities of the yeasts’ mDNA HinfI restriction profiles. It was constructed using Pearson’s product–moment correlation coefficient and the unweighted pair group method with arithmetic mean (UPGMA). The cut-off level was set at 79.5% similarity (red line in the figure). Red and green dots on the dendrogram indicate cophenetic correlation coefficients of the branches below and above 80%, respectively.
Fermentation 09 00654 g001
Figure 2. Growth parameters were recorded for the different S. cerevisiae strains grown in sterile grape Cabernet Sauvignon must. (A) Growth kinetics of the different strains; (B) the maximum growth rate (μmax) expressed as Δ CFU mL−1 h−1; (C) Area Under the Curve (AUC) calculated from the growth kinetics data corresponding to 3 (blue), 7 (red) and 21 (green) days. Different letters in the columns indicate a significant difference (p < 0.01) between the values.
Fermentation 09 00654 g002
Figure 3. Consumed sugars, products produced and ethanol yield from sugars on day 21 from the start of yeast inoculation. Glucose consumption expressed in g/L (A), fructose consumption expressed in g/L (B), ethanol production expressed in % (vv−1) (C), glycerol production expressed in g/L (D), acetic acid production expressed in g/L (E) and ethanol yield (F). Different letters in the columns indicate a significant difference (p < 0.01) between the values.
Fermentation 09 00654 g003
Figure 4. Score plot (a) and loading plot (b) on the first (PC1) and second (PC2) principal components corresponding to the PCA of the chemical and sensory parameters of Cabernet Sauvignon wines.
Fermentation 09 00654 g004aFermentation 09 00654 g004b
Table 1. S. cerevisiae strains isolated from industrial Cabernet Sauvignon Pago wine: isolate name, fermentation time point from which the isolate was recovered, mDNA HinfI profile and representative profile isolate. The right column shows the number of each mDNA pattern. HAF—half (middle) alcoholic fermentation; EAF—end of alcoholic fermentation. In bold, the representative isolate for each mDNA HinfI profile.
IsolatesIsolation PhasemDNA HinfI Restriction Profile
32FHAF1
32B, 32E, 32G, 32IHAF2
36D, 36E, 37AEAF
32DHAF3
36HEAF
32A, 32CHAF4
37BEAF
36IEAF5
32JEAF6
36FEAF7
36C, 36GEAF8
36AEAF9
37D, 37EEAF10
37CEAF11
Table 2. Physico-chemical parameters of the Cabernet Sauvignon wines fermented with the selected yeast strains.
StrainConsumed SugarConsumed Sugar/Ethanol Production RatioResidual SugarAlcohol Concentration (%v/v)Density (g/L)Volatile Acidity (g Acetic Acid/L)pHTotal Acidity (g Tartaric Acid/L)
32C239.1 ± 4.23 b17.2 ± 0.10 a2.12 ± 0.16 a13.9 ± 0.17 c992 ± 1.0 a0.49 ± 0.08 ab3.68 ± 0.07 b7.33 ± 0.09 c
32D229.3 ± 0.75 a17.4 ± 0.10 ab2.10 ± 0.20 a13.2 ± 0.12 a993 ± 1.0 a0.59 ± 0.06 b3.57 ± 0.09 a7.00 ± 0.38 bc
32E240.0 ± 1.98 b17.3 ± 0.15 a2.38 ± 0.03 a13.9 ± 0.17 c992 ± 1.0 a0.41 ± 0.08 a3.68 ± 0.07 c7.33 ± 0.09 c
32F236.0 ± 4.46 b17.3 ± 0.15 a2.67 ± 0.15 a13.7 ± 0.15 b993 ± 0.0 a0.55 ± 0.00 b3.59 ± 0.06 a6.41 ± 0.12 a
32J234.7 ± 0.68 b17.6 ± 0.10 c2.70 ± 0.20 a13.3 ± 0.12 a992 ± 1.0 a0.50 ± 0.04 ab3.68 ± 0.06 c6.10 ± 0.11 a
36A242.9 ± 7.02 b17.3 ± 0.06 a2.20 ± 0.17 a14.1 ± 0.42 c993 ± 1.0 a0.43 ± 0.08 a3.67 ± 0.05 c6.85 ± 0.34 b
36C242.9 ± 1.18 b17.3 ± 0.06 a2.37 ± 0.06 a14.1 ± 0.12 c992 ± 0.0 a0.66 ± 0.04 c3.55 ± 0.05 a6.40 ± 0.34 a
36F233.3 ± 9.56 b17.6 ± 0.21 d2.47 ± 0.47 a13.2 ± 0.64 a993 ± 0.0 a0.59 ± 0.10 bc3.64 ± 0.07 b7.23 ± 0.16 c
36I234.0 ± 7.06 b17.6 ± 0.15 c2.33 ± 0.06 a13.3 ± 0.29 a992 ± 0.0 a0.43 ± 0.04 a3.63 ± 0.06 b6.43 ± 0.24 b
37C235.6 ± 3.01 b17.4 ± 0.12 ab2.30 ± 0.10 a13.6 ± 0.25 b992 ± 0.0 a0.55 ± 0.00 b3.69 ± 0.02 c7.25 ± 0.09 c
37E242.2 ± 1.20 b17.5 ± 0.23 bc2.50 ± 0.10 a13.9 ± 0.12 bc993 ± 1.0 a0.40 ± 0.00 a3.66 ± 0.01 bc7.23 ± 0.04 c
F-Ratio0.793.980.964.181.2710.472.8010.47
p-Value0.03000.00300.07000.00100.21500.00000.01700.0000
Different letters in the same column mean significant differences (p < 0.05) between fermented wines.
Table 3. Polyphenolic parameters of the Cabernet Sauvignon wines produced with the selected yeast strains.
StrainColor Intensity
(CI)
HueTotal Anthocyanins
(mg/L)
Colored Anthocyanins
(mg/L)
Catechins
(g/L)
Condensed Tannins
(g/L)
Total Polyphenols
(g/L)
Total Polyphenol Index
(IPT)
DMACH Index
(%)
Ethanol Index
(%)
32C10.96 ± 0.87 bc60.07 ± 0.60 a676.36 ± 13.68 c494.4 ± 18.19 c0.10 ± 0.007 c2.53 ± 0.22 c3.73 ± 0.15 a43.63 ± 2.58 b18.08 ± 3.62 a58.24 ± 3.53 b
32D8.92 ± 0.27 a68.77 ± 2.57 c587.53 ± 33.13 bc448.0 ± 17.97 a0.09 ± 0.018 b2.13 ± 0.15 a3.54 ± 0.14 ab39.56 ± 1.63 a32.03 ± 4.70 b54.33 ± 4.45 ab
32E9.54 ± 0.37 a63.36 ± 2.32 b629.53 ± 23.51 c482.9 ± 12.60 bc0.09 ± 0.011 b2.24 ± 0.21 a3.58 ± 0.23 b40.76 ± 2.53 a33.31 ± 3.21 b54.76 ± 3.08 ab
32F10.92 ± 0.18 bc64.68 ± 2.20 bc648.83 ± 22.15 c487.9 ± 11.10 bc0.10 ± 0.007 c2.44 ± 0.16 c3.70 ± 0.09 c43.37 ± 0.69 b22.88 ± 3.76 ab54.99 ± 3.16 ab
32J10.06 ± 0.62 b62.81 ± 3.62 ab645.97 ± 19.73 c482.4 ± 11.95 bc0.10 ± 0.008 c2.47 ± 0.24 c3.72 ± 0.08 c43.48 ± 1.34 b29.26 ± 5.23 b57.25 ± 3.53 b
36A11.00 ± 0.54 c61.82 ± 2.51 ab557.61 ± 38.92 b435.3 ± 16.73 a0.09 ± 0.008 ab2.45 ± 0.24 c3.47 ± 0.14 a38.57 ± 5.28 a21.56 ± 4.71 a52.89 ± 5.15 a
36C10.74 ± 0.85 bc58.75 ± 2.84 a626.29 ± 34.12 c490.9 ± 31.88 c0.09 ± 0.008 b2.29 ± 0.20 b3.66 ± 0.17 bc41.29 ± 2.31 ab25.71 ± 2.69 ab53.17 ± 3.13 a
36F9.39 ± 0.42 a63.50 ± 2.69 b607.53 ± 17.33 bc455.4 ± 19.10 a0.09 ± 0.009 b2.19 ± 0.15 a3.56 ± 0.16 b39.64 ± 4.17 a32.39 ± 1.63 b53.33 ± 2.27 a
36I9.40 ± 0.29 a66.80 ± 1.16 c619.11 ± 49.43 bc481.8 ± 14.71 bc0.09 ± 0.009 b2.42 ± 0.07 c3.77 ± 0.04 c41.90 ± 1.96 ab16.81 ± 3.17 a59.19 ± 2.61 b
37C11.04 ± 0.47 c58.41 ± 1.75 a487.03 ± 28.66 a457.2 ± 12.71 a0.08 ± 0.003 a2.31 ± 0.15 bc3.47 ± 0.05 a40.85 ± 1.02 a23.79 ± 2.96 ab52.94 ± 3.34 a
37E9.15 ± 0.24 a59.58 ± 2.31 a548.99 ± 46.10 b470.1 ± 13.28 b0.08 ± 0.007 ab2.13 ± 0.11 a3.49 ± 0.09 a39.78 ± 0.73 a23.21 ± 0.85 ab52.90 ± 4.33 a
F-Ratio12.9310.9610.957.773.994.065.142.7018.612.27
p-Value0.0000.0000.0000.0000.0000.0000.0000.0080.0000.025
Different letters in the same column indicate significant differences (p < 0.05) between fermented wines.
Table 4. Aromatic compounds of Cabernet Sauvignon wines produced with the selected yeast strains.
Volatile Compounds (mg/L)32C32D32E32F32J36A36C36F36I37C37EF-Ratiop-Value
1-Butanol0.06 ± 0.04 a0.12 ± 0.03 bc0.082 ± 0.04 ab0.268 ± 0.16 d0.172 ± 0.01 c0.049 ± 0.06 a0.055 ± 0.008 a0.045 ± 0.02 a0.031 ± 0.02 a0.039 ± 0.01 a0.028 ± 0.01 a21.310.000
Isoamyl alcohol21.5 ± 5.57 ab26.7 ± 10.45 ab31.6 ± 4.99 c24.9 ± 2.39 ab25.7 ± 3.91 ab32.6 ± 9.39 c30.8 ± 3.16 b24.5 ± 4.22 b21.9 ± 6.76 ab15.3 ± 7.77 a11.3 ± 5.75 a12.300.000
2.3 Butanediol92.0 ± 13.2 c50.0 ± 10.5 ab70.0 ± 10.1 bc50.4 ± 8.1 b90.1 ± 19.1 cd30.4 ± 7.2 a90.5 ± 9.2 cd40.8 ± 7.6 ab90.4 ± 12.0 cd99.3 ± 9.8 d70.3 ± 10.6 bc72.210.000
1-Heptanol0.06 ± 0.04 a0.18 ± 0.05 b0.16 ± 0.03 b0.61 ± 0.32 c0.008 ± 0.18 a0.04 ± 0.03 a0.04 ± 0.01 a0.03 ± 0.009 a0.02 ± 0.006 a0.02 ± 0.002 a0.05 ± 0.006 a10.320.000
Benzyl alcohol0.13 ± 0.09 a0.04 ± 0.016 a0.05 ± 0.007 a0.08 ± 0.04 a0.04 ± 0.008 a0.05 ± 0.008 a0.04 ± 0.003 a0.04 ± 0.003 a0.04 ± 0.003 a0.03 ± 0.007 a0.83 ± 0.07 b24.710.000
2-Phenylethanol110.5 ± 19.1 e103.0 ± 15.2 e95.7 ± 12.7 de119.3 ± 23.3 e72.8 ± 15.3 cd106.3 ± 12.4 e70.7 ± 12.7 bc62.2 ± 11.5 abc46.1 ± 9.0 ab53.6 ± 8.01 abc41.6 ± 9.35 a12.330.000
Total alcohols224.25 ± 38.04180.04 ± 36.24197.58 ± 27.87195.55 ± 34.3188.81 ± 38.5169.43 ± 29.1192.13 ± 25.1127.61 ± 23.3158.48 ± 27.8168.28 ± 25.6124.11 ± 25.8
Methyl acetate0.08 ± 0.02 d0.02 ± 0.00 abc0.11 ± 0.04 e0.03 ± 0.03 c0.01 ± 0.01 ab0.01 ± 0.00 a0.03 ± 0.03 bc0.01 ± 0.00 ab0.07 ± 0.03 d0.01 ± 0.00 a0.01 ± 0.00 ab31.110.000
Ethyl acetate7.00 ± 0.9 c3.00 ± 0.15 a2.00 ± 0.10 a5.30 ± 0.41 c4.30 ± 0.31 bc2.00 ± 0.15 a1.10 ± 0.05 a2.10 ± 0.04 ab0.70 ± 0.02 a1.30 ± 0.06 ab0.70 ± 0.01 a18.800.000
Isobutyl acetatend0.03 ± 0.04 bnd0.02 ± 0.04 and0.04 ± 0.06 a0.23 ± 0.05 bndndnd0.02 ± 0.03 a1.600.000
Ethyl isobutyrate0.05 ± 0.02 a0.30 ± 0.13 bc0.04 ± 0.38 a0.35 ± 0.45 c0.04 ± 0.01 a0.20 ± 0.14 abc0.03 ± 0.00 a0.31 ± 0.23 bc0.05 ± 0.08 a0.03 ± 0.01 a0.02 ± 0.00 a12.160.000
Ethyl octanoate0.91 ± 0.06 bcd0.12 ± 0.01 a0.46 ± 0.14 bc0.81 ± 0.19 efg0.90 ± 0.31 efg0.77 ± 0.36 def1.05 ± 0.14 g0.73 ± 0.24 cdef0.98 ± 0.50 fg0.41 ± 0.16 b0.66 ± 0.25 bcde50.510.000
Ethyl decanoate0.34 ± 0.01 b0.26 ± 0.11 de0.25 ± 0.02 de0.30 ± 0.01 ef0.16 ± 0.03 bc0.04 ± 0.05 a0.15 ± 0.04 bc0.33 ± 0.05 f0.21 ± 0.05 cd0.14 ± 0.02 b0.20 ± 0.08 bcd93.820.000
Diethyl succynate0.22 ± 0.01 bcd0.28 ± 0.12 e0.13 ± 0.04 cd0.33 ± 0.18 e0.07 ± 0.16 abc0.04 ± 0.02 a0.09 ± 0.01 abc0.03 ± 0.00 a0.06 ± 0.00 ab0.05 ± 0.01 a0.16 ± 0.06 d29.220.000
2-Phenylethylacetate7.36 ± 1.3 abc6.40 ± 0.7 cde10.03 ± 1.2 g8.98 ± 1.7 fg5.84 ± 0.7 bcd6.77 ± 1.7 de4.02 ± 0.3 a8.12 ± 0.9 g6.36 ± 1.7 cde4.50 ± 0.90 ab4.57 ± 0.37 ab20.1320.000
Total esters15.96 ± 2.310.41 ± 1.313.02 ± 1.916.12 ± 3.011.33 ± 1.59.87 ± 2.56.68 ± 0.3511.64 ± 1.58.45 ± 2.46.43 ± 1.166.30 ± 0.8
Butyric acid0.12 ± 0.01 bc0.21 ± 0.07 e0.15 ± 0.04 cd0.19 ± 0.09 de0.12 ± 0.03 bc0.12 ± 0.03 bc0.11 ± 0.02 abc0.12 ± 0.02 bc0.13 ± 0.01 bc0.06 ± 0.05 a0.09 ± 0.04 ab22.220.000
Isopentanoic acid0.38 ± 0.03 b0.56 ± 0.08 d0.41 ± 0.15 bc0.78 ± 0.13 e0.87 ± 0.09 e0.51 ± 0.13 cd0.51 ± 0.03 cd0.58 ± 0.22 d0.36 ± 0.02 b0.20 ± 0.07 ª0.34 ± 0.06 b14.150.000
Hexanoic acid0.78 ± 0.15 e0.31 ± 0.19 a0.52 ± 0.10 bcd0.55 ± 0.04 d0.44 ± 0.06 b0.52 ± 0.07 bcd0.54 ± 0.04 cd0.45 ± 0.06 bc0.50 ± 0.08 bcd0.32 ± 0.03 a0.26 ± 0.11 a34.910.000
Ethyl Hexanoic acid0.008 ± 0.001 bcnd0.005 ± 0.003 ab0.016 ± 0.005 d0.015 ± 0.005 cd0.016 ± 0.004 d0.004 ± 0.001 ab0.07 ± 0.005 e0.007 ± 0.027 abc0.004 ± 0.002 ab0.009 ± 0.002 bcd5.410.000
Octanoic acid0.74 ± 0.17 e0.42 ± 0.28 bc0.58 ± 0.08 d0.58 ± 0.06 d0.36 ± 0.07 cd0.51 ± 0.09 cd0.53 ± 0.05 cd0.48 ± 0.10 cd0.47 ± 0.11 cd0.32 ± 0.13 ab0.22 ± 0.14 a28.710.000
Decanoic acid0.19 ± 0.04 abc0.67 ± 0.25 d0.16 ± 0.08 abc0.14 ± 0.01 ab0.11 ± 0.02 a0.20 ± 0.11 bc0.11 ± 0.04 a0.25 ± 0.07 c0.14 ± 0.03 ab0.10 ± 0.05 a0.13 ± 0.07 ab17.700.000
Isobutyric acid0.25 ± 0.01 ab0.31 ± 0.12 b0.20 ± 0.05 a0.50 ± 0.17 cd0.39 ± 0.07 d0.46 ± 0.15 c0.27 ± 0.17 ab0.31 ± 0.08 b0.33 ± 0.06 b0.26 ± 0.06 ab0.28 ± 0.05 ab12.010.000
Total acids2.49 ± 0.412.48 ± 1.022.03 ± 0.512.75 ± 0.522.31 ± 0.342.33 ± 0.602.07 ± 0.342.26 ± 0.541.93 ± 0.341.25 ± 0.411.34 ± 0.47
γ-butyrolactone6.98 ± 0.3 d4.90 ± 0.5 d4.31 ± 0.3 d2.99 ± 0.8 abc3.93 ± 0.4 bcd2.56 ± 0.1 a2.74 ± 0.7 a7.83 ± 1.7 e2.85 ± 1.9 ab4.52 ± 0.7 d4.84 ± 0.7 d35.010.000
Total lactones6.98 ± 0.34.90 ± 0.54.31 ± 0.32.99 ± 0.83.93 ± 0.42.56 ± 0.12.74 ± 0.77.83 ± 1.72.85 ± 1.94.52 ± 0.74.84 ± 0.7
Acetaldehyde11.20 ± 1.9 bc6.80 ± 1.9 ab25.00 ± 3.9 c4.40 ± 0.9 a9.10 ± 2.7 ab22.90 ± 4.2 c6.30 ± 2.7 ab22.20 ± 5.4 c18.90± 5.0 bc3.30 ± 1.1 a20.80 ± 4.1 bc14.270.000
Diacetyl0.01 ± 0.01 a0.04 ± 0.03 cde0.03 ± 0.01 abcd0.03 ± 0.02 bcd0.08 ± 0.05 f0.05 ± 0.02 def0.02 ± 0.01 abc0.06 ± 0.02 ef0.01 ± 0.004 a0.02 ± 0.001 a0.01 ± 0.002 ab20.430.000
5-Methylfurfural0.27 ± 0.01 cde0.23 ± 0.03 bcd0.14 ± 0.10 a0.20 ± 0.04 abc0.21 ± 0.03 bcd0.37 ± 0.19 f0.29 ± 0.07 def0.17 ± 0.071 b0.17 ± 0.03 ab0.22 ± 0.07 bcd0.15 ± 0.10 ab19.440.000
Total aldehydes11.48± 1.927.14 ± 1.9625.17 ± 3.924.62 ± 0.969.39 ± 2.7823.32 ± 4.416.61 ± 2.7822.43 ± 5.4919.08 ± 5.013.54 ± 1.1720.96 ± 4.20
Different letters in the same row indicate significant differences (p < 0.05) between fermented wines.
Table 5. Sensory characteristics of Cabernet Sauvignon wines made with the selected yeast strains.
Scale of 1–10
Sensory Atributes32C32D32E32F32J36A36C36F36I37C37EF-Ratiop-Value
Color
Color quality8.2 ± 0.07.9 ± 0.18.1 ± 0.17.8 ± 0.68.0 ± 2.08.1 ± 1.18.0 ± 1.97.9 ± 2.28.0 ± 1.47.9 ± 1.88.1 ± 0.00.340.9684
Color intensity8.2 ± 0.38.0 ± 0.08.0 ± 0.38.0 ± 0.78.1 ± 1.98.2 ± 2.18.2 ± 0.88.1 ± 2.08.1 ± 2.38.2 ± 2.58.3 ± 1.40.240.9907
Aroma
Aroma intensity8.1 ± 0.8 b7.3 ± 0.2 a7.2 ± 0.1 a8.4 ± 1.0 b7.2 ± 2.4 a7.4 ± 1.6 a7.2 ± 1.2 a7.2 ± 1.0 a7.4 ± 1.6 a7.2 ± 1.8 a7.3 ± 1.2 a9.410.0392
Aroma quality8.2 ± 1.2 b6.6 ± 0.5 a7.4 ± 0.a8.4 ± 1.0 b6.6 ± 0.0 a7.9 ± 1.7 b7.4 ± 0.6 ab7.8 ± 2.9 b7.1 ± 0.9 ab7.2 ± 2.1 a7.0 ± 0.9 a7.060.0400
Red fruit aroma7.3 ± 1.2 b5.8 ± 0.4 a6.9 ± 0.7 a6.8 ± 2.7 a6.5 ± 1.9 a6.5 ± 1.0 a6.8 ± 1.3 ab6.8 ± 1.2 ab5.6 ± 1.6 a6.2 ± 1.1 a7.2 ± 1.1 b8.650.0375
Black fruit aroma5.3 ± 0.55.2 ± 0.15.5 ± 0.17.0 ± 1.25.4 ± 0.55.8 ± 0.84.1 ± 0.65.3 ± 0.95.0 ± 0.75.9 ± 1.05.7 ± 0.20.650.7707
Balsamic aroma3.7 ± 0.73.0 ± 0.14.5 ± 0.04.8 ± 1.23.2 ± 1.24.0 ± 0.73.6 ± 0.44.9 ± 1.23.8 ± 1.14.2 ± 0.03.0 ± 0.00.550.8520
Vegetable aroma1.7 ± 0.8 a3.5 ± 0.0 b1.9 ± 0.5 a1.1 ± 0.3 a2.2 ± 0.8 ab1.7 ± 0.1 a1.1 ± 0.1 a1.5 ± 0.3 a2.1 ± 0.5 ab1.1 ± 0.4 a1.1 ± 0.3 a1.980.0431
Floral aroma1.3 ± 0.41.1 ± 0.01.2 ± 0.21.3 ± 0.71.3 ± 0.51.1 ± 0.51.1 ± 0.01.6 ± 0.21.4 ± 0.01.4 ± 0.61.2 ± 0.20.420.9355
Lactic aroma2.9 ± 0.62.7 ± 0.32.5 ± 0.03.3 ± 1.12.8 ± 0.32.7 ± 0.91.9 ± 0.43.1 ± 1.12.7 ± 0.83.2 ± 0.92.9 ± 0.90.250.9897
Spicy aroma1.5 ± 0.71.6 ± 0.51.7 ± 0.02.8 ± 1.02.1 ± 0.81.5 ± 0.71.6 ± 0.52.1 ± 0.81.7 ± 0.51.6 ± 0.11.6 ± 0.50.600.8067
Taste
Taste intensity7.3 ± 1.26.8 ± 0.46.6 ± 0.06.9 ± 1.16.8 ± 2.86.8 ± 1.17.2 ± 1.56.8 ± 2.17.1 ± 2.37.0 ± 1.77.4 ± 1.70.350.9636
Taste quality7.9 ± 2.37.0 ± 0.26.2 ± 0.07.1 ± 1.27.3 ± 2.76.3 ± 1.46.9 ± 0.97.0 ± 1.77.1 ± 2.76.5 ± 0.76.7 ± 1.20.590.8172
Acidity5.9 ± 0.56.3 ± 0.16.8 ± 0.25.8 ± 0.15.8 ± 1.96.7 ± 1.76 ± 0.06.1 ± 0.96.4 ± 0.06.4 ± 1.66.1 ± 1.40.450.9189
Sweetness2.3 ± 0.82.5 ± 0.02.7 ± 0.32.6 ± 0.12.6 ± 0.92.4 ± 0.32.4 ± 0.32.7 ± 0.22.8 ± 0.72.3 ± 0.52.3 ± 0.60.041.0000
Unctuousness6.5 ± 1.76.0 ± 0.85.5 ± 0.06.0 ± 0.16.2 ± 2.75.7 ± 0.05.5 ± 1.15.8 ± 0.05.9 ± 1.83.8 ± 0.16.2 ± 2.10.120.9995
Structure3.8 ± 0.93.6 ± 0.93.2 ± 0.93.7 ± 0.24.4 ± 0.04.0 ± 1.03.8 ± 0.63.7 ± 0.94.0 ± 1.95.9 ± 0.84.2 ± 1.10.110.9997
Astringency4.9 ± 1.25.0 ± 0.35.8 ± 0.84.9 ± 0.44.7 ± 1.55.5 ± 0.95.7 ± 1.05.2 ± 0.45.5 ± 2.15.4 ± 1.05.0 ± 1.10.240.9907
Bitterness3.6 ± 0.93.9 ± 0.04.2 ± 0.33.8 ± 0.03.5 ± 0.73.5 ± 0.13.7 ± 0.73.6 ± 0.53.8 ± 0.73.5 ± 0.43.5 ± 1.00.061.0000
Taste persistence7.4 ± 0.06.8 ± 0.16.7 ± 0.16.6 ± 0.06.4 ± 1.26.3 ± 1.66.3 ± 1.66.1 ± 0.16.5 ± 0.96.0 ± 1.26.4 ± 1.20.420.9315
Overall Quality7.8 ± 1.57.0 ± 0.57.3 ± 0.07.6 ± 0.17.1 ± 1.26.9 ± 1.27.0 ± 1.36.6 ± 0.77.2 ± 1.77.3 ± 1.07.4 ± 1.90.460.9121
Different letters within the same file indicate significant differences (p < 0.05) between fermented wines.
Disclaimer/Publisher’s Note: The statements, opinions and data contained in all publications are solely those of the individual author(s) and contributor(s) and not of MDPI and/or the editor(s). MDPI and/or the editor(s) disclaim responsibility for any injury to people or property resulting from any ideas, methods, instructions or products referred to in the content.

