

Engineering the Metabolic Profile of Clostridium cellulolyticum with Genomic DNA Libraries

Abstract
1. Introduction
2. Materials and Methods
2.1. Strains
2.2. Media and Cultivation
2.3. DNA Manipulation

| Strain | Genotype | Reference |
|---|---|---|
| Clostridium cellulolyticum (H10) ATCC 35319 | Wild-type | [9] |
| Escherichia coli NEB 10-beta | Δ(ara-leu) 7697 araD139 fhuA ΔlacX74 galK16 galE15 e14- ϕ80dlacZΔM15 recA1 relA1 endA1 nupG rpsL (StrR) rph spoT1 Δ(mrr-hsdRMS-mcrBC) | New England Biolabs |
| Escherichia coli NEB 5-alpha | fhuA2 Δ(argF-lacZ)U169 phoA glnV44 Φ80 Δ(lacZ)M15 gyrA96 recA1 relA1 endA1 thi-1 hsdR17 | New England Biolabs |
| Escherichia coli Ccdb survival 2 T1TM | F-mcrA Δ(mrr-hsdRMS-mcrBC) Φ80lacZΔM15 ΔlacX74 recA1 araΔ139 Δ(ara-leu)7697galU galK rpsL (StrR) endA1 nupG fhuA::IS2 | Life Technologies |
| Plasmids | ||
| Psos95 | Emr, Ampr, thl promoter, ColE1 ORI, pIM13 ORI | [39] |
| PsosLink | Emr, Ampr, thl promoter | This research |
| PsosGate | Emr, Ampr, Cmr, ccdb Gateway® Cassette | This research |
| pCR8/GW/TOPO TA | Linearized, Spnr | This research |
| Primers | ||
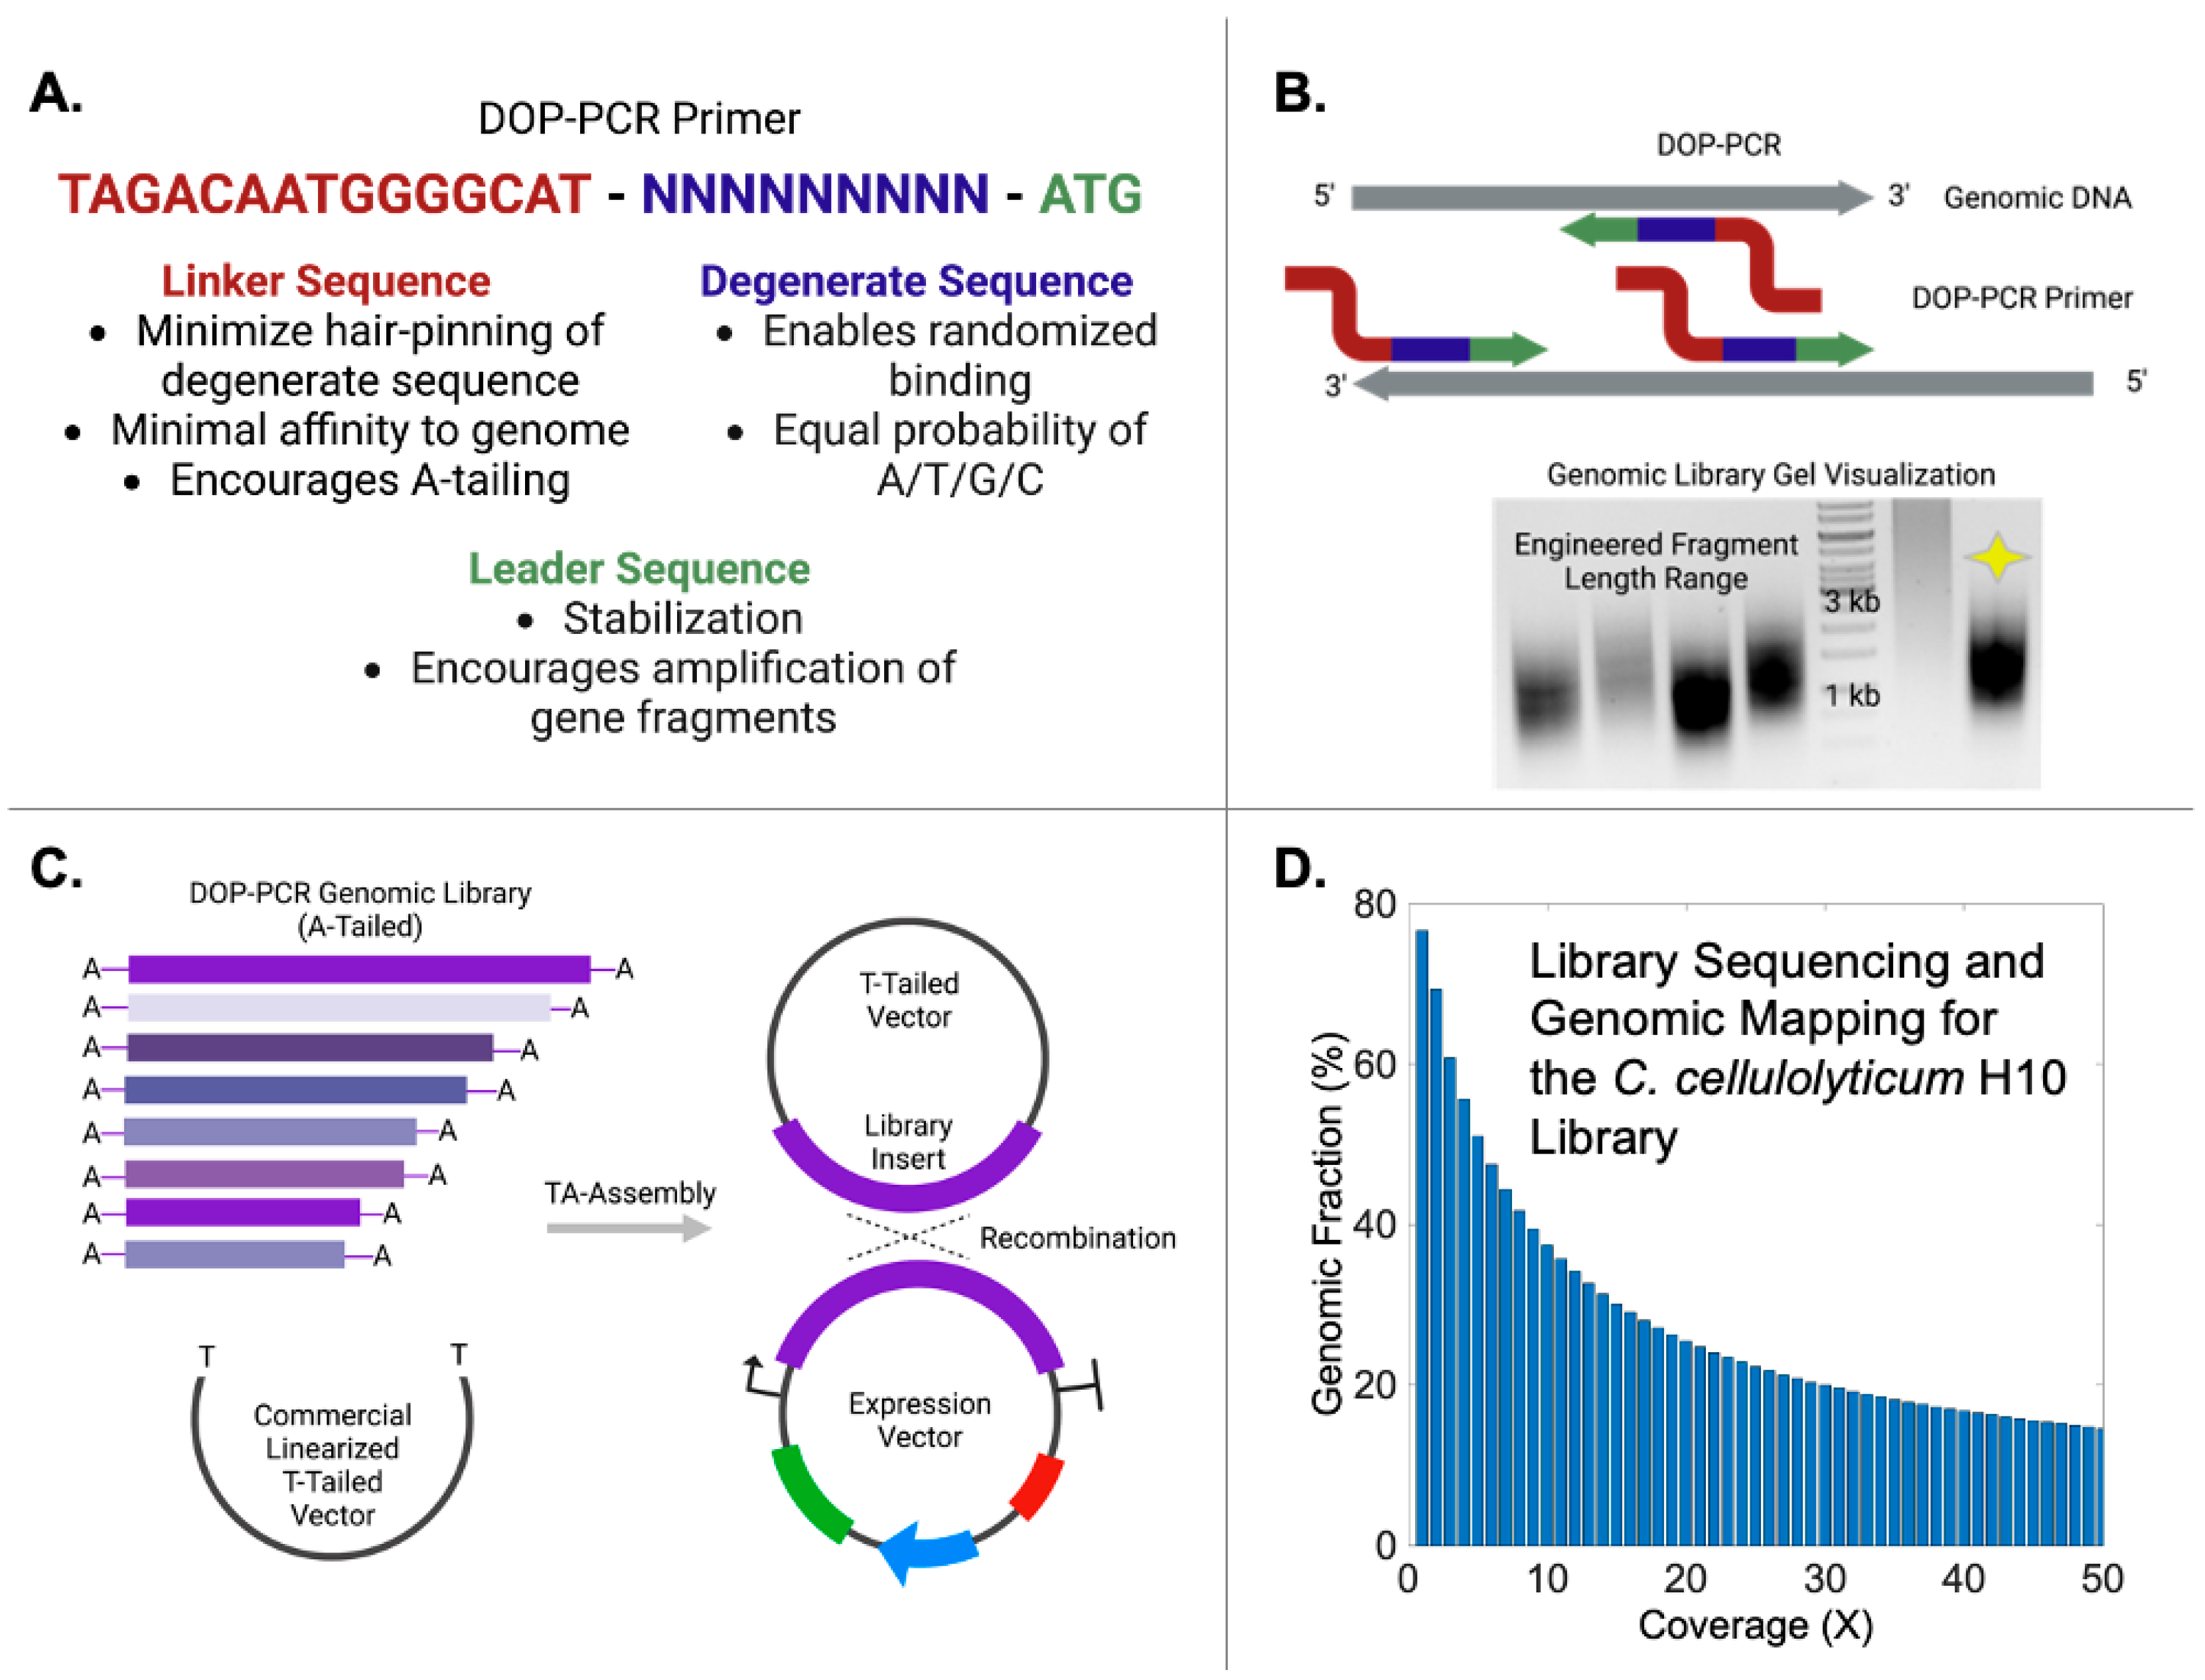
| DOP1 | TAGACAATGGGGCATNNNNNNNNNATG | [37] |
| MCS1 | TTGGGATCCCTAACTAACTAGACACTAAGTCGATATCGACATAGTGTCTAGATAGATAGGGCGCCTTG | This research |
| pSOS_libF | TACGGGGTAACAGATAAACCATT | This research |
| pSOS_libR | GATAGATAGGGCGCCACTTA | This research |
| Gateway_F | ATCACAAGTTTGTACAAAAAAGC | [37] |
| Gateway_R | ATCACCACTTTGTACAAGAAAGC | [37] |
2.4. Whole-Genome Amplification by DOP-PCR
2.5. Genomic DNA Library Construction
2.6. Metagenomic DNA Library Construction
2.7. DNA Library Sequencing and Analysis
2.8. Electro-Transformation
2.9. Outgrowth and Enrichment
2.10. Metabolite Analysis
3. Results
3.1. DNA Library Construction by DOP-PCR
3.2. Genome Alignment of Enriched DNA Fragments
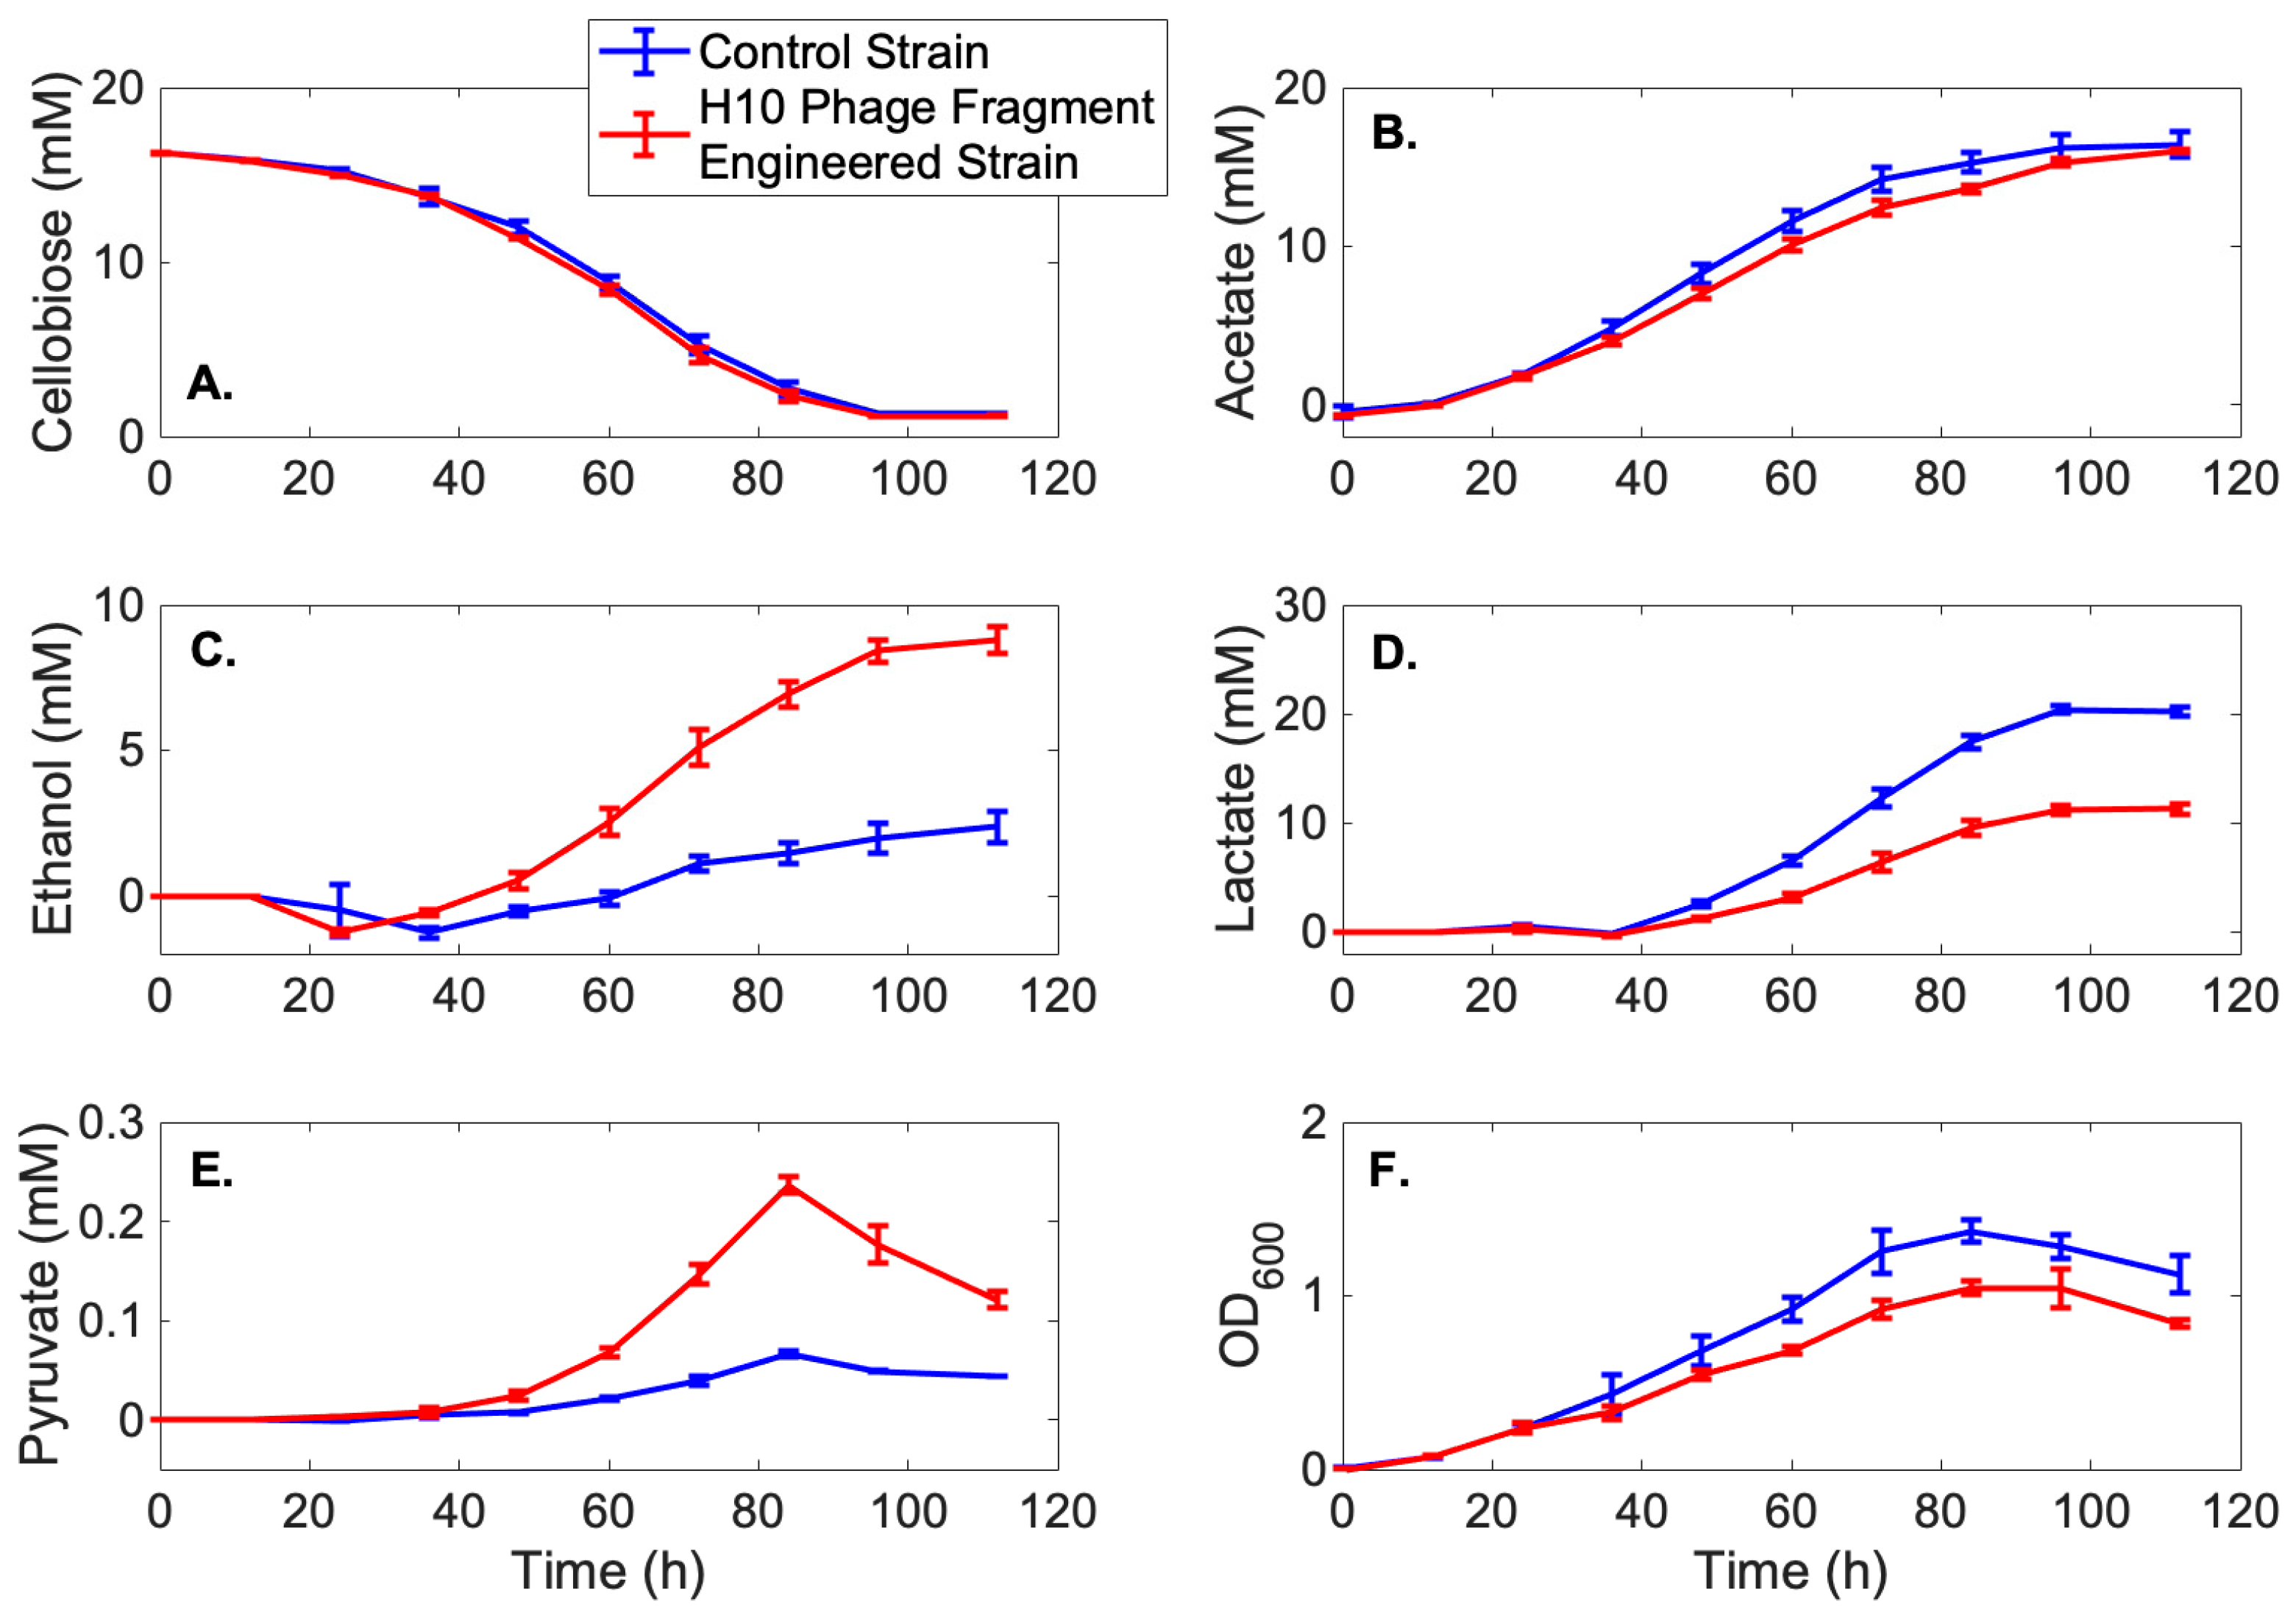
3.3. Metabolic Profiles
4. Discussion
Supplementary Materials
Author Contributions
Funding
Institutional Review Board Statement
Informed Consent Statement
Data Availability Statement
Acknowledgments
Conflicts of Interest
References
- Ren, N.; Wang, A.; Cao, G.; Xu, J.; Gao, L. Bioconversion of lignocellulosic biomass to hydrogen: Potential and challenges. Biotechnol. Adv. 2009, 27, 1051–1060. [Google Scholar] [CrossRef] [PubMed]
- Lincke, T.; Behnken, S.; Ishida, K.; Roth, M.; Hertweck, C. Closthioamide: An Unprecedented Polythioamide Antibiotic from the Strictly Anaerobic Bacterium Clostridium cellulolyticum. Angew. Chem. 2010, 122, 2055–2057. [Google Scholar] [CrossRef]
- Higashide, W.; Li, Y.; Yang, Y.; Liao, J.C. Metabolic Engineering of Clostridium cellulolyticum for Production of Isobutanol from Cellulose. Appl. Environ. Microbiol. 2011, 77, 2727–2733. [Google Scholar] [CrossRef] [PubMed]
- Weber, C.; Farwick, A.; Benisch, F.; Brat, D.; Dietz, H.; Subtil, T.; Boles, E. Trends and Challenges in the Microbial Production of Lignocellulosic Bioalcohol Fuels. Appl. Microbiol. Biotechnol. 2010, 87, 1303–1315. [Google Scholar] [CrossRef]
- Werpy, T.A.; Holladay, J.E.; White, J.F. Top Value Added Chemicals from Biomass: I. Results of Screening for Potential Candidates from Sugars and Synthesis Gas; Pacific Northwest National Laboratory (PNNL): Richland, WA, USA, 2004. [Google Scholar]
- Olson, D.G.; McBride, J.E.; Joe Shaw, A.; Lynd, L.R. Recent progress in consolidated bioprocessing. Curr. Opin. Biotechnol. 2012, 23, 396–405. [Google Scholar] [CrossRef]
- Geddes, C.C.; Nieves, I.U.; Ingram, L.O. Advances in Ethanol Production. Curr. Opin. Biotechnol. 2011, 22, 312–319. [Google Scholar] [CrossRef][Green Version]
- Olguin-Maciel, E.; Singh, A.; Chable-Villacis, R.; Tapia-Tussell, R.; Ruiz, H.A. Consolidated Bioprocessing, an Innovative Strategy towards Sustainability for Biofuels Production from Crop Residues: An Overview. Agronomy 2020, 10, 1834. [Google Scholar] [CrossRef]
- Petitdemange, E.; Caillet, F.; Giallo, J.; Gaudin, C. Clostridium cellulolyticum Sp. Nov., a Cellulolytic, Mesophilic Species from Decayed Grass. Int. J. Syst. Bacteriol. 1984, 34, 155–159. [Google Scholar] [CrossRef]
- Desvaux, M.; Petitdemange, H. Sporulation of Clostridium cellulolyticum While Grown in Cellulose-Batch and Cellulose-Fed Continuous Cultures on a Mineral-Salt Based Medium. Microbial Ecol. 2002, 43, 271–279. [Google Scholar] [CrossRef]
- Belaich, A.; Parsiegla, G.; Gal, L.; Villard, C.; Haser, R.; Belaich, J.-P. Cel9M, a New Family 9 Cellulase of the Clostridium cellulolyticum Cellulosome. J. Bacteriol. 2002, 184, 1378–1384. [Google Scholar] [CrossRef]
- Saxena, S.; Fierobe, H.-P.; Gaudin, C.; Guerlesquin, F.; Belaich, J.-P. Biochemical Properties of a Beta-Xylosidase from Clostridium cellulolyticum. Appl. Environ. Microbiol. 1995, 61, 3509–3512. [Google Scholar] [CrossRef]
- Desvaux, M. Clostridium cellulolyticum: Model organism of mesophilic cellulolytic clostridia. FEMS Microbiol. Rev. 2005, 29, 741–764. [Google Scholar] [CrossRef]
- Gal, L.; Pages, S.; Gaudin, C.; Belaich, A.; Reverbel-Leroy, C.; Tardif, C.; Belaich, J.P. Characterization of the Cellulolytic Complex (Cellulosome) Produced by Clostridium cellulolyticum. Appl. Environ. Microbiol. 1997, 63, 903–909. [Google Scholar] [CrossRef]
- Blouzard, J.-C.; Coutinho, P.M.; Fierobe, H.-P.; Henrissat, B.; Lignon, S.; Tardif, C.; Pagès, S.; Philip, P. Modulation of Cellulosome Composition in Clostridium cellulolyticum: Adaptation to the Polysaccharide Environment Revealed by Proteomic and Carbohydrate-Active Enzyme Analyses. Proteomics 2010, 10, 541–554. [Google Scholar] [CrossRef]
- Gelhaye, E.; Petitdemange, H.; Gay, R. Adhesion and Growth Rate of Clostridium cellulolyticum ATCC 35319 on Crystalline Cellulose. J. Bacteriol. 1993, 175, 3452–3458. [Google Scholar] [CrossRef][Green Version]
- Giallo, J.; Gaudin, C.; Belaich, J.P.; Petitdemange, E.; Caillet-Mangin, F. Metabolism of Glucose and Cellobiose by Cellulolytic Mesophilic Clostridium Sp. Strain H10. Appl. Environ. Microbiol. 1983, 45, 843–849. [Google Scholar] [CrossRef]
- Desvaux, M.; Guedon, E.; Petitdemange, H. Cellulose Catabolism by Clostridium cellulolyticum Growing in Batch Culture on Defined Medium. Appl. Environ. Microbiol. 2000, 66, 2461–2470. [Google Scholar] [CrossRef]
- Desvaux, M.; Guedon, E.; Petitdemange, H. Metabolic flux in cellulose batch and cellulose-fed continuous cultures of Clostridium cellulolyticum in response to acidic environment. Microbiology 2001, 147, 1461–1471. [Google Scholar] [CrossRef]
- Dien, B.S.; Cotta, M.A.; Jeffries, T.W. Bacteria Engineered for Fuel Ethanol Production: Current Status. Appl. Microbiol. Biotechnol. 2003, 63, 258–266. [Google Scholar] [CrossRef]
- Gaida, S.M.; Liedtke, A.; Jentges, A.H.W.; Engels, B.; Jennewein, S. Metabolic Engineering of Clostridium cellulolyticum for the Production of N-Butanol from Crystalline Cellulose. Microb. Cell Fact. 2016, 15, 6. [Google Scholar] [CrossRef]
- Jennert, K.C.; Tardif, C.; Young, D.I.; Young, M. Gene Transfer to Clostridium cellulolyticum ATCC 35319. Microbiology 2000, 146 Pt 12, 3071–3080. [Google Scholar] [CrossRef] [PubMed]
- Guedon, E.; Desvaux, M.; Petitdemange, H. Kinetic Analysis of Clostridium cellulolyticum Carbohydrate Metabolism: Importance of Glucose 1-Phosphate and Glucose 6-Phosphate Branch Points for Distribution of Carbon Fluxes inside and Outside Cells as Revealed by Steady-State Continuous Culture. J. Bacteriol. 2000, 182, 2010–2017. [Google Scholar] [CrossRef] [PubMed][Green Version]
- Payot, S.; Guedon, E.; Cailliez, C.; Gelhaye, E.; Petitdemange, H. Metabolism of Cellobiose by Clostridium cellulolyticum Growing in Continuous Culture: Evidence for Decreased NADH Reoxidation as a Factor Limiting Growth. Microbiology 1998, 144, 375–384. [Google Scholar] [CrossRef] [PubMed]
- Guedon, E.; Desvaux, M.; Petitdemange, H. Improvement of Cellulolytic Properties of Clostridium cellulolyticum by Metabolic Engineering. Appl. Environ. Microbiol. 2002, 68, 53–58. [Google Scholar] [CrossRef] [PubMed]
- Li, Y.; Tschaplinski, T.J.; Engle, N.L.; Hamilton, C.Y.; Rodriguez, M., Jr.; Liao, J.C.; Schadt, C.W.; Guss, A.M.; Yang, Y.; Graham, D.E. Combined Inactivation of the Clostridium cellulolyticum Lactate and Malate Dehydrogenase Genes Substantially Increases Ethanol Yield from Cellulose and Switchgrass Fermentations. Biotechnol. Biofuels 2012, 5, 2. [Google Scholar] [CrossRef]
- Qureshi, N.; Blaschek, H.P. Recent Advances in ABE Fermentation: Hyper-Butanol Producing Clostridium beijerinckii BA101. J. Ind. Microbiol. Biotechnol. 2001, 27, 287–291. [Google Scholar] [CrossRef]
- Lütke-Eversloh, T.; Bahl, H. Metabolic Engineering of Clostridium acetobutylicum: Recent Advances to Improve Butanol Production. Curr. Opin. Biotechnol. 2011, 22, 634–647. [Google Scholar] [CrossRef]
- Bowring, S.N.; Morris, J.G. Mutagenesis of Clostridium acetobutylicum. J. Appl. Microbiol. 1985, 58, 577–584. [Google Scholar]
- Liyanage, H.; Young, M.; Kashket, E.R. Butanol Tolerance of Clostridium beijerinckii NCIMB 8052 Associated with Down-Regulation of GldA by Antisense RNA. J. Mol. Microbiol. Biotechnol. 2000, 2, 87–93. [Google Scholar]
- Nicolaou, S.A.; Gaida, S.M.; Papoutsakis, E.T. Coexisting/Coexpressing Genomic Libraries (CoGeL) Identify Interactions among Distantly Located Genetic Loci for Developing Complex Microbial Phenotypes. Nucleic Acids Res. 2011, 39, e152. [Google Scholar] [CrossRef][Green Version]
- Lynd, L.R.; Van Zyl, W.H.; McBride, J.E.; Laser, M. Consolidated Bioprocessing of Cellulosic Biomass: An Update. Curr. Opin. Biotechnol. 2005, 16, 577. [Google Scholar] [CrossRef]
- Gill, R.T.; Wildt, S.; Yang, Y.T.; Ziesman, S.; Stephanopoulos, G. Genome-Wide Screening for Trait Conferring Genes Using DNA Microarrays. Proc. Natl. Acad. Sci. USA 2002, 99, 7033–7038. [Google Scholar] [CrossRef]
- Blouzard, J.-C.; Valette, O.; Tardif, C.; Philip, P. Random mutagenesis of Clostridium cellulolyticum using a Tn1545 derivative. Appl. Environ. Microbiol. 2010, 76, 4546–4549. [Google Scholar] [CrossRef]
- Borden, J.R.; Jones, S.W.; Indurthi, D.; Chen, Y.; Papoutsakis, E.T. A Genomic-Library Based Discovery of a Novel, Possibly Synthetic, Acid-Tolerance Mechanism in Clostridium acetobutylicum Involving Non-Coding RNAs and Ribosomal RNA Processing. Metab. Eng. 2010, 12, 268–281. [Google Scholar] [CrossRef][Green Version]
- Borden, J.R.; Papoutsakis, E.T. Dynamics of Genomic-Library Enrichment and Identification of Solvent Tolerance Genes for Clostridium acetobutylicum. Appl. Environ. Microbiol. 2007, 73, 3061–3068. [Google Scholar] [CrossRef]
- Freedman, B.G.; Zu, T.N.K.; Wallace, R.S.; Senger, R.S. Raman Spectroscopy Detects Phenotypic Differences among Escherichia coli Enriched for 1-Butanol Tolerance Using a Metagenomic DNA Library. Biotechnol. J. 2016, 11, 877–889. [Google Scholar] [CrossRef]
- Johnson, E.A.; Madia, A.; Demain, A.L. Chemically Defined Minimal Medium for Growth of the Anaerobic Cellulolytic Thermophile Clostridium thermocellum. Appl. Environ. Microbiol. 1981, 41, 1060–1062. [Google Scholar] [CrossRef]
- Girbal, L.; Mortier-Barrière, I.; Raynaud, F.; Rouanet, C.; Croux, C.; Soucaille, P. Development of a sensitive gene expression reporter system and an inducible promoter-repressor system for Clostridium acetobutylicum. Appl. Environ. Microbiol. 2003, 69, 4985–4988. [Google Scholar] [CrossRef]
- Harris, L.M.; Welker, N.E.; Papoutsakis, E.T. Northern, Morphological, and Fermentation Analysis of Spo0A Inactivation and Overexpression in Clostridium acetobutylicum ATCC 824. J. Bacteriol. 2002, 184, 3586–3597. [Google Scholar] [CrossRef]
- Telenius, H.; Carter, N.P.; Bebb, C.E.; Nordenskjöld, M.; Ponder, B.A.; Tunnacliffe, A. Degenerate Oligonucleotide-Primed PCR: General Amplification of Target DNA by a Single Degenerate Primer. Genomics 1992, 13, 718–725. [Google Scholar] [CrossRef]
- Ng, G.; Roberts, I.; Coleman, N. Evaluation of 3 methods of whole-genome amplification for subsequent metaphase comparative genomic hybridization. Diagn. Mol. Pathol. 2005, 14, 203–212. [Google Scholar] [CrossRef]
- Arneson, N.; Hughes, S.; Houlston, R.; Done, S. Whole-Genome Amplification by Degenerate Oligonucleotide Primed PCR (DOP-PCR). Cold Spring Harb. Protoc. 2008, 2008, pdb-rot4919. [Google Scholar] [CrossRef] [PubMed]
- Bimboim, H.C.; Doly, J. A Rapid Alkaline Extraction Procedure for Screening Recombinant Plasmid DNA. Nucleic Acids Res. 1979, 7, 1513–1523. [Google Scholar] [CrossRef] [PubMed]
- García-Alcalde, F.; Okonechnikov, K.; Carbonell, J.; Cruz, L.M.; Götz, S.; Tarazona, S.; Dopazo, J.; Meyer, T.F.; Conesa, A. Qualimap: Evaluating next-Generation Sequencing Alignment Data. Bioinformatics 2012, 28, 2678–2679. [Google Scholar] [CrossRef] [PubMed]
- Meyer, F.; Paarmann, D.; D’Souza, M.; Olson, R.; Glass, E.M.; Kubal, M.; Paczian, T.; Rodriguez, A.; Stevens, R.; Wilke, A. The Metagenomics RAST Server—A Public Resource for the Automatic Phylogenetic and Functional Analysis of Metagenomes. BMC Bioinform. 2008, 9, 386. [Google Scholar] [CrossRef]
- Cui, G.-Z.; Hong, W.; Zhang, J.; Li, W.-L.; Feng, Y.; Liu, Y.-J.; Cui, Q. Targeted Gene Engineering in Clostridium cellulolyticum H10 without Methylation. J. Micribol. Methods 2012, 89, 201–208. [Google Scholar] [CrossRef]
- Tsai, S.-L.; DaSilva, N.A.; Chen, W. Functional Display of Complex Cellulosomes on the Yeast Surface via Adaptive Assembly. ACS Synth. Biol. 2012, 2, 14–21. [Google Scholar] [CrossRef]
- Marvin, D.A. Filamentous Phage Structure, Infection and Assembly. Curr. Opin. Struct. Biol. 1998, 8, 150–158. [Google Scholar] [CrossRef]
- Ren, Z.; Ward, T.E.; Logan, B.E.; Regan, J.M. Characterization of the Cellulolytic and Hydrogen-Producing Activities of Six Mesophilic Clostridium Species. J. Appl. Microbiol. 2007, 103, 2258–2266. [Google Scholar] [CrossRef]
- Li, Y.; Xu, T.; Tschaplinski, T.J.; Engle, N.L.; Yang, Y.; Graham, D.E.; He, Z.; Zhou, J. Improvement of cellulose catabolism in Clostridium cellulolyticum by sporulation abolishment and carbon alleviation. Biotechnol. Biofuels 2014, 7, 25. [Google Scholar] [CrossRef]
- Tsay, J.T.; Rock, C.O.; Jackowski, S. Overproduction of Beta-Ketoacyl-Acyl Carrier Protein Synthase I Imparts Thiolactomycin Resistance to Escherichia coli K-12. J. Bacteriol. 1992, 174, 508–513. [Google Scholar] [CrossRef][Green Version]
- Skovran, E.; Crowther, G.J.; Guo, X.; Yang, S.; Lidstrom, M.E. A Systems Biology Approach Uncovers Cellular Strategies Used by Methylobacterium extorquens AM1 during the Switch from Multi-to Single-Carbon Growth. PLoS ONE 2010, 5, 14091. [Google Scholar] [CrossRef]
- Lehnherr, H.; Maguin, E.; Jafri, S.; Yarmolinsky, M.B. Plasmid Addiction Genes of Bacteriophage P1: Doc, Which Causes Cell Death on Curing of Prophage, and Phd, Which Prevents Host Death When Prophage Is Retained. J. Mol. Biol. 1993, 233, 414–428. [Google Scholar] [CrossRef]
- Cui, G.-Z.; Zhang, J.; Hong, W.; Xu, C.; Feng, Y.; Cui, Q.; Liu, Y.-J. Improvement of ClosTron for Successive Gene Disruption in Clostridium cellulolyticum Using a PyrF-Based Screening System. Appl. Microbiol. Biotechnol. 2014, 98, 313–323. [Google Scholar] [CrossRef]
- Tyurin, M.V.; Desai, S.G.; Lynd, L.R. Electrotransformation of Clostridium thermocellum. Appl. Environ. Microbiol. 2004, 70, 883–890. [Google Scholar] [CrossRef]


| DNA Library | Number of Reads | Total Hits (%) | GC Content | Alpha Diversity | Protein Coding Features (%) | Organisms Featured |
|---|---|---|---|---|---|---|
| C. cellulolyticum | 3,419,032 | 3,347,393 (97.3) | 39.9% | N/A | 3345 (93.7%) | 1 |
| Soil metagenome | 2,226,424 | 1,922,706 (86.4) | 53 ± 10% | 490.8 | 569,220 (N/A) | 4773 |
| Sequence Identifier | Genome Origin 1 | Gene/Protein Similarity |
|---|---|---|
| H10_Phage | C. cellulolyticum CP001348.1:3379404-3379762 | Ccel_2823: Phage minor structural protein |
| H10_BK | C. cellulolyticum CP001348.1:989500-990681 | Ccel_0859: Beta-ketoacyl synthase Ccel_0860: Beta-ketoacyl synthase |
| ENV_F1 | Hydrogenophaga sp. PBC FR720599.2 | fre: NADH:Flavin oxioreductase/NADH oxidase; Cytochrome C-type protein |
| ENV_M1 2 | Pedosphaera pavula | phd: Prevent-host-death family protein; Hypothetical protein; Ubiquinol-cytochrome C reductase |
Disclaimer/Publisher’s Note: The statements, opinions and data contained in all publications are solely those of the individual author(s) and contributor(s) and not of MDPI and/or the editor(s). MDPI and/or the editor(s) disclaim responsibility for any injury to people or property resulting from any ideas, methods, instructions or products referred to in the content. |
© 2023 by the authors. Licensee MDPI, Basel, Switzerland. This article is an open access article distributed under the terms and conditions of the Creative Commons Attribution (CC BY) license (https://creativecommons.org/licenses/by/4.0/).
Share and Cite
Freedman, B.G.; Lee, P.W.; Senger, R.S. Engineering the Metabolic Profile of Clostridium cellulolyticum with Genomic DNA Libraries. Fermentation 2023, 9, 605. https://doi.org/10.3390/fermentation9070605
Freedman BG, Lee PW, Senger RS. Engineering the Metabolic Profile of Clostridium cellulolyticum with Genomic DNA Libraries. Fermentation. 2023; 9(7):605. https://doi.org/10.3390/fermentation9070605
Chicago/Turabian StyleFreedman, Benjamin G., Parker W. Lee, and Ryan S. Senger. 2023. "Engineering the Metabolic Profile of Clostridium cellulolyticum with Genomic DNA Libraries" Fermentation 9, no. 7: 605. https://doi.org/10.3390/fermentation9070605
APA StyleFreedman, B. G., Lee, P. W., & Senger, R. S. (2023). Engineering the Metabolic Profile of Clostridium cellulolyticum with Genomic DNA Libraries. Fermentation, 9(7), 605. https://doi.org/10.3390/fermentation9070605