Article

The Potential Use of Endophyte-Free inebrians as Sheep Feed Evaluated with In Vitro Fermentation

1
State Key Laboratory of Grassland Agro-Ecosystems, Key Laboratory of Grassland Livestock Industry Innovation, Ministry of Agriculture and Rural Affairs, Engineering Research Center of Grassland Industry, Ministry of Education, Gansu Tech Innovation Centre of Western China Grassland Industry, Center for Grassland Microbiome, College of Pastoral Agriculture Science and Technology, Lanzhou University, Lanzhou 730000, China
2
Institute of Biology, Gansu Academy of Sciences, Lanzhou 730000, China
*
Author to whom correspondence should be addressed.
Fermentation 2022, 8(9), 419; https://doi.org/10.3390/fermentation8090419
Submission received: 22 June 2022 / Revised: 10 August 2022 / Accepted: 16 August 2022 / Published: 24 August 2022
(This article belongs to the Special Issue In Vitro Fermentation)

Abstract

:
Endophytic fungal infection is the major reason for intoxication of animals caused by drunken horse grass. Fortunately, it has been established that seed detoxification techniques and isolation of endophytic fungi infect non-endophytic fungi populations with the same genetic background as endophyte-infected Achnatherum inebrians. Moreover, sheep can use endophyte-free Achnatherum inebriants (EF) without obvious toxicity symptoms. The present study selected EF as a representative grass, consisting of five different replacement levels, EF0, EF25, EF50, EF75, and EF100, corresponding to 0%, 25%, 50%, 75%, and 100% of the fermentation substrate, respectively. Simultaneously, in vitro fermentation and the 16S rRNA amplicon sequencing method was used to explore the effect of EF on sheep ruminal fermentation and microbial diversity. The results revealed that EF100 had the highest values for pH, acetate: propionate, the Patescibacteria, Kiritimatiellaeota, and Synergistetes phylum levels, Ruminococcaceae, Prevotellaceae, and Saccharofermentans genus levels than the other treatments (p < 0.05). In contrast, EF25 was associated with higher levels of abundance-based coverage estimator (ACE), Chaol index of the phyla Synergistetes and Bacteroidetes, and of the genus Erysipelotrichaceae, Rikenellaceae, and Prevotella as compared with other treatments (p < 0.05). EF50 resulted in the greatest values for the genus Christensenellaceae and Lachnospiraceae as compared with other treatments (p < 0.05). EF75 resulted in the greatest values for the Shannon index as compared with other treatments (p < 0.05). EF0 resulted in the greatest values for gas production (GP), ammonia nitrogen (NH3-N), total volatile fatty acid (TVFA), acetate, propionate, butyrate, valerate, isobutyrate, isovalerate, and the phyla Firmicutes, Proteobacteria, and Spirochaetes, and the genus Succiniclasticum, Ruminobacter, Family_XIII and Treponema as compared with other treatments (p < 0.05). PICRUSt2 analysis indicated that most of the functional prediction pathways were involved in Carbohydrate metabolism and, Amino acid metabolism. Therefore, the recommended ratio of EF in sheep diet should range from 25% to 50%, and the maximum proportion should not exceed 75%.

1. Introduction

Drunken horse grass (Achnatherum inebrians) is a perennial herb of Achnatherum in Gramineae that is widely distributed in the alpine and subalpine grasslands of China [1]. This grass is infected by the fungal endophyte Epichloë gansuensis that belonging to the family Clavicipitaceae [2,3,4]. The fungus and grass form a mutually beneficial symbiosis which can cause toxicity in grazing animals and result in economic losses to grassland animal husbandry [5]. Meanwhile, searching for alternative feed resources that are palatable, low-cost, and can meet the nutritional requirements of the ruminants are one of major goals for livestock farming [6,7,8]. Fortunately, it has been established that seed detoxification techniques and isolation of endophytic fungi infect and non-endophytic fungi populations with the same genetic background as endophyte-infected A. inebrians [2], and interestingly it seemed that sheep can effectively use endophyte-free A. inebrians (EF) without obvious toxicity symptoms [9]. In addition, optimizing and maintaining the stability of rumen microflora is an important means to improve feed utilization rate and animal production performance [10,11,12]; furthermore, the changes of rumen microflora are affected by number of factors, and the structure and composition of diet are considered to be important factors [13,14].
To our knowledge, previous studies have focused on elucidating of effects endophyte-infect A. inebrians in toxic doses and other physiological parameters for livestock [2,15]. As mentioned above, EF can be ingested by sheep without toxicity symptoms caused by drunken horse grass (endophyte-infect A. inebrians), but the significance of EF as a forage on rumen fermentation and microbiota is still unknown, which limits the application of this potential feed resource to a certain extent. Therefore, the current experiments were conducted to reveal the impact of EF on sheep rumen fermentation characteristics and bacterial flora through amplicon sequencing, which may help to provide a scientific basis on a reasonable addition ratio in sheep diet for EF.

2. Materials and Methods

2.1. Origin and Preparation of EF

Prior to planting, the 200 seeds that were obtained by collecting from a single plant of A. inebrians were treated with thiophanate-methyl fungicide to eliminate the endophyte according to the procedure by Li et al. [2], and planted in test field of the Yuzhong Campus of Lanzhou University, China (Yuzhong site: 35°87′ N, 104°09′ E, elevation 1731 m). The endophyte-infection status of all plants was microscopically confirmed using leaf sheath examination and aniline blue-staining. Those showed that endophyte infection was <5% for EF plants. The EF grasses in the yellowing stage were harvested, and the endophyte-free status of all plants was again verified as described above. The EF samples were dried in the shade, cut into sections afterwards, crushed with a crusher through a 40-mesh sieve, and saved for evaluation.

2.2. Rumen Fluid Donors and Management

The animal care and management procedures involved in the study were permitted by the Ethics Committee of College of Pastoral Agriculture Science and Technology of Lanzhou University. Twelve healthy adult castrated male small-tailed Han sheep (body weight, 56 ± 2.8 kg) were used as rumen fluid donors from the Taixiang Sheep Farm in Neiguan County, Dingxi City, Gansu Province (Neiguan site: 35°58′ N, 104°62′ E, elevation 2035 m). During the experiment, each sheep was fed 2.1 kg pellet type total mixed ration (PTMR) twice a day (08:00 and 17:00 h), and was provided with drinking clean water freely. The sheep PTMR was composed of corn stalk (38.0%), alfalfa powder (12.0%), corn meal (15.5%), soybean meal (20.8%), wheat bran (4.5%), molasses (3.5%), salt (0.7%), and premix (Calcium monophosphate, 3.5%; Vitamin and trace element additive, 1.5%).

2.3. In Vitro Fermentation Assay

For the in vitro fermentation assay, about 100 mL of rumen fluid from each donor sheep was collected via the sheep’s esophageal tube by the rumen fluid samples collector (Anscitech) before morning feeding. The samples were pooled and thoroughly mixed, and then filtered through four layers of gauze. The buffer solution was prepared according to McFarlane [16], then mixed with filtered rumen fluid in a buffer/rumen fluid ratio of 2:1. Throughout the procedure, the fluid was maintained at a constant temperature of 39 °C, and CO2 was continuously introduced to maintain an anaerobic environment. Treatments were used as fermentation substrates as follows: EF0, EF25, EF50, EF75, and EF100 were defined as EF replacement of 0% (i.e., 100% PTMR), 25%, 50%, 75%, and 100% of the fermentation substrate, respectively. Nutrient composition of the ferment feed was shown in Table 1. The in vitro fermentation test was carried out referring to the method of Egbert et al. [17]. Each treatment was set with three parallel samples and was analyzed. We accurately weighted an equal amount of substrate sample (400 mg) and put it into a nylon bag (300-μm mesh) with about 10 g of glass beads. Each bag was sealed and placed within a specially designed 100 mL syringe. The 40 mL rumen fluid mixture was rapidly injected into the syringe. All air in the syringe was exhausted and sealed, and placed in a 39 °C constant temperature oscillator for the in vitro fermentation test. Blank treatments were set up without fermentation substrate, containing only rumen fluid and buffer solution to correct for nonspecific gas production (GP). Gas production was recorded at various intervals (3, 6, 9, 12, 24, 36, 48 h) over the following 48 h. The recorded GP values were added to record the 48 h cumulative GP. The contents of the nylon bag containing the substrate at the 48 h fermentation time point were removed, washed repeatedly with water, dried, and weighed after drying at 105 °C to measure the dry matter (DM). Ferment feeds were analyzed for DM, organic matter (OM), crude protein (CP), and crude ash (Ash) using the procedures described in AOAC [18]. The procedures described by Goering and van Soest [19] were used to measure neutral detergent fiber (NDF) and acid detergent fiber (ADF). Ergonovine and ergine were performed by 1100 series high-performance liquid chromatography (Agilent Technologies, PaloAlto, CA, USA) of EF [9]. At the same time, the pH values of culture medium were tested with a pH meter (pHSJ-3F, Aerospace Computer Co., Qingdao, China). One portion (10 mL) of culture medium was stored at −20 °C, and used to determine total volatile fatty acid (TVFA) and ammonia-nitrogen (NH3-N) concentrations. For TVFA and NH3-N determination, the rumen fermentation fluids medium was centrifuged at a speed of 13,000× g for 10 min. The TVFA were determined on the gas chromatograph (Agilent 6850, Agilent Technologies) containing the flame ionization detector and the polarizing capillary chromatographic column (30 m × 0.25 mm × 0.25 μm) [20]. The quantification of NH3-N in a supernatant was carried with the continuous flow analysis (SKALAR San++) [21]. The second portion (10 mL) was stored at −80 °C for subsequent DNA extraction and amplicon sequencing.

2.4. DNA Extraction and Sequencing

In order to study the microbial community in the fermentation medium, we extracted DNA using the NucleoSpin 96 DNA Kit (MN). Amplification and sequencing were performed according to the reported procedures [22]. High-throughput sequencing using 16S rDNA had analyzed the guts microbial community structure. All the operation processes, including the rumen fluid DNA extraction and amplification, library construction and sequencing, and data analysis were performed by Biomarker Technologies Corporation, Beijing, China. The rumen bacterial 16S rDNA genes were amplified using barcoded conserved bacterial primers 338F (5′-ACTCCTACGGGAGGCAGCA-3′) and 806R (5′-GGACTACHVGGGTWTCTAAT-3′) [23]. A MiSeq DNA sequencing platform Illumina HiSeq 2500 sequenced the amplified library. In the Solexa PCR system (Biomarker Technologies Co., Ltd., Beijing, China), the total volume of each reaction was 20 μL. It contained 0.5 μL full-type gold enzyme, 4 μL of each primer, 8 μL DNA template, 3 μL stock solution, and 4.5 μL ddH2O2. The cycle parameters are as follows: 98 °C for 2 min; 30 cycles of 98 °C for 30 s, 50 °C for 30 s, 72 °C for 1 min; and at 72 °C for 10 min. Note that all PCRs were carried out in 96-well plates (Applied Biosystems, Union City, CA, USA). PCR products were analyzed by ethidium bromide staining on 1.8% (w/v) agarose gel [24]. Then, the PCR products of each sample were purified with the PCR Omega DNA Purification kit (Omega Bio-Tek, Norwalk, CA, USA). After purification, all samples were collected at equimolar concentrations and paired end sequencing (2 × 250) was performed on the MiSeq platform (Illumina Inc., Norwalk, CA, USA). The amplicons containing ambiguous nucleotides, amplicons with a quality score of < 20 and those that lacked complete primer sequences and bar codes were not considered for sequencing reading for further analysis. Related indexes such as bacterial community indices, operational taxonomic unit (OTU) richness, alpha diversity indices (Chao1, Shannon, and Ace), beta diversity, clustering, and principal component analysis (PCA) were analyzed using QIIME, UniFrac distance matrices software, all at BMK Cloud (www.biocloud.net, accessed on 11 January 2020). For linear discriminant analysis (LDA), the statistical differences between different treatments with LDA scores greater than 4, and the redundancy analysis (RDA) between rumen environmental characteristics and the composition of the microbial communities in the guts were performed. The phylogenetic investigation of the community was studied by reconstruction of unobserved states (PICRUSt) analysis (http://picrust.github.io/picrust/, accessed on 3 January 2021), used to predict the effect of EF addition levels changes [25]. Under the accession numbers PRJNA656074, the DNA sequences employed in the current study were deposited in the Sequence Read Achieve (SRA) of NCBI database.

2.5. Calculations and Statistical Analyses

The percentage of the difference between the initial DM value of the culture substrate and after 48 h in the initial DM was considered as the digestibility of dry matter (DDM). Meanwhile, the exponential equation described by Ørskov and McDonald [26] was used to analyze the kinetics of GP. The equation was as follows: GP = a + b × (1 − e−ct), where GP is gas production at time t, e is the natural logarithm, a is the volume of gas produced by rapid fermentation (in mL), b is the volume of gas produced by slow fermentation (in mL), c is the gas production (% h) constant of fraction b (in mL per h), a + b is the potential gas production (in mL), and t is the incubation time (h). One-way analysis of variance (ANOVA) by using SPSS 21.0 (SPSS, Chicago, IL, USA) with different addition levels of EF, were analyzed to distinguish significant differences between different treatments. Duncan’s method was used to confirm the statistical significance of differences for the multiple comparisons. The means were compared in different treatments using Duncan’s method (p < 0.05), which has been used for the biological experiments with large test errors. Effects of linear and quadratic due to different addition levels of EF were determined by polynomial comparison. Using the Mantel test based on Spearman’s product moment correlation, the alpha diversity of the sheep rumen microbial community with different addition levels of EF was analyzed.

3. Results

3.1. Digestibility of DM, GP, and Fermentation Characteristics

Significant differences were observed in DDM, GP, a + b, a, b, and c (p < 0.05) for 48 h of different treatments in Table 2. There were also significant differences in NH3-N, TVFA, acetate, propionate, valerate, isobutyrate, butyrate, and isovalerate among the different treatments (p < 0.05) in Table 3.

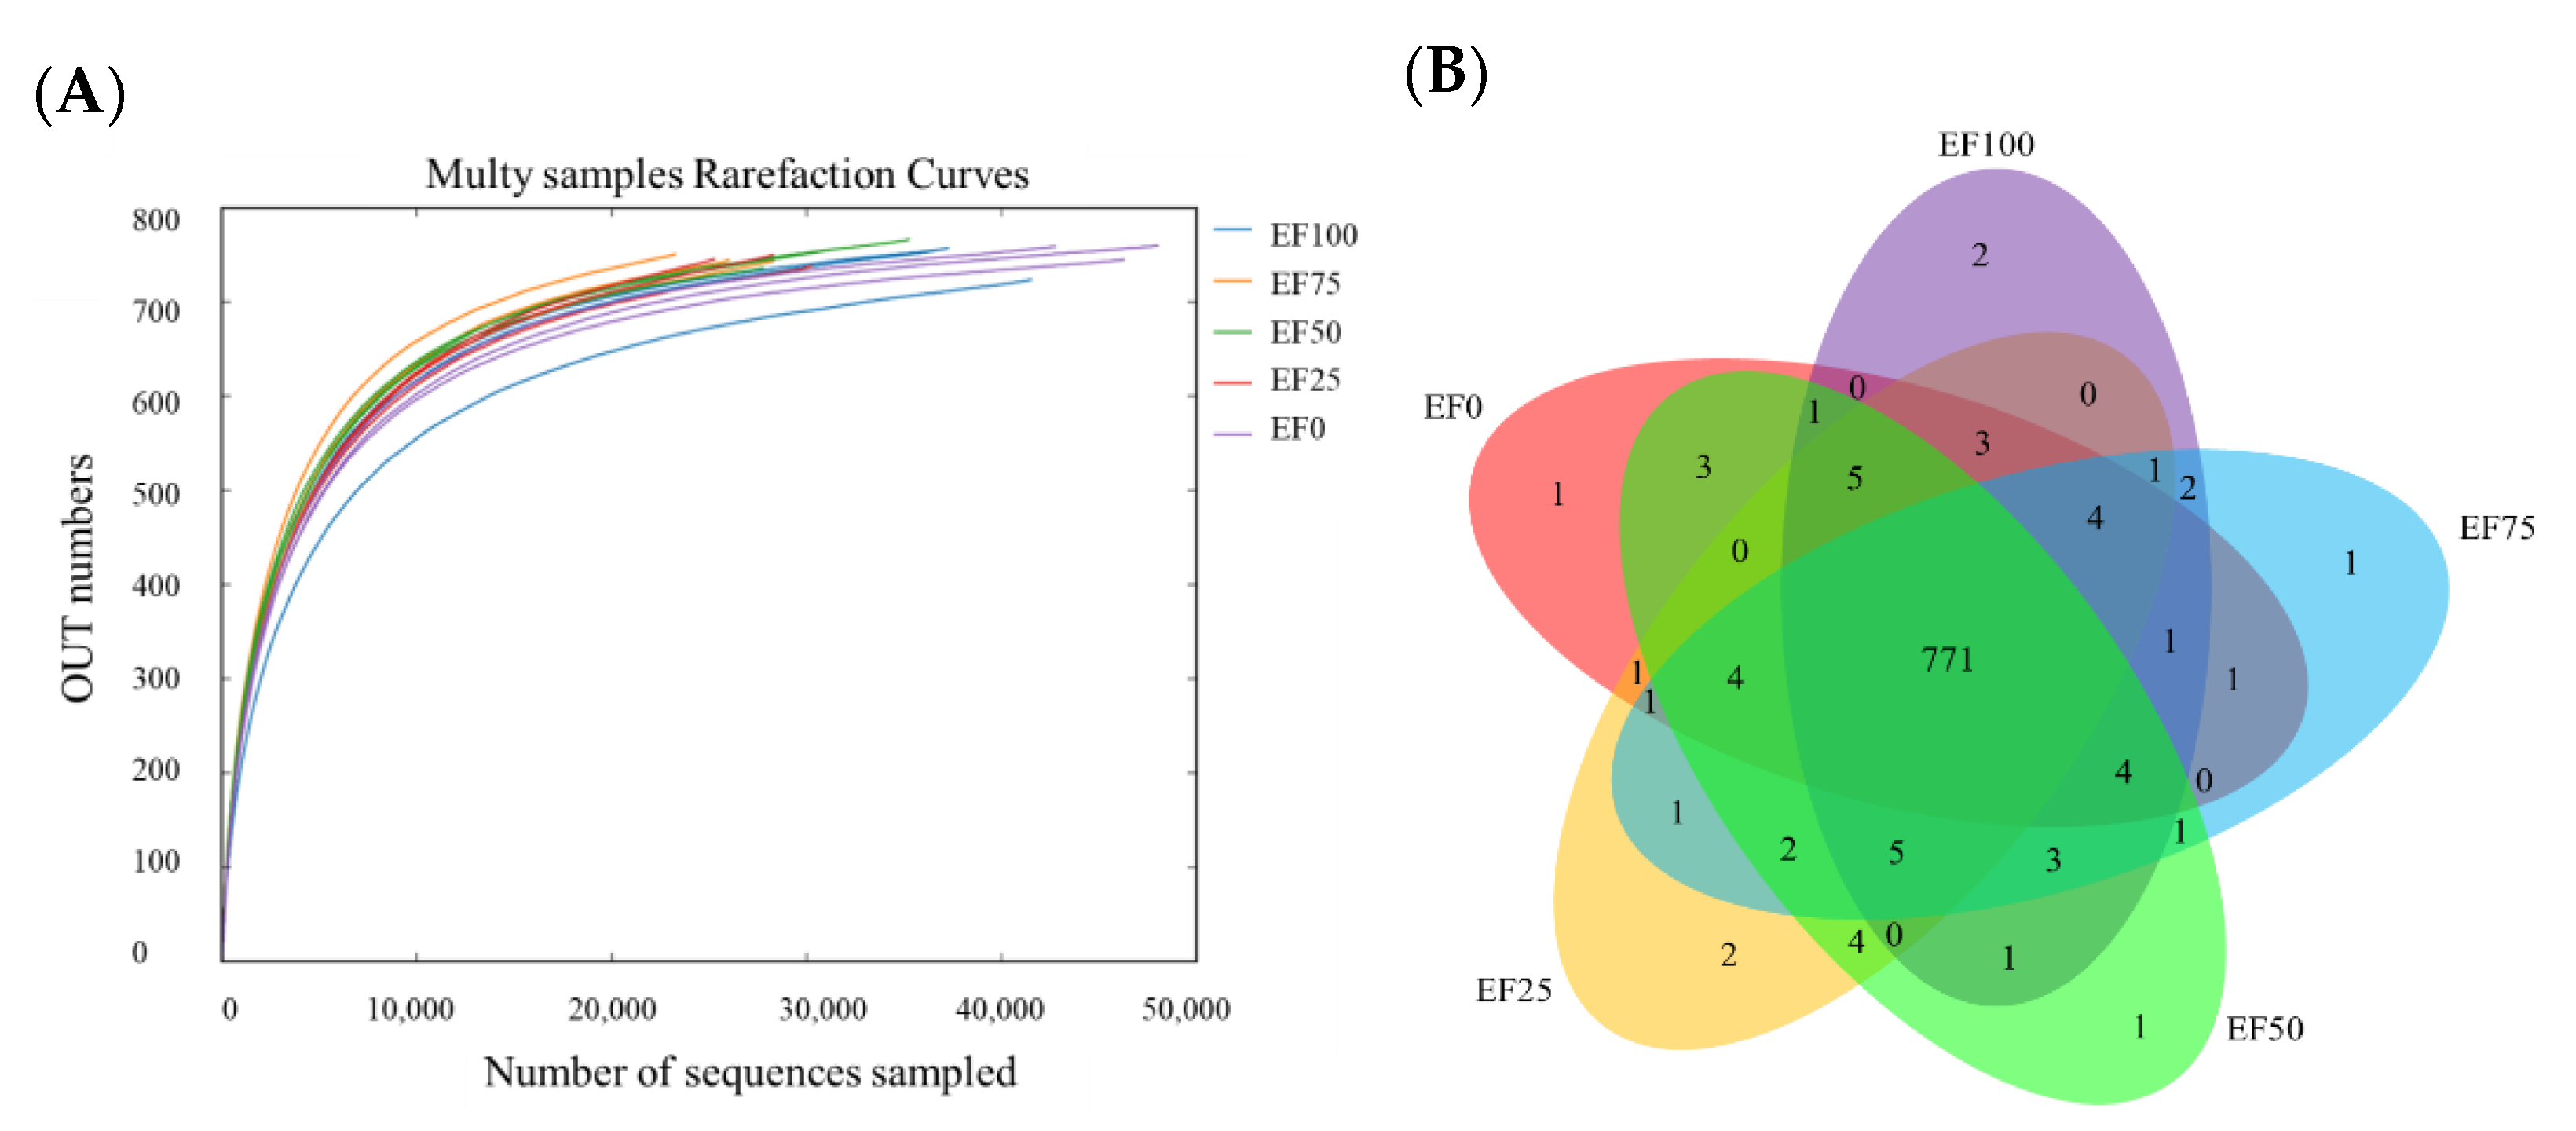
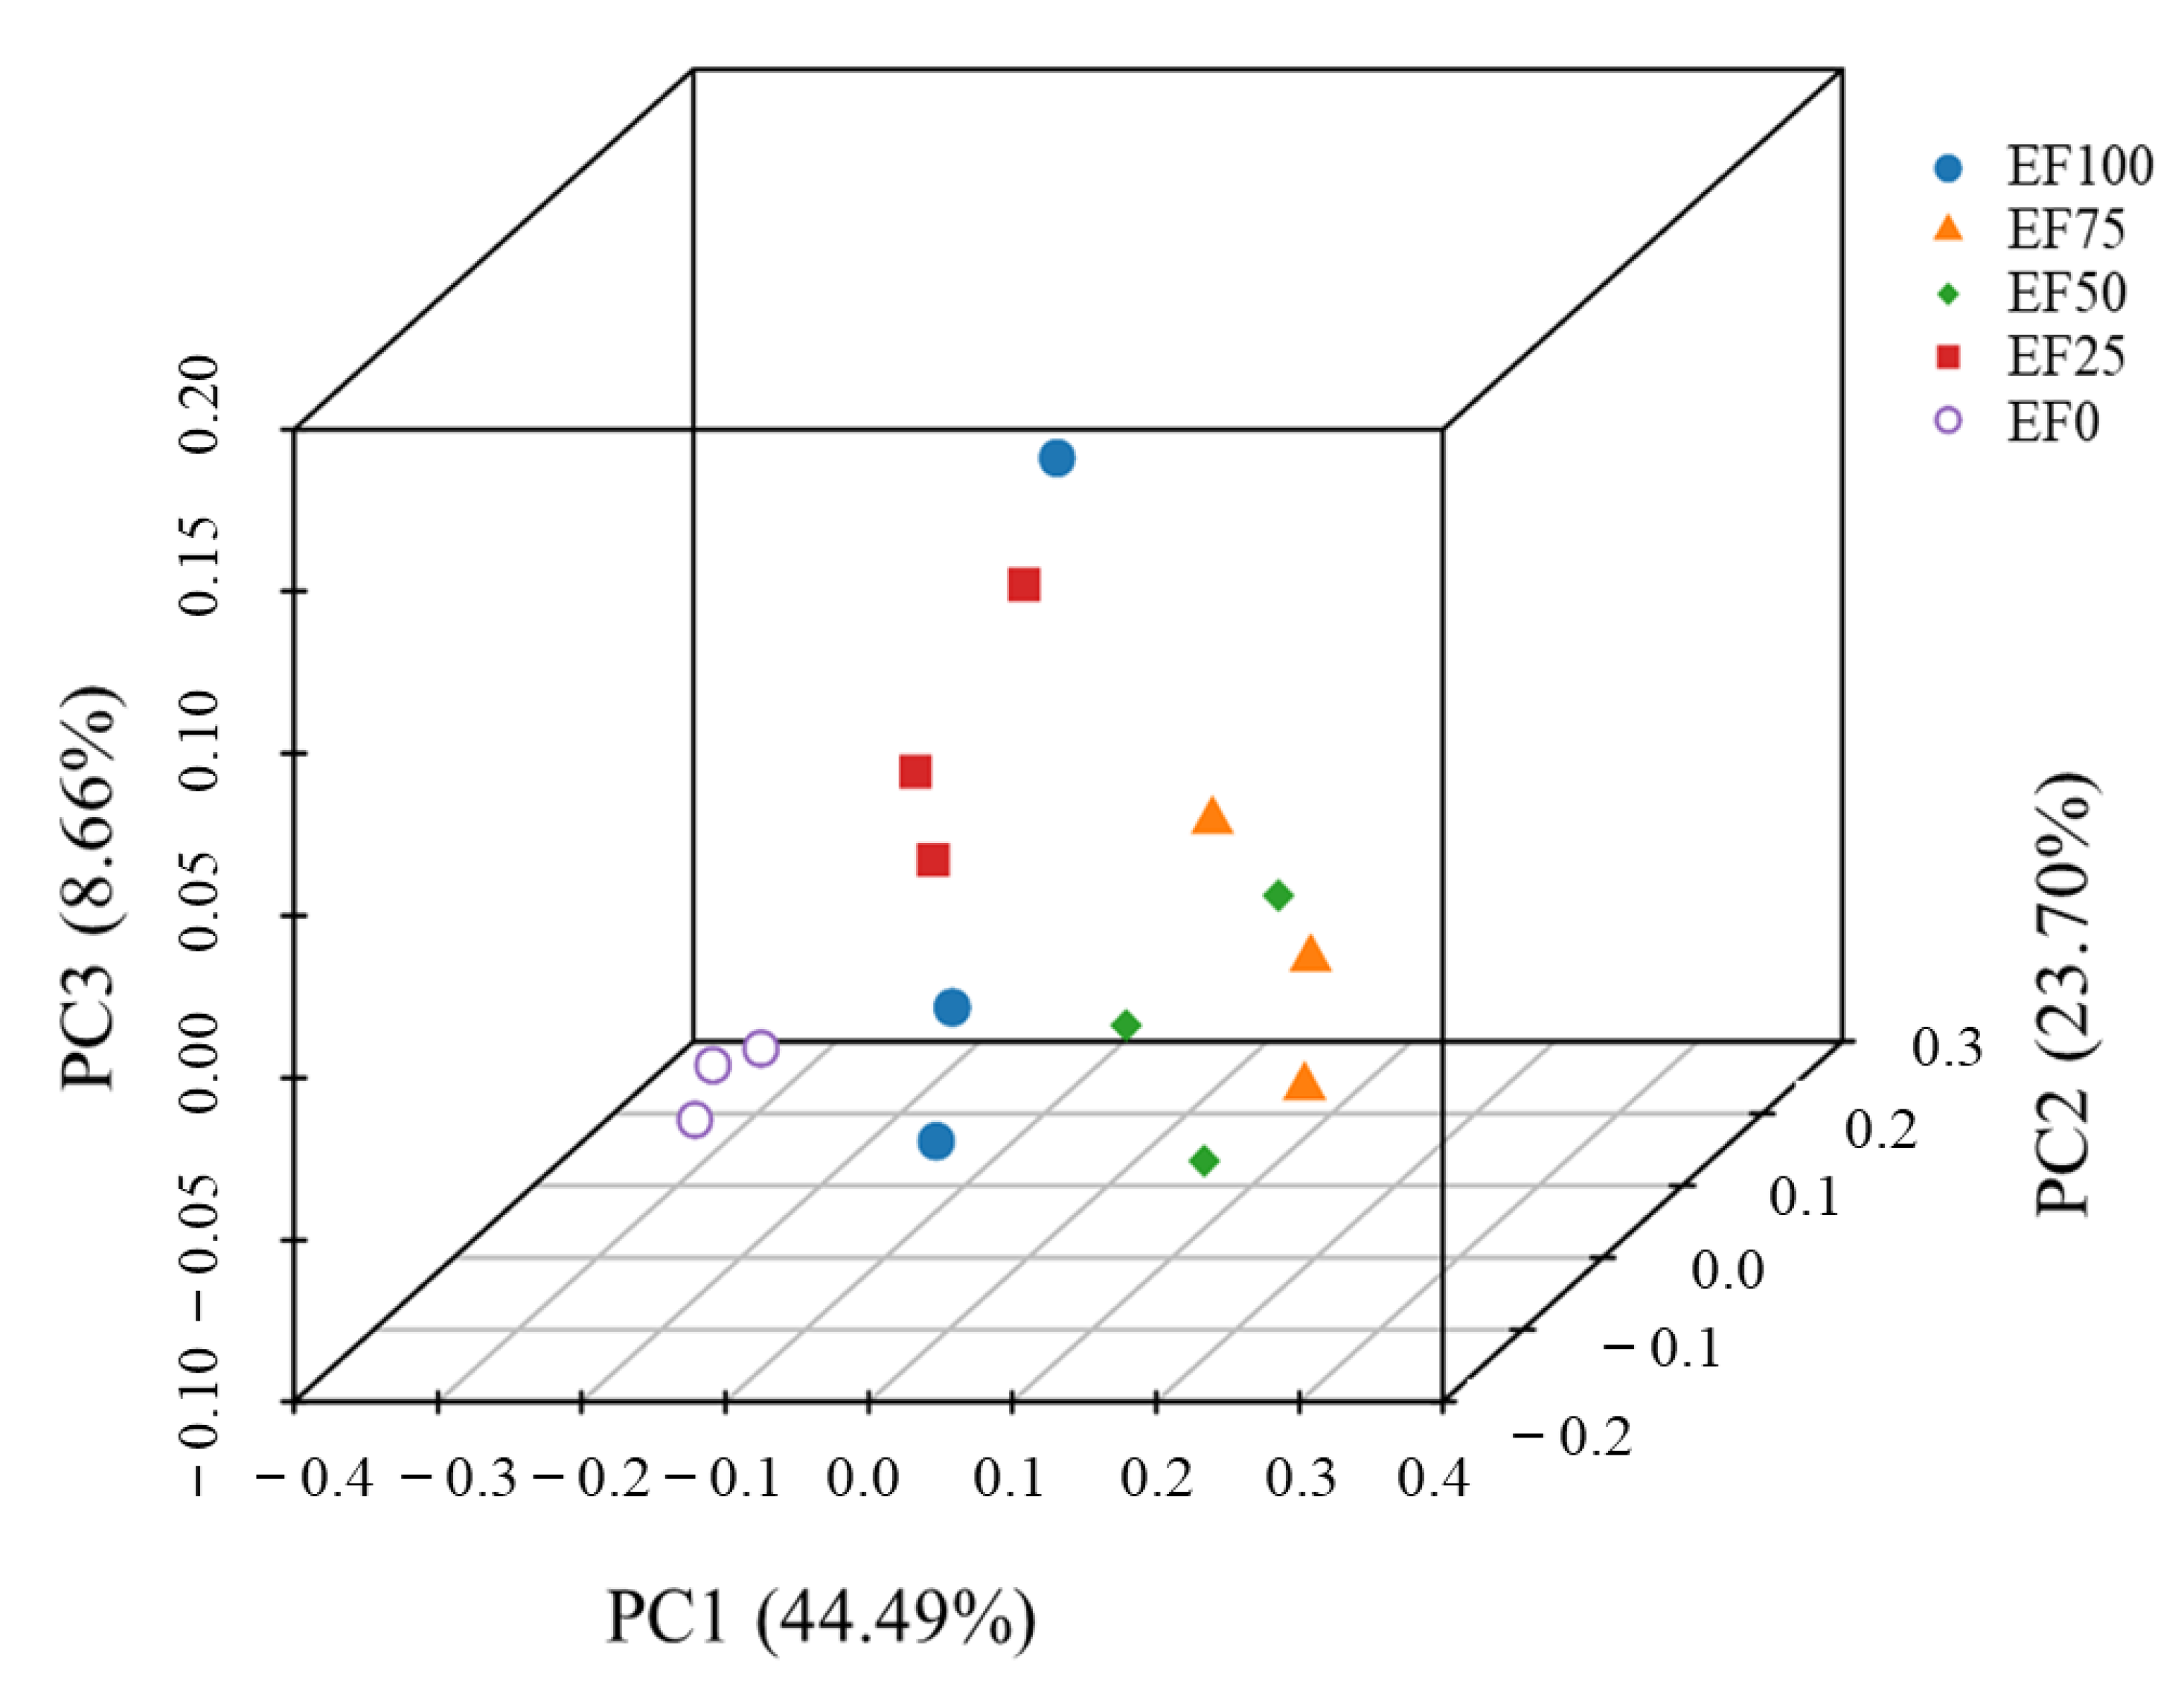
3.2. Diversity of Rumen Microbiota Community in the Sheep

The different treatments on the ACE index, and Chao1 index of the sheep rumen microbiota showed no significant effects (p > 0.05); however, the ACE (779.18) and Chao1 index (787.71) were higher in EF25 than in other treatments. The Shannon indexes were increased linearly with EF addition ratio (p < 0.05), and the value (5.08) was higher in EF75 than other treatments (Table 4).

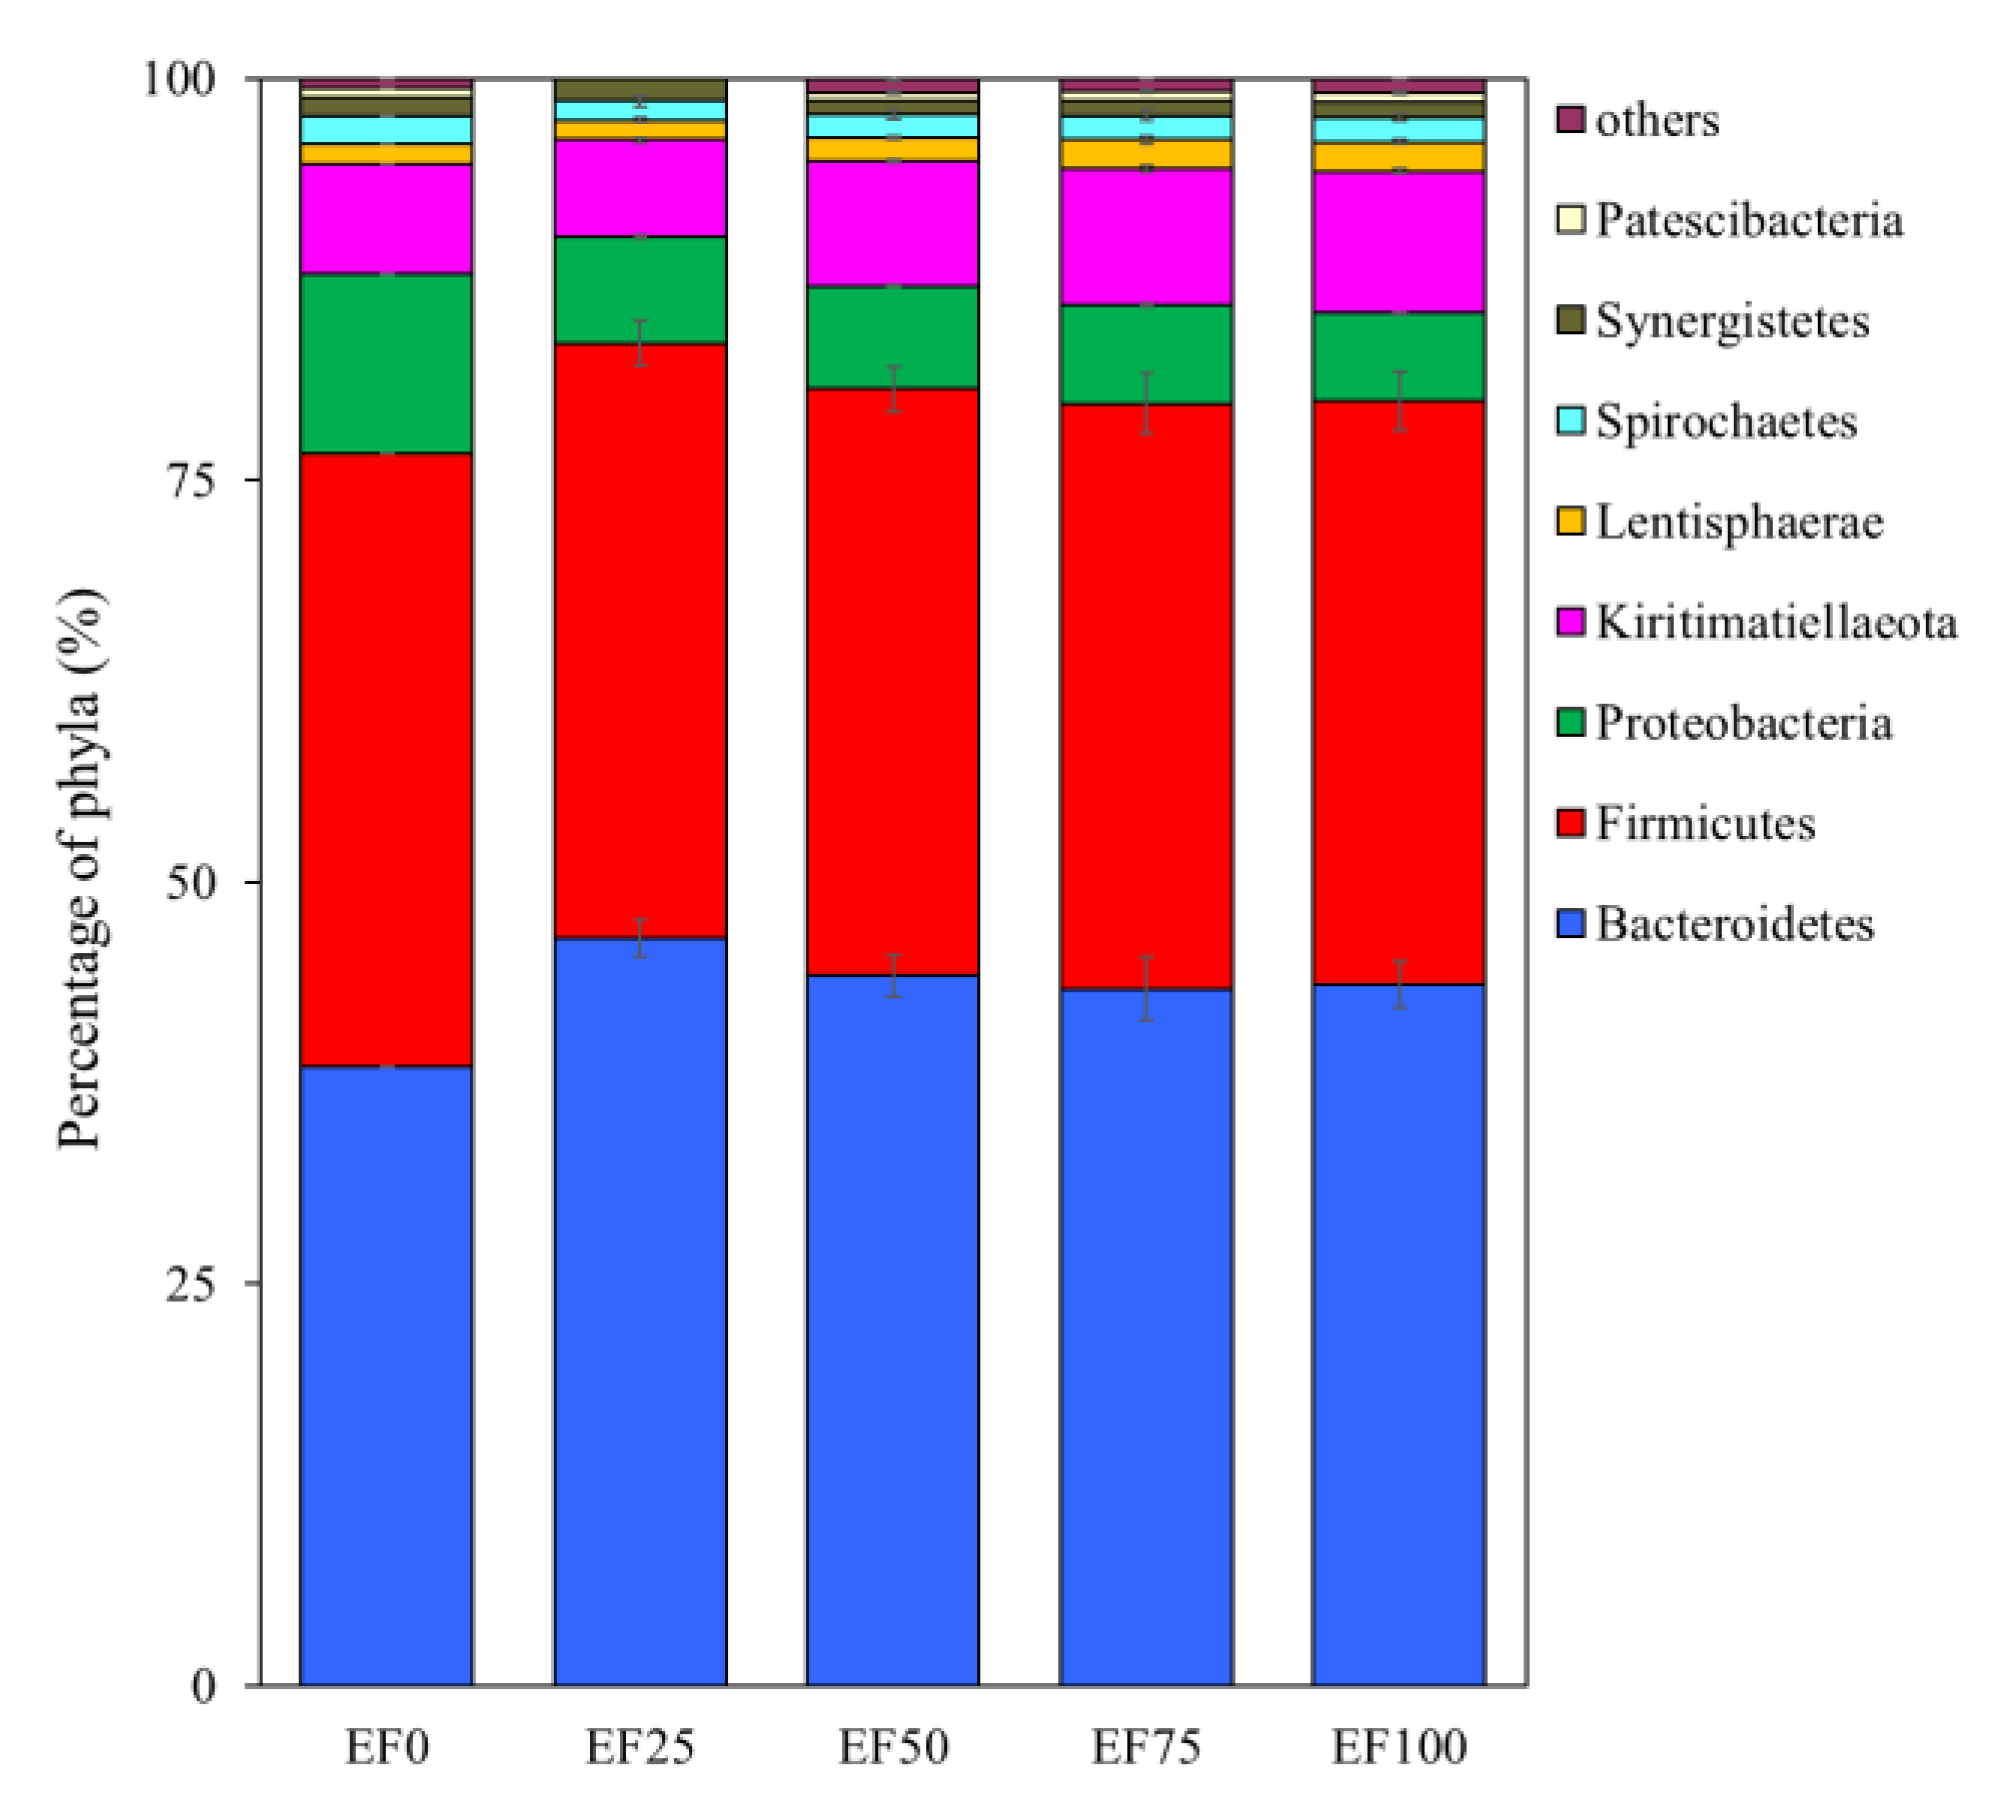
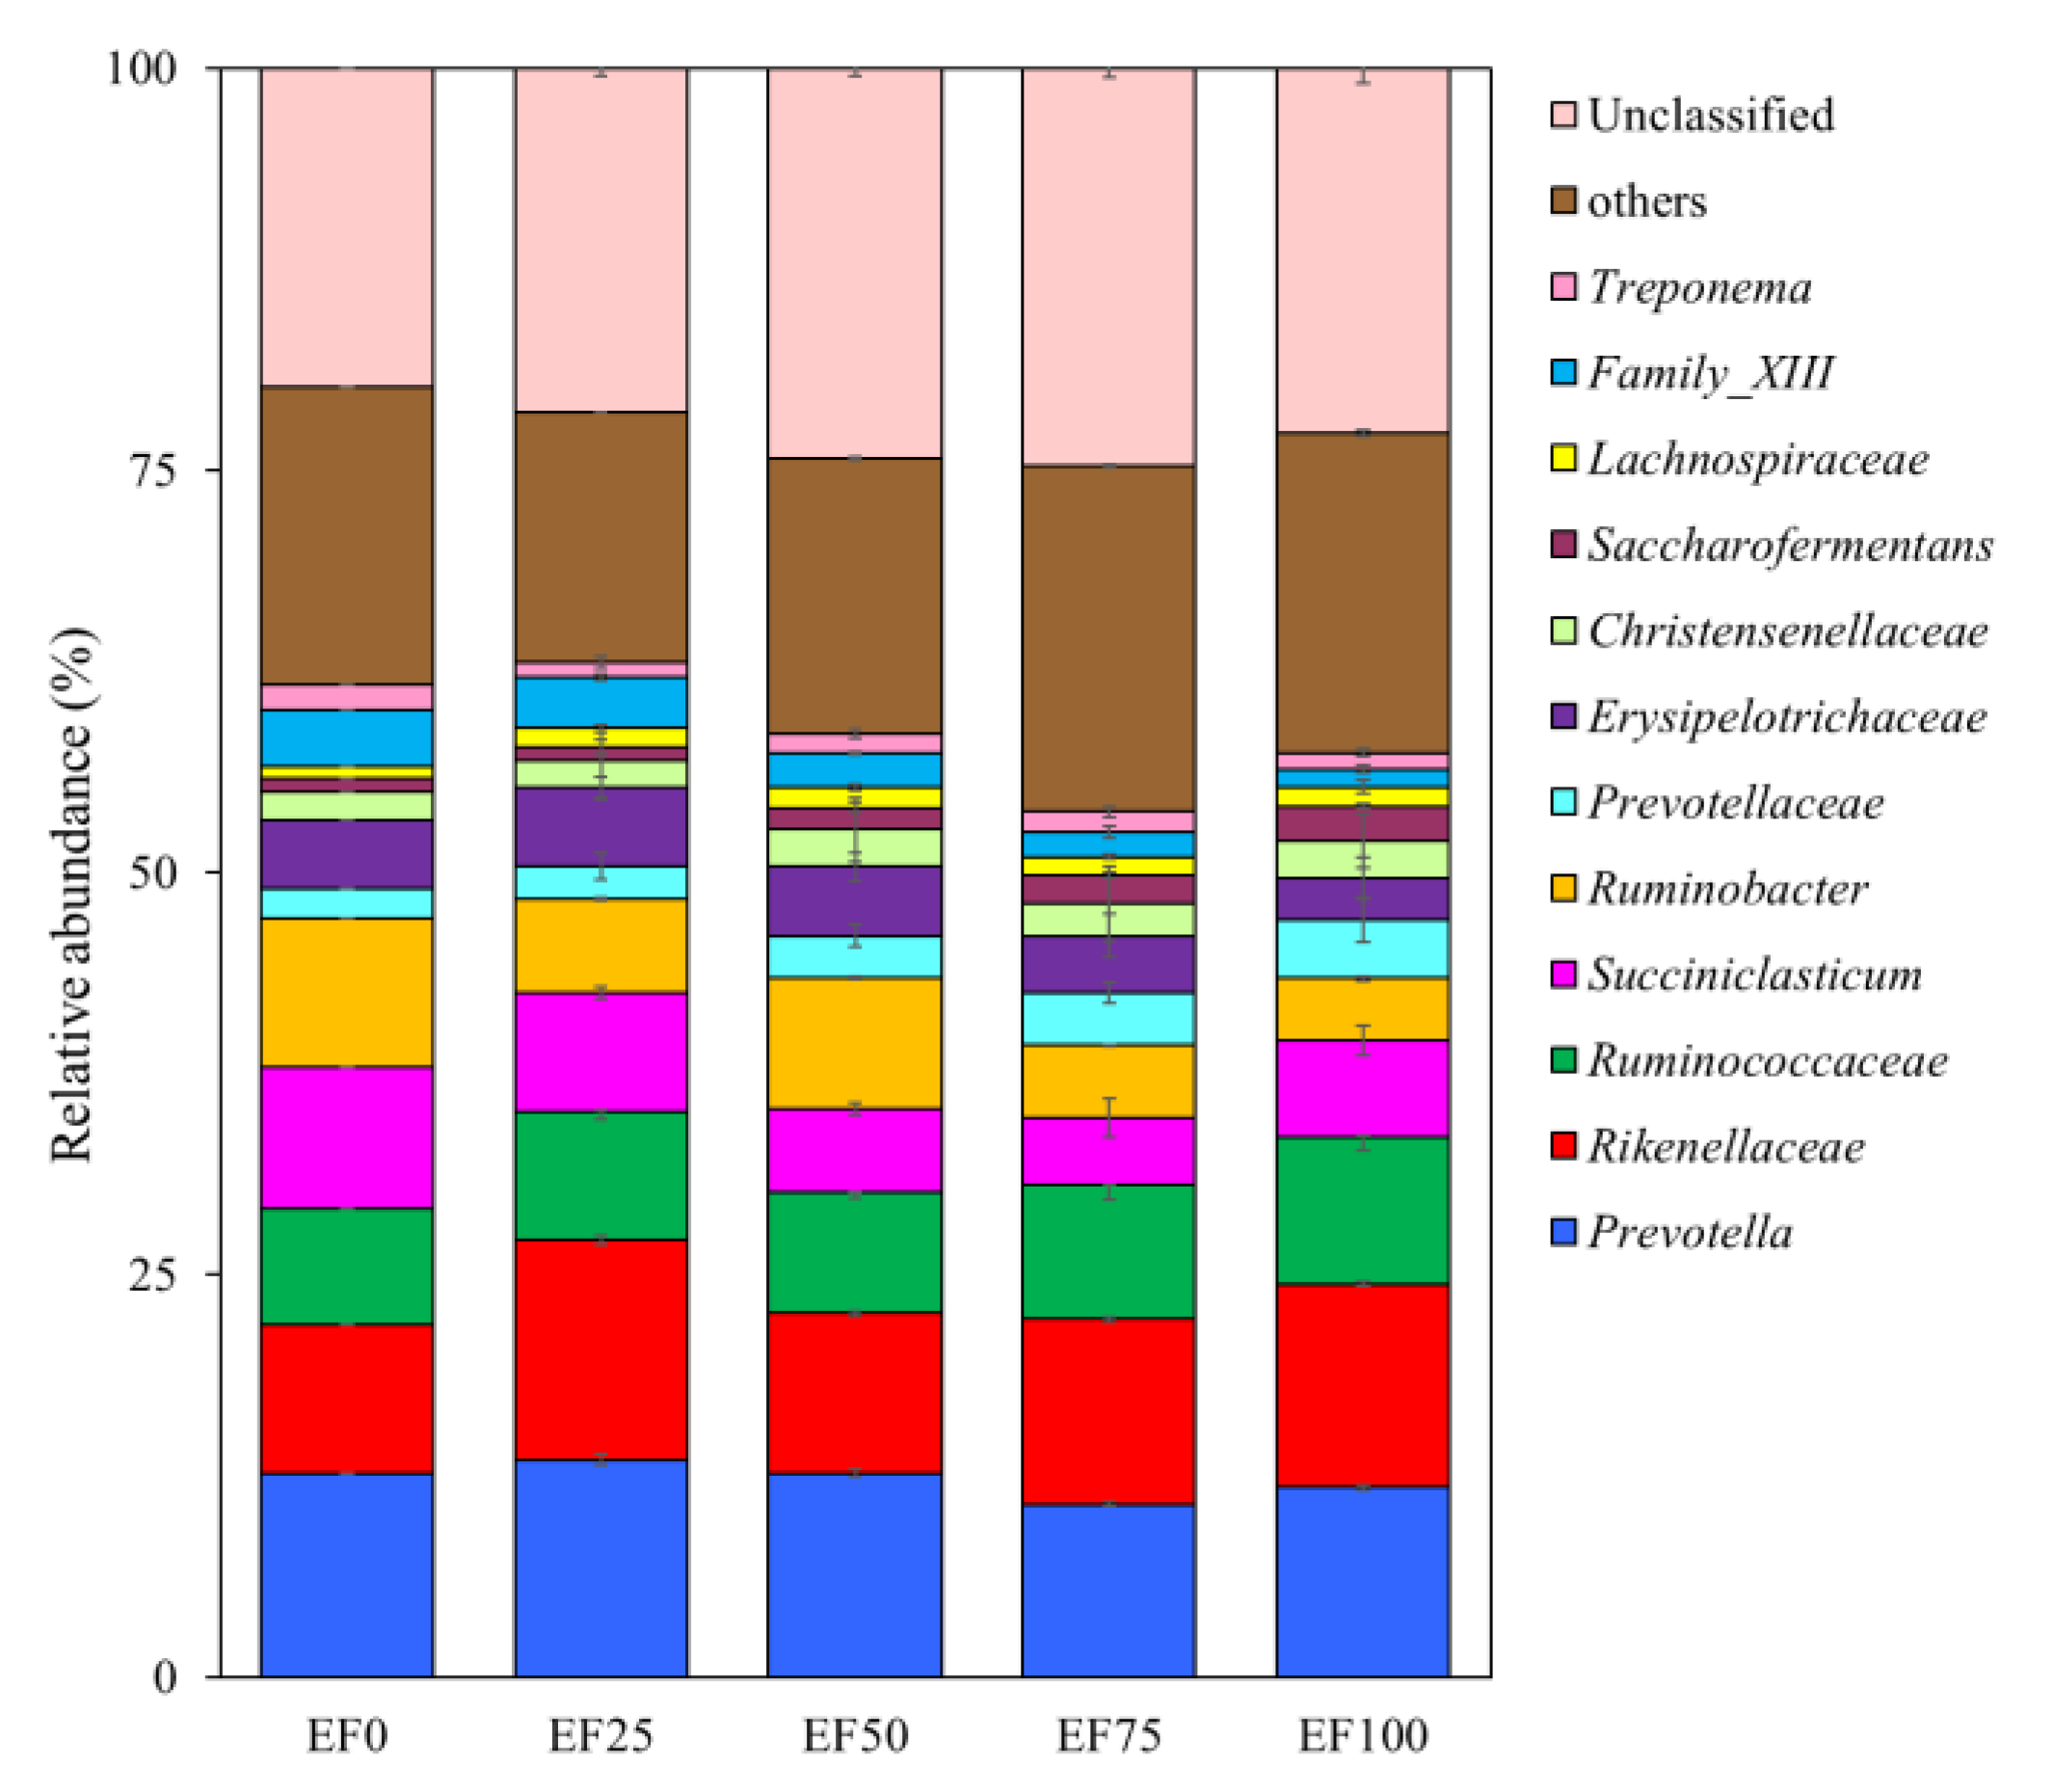
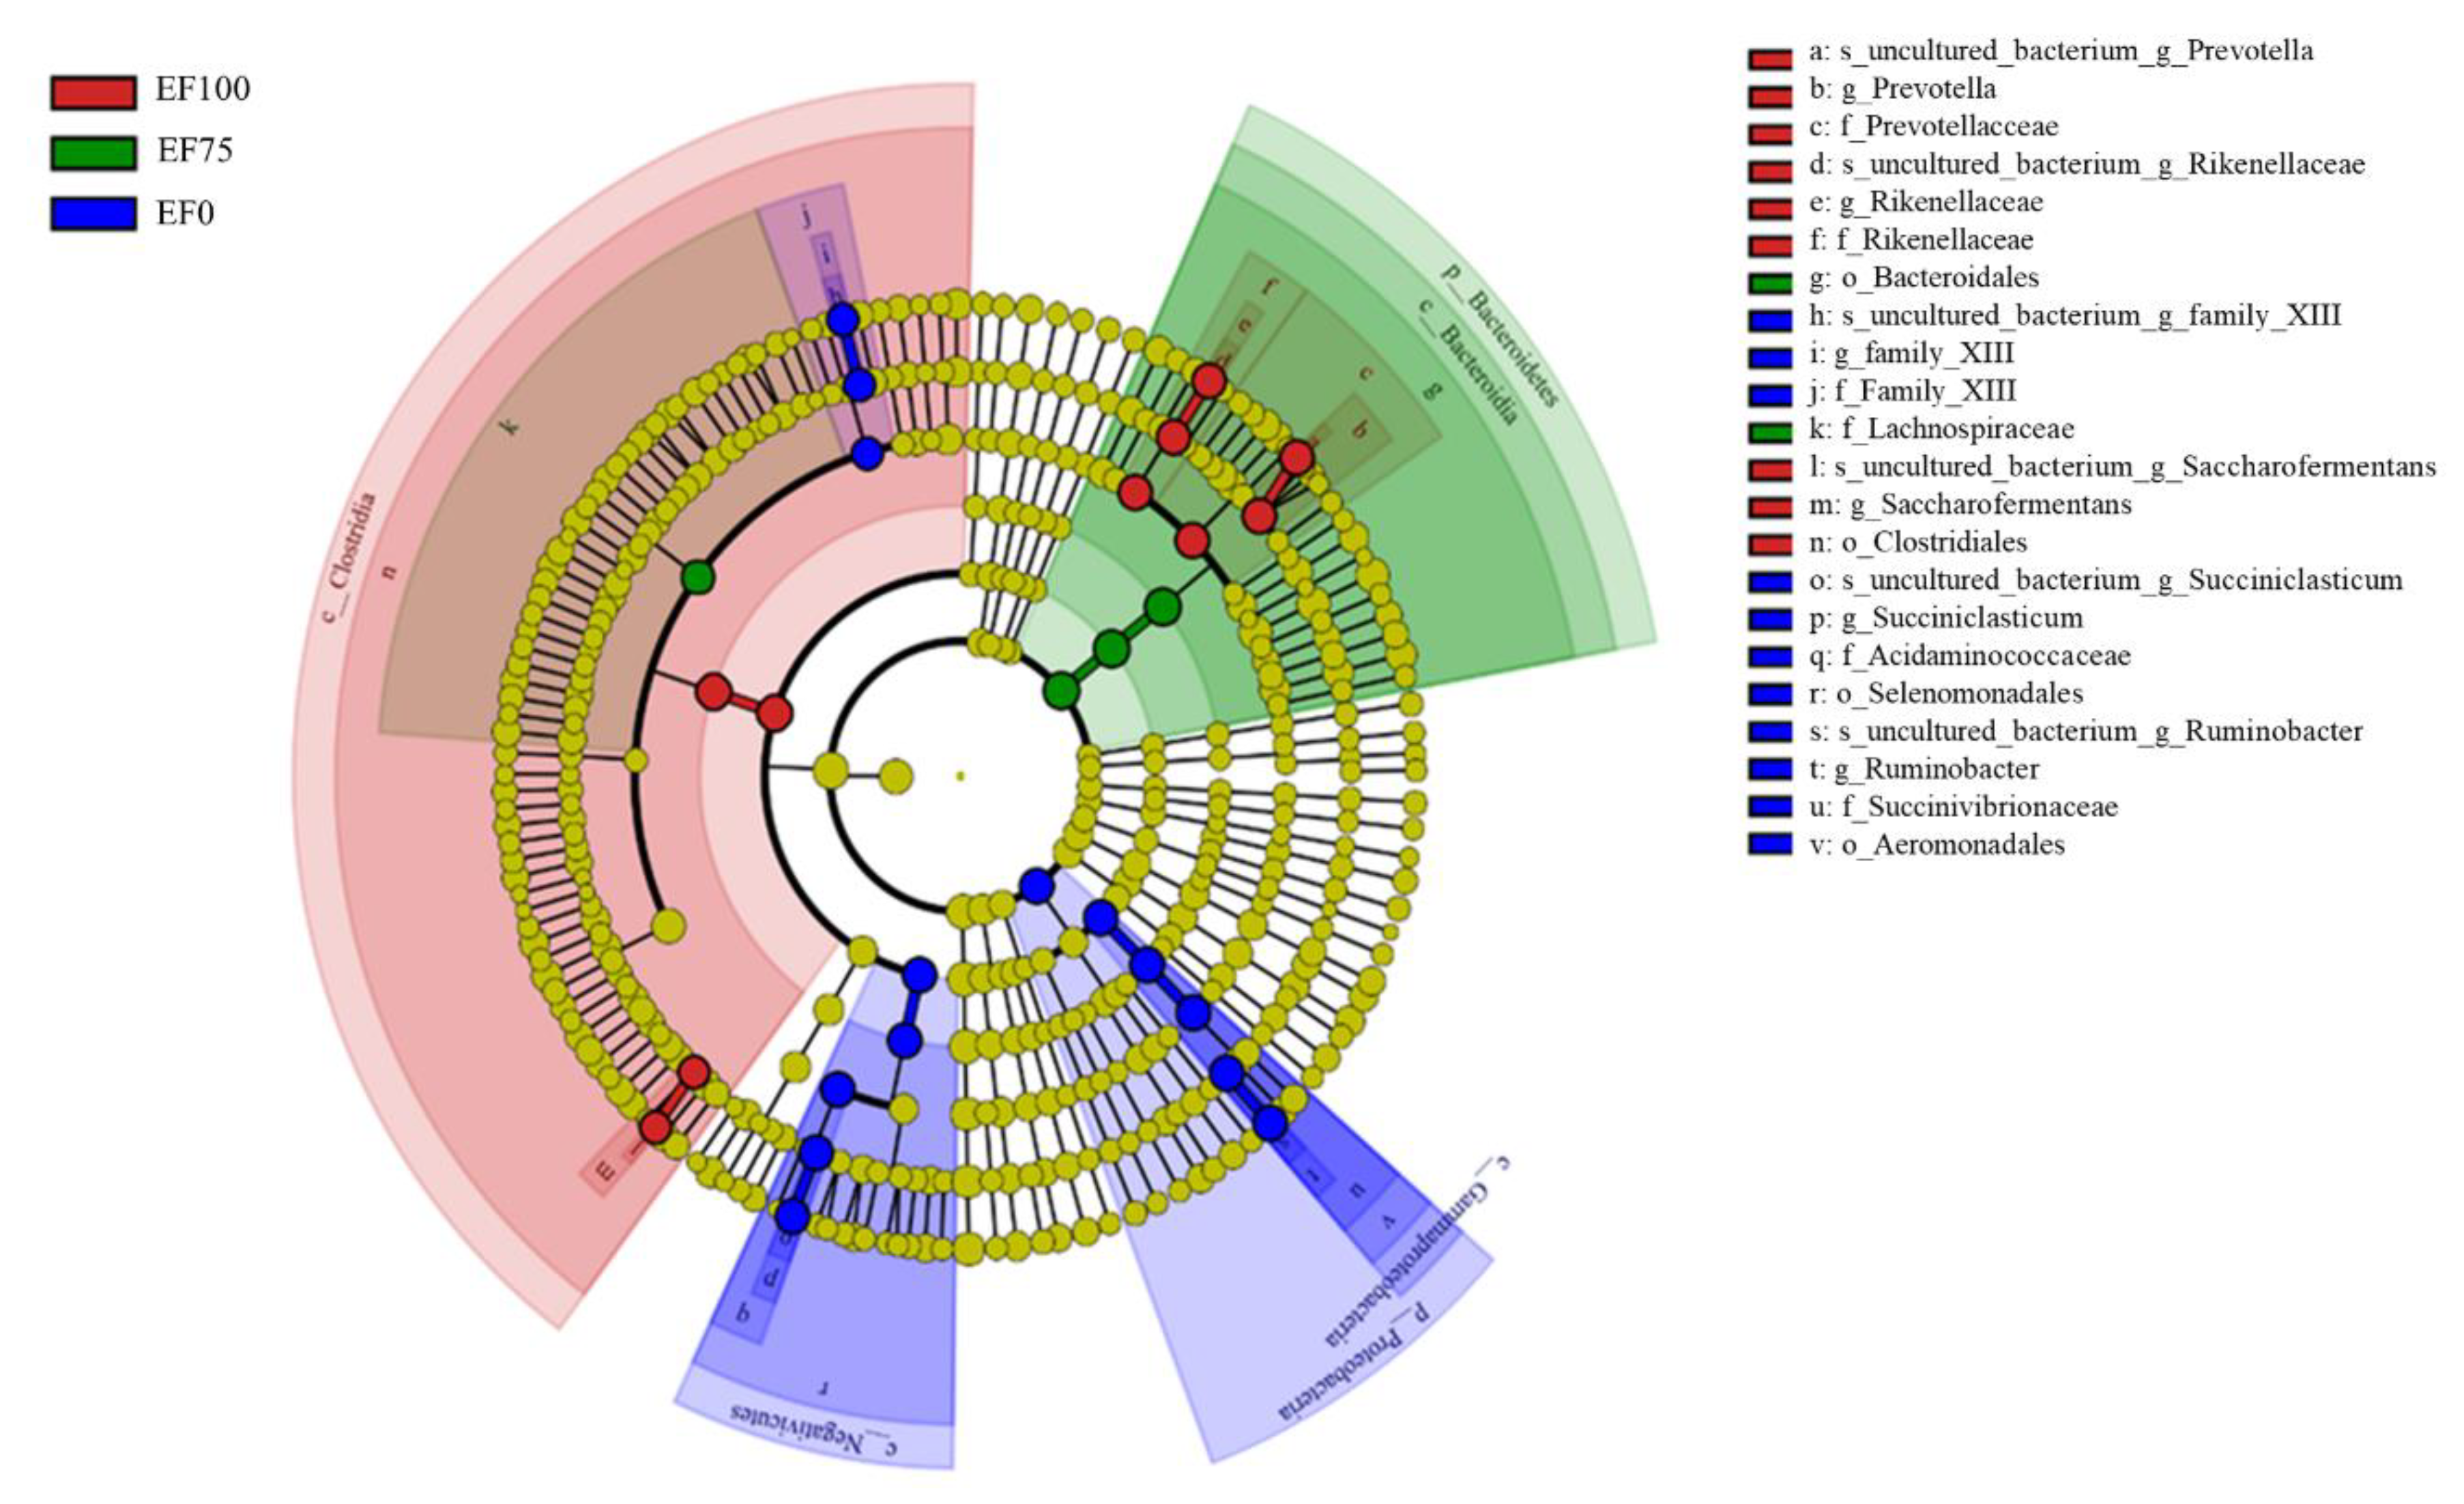
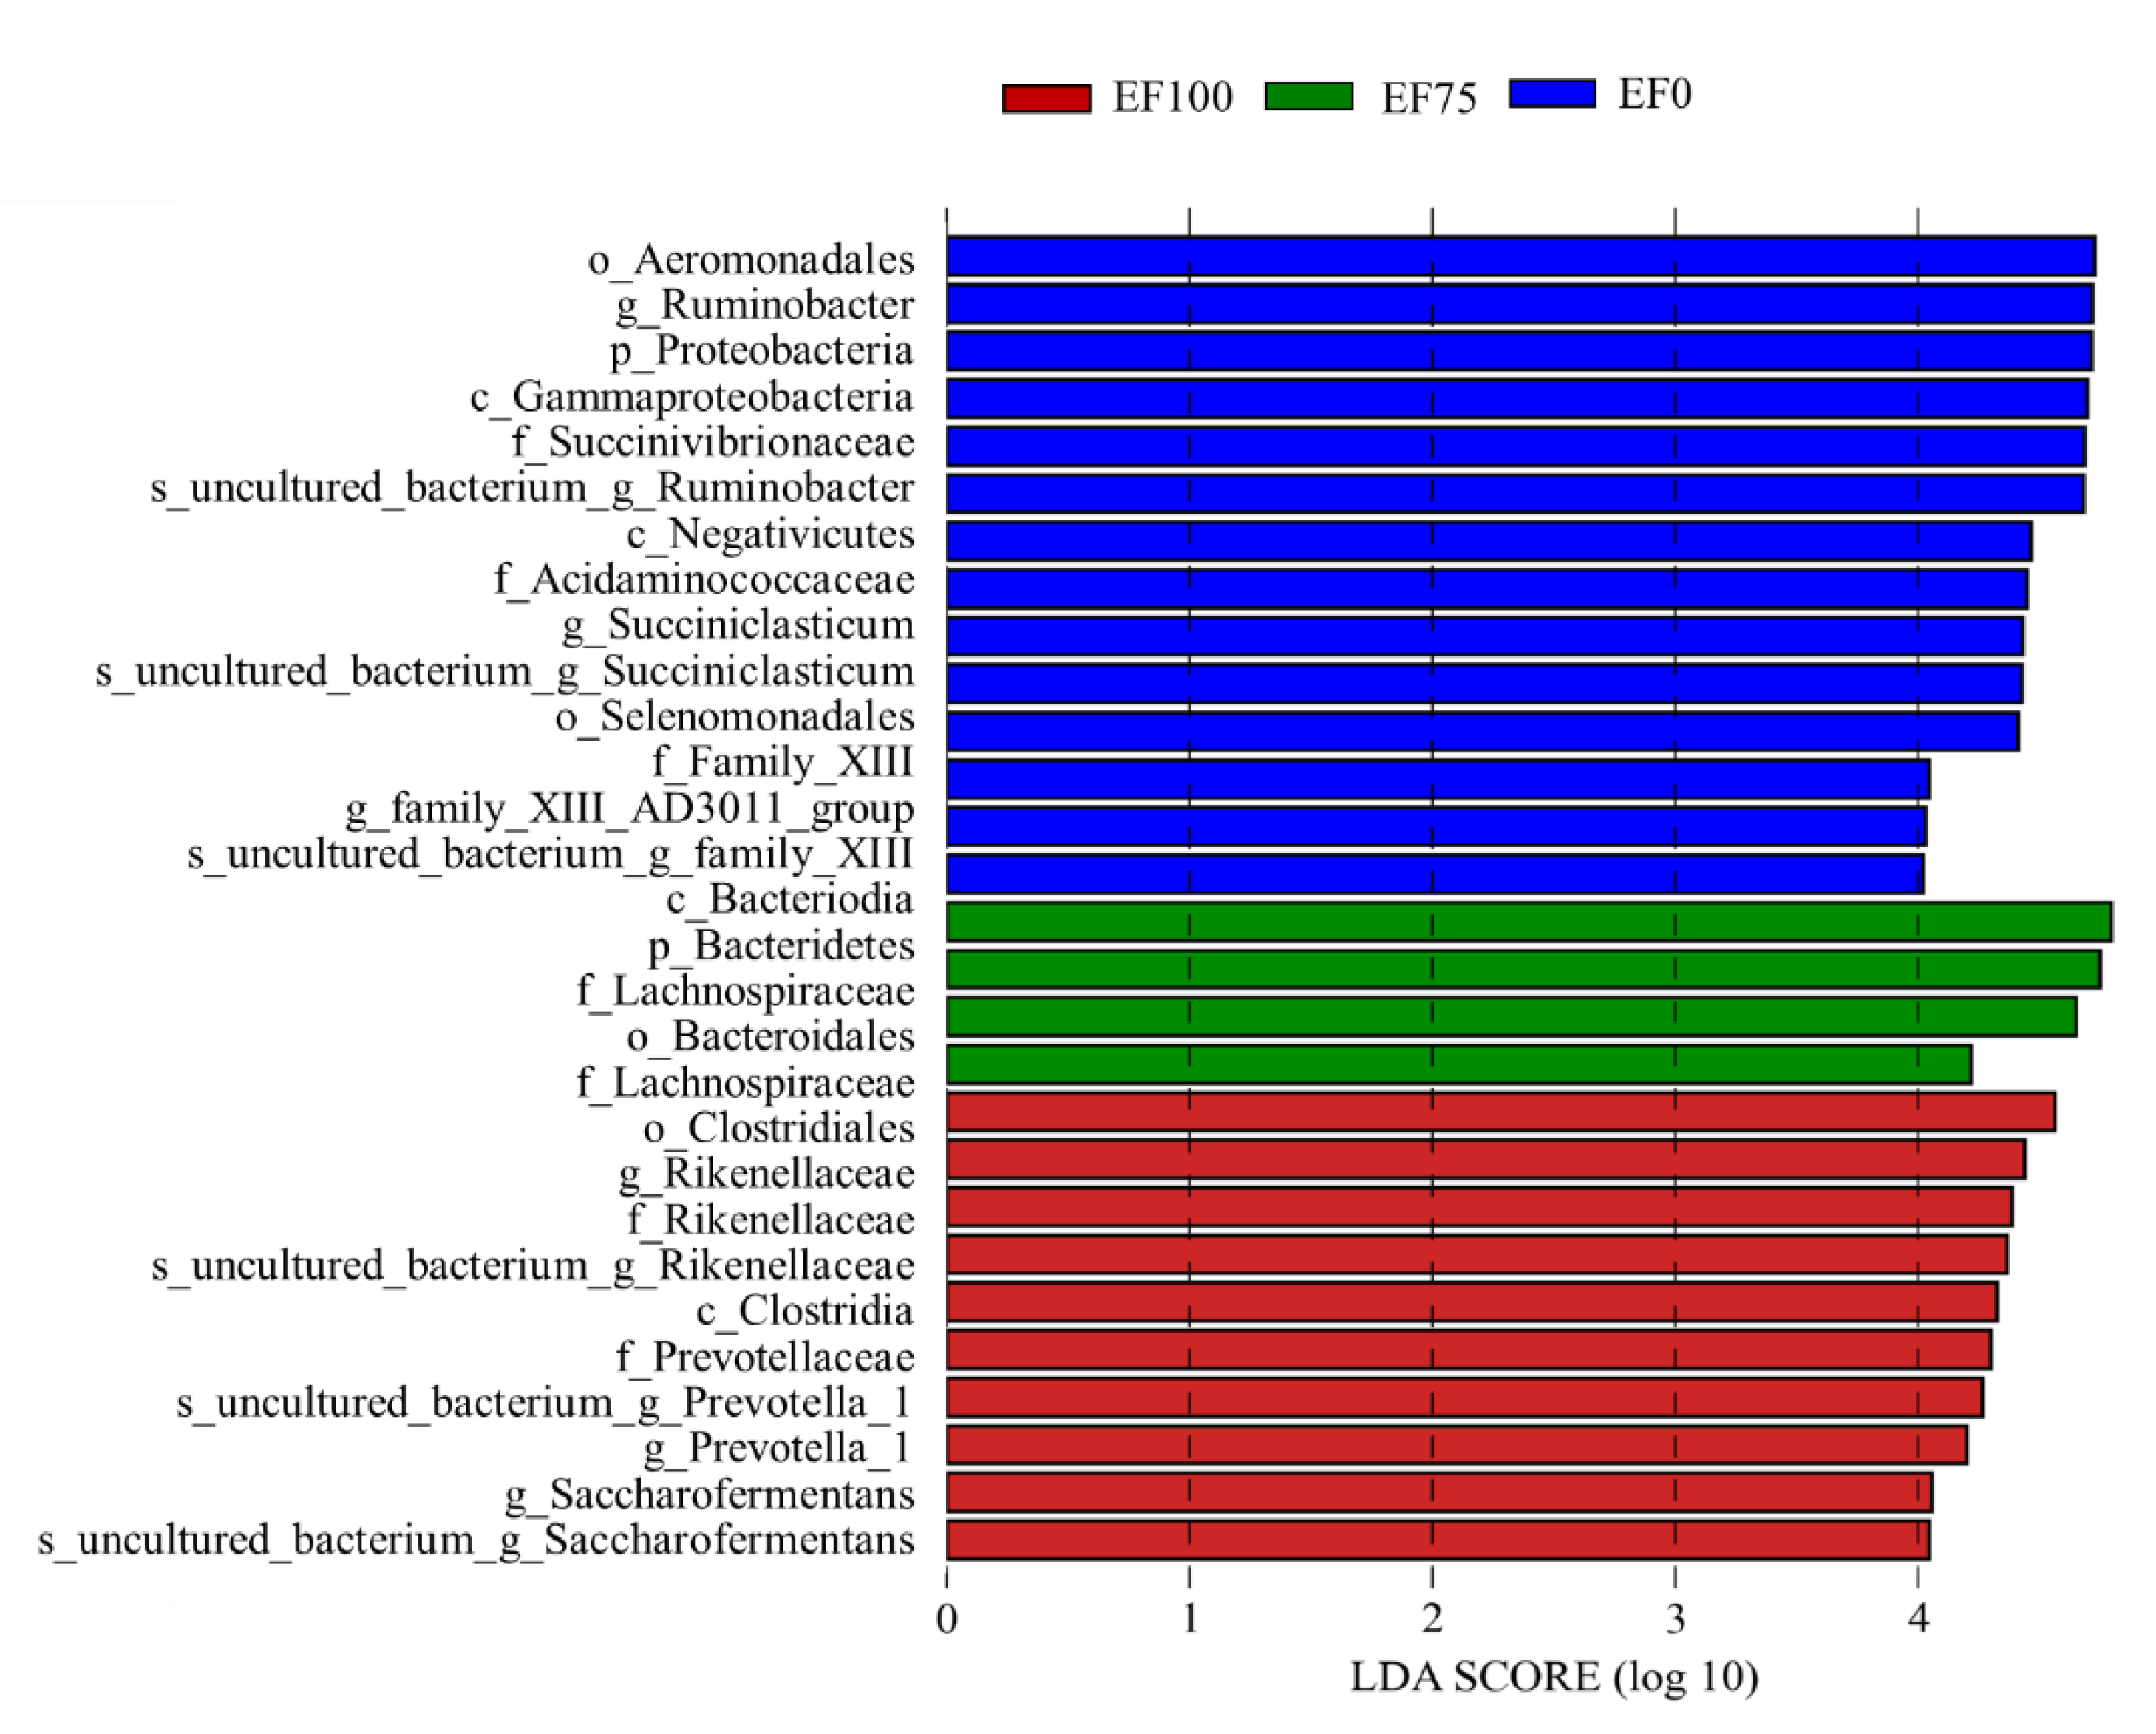
3.3. Composition of the Rumen Microbiota Community in the Sheep

After sequencing and normalization procedures, an average of 34,828 sequences per sample was obtained in 1,044,842 sequences from the 15 samples. A total of 805 OTUs were obtained at the 99.82% sequence similarity. Operational taxonomic units were assigned to 1 kingdom, 17 phyla, 26 classes, 34 orders, 55 families, 131 genera and 141 species. The sample rarefaction curve (Figure 1A) show that the sequencing volume is sufficient, and the sequencing depth is saturated, and increasing the sample volume will not produce more OTUs. As shown in Figure 1B, the 805 OTUs were detected in EF50 samples, 804 OTUs in EF25, 803 OTUs in EF100, 802 OTUs in EF75, 799 OTUs in EF0, and 771 “core” OTUs were present in samples from all EF treatments.
At the phylum level (Figure 2), the Kiritimatiellaeota (8.83% of total reads), Lentisphaerae (1.82% of total reads), and Patescibacteria (0.61% of total reads) were more abundant with EF100 than with other treatments. The Bacteroidetes (46.52% of total reads), and Synergistetes (1.39% of total reads) were more abundant with EF25 than with other treatments. The Firmicutes (38.10% of total reads), Proteobacteria (11.20% of total reads) and Spirochaetes (1.72% of total reads) were more abundant with EF0 than with other treatments.
At the genus level (Figure 3), the Ruminococcaceae (9.14% of total reads), Prevotellaceae (3.62% of total reads), and Saccharofermentans (2.18% of total reads) were more abundant with EF100 than with other treatments. The Christensenellaceae (2.32% of total reads) and Lachnospiraceae (1.28% of total reads) were more abundant with EF50 than with other treatments. The Prevotella (13.50% of total reads), Rikenellaceae (13.69% of total reads), and Erysipelotrichaceae (4.84% of total reads) were more abundant with EF25 than with other treatments. The Succiniclasticum (8.74% of total reads) and Ruminobacter (9.24% of total reads), Family_XIII (3.52% of total reads), and Treponema (1.51% of total reads) were more abundant with EF0 than with other treatments.
The PCoA scatter plot indicated that the abscissa and ordinate represent two characteristic values, which contributed to the maximum differences among the samples, and the influence degrees were 44.49%, 23.70% and 8.66% respectively (Figure 4). PERMANOVA analyses show that there were significant differences among groups (PERMANOVA: R2= 0.623, p = 0.001).
In order to find biomarkers with statistical differences between the groups, we used linear discriminant analysis (LDA), effect size (LEfSe), and screened various taxa at different levels (kingdom, phylum, class, order, family, genus, and species) between different groups according to standard LDA values greater than 4 (Figure 5). Meanwhile, we drew cladograms from phylum to genus to better understand the distribution of various taxa at different taxonomic levels (Figure 6). In EF0, the rumen microbiota of sheep had the most different taxa (LDA > 4), and there were fourteen taxa mainly concentrated in Proteobacteria and Firmicutes, of which six belonged to Proteobacteria, and the other eight belonged to Firmicutes. In EF100, ten taxa differed in which four belonged to Firmicutes, two belonged to Proteobacteria, and the other four belonged to Bacteroidetes. In EF75, four taxa differed in which three belonged to Bacteroidetes, and the other one belonged to Firmicutes.

3.4. Rumen Microbiome Metabolic Capacity

In present study, PICRUSt was used to predict the metabolic potential of the rumen microbiome (Table 5). The carbohydrate metabolism, energy metabolism, lipid metabolism, glycan biosynthesis and metabolism, and metabolism of terpenoids and polyketides were a linear increase in abundance with increasing levels of EF (p < 0.05). The global and overview maps, translation, replication and repair, membrane transport, and folding, sorting, and degradation were a linear decrease in abundance with increasing levels of EF (p < 0.05).

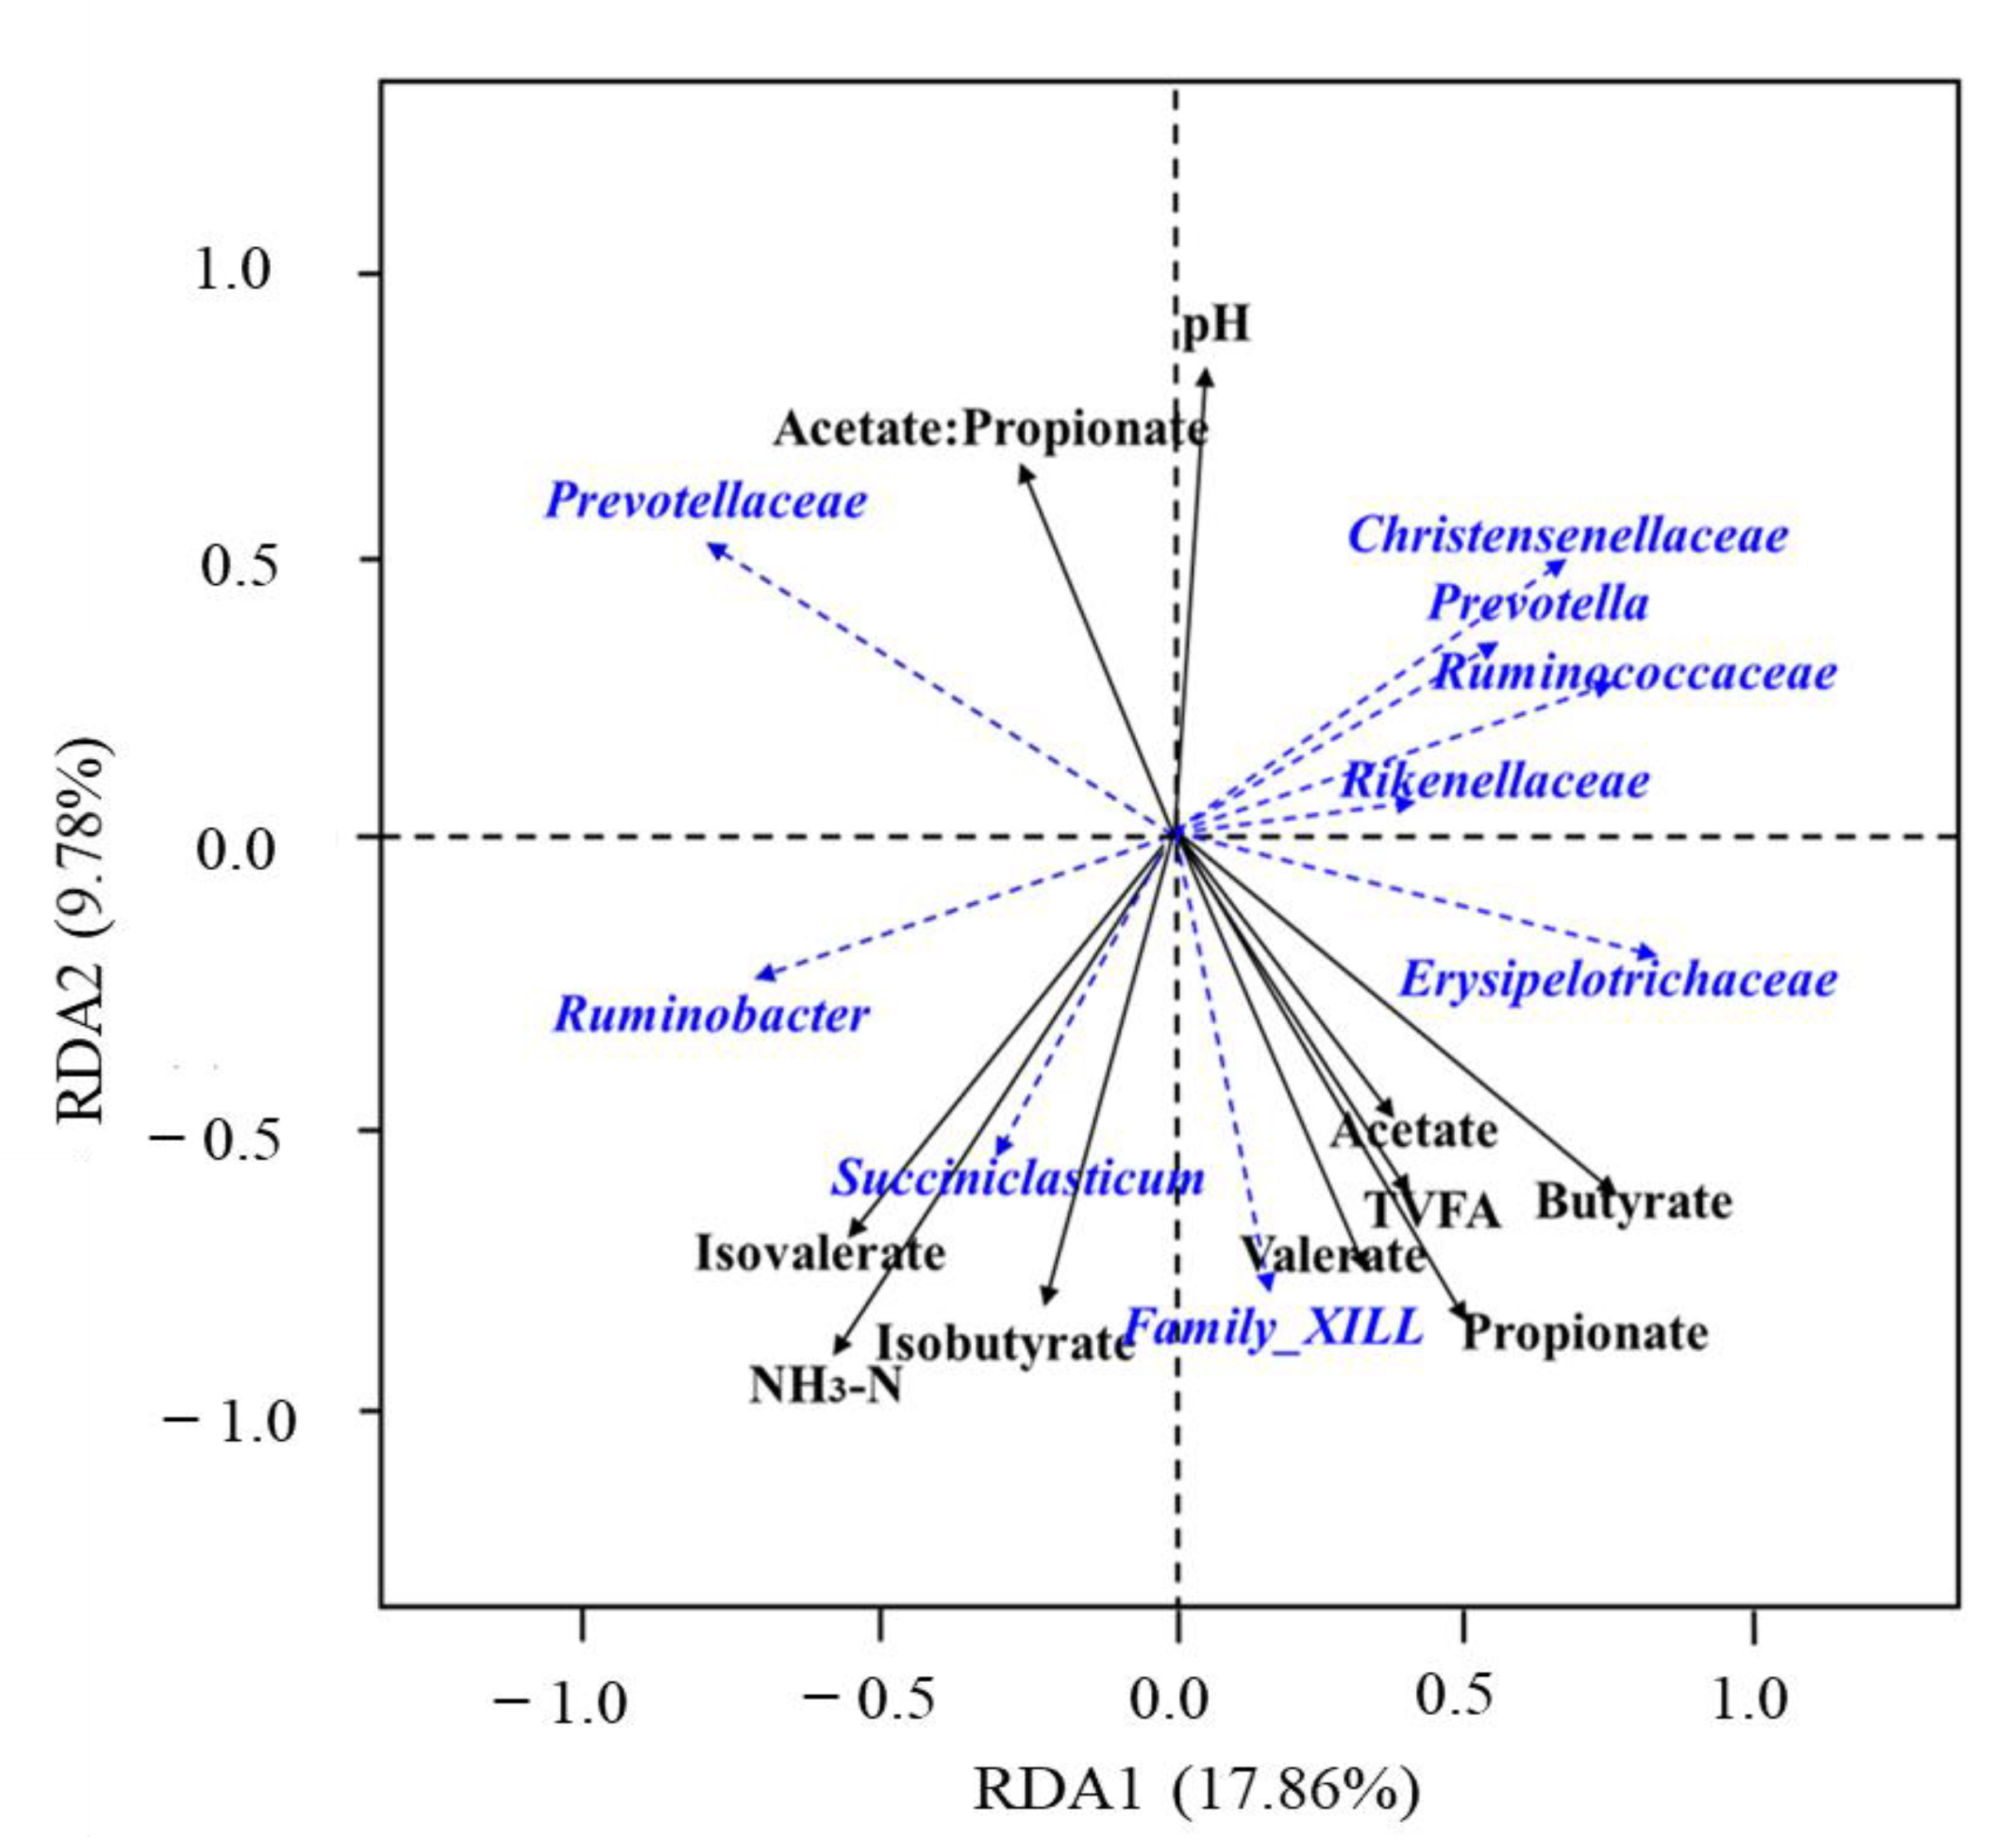
3.5. Relationship among the Sheep Rumen Microbial and Rumen Fermentation Parameters

As indicated by the Spearman correlation results (Table 6), the diversity of the sheep rumen fermentation fluids microbes was significantly and positively associated with the CP (p = 0.040) and ADF (p = 0.041). EF50 was significantly and positively associated with the ADF (p = 0.042). EF0 was significantly and negatively associated with the CP (p < 0.001). EF100 and EF0 were significantly and negatively associated with the rumen fermentation parameters NH3-N. The richness of the sheep rumen fermentation fluids microbes of EF25 was significantly (p = 0.045) positively associated with the NDF; EF75 was significantly (p = 0.044) positively associated with DDM.
The first and second axis of the redundancy analysis explained 17.86% and 9.78% of the variance with respect to different treatments (Figure 7). The abundance of Family_XIII and Succintelasticum were positively related to NH3-N, acetate, propionate, isobutyrate, butyrate, isovalerate, TVFA, and valerate. The abundance of Ruminobacter was positively related to NH3-N, acetate, propionate, isobutyrate, isovalerate, TVFA, and valerate. The abundance of Erysipelotrichaceae was positively related to NH3-N, acetate, propionate, isobutyrate, butyrate, TVFA, and valerate. The abundance of Christensenellaceae, Prevotella, Ruminococcaoeae, and Rikenellacene were positively related to acetate, propionate, butyrate, TVFA, and valerate. The abundance of Prevotellaceae was positively related to acetate: propionate and pH.

4. Discussion

4.1. GP Performance

The extent of GP reflects the efficiency and the extent of degradability of the feed. If the gas production is low, it is mainly due to the availability of microorganisms in the substrate caused by insufficient fermentation products [27,28,29,30]. High levels of ADF and NDF can reduce the degradation rate of forage by microorganisms [24], and when the content of nonstructural carbohydrates or easily fermentable substances in forage was high, microorganisms will use the degradation products to propagate rapidly, thus increasing the GP rate [29]. The GP of EF100 was relatively low, which may be due to the relatively high content of ADF (317 g/kg of DM) and NDF (633 g/kg of DM), and the shortage of microbial fermentation products. At the same time, EF0 has the highest GP, which may be due to the high content of corn in the feed, more fermentable carbohydrates and high CP content (163 g/kg of DM), which was conducive to microbial fermentation and improves its microbial activity, as claimed by Yang et al. [31]. In the current study, the higher in vitro GP and DDM for EF25 could be attributed to its high CP content (146 g/kg of DM) and comparatively low fiber (NDF, 472 g /kg of DM; ADF, 233 g/kg of DM).

4.2. Ruminal pH, TVFA and NH3-N

The optimal pH values for the protein bacteria growth and fibro lytic activity were in the range of 6.2 to 7.2 [32,33]. The ruminal pH in the present study ranged from 6.84 to 7.02 in the different treatments, and the EF100 showed the highest pH and the lowest TVFA. Meanwhile, with the increase of the EF replacement ratio, the TVFAs were declined, but the acetate: propionate was higher values. Those indicated that the digestion and utilization rate of grass in the rumen was low, which further indicated that the substrate was not easy to digest after the replacement of more than 50%. In the in vitro fermentation system, the main source of NH3-N had the degradation of substrate nitrogen-containing substances by microorganisms and the produced NH3-N, some of which was used by microorganisms to synthesize microbial proteins [34]. The other part was dissolved in the fermentation broth (the fermentation flask has no ability to absorb and excrete NH3-N). Carbohydrate was the main factor limiting the utilization of NH3-N by rumen microorganisms. Combined with GP and DDM, the lower concentration of NH3-N was found in EF75 and EF100 fermentation, which might be due to its utilization by microorganisms, and also lower CP content (105 to 117 g/kg of DM). The highlights of in vitro were that the replacement ratio of 25% and 50% (EF25 and EF50) might be idea fermentation characteristics, comparatively.

4.3. Ruminal Microorganisms

The present study showed that EF50 had the highest OTU number, whereas the EF75 had the highest Shannon index number, which indicated that EF25 had a raised ACE and Chao1 of sheep rumen microbiota. The phyla Bacteroidetes and Firmicutes were dominant in the ruminal microbial communities, which is consistent with earlier reports on dairy cattle [35] and sheep [36]. Bacteroidetes plays an important role in forge nutrition utilization and host disease immunity [37,38], which are best recognized for their saccharolytic activities. The presence of a high number of pectinolytic and cellulolytic enzymes in the genomes clustered with else lignocellulose degrading enzymes into the polysaccharide utilization loci (PUL) suggested that they were also actively involved in lignocellulose degradation [39,40]. Fibrobacteres were known as main cellulose-degraders of the ruminal microbiota, and played an important role in the low-quality fibers of degradation [41,42]. Synergistetes had the ability to degrade amino acids [43]. In present study, we found that compared to the EF0, the relative abundance of Bacteroidetes was found to increase following supplementation with EF. The relative abundance of the phyla Bacteroidetes in EF75, Firmicutes and Synergistetes in EF25, and Proteobacteria in EF0 provided significant advantages over the other treatments. Our data also showed that increasing the replacement ratio of EF decreased the abundance of the phyla Proteobacteria.
The genus Prevotella plays a crucial role in degrading and utilizing plant protein, starch, xylenes and non-cellulosic polysaccharides [44,45]. The relative abundance of the genus Prevotella in EF25 provided significant advantages over the other treatments. A recent analysis of rumen metagenome showed that members of the family Prevotellaceae were likely to play a more significant role in carbohydrate degradation in the rumen [46]. The relative abundance of the genus Prevotellaceae in EF75 provided significant advantages over the other treatments. The possible reason for the increase of the relative abundance of Saccharofermentans in EF replacement compared to EF0 is their ability to utilize simple sugars or to adapt to the increase in the rumen pH that occurred. The Ruminobacter ferment products including acetate, succinate, and for mate [47], were consistent with an increase in the acetate concentration seen as seen in EF0. The relative abundance of Ruminobacter also decreased following the addition of the EF ratio.
In the present study, we used PICRUSt as a prediction tool to determine the functional ability of the rumen fermentation–associated bacteriome. The gene family related to carbohydrate metabolism was the greatest in terms of abundance; other highly represented families included those related to amino acid metabolism, energy metabolism, lipid metabolism, glycan biosynthesis and metabolism, and metabolism of terpenoids and polyketides. These metabolic functions were fundamental for the growth and reproduction of bacterial communities in the gastrointestinal tract [48]. Among the KEGG pathways associated with the rumen microbiome, there was an increase in pathways related to carbohydrate metabolism, amino acid metabolism, energy metabolism, lipid metabolism, glycan biosynthesis and metabolism, signal transduction, and metabolism of terpenoids and polyketides. These metabolic functions are fundamental for the bacterial communities for growth and reproduction in the gastrointestinal tract [48]. Among the rumen microbiome KEGG pathways, carbohydrate metabolism and Lipid metabolism genes were increased in EF25 samples and reached a maximum in EF75 samples. This increased expression improved the degradation of polysaccharides into monosaccharides and short chain fatty acids, which in turn improved the digestion of long-chained proteins and carbohydrates and allowed for efficient use of hemicellulose.

5. Conclusions

Rumen microbiota composition was affected significantly by the EF replacement ratio. Compared to EF0, EF25 increased rumen microorganism diversity, and the high relative abundance of Firmicutes and Prevotella. Moreover, it improved some functional microorganisms mainly involved in the cellulose decomposition. The recommended ratio of EF in sheep fattening diet should range from 25% to 50%, and the maximum proportion should not exceed 75%.

Author Contributions

Computational techniques for analysis and writing of the original draft: Y.M.; Experimental design, collection and analysis of the rumen in in vitro fermentation samples, analysis of study data, and revision of the manuscript: H.W.; Acquisition of financial support for the project leading to this publication, design of the experiment, and collection of the Achnatherum inebrians sample, C.L.; Revision of the manuscript, K.M. All authors have read and agreed to the published version of the manuscript.

Funding

This work was supported by the Second Tibetan Plateau Scientific Expedition and Research (STEP) program (2019QZKK0302), and the key research and development of Gansu Province (20YF3NA006).

Institutional Review Board Statement

The animal care and management procedures involved in the study were permitted by the Ethics Committee of College of Pastoral Agriculture Science and Technology of Lanzhou University.

Informed Consent Statement

Not applicable.

Data Availability Statement

The original contributions presented in the study are publicly available. The following information regarding data availability was supplied by the National Center for Biotechnology Information (NCBI), BioProject database, under accession number PRJNA656074.

Conflicts of Interest

All authors declare no conflict of interest.

References

  1. Shi, Z.C. Important Poisonous Plants in Chinese Grassland, in Study on the Toxicological Mechanism of Phytotoxin, 3rd ed.; China Agriculture Press: Beijing, China, 1997; pp. 166–176. [Google Scholar]
  2. Li, C.J.; Nan, Z.B.; Zhang, C.J.; Zhang, C.Y.; Zhang, Y.H. Effects of drunken horse grass infected with endophyte on chinese rabbit. J. Agric. Sci. Technol. 2009, 11, 84–90. [Google Scholar]
  3. Miles, C.O.; Lane, G.A.; diMenna, M.E.; Garthwaite, I.; Piper, E.L.; Ball, O.J.P.; Garrick, C.M.; Latch, G.C.M.; Allen, J.M.; Hunt, M.B.; et al. High levels of ergonovine and lysergic acid amide in toxic Achnatherum Inebrians accompany infection by an Acremonium-like endophytic fungus. J. Agric. Food Chem. 1996, 44, 1285–1290. [Google Scholar] [CrossRef]
  4. Ren, J.Z. Northwest grasslands several common poisonous herbs. Anim. Hus. Veter. Med. 1954, 2, 56–60. [Google Scholar]
  5. Wang, K.; Dang, X.P. Toxicity test of drunken horse grass to the sheep. China Veter. Sci. Technol. 1991, 21, 32–33. [Google Scholar]
  6. Abegunde, T.O.; Akinsoyinu, A.O. Replacement Effects of panicum maximum with ficus polita on performance of west african dwarf goats. J. Anim. Physiol. Anim. Nutr. 2011, 95, 192–197. [Google Scholar] [CrossRef] [PubMed]
  7. Chatterjee, P.N.; Kamra, D.N.; Agarwal, N.; Patra, A. Influence of supplementation of tropical plant feed additives on in vitro rumen fermentation and methanogenesis. Anim. Prod. Sci. 2014, 54, 1770–1774. [Google Scholar] [CrossRef]
  8. Khameneh, B.; Iranshahy, M.; Soheili, V.; Fazly Bazzaz, B.S. Review on plant antimicrobials: A mechanistic viewpoint. Antimicrob. Resist. Infect. Control 2019, 8, 118. [Google Scholar] [CrossRef]
  9. Liang, Y.; Wang, H.C.; Li, C.J.; Nan, Z.B.; Li, F.D. Effects of feeding drunken horse grass infected with epichloë gansuensis endophyte on animal performance, clinical symptoms and physiological parameters in sheep. BMC Veter. Res. 2017, 13, 223. [Google Scholar] [CrossRef]
  10. Wina, E.; Muetzel, S.; Becker, K. The dynamics of major fibrolytic microbes and enzyme activity in the rumen in response to short- and long-term feeding of Sapindus rarak saponins. J. Appl. Microbiol. 2006, 100, 114–122. [Google Scholar] [CrossRef]
  11. Patra, A.K.; Saxena, J. The effect and mode of action of saponins on the microbial populations and fermentation in the rumen and ruminant production. Nutr. Res. Rev. 2009, 22, 204–219. [Google Scholar] [CrossRef]
  12. Morgavi, D.P.; Kelly, W.J.; Janssen, P.H.; Attwood, G.T. Rumen microbial (meta) genomics and its application to ruminant production. Animal. 2012, 7, 184–201. [Google Scholar] [CrossRef] [PubMed]
  13. Zhang, X.; Wang, H.C.; Guo, X.S. Comparative analysis of rumen fermentation parameters and bacterial profiles during adaption to different fattening stages in beef cattle fed TMR with various forage silage. Anim. Feed Sci. Technol. 2021, 278, 115006. [Google Scholar] [CrossRef]
  14. Belanche, A.; Doreau, M.; Edwards, J.E.; Moorby, J.M.; Pinloche, E.; Newbold, C.J. Shifts in the rumen microbiota due to the type of carbohydrate and level of protein ingested by dairy cattle are associated with changes in rumen fermentation. J. Nutr. 2012, 142, 1684–1692. [Google Scholar] [CrossRef] [PubMed] [Green Version]
  15. Ma, Y.L.; Wang, H.C.; Li, C.J. Response of sheep rumen fermentation and microbial communities to feed infected with the endophyte Epichloë gansuensis as evaluated with rumen-simulating technology. J. Microbiol. 2021, 59, 719–728. [Google Scholar] [CrossRef]
  16. McFarlane, Z.D.; Myer, P.P.; Cope, E.R.; Evans, N.D.; Carson Bone, T.; Biss, B.E.; Travis Mulliniks, J. Effect of biochar type and size in vitro on rumen fermentation of Orchard grass hay. Agr. Sci. 2017, 8, 316–325. [Google Scholar]
  17. Egbert, S.; Karen, S.; Christoph, C.T. Diversity responses of rumen microbial communities to Fusarium-contaminated feed, evaluated with rumen simulating technology. Environ. Microbiol. 2008, 10, 483–496. [Google Scholar]
  18. AOAC. Official Methods of Analysis, 15th ed.; Association of Official Analytical Chemists: Arlington, VA, USA, 1990. [Google Scholar]
  19. Goering, H.K.; van Soest, P.J. Forage fibre analysis (Apparatus, Reagent, Procedures and Some Application). In Agricultural Handbook No. 379; Agricultural Research Service, United States Dpartment of Agriculture: Washington, DC, USA, 1970. [Google Scholar]
  20. Ishii, S.; Kosaka, T.; Hori, K.; Hotta, Y.; Watanabe, K. Coaggregation facilitates interspecies hydrogen transfer between Pelotomaculum thermopropionicum and Methanothermobacter thermautotrophicus. Appl. Environ. Microbiol. 2005, 71, 7838–7845. [Google Scholar] [CrossRef]
  21. Broderick, G.A.; Kang, J.H. Automated simultaneous determination of ammonia and amino acids in ruminal fluids and in vitro media. J. Dairy Sci. 1980, 63, 65–75. [Google Scholar] [CrossRef]
  22. Mao, S.; Zhang, R.; Wang, D.; Zhu, W. The diversity of the fecal bacterial community and its relationship with the concentration of volatile fatty acids in the feces during subacute rumen acidosis in dairy cows. BMC Veter. Res. 2012, 8, 237. [Google Scholar] [CrossRef]
  23. Van, G.M.; Busschaert, P.; Honnay, O.; Lievens, B. Evaluation of six primer pairs targeting the nuclear rRNA operon for characterization of arbuscular mycorrhizal fungal (AMF) communities using 454 pyrosequencing. J. Microbiol. Methods. 2014, 106, 93–100. [Google Scholar]
  24. Zhang, R.; Zhu, W.; Zhu, W.; Liu, J.; Mao, S. Effect of dietary forage sources on rumen microbiota, rumen fermentation and biogenic amines in dairy cows. J. Sci. Food Agric. 2014, 94, 1886–1895. [Google Scholar] [CrossRef] [PubMed]
  25. Seddik, H.; Xu, L.; Wang, Y.; Mao, S.Y. A rapid shift to high-grain diet results in dynamic changes in rumen epimural microbiome in sheep. Animal 2019, 13, 1614–1622. [Google Scholar] [CrossRef] [PubMed]
  26. Øskov, E.R.; McDonald, L. The estimation of protein degradability in the rumen fromincubation measurements weighed according to the rate of passage. J. Agric. Sci. 1979, 92, 499–504. [Google Scholar] [CrossRef]
  27. Menke, K.H.; Steingawss, H. Estimation of the energetic feed value obtained from chemical analysis and gas production using rumen fluid. Anim. Res. 1988, 28, 7–55. [Google Scholar]
  28. Zhang, J.K.; Lu, D.X.; Liu, J.X.; Bao, S.N.; Zhou, Q.H.; Liu, Q.H. Research status and development of crude feed quality evaluation index. Prata. Sci. 2004, 21, 55–61. [Google Scholar]
  29. Chai, J.M.; Alrashedi, S.; Coffey, K.; Burke, J.M.; Feye, K.; Ricke, S.C.; Park, S.H.; Edwards, J.L.; Zhao, A.C. Endophyte-infected tall fescue affects rumen microbiota in grazing ewes at gestation and lactation. Front. Veter. Sci. 2020, 7, 544707. [Google Scholar] [CrossRef]
  30. Rohweder, D.A.; Barnes, R.F.; Neal, J. Proposed hay grading standards based on laboratory analyses for evaluating quality. J. Anim. Sci. 1978, 47, 747–759. [Google Scholar] [CrossRef]
  31. Yang, Z.L.; Li, Q.F.; Cao, Y.F. Study on the combined effect of whole plant corn silage and cereal grass by in vitro gas production method. Chinese Anim. Hus. Veter. Med. 2017, 44, 698–707. [Google Scholar]
  32. Liu, Q.; Wang, C.; Li, H.Q.; Guo, G.; Huo, W.J.; Pei, C.X.; Zhang, S.L.; Wang, H. Effects of dietary protein levels and rumenprotected pantothenate on ruminal fermentation, microbial enzyme activity and bacteria population in Blonde d’Aquitaine × Simmental beef steers. Anim. Feed Sci. Technol. 2017, 232, 31–39. [Google Scholar] [CrossRef]
  33. Bull, L.S.; Bush, L.J.; Friend, J.D.; Harris, B., Jr.; Jones, E.W. Incidence of ruminal parakeratosis in calves fed different rations and its relation to volatile fatty acid absorption. J. Daily Sci. 1965, 48, 1459–1466. [Google Scholar] [CrossRef]
  34. Wang, S.; Shi, L.F.; Zhang, Z.B. Effects of the ratio of ramie and ramie on the rumen microbial fermentation parameters in vitro. Chinese J. Anim. Eco. 2018, 39, 39–43. [Google Scholar]
  35. Trabi, E.B.; Seddik, H.E.; Xie, F.; Lin, L.M.; Mao, S.Y. Comparison of the rumen bacterial community, rumen fermentation and growth performance of fattening lambs fed low grain, pelleted or non-pelleted high grain total mixed ration. Anim. Feed Sci. Technol. 2019, 253, 1–12. [Google Scholar] [CrossRef]
  36. Huo, W.; Zhu, W.; Mao, S. Impact of subacute ruminal acidosis on the diversity of liquid and solid-associated bacteria in the rumen of goats. World J. Microbiol. Biotechnol. 2014, 30, 669–680. [Google Scholar] [CrossRef] [PubMed]
  37. Lee, S.S.; Kim, D.H.; Paradhipta, D.H.V.; Lee, H.J.; Yoon, H.; Joo1, Y.H.; Adesogan, A.T.; Kim, S.C. Effects of wormwood (Artemisia montana) essential oils on digestibility, fermentation indices, and microbial diversity in the rumen. Microorganisms 2020, 8, 1605. [Google Scholar] [CrossRef]
  38. Gharechahi, J.; Vahidi, M.F.; Ding, X.Z.; Han, J.L.; Salekdeh, G.H. Temporal changes in microbial communities attached to forages with different lignocellulosic compositions in cattle rumen. FEMS Microb. Ecol. 2020, 96, fiaa069. [Google Scholar] [CrossRef]
  39. Lapébie, P.; Lombard, V.; Drula, E.; Terrapon, N.; Henrissat, B. Bacteroidetes use thousands of enzyme combinations to break down glycans. Nat. Commun. 2019, 10, 2043. [Google Scholar] [CrossRef]
  40. Ransom, J.E.; Jones, D.L.; McCarthy, A.J.; McDonald, J.E. The fibrobacteres: An important phylum of cellulose-degrading bacteria. Microb. Ecol. 2012, 63, 267–281. [Google Scholar] [CrossRef]
  41. Suen, G.; Weimer, P.J.; Stevenson, D.M.; Aylward, F.O.; Boyum, J.; Deneke, J.; Drinkwater, C.; Ivanova, N.N.; Mikhailova, N.; Chertkov, O. The complete genome sequence of fibrobacter succinogenes S85 reveals a cellulolytic and metabolic specialist. PLoS ONE 2011, 6, e18814. [Google Scholar] [CrossRef]
  42. McCrackena, B.A.; Garcia, M.N. Phylum synergistetes in the oral cavity: A possible contributor to periodontal disease. Anaerobe 2021, 68, 102250. [Google Scholar] [CrossRef]
  43. Strobel, H.J. Vitamin B12-dependent propionate production by the ruminal bacterium prevotella ruminicola. Environ. Microb. 1992, 23, 2331–2333. [Google Scholar] [CrossRef]
  44. Gharechahi, J.; Salekdeh, G.H. A metagenomic analysis of the camel rumen’s microbiome identifies the aajor microbes responsible for lignocellulose degradation and fermentation. Biotechnol. Biofuels 2018, 11, 216. [Google Scholar] [CrossRef] [PubMed]
  45. Stackebrandt, E.; Hippe, H. Transfer of bacteroidesamylophilus to a new genus ruminobacter gen. nov., nom. rev. as ruminobacter amylophilus comb. nov. Syst. Appl. Microbiol. 1986, 8, 204–207. [Google Scholar] [CrossRef]
  46. Lamendella, R.; Santo Domingo, J.W.; Ghosh, S.; Martinson, J.; Oerther, D.B. Comparative fecal metagenomics unveils unique functional capacity of the swine gut. BMC Microbiol. 2011, 11, 103. [Google Scholar] [CrossRef] [PubMed]
  47. Kaoutari, A.E.; Armougom, F.; Gordon, J.I.; Raoult, D.; Henrissat, B. The abundance and variety of carbohydrate-active enzymes in the human get microbiota. Nat. Rev. Microbiol. 2013, 11, 497–504. [Google Scholar] [CrossRef]
  48. Liu, H.J.; Hu, L.Y.; Han, X.P.; Zhao, N.; Xu, T.W.; Ma, L.; Wang, X.J.; Zhang, X.L.; Kang, S.P.; Zhao, X.Q.; et al. Tibetan sheep adapt to plant phenology in alpine meadows by changing rumen microbial community structure and function. Front. Microbiol. 2020, 10, 587558. [Google Scholar] [CrossRef] [PubMed]
Figure 1. (A) The sample rarefaction curves and (B) Venn diagram showing overlap among the OTUs of the sheep rumen microbial communities with different addition levels of EF. EF0, EF25, FE50, EF75, and EF100 are defined as EF replacement ratios of 0%, 25%, 50%, 75%, and 100% of the fermentation substrate, respectively.
Fermentation 08 00419 g001
Figure 2. Phylum composition of rumen microbiota. Different addition levels of endophyte-free Achnatherum inebrians (EF) changed the composition of ruminal microbiota at the phylum levels showed as relative abundance. Only phylum with a relative abundance greater than 0.5% are depicted. EF0, EF25, FE50, EF75, and EF100 are defined as EF replacement ratios of 0%, 25%, 50%, 75%, and 100% of the fermentation substrate, respectively.
Fermentation 08 00419 g002
Figure 3. Genus levels composition of rumen microbiota. Different addition levels of endophyte-free Achnatherum inebrians (EF) changed the composition of ruminal microbiota at the genus levels and showed as relative abundance. Only genera with a relative abundance greater than 0.5% are depicted. EF0, EF25, FE50, EF75, and EF100 are defined as EF replacement ratios of 0%, 25%, 50%, 75%, and 100% of the fermentation substrate, respectively.
Fermentation 08 00419 g003
Figure 4. Principal coordinate analysis (PCoA) of sheep rumen microbiota at the level of the operational taxonomic units (OTUs) based on Bray−Curtis analysis of different levels. The percent variation explained by principal coordinate 1 (PC1) was 46.74%, whereas that explained by PC2 was 23.70%, by PC3, 8.66%. EF0, EF25, FE50, EF75, and EF100 are defined as EF replacement ratios of 0%, 25%, 50%, 75%, and 100% of the fermentation substrate, respectively.
Fermentation 08 00419 g004
Figure 5. Bacterial taxa with linear discriminant analysis (LDA) that score greater than four in rumen microbiota of sheep with different treatments. EF0, EF25, FE50, EF75, and EF100 are defined as EF replacement ratios of 0%, 25%, 50%, 75%, and 100% of the fermentation substrate, respectively.
Fermentation 08 00419 g005
Figure 6. Cladogram of bacterial biomarkers from phylum (innermost ring) to genus (outermost ring) level, LDA score > 4. Differential bacterial taxa were marked with lowercase letters. The small circle of each different classification level represents the taxon of that level, and circle is directly proportional to the relative abundance. The principle of coloring is to use color the species. There was no significant difference in yellow, whereas other differential species are colored according to the group with the highest abundance. Different colors represent different groups, and nodes with different colors represent communities that play an important role in groups represented by colors.
Fermentation 08 00419 g006
Figure 7. Redundancy analysis (RDA) of the relative abundance of sheep rumen microbes and rumen environmental factors under different replacement ratio levels of endophyte-free Achnatherum inebrians (EF). The black solid lines indicate rumen environmental factors, and blue dashed lines indicate rumen microbes. TVFA, total volatile fatty acid; NH3-N: ammonia nitrogen.
Fermentation 08 00419 g007
Table 1. Nutrient composition of the ferment feed during the experiment (g/kg of DM 1).
Ferment Feed 2Item 3
OMCP NDFADFAshErgonovineErgine
EF90610563331794ND 4ND
PTMR875163418215112NDND
1 DM, Dry matter. 2 EF: endophyte-free Achnatherum inebriants; PTMR: pellet type total mixed ration for sheep. 3 OM: organic matter; CP: crude protein; NDF: neutral detergent fiber; ADF: acid detergent fiber: Ash: crude ash. 4 ND: Not Detectable.
Table 2. The characteristics of gas production (GP) of different treatments for 48 h in vitro fermentation.
Item 1Treatment 2SEM 3p-Value
EF0EF25EF50EF75EF100LinearQuadratic
DDM (%)78.22 a63.46 b56.79 bc55.09 c45.70 d2.286<0.0010.125
GP (mL/g)82.24 a62.83 b55.30 b35.57 c24.73 c4.084<0.001<0.001
a (mL/g)66.42 a51.49 b50.02 b35.17 c32.79 d3.276 <0.001<0.001
b (mL/g)30.06 a21.00 b13.82 c4.23 d0.27 e2.910 <0.0010.001
a + b (mL/g)96.48 a73.49 b63.84 c37.02 d36.44 d6.099 <0.001<0.001
c (%h)0.03 a0.02 b0.01 c0.03 a0.02 b0.002<0.001<0.001
Different lowercase letters in a row of data indicate significant differences at p < 0.05 among different treatments. 1 DDM: digestibility of dry matter; a: GP from rapid fermentation; b: GP from slow fermentation; a + b: Potential GP; c: Constant of GP rate. 2 EF0, EF25, EF50, EF75, and EF100 are defined as EF additions of 0%, 25%, 50%, 75%, and 100% of the fermentation substrate, respectively. 3 SEM: standard error.
Table 3. Effect of different replacement proportions of endophyte-free Achnatherum inebrians (EF) on the pH, fermentation parameters and NH3-N.
Item 1Treatment 2SEM 3p-Value
EF0EF25EF50EF75EF100LinearQuadratic
pH6.84 d6.89 c6.90 c6.98 b7.02 a0.013<0.0010.331
NH3-N(mg/dL)49.33 a45.91 ab42.91 ab39.21 bc35.17 c1.349<0.0010.826
TVFA (mmol/L) 86.52 a73.28 b70.74 b59.67 bc57.28 c2.564<0.0010.389
Acetate (mmol/L)52.21 a44.84 ab44.18 b37.53 bc36.44 c1.498<0.0010.499
Propionate (mmol/L)21.17 a17.05 b15.48 bc12.88 c11.76 c0.765<0.0010.299
Butyrate (mmol/L) 8.40 a7.31 ab7.24 a5.98 b5.86 c0.267<0.0010.670
Valerate (mmol/L) 1.38 a1.17 b1.10 bc0.91 c0.89 cd0.044<0.0010.304
Isobutyrate (mmol/L) 1.20 a1.07 ab0.96 bc0.85 c0.82 c0.036<0.0010.384
Isovalerate (mmol/L)2.15 a1.85 ab1.78 ab1.52 b1.49 b0.069<0.0010.470
Acetate: Propionate2.48 c2.65 bc2.87 ab2.91 ab3.14 a0.064<0.0010.910
Different lowercase letters in a row of data indicate significant differences at p < 0.05 among different treatments. 1 TVFA: total volatile fatty acid; NH3-N: ammonia nitrogen. 2 EF0, EF25, EF50, EF75, and EF100 are defined as EF replacement ratios of 0%, 25%, 50%, 75%, and 100% of the fermentation substrate, respectively. 3 SEM: standard error.
Table 4. The bacteria community richness in sheep rumen fermentation fluids medium with different replacement levels of fermentation substrate by endophyte-free Achnatherum inebrians (EF).
Item 1Treatment 2SEM 3p-Value
EF0EF25EF50EF75EF100LinearQuadratic
ACE771.66779.18769.04774.16773.142.6690.9240.637
Chaol index779.37787.71776.22776.32777.743.3650.5920.777
Shannon index4.63 b4.78 b4.64 b5.08 a5.07 a0.060<0.0010.130
1 ACE: abundance-based coverage estimator. 2 EF0, EF25, EF50, EF75, and EF100 are defined as EF replacement ratios of 0%, 25%, 50%, 75%, and 100% of the fermentation substrate, respectively. 3 SEM: standard error.
Table 5. The relative abundance of the rumen microbiome was significantly altered with espect to Kyoto Encyclopedia of Genes and Genomes (KEGG) terms (>1.5% in at least one sample) in rumen fermentation fluid after in vitro fermentation with different levels of endophyte-free Achnatherum inebrians (EF).
KEGGRelative Abundance (%) 1 SEM 2p-Value
EF0EF25EF50EF75EF100LinearQuadratic
Carbohydrate metabolism14.41 b14.46 ab14.46 ab14.52 a14.49 ab0.0140.0290.314
Global and overview maps14.38 a14.36 ab14.33 ab14.27 b14.29 ab0.0150.0170.757
Amino acid metabolism11.4511.5811.5011.5411.540.0140.0510.093
Metabolism of cofactors and vitamins6.986.977.026.986.990.0080.5080.567
Energy metabolism6.81 b6.86 a6.87 a6.88 a6.88 a0.008<0.0010.007
Nucleotide metabolism5.915.915.935.915.920.0020.2520.179
Translation5.84 a5.84 a5.84 a5.81 b5.82 ab0.004<0.0010.205
Replication and repair5.06 a5.00 c5.02 b4.98 d4.99 bd0.008<0.0010.002
Membrane transport4.38 a4.08 c4.15 b3.93 d3.93 d0.044<0.001<0.001
Lipid metabolism3.38 c3.43 bc3.41 c3.49 a3.44 b0.0100.0010.090
Glycan biosynthesis and metabolism2.76 b2.87 a2.85 a2.83 a2.84 a0.0120.0240.004
Signal transduction2.482.452.442.472.470.0040.9660.002
Folding, sorting and degradation2.28 a2.24 d2.27 b2.25 cd2.25 c0.004<0.0010.001
Metabolism of other amino acids2.172.192.192.182.190.0030.1500.173
Metabolism of terpenoids and polyketides1.97 c2.00 a1.99 b2.01 a2.00 a0.003<0.0010.002
Xenobiotics biodegradation and metabolism1.64 a1.65 a1.61 b1.641.640.0040.2580.166
Different lowercase letters in a row of data indicate significant differences at p < 0.05 among different treatments. 1 EF0, EF25, EF50, EF75, and EF100 are defined as EF replacement ratios of 0%, 25%, 50%, 75%, and 100% of the fermentation substrate, respectively. 2 SEM, standard error.
Table 6. Spearman correlations of alpha diversity to feed nutrient and fermentation parameters in sheep rumen fermentation medium with different replacement ratio levels of endophyte-free Achnatherum inebrians (EF).
Feed Nutrient and
Fermentation
Characteristics 1
Treatment 2
EF0EF25EF50EF75EF100
ShannonChao1ShannonChao1ShannonChao1ShannonChao1ShannonChao1
CP−0.982 **−0.6850.6830.7480.01−0.4820.0590.5370.831 *0.209
NDF−0.5370.1780.7970.821 *−0.653−0.328−0.5070.736−0.183−0.15
ADF0.1790.0940.077−0.0570.827 *−0.217−0.703−0.4820.830 *−0.006
pH−0.458−0.612−0.734−0.436−0.126−0.044−0.2550.620.4140.316
TVFA0.5590.303−0.3490.1950.5260.6340.59−0.031−0.0710.435
Acetate0.3890.131−0.2710.2830.50.6140.595−0.0270.0780.11
Propionate0.720.537−0.645−0.1640.6060.6810.5770.0750.0360.657
Butyrate0.3770.033−0.0520.3140.530.6230.479−0.017−0.390.684
Valerate0.5170.640.2720.6560.4330.5260.661−0.28−0.5290.33
Isobutyrate0.2310.3610.2040.629−0.278−0.0880.486−0.586−0.338−0.105
Isovalerate−0.0780.3210.3380.601−0.373−0.1830.508−0.657−0.163−0.211
Acetate: Propionate−0.468−0.4920.7980.584−0.544−0.4650.21−0.470.037−0.453
GP0.056−0.080.0230.3150.201−0.3230.07−0.579−0.7070.232
NH3−N−0.836 *−0.607−0.707−0.481−0.606−0.636−0.216−0.316−0.941 **0.018
DDM0.4510.172−0.435−0.5830.23−0.3710.1930.823 *−0.326−0.398
* p < 0.05; ** p < 0.01. 1 CP: crude protein; NDF: neutral detergent fiber; ADF: acid detergent fiber; TVFA: total volatile fatty acid; GP: gas production; NH3-N: ammonia nitrogen. DDM: digestibility of dry matter. 2 EF0, EF25, FE50, EF75, and EF100 are defined as EF replacement ratios of 0%, 25%, 50%, 75%, and 100% of the fermentation substrate, respectively.
Publisher’s Note: MDPI stays neutral with regard to jurisdictional claims in published maps and institutional affiliations.

