Article

Evaluation of Gas Production, Fermentation Parameters, and Nutrient Degradability in Different Proportions of Sorghum Straw and Ammoniated Wheat Straw

1
Key Laboratory of Bovine and Ovine Germplasm and Straw Transfer into Feedstuff, Institute of Livestock, Grass and Green Agriculture, Gansu Academy of Agricultural Sciences, Lanzhou 730070, China
2
College of Animal Science and Technology, Gansu Agricultural University, Lanzhou 730070, China
*
Authors to whom correspondence should be addressed.
Fermentation 2022, 8(8), 415; https://doi.org/10.3390/fermentation8080415
Submission received: 24 June 2022 / Revised: 17 August 2022 / Accepted: 17 August 2022 / Published: 22 August 2022
(This article belongs to the Special Issue In Vitro Fermentation)

Abstract

:
The purpose of this study was to investigate the optimum proportion of sorghum straw and ammoniated wheat straw in vitro and in vivo to apply in ruminant diets. One-factor and two-factor experimental designs were used in the in vitro tests, with different ratios of sorghum straw to ammoniated wheat straw (S:AWS) of 2:8, 3:7, 4:6, 5:5, 6:4, 7:3, and 8:2 to measure the in vitro total gas production, CH4 production, in vitro dry matter degradability (IVDMD), in vitro organic matter degradability (IVOMD) and in vitro fermentation parameters. Additionally, the nylon bag technique was used to determine the dynamic degradation of these different ratios of mixed feedstuffs for incubating in sheep rumen for 6 h, 12 h, 24 h, and 48 h. The results show that IVDMD, IVOMD, and the molar ratio of propionate were the highest when the ratio of S:AWS was 8:2 (p < 0.05) in vitro; however, this ratio released much more CH4 (p < 0.05). In addition, the degradability of DM, OM, CP, and ash and the effective degradability of DM and CP were the highest when the ratio of S:AWS was 8:2 cultured in sheep rumen for 48 h (p < 0.05). In the in vitro and in situ nylon bag tests, IVDMD, IVOMD, rumen nutrient degradability, and effective degradability of DM and CP increased with the increase in the sorghum straw proportion. In conclusion, the higher the proportion of sorghum straw, the higher the nutrient degradability in vivo and in vitro, but also the higher the emissions of CH4. Therefore, when the ratio of S:AWS is 8:2, ruminants can effectively utilize nutrients in feed.

1. Introduction

In ruminant diets, the proportion of roughage is relatively high, usually 40% to 70% or higher. It is not only necessary for maintaining the normal physiological functions of ruminants but also an important source of energy. Some studies showed that nutritional value evaluation is not only related to the nutrient content of feed but also to the digestion and utilization efficiency in the animal body. However, the efficiency of nutrient digestion and utilization in animals is closely related to species, physiological stages, and feed intake of animals, so the determination of nutrient degradability of roughage is an indispensable link in the evaluation of nutrient value for ruminants [1]. The animal’s degradability of the feed can be used to rationally prepare the animal’s diet and improve feed utilization.
Ruminants digest and utilize roughage in the diet through microorganisms in the rumen. The different combinations of dietary raw materials, as well as the different processing methods and nutritional control measures, will affect the animal’s intake and utilization of individual feeds in the diet [2,3]. The rumen degradability of roughage is an important indicator for assessing its nutritional value [4]. The evaluation of rumen degradability can be divided into three methods: in vivo, semi-in vivo, and in vitro [5]. The in vivo method is the most direct method to evaluate the degradation of roughage in the rumen, because of its high accuracy; it is also a reference standard for other methods to correct. The in situ nylon bag technique belongs to the semi-in vivo method, which is simple and can accurately reflect the physiological state of rumen digestion. The in vitro method mainly includes the artificial rumen method, enzymatic digestion method, and gas production method, which have the advantages of simple operation, good repeatability, and low cost [6]. In vitro gas production is an alternative technique used to determine the nutritional value of feed, since the rate and extent of degradation and rumen fermentation can be easily determined by the measurement of cumulative gas production [7]. Datt et al. also used the in vitro gas production technique to evaluate nutritional values of leguminous and nonleguminous crops [8]. In vitro tests, on the other hand, are less time-consuming, cheaper, and more efficient when large numbers of samples are handled.
Wheat straw and sorghum straw are important sources of feed, but wheat straw, because of its high fiber content, not only cannot be digested and used by animals but also, to some extent, can hinder the digestion and absorption of other nutrients. Generally, the protein content of ruminant livestock feed is above 8%, while wheat straw has a low protein content, a lack of trace elements, a high ash content, and a low digestible energy value, so it cannot be fed directly, which, to some extent, limits the application of wheat straw in animal production [9]. In contrast, the crude protein, calcium, and phosphorus contents of sorghum straw are higher than those of wheat straw, and the lignin content is lower than that of wheat straw [10]; furthermore, the crude protein in sorghum straw can provide energy for fiber-degrading bacteria in the rumen to promote the degradation of straw cellulose. However, sorghum straw is used far less than wheat straw in practical applications.
The purpose of this experiment was to study whether different proportions of sorghum straw and ammoniated wheat straw have better nutritional and feeding values through the in situ nylon bag method and in vitro gas production method so as to provide a reference for better utilization of straw resources in actual production.

2. Materials and Methods

2.1. Experiment Material

The raw materials were sorghum straw (hybrid japonica sorghum) and wheat straw (Sichuan wheat 93), which were taken from Yuzhong County and Weiyuan County in Gansu Province, China, respectively, and harvested after harvesting the seeds. The chemical composition of the sorghum straw and wheat straw is presented in Table 1. The collected straw was dried at 65 °C for 48 h and then partially crushed to 40 mesh for nutrient determination and the in vitro gas production test. The other part was pulverized to a 2 mm particle size and uniformly mixed for the in situ nylon bag test.
The wheat straw was ammoniated with plastic bags, and dry wheat straw with a good quality, no deterioration or mildew and about 10% moisture was selected. The wheat straw was cut into sections of 2 to 3 cm and placed into plastic bags. The plastic bags were generally 40 × 20 cm. The use of atoxic polyethylene film plastic bags, preferably double-layer plastic bags, is required. We prepared a 4% urea solution in warm water (0.4 kg urea per 10 kg straw dissolved in 3 kg water), sprayed the short wheat straw with the prepared urea solution [11], placed the sprayed wheat straw into the plastic bag, sealed the bag to avoid moisture, and used it after 5–14 days of treatment at an external temperature of 20–30 °C.

2.2. Experiment Design

For the experiment, we selected a 7 × 4 two-factor test design and set different proportion A factors and time accumulation B factors for sorghum straw and ammoniated wheat straw. Seven ratios of sorghum straw and ammoniated wheat straw were prepared—A1 (2:8), A2 (3:7), A3 (4:6), A4 (5:5), A5 (6:4), A6 (7:3), and A7 (8:2)—and the cumulative times were B1 (6 h), B2 (12 h), B3 (24 h), and B4 (48 h). The nutritional value of ruminants was evaluated by measuring the semi-in vivo degradability, in vitro degradability, cumulative gas production, and CH4 content of each group of parallel samples at different times.

2.3. Experiment Method

2.3.1. In Situ Nylon Bag Test

Four 5-month-old wethers with T-cannulae were tested in the livestock farm of Gansu Agricultural University. They were placed in a well-ventilated enclosed sheep house and raised in a single cage (1.2 × 1.5 m) under strict hygienic conditions. Referring to the standard table of mutton sheep breeding in China (NY/T816-2004), the nutritional needs of rams weighing 30 kg with a daily gain of about 100 g were used to prepare the diets, as shown in Table 2. The sheep were fed an equal amount twice a day (8:00 and 18:00) and drank water freely. In order to adapt the living environment of rumen microorganisms and ensure the viability of rumen microorganisms under this feeding scheme, the adaptation period before the experiment was 7 days.
An amount of 3 g of mixed sorghum straw and ammoniated wheat straw in different proportions from seven groups treated with different factors was accurately weighed into 3.5 cm × 6 cm nylon bags (pore size 23 μm) of known weight, and three replicates were set up in parallel for each sample, where each sheep was one replicate. The samples were removed at the design times of 6 h, 12 h, 24 h, and 48 h for subsequent degradability measurements.

2.3.2. In Vitro Test

Three sheep were selected as rumen fluid donors with the same breeding standard as described in Section 2.3.1. One hour before morning feeding, the rumen contents were collected through the rumen fistula and filtered in a preheated 39 °C vacuum flask with four layers of gauze, which was brought back to the laboratory to carry out the experiment. The adaptation period was 7 days, and the experimental period was 4 days.
The in vitro gas production method is described in Menke [12]. Fermentation was carried out using a DSHZ-300A water bath thermostat shaker device, weighing about 200 mg of the sample, using a long strip of paper placed into a glass syringe coated with Vaseline for the in vitro gas production test, with 3 replicates per sample and 3 blank tubes. The artificial rumen fluid was prepared as per Menke [12], and the artificial rumen fluid and the rumen fluid were mixed at a volume ratio of 2:1 as a culture solution. CO2 was introduced, and 30 mL of the culture solution was added to the culture tube by a dispenser to remove the air bubbles and placed in a 39 °C constant-temperature shaking incubator for cultivation and timing. When cultured for 0, 6, 9, 12, 24, and 48 h, we took the culture tube to quickly read the scale value of the piston and recorded it.

2.4. In Vitro Degradability and Fermentation Parameter Test

In vitro methods are widely used to evaluate the nutritive value of different classes of feeds [13,14]. In vitro DM and OM degradability was estimated using methods of Van Soest et al. [15]. We accurately weighed 0.5 g of the dried sample and added it to the centrifuge tube. Then, it was placed in a 39 °C water bath for preheating. After transferring the rumen fluid back into the laboratory, we dispensed 40 mL of buffer solution and 10 mL of rumen fluid into each tube as soon as possible, followed by shaking and mixing. Afterwards, we filled the solution with CO2. Then, we covered the rubber stopper with a Bunsen valve and sealed it. Incubation was carried out in a constant-temperature water bath for 48 h with shaking 2 to 3 times a day. At the end of the culture, 3 mL of acidic pepsin solution (enzyme activity 1:3000) was added to each tube, which was acidified to reduce the pH to 1.5 and cultured for another 48 h. After the completion of the culture, the mixture was centrifuged, and the centrifuge tube and the residue were sent to a dry box (105 °C) and dried to constant weight. Then, we analyzed the nutrient content in the residue.
Five mL rumen fluid was collected at 6 h, 9 h, 12 h, 24 h and 48 h of fermentation. pH was determined by an acidimeter (PHS-3C, Demagnetization Instrument Factory, Shanghai, China). VFA was determined by gas chromatography (6890N, Agilent Technologies, Santa Clara, CA, USA). The ammonia nitrogen content was measured using a spectrophotometer (SP-723; Spectrum Instruments, Shanghai, China) according to the Berthelot reaction (phenol–hypochlorite) described by Broderick and Kang [16].

2.5. Parameter Simulation and Statistical Analysis

2.5.1. Determination of Rumen Degradability and Calculation Method of Degradation Parameters in In Situ Nylon Bag Method

The degradability of DM, OM, CP, and ash at different time points was calculated using Equation (1):
A   % = B C B × 100
where A indicates the rumen disappearance rate (%) of a certain nutrient component of the feed to be tested; B indicates the content of a certain nutrient component in the sample to be tested (g); and C indicates the content of certain nutrients in the residue of the nylon bag to be tested (g).
The degradation parameters of DM and CP were calculated by Equation (2) according to the ruminal kinetic model of Ørskov et al. [17]:
dP = a + b 1 e ct
where dP is the DM or CP degradability (%) at time t, a is the soluble fraction (%), b is the slowly degradable fraction (%), c is the rate of degradation of the b fraction (%/h) and t is the rumen culture time (h). Effective degradability was calculated according to Equation (3):
ED % = a + bc k + c
where k indicates the rumen outflow rate. The value of k in this test was 0.031/h [18].

2.5.2. In Vitro Gas Production and Gas Production Parameters

The net air production of the accumulated net gas production of the culture tube at a certain time period = the gas production amount in a certain period of time—the average gas production of three blank tubes in the corresponding period.
The gas production model was calculated using Equation (4):
GP = 200 × Vt V 0 W
where t is time after the fermentation starts (h); GP is the gas production (mL) at time t of the sample; 200 is the total weight of samples in the trachea (200 mg); Vt is the trachea reading after fermentation for t h (mL); V0 is the blank tube reading after fermentation for t h (mL); and W is the weight of sample DM (mg).

2.5.3. Calculation Method of In Vitro Degradability

IVDMD % = D E D × 100
where D indicates the DM content before fermentation, and E indicates the DM content after fermentation, and
IVOMD % = F G F × 100
where F indicates the OM content before fermentation, and G indicates the OM content after fermentation.

2.6. Data Processing and Analysis

All the data were subjected to one-way and two-way ANOVA, and the significance of differences among means was determined using the Tukey multiple range test; differences at p < 0.05 were considered statistically significant. All the analyses were conducted using SPSS 26 (IBM, Armonk, NY, USA) using the following statistical model:
Yij = μ + ti + eij
where Yij is the response of the subject sheep (i) and treatment (j), μ is the overall mean, ti is the treatment effect, and eij is the error due to the jth replication of the ith treatment and normally distributed with a zero mean and constant variance.

3. Results

3.1. In Situ Nylon Bag Test Results

It can be seen from Table 3 that the degradability of DM, OM, CP and ash increased significantly with the accumulation of time at the same ratio. The A and B factors had significant effects on the DM, OM, CP and ash of sorghum straw and ammoniated wheat straw in different ratios (p < 0.05). Meanwhile, the degradability of DM, OM, CP and ash increased significantly with the increase in the sorghum straw proportion in factor A (A1 < A2 < A3 < A4 < A5 < A6 < A7). In the same proportions, with the accumulation of the time B factor, the degradability of DM, OM, CP and ash increased significantly (B1 < B2 < B3 < B4). The degradability of DM, OM, CP and ash was the highest under A7 (8:2) and B4 (48 h). The interaction factor A × B had significant effects on the degradability of DM, OM and ash (p < 0.05).
It can be seen from Table 4 that different proportions of sorghum straw and ammoniated straw had significant indigenous effects on rumen degradation parameters a, c, and a + b and the effective degradation rate of DM, as well as significant effects on rumen degradation parameters a and a + b and the effective degradability of CP (p < 0.05). The effective degradability of DM in A6 and A7 was significantly higher than that in the other groups, and the effective degradability of CP in A7 was significantly higher than that in the other groups (p < 0.05). With the increase in the proportion of sorghum straw, the effective degradability of DM and CP gradually increased.

3.2. In Vitro Degradability Test Results

As can be seen in Table 5, in vitro dry matter degradability (IVDMD) increased with the increase in the sorghum straw proportion in sorghum straw and ammoniated wheat straw. The A6 (7:3) and A7 (8:2) groups had significantly higher results than the other groups (p < 0.05). When the ratio of S:AWS was 8:2, IVDMD was the highest. For IVDMD, except for the A4 (5:5) group, the change rules of dry matter degradability were similar to those in vitro. The higher the proportion of sorghum straw, the higher the degradability of dry matter in vitro. When the ratio of S:AWS was 8:2, IVOMD was significantly higher than that in the other groups (p < 0.05) and reached the maximum.

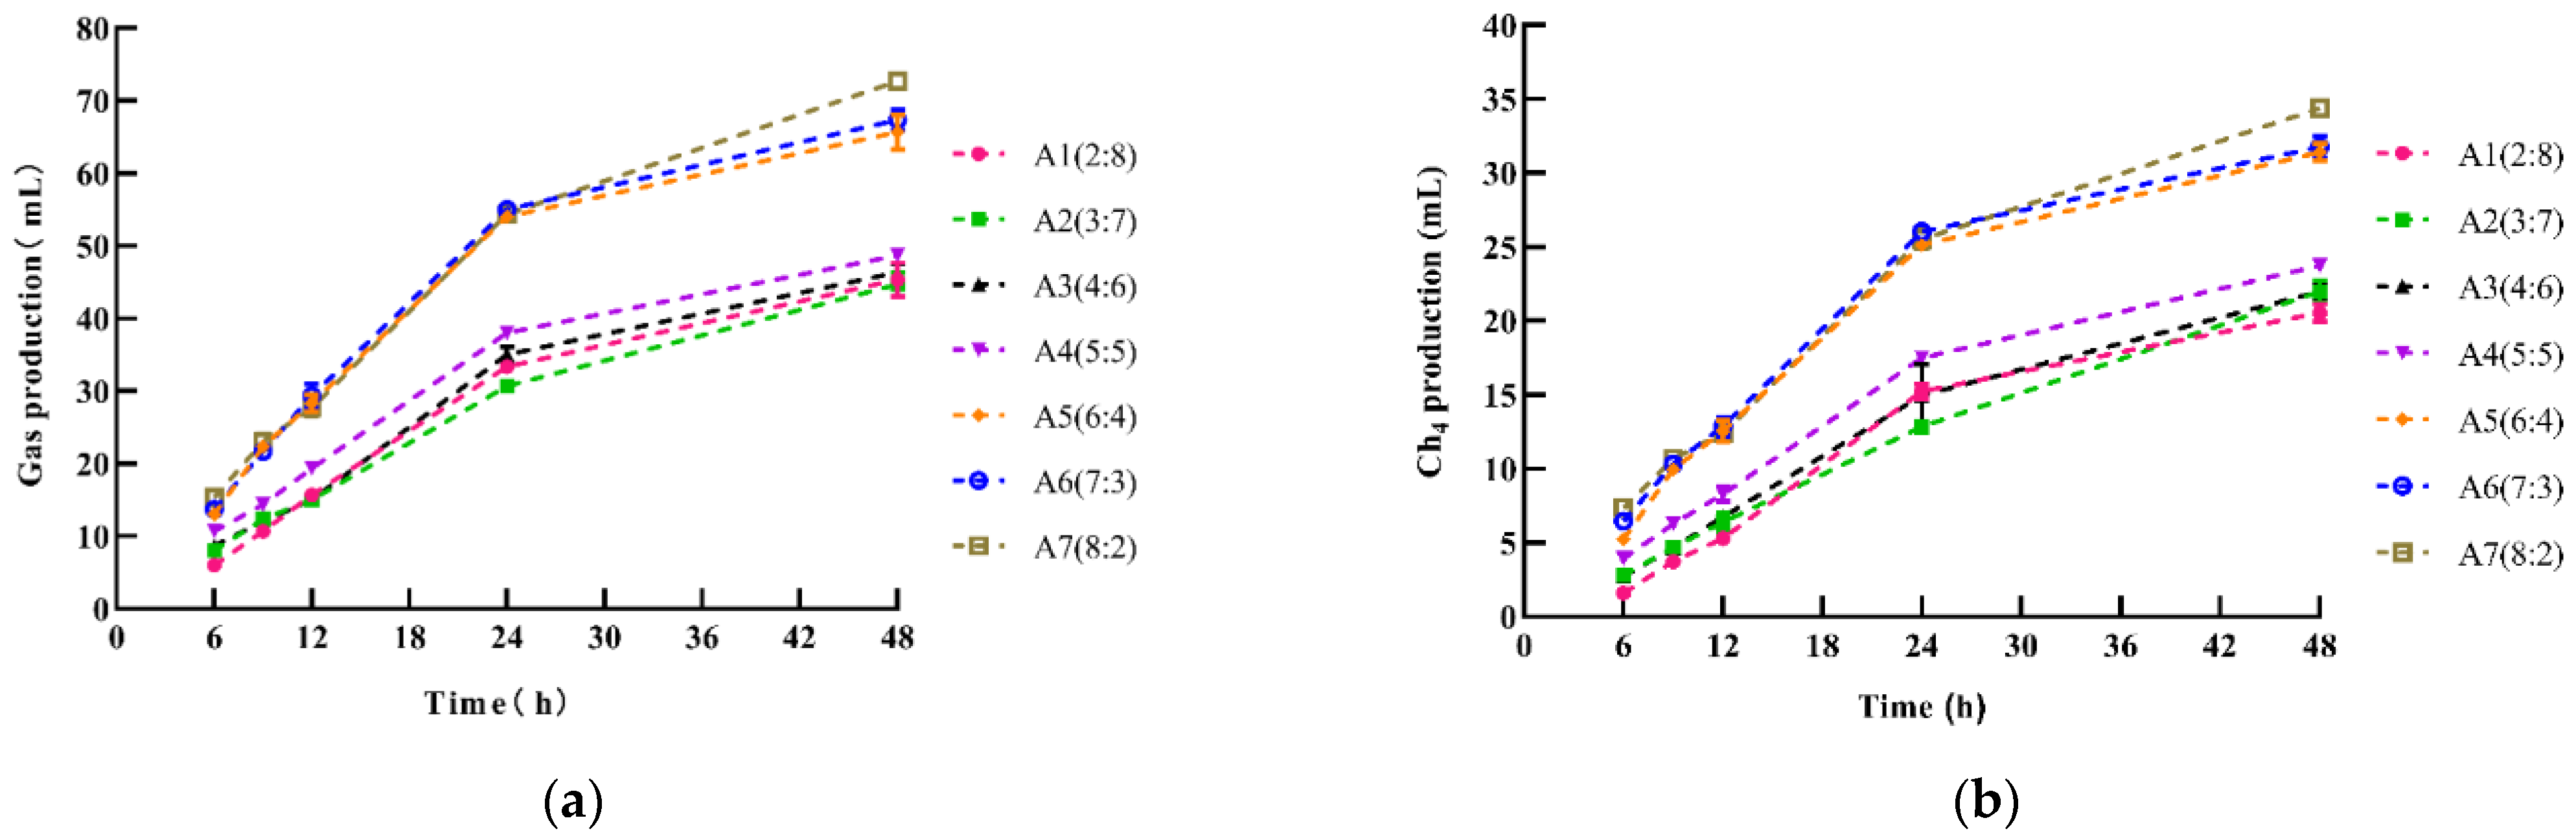
3.3. In Vitro Gas Production Test Results

It can be seen in Table 6 that, at the same proportion, the in vitro gas production increased significantly with the accumulation of time. At the same accumulation time, the cumulative gas production of A7, A6, and A5 was significantly higher than that of A1, A2, A3, and A4 (p < 0.05). At 6 h and 48 h, A7 gas production was significantly higher than that of the other six groups (p < 0.05). At 6 h, the gas production increased with the increase in the proportion of sorghum straw (A1 < A2 < A3 < A4 < A5 < A6 < A7). Except for groups A3 and A4 (p > 0.05), there were significant differences among the groups (p < 0.05). It can be seen in Figure 1a that with the extension of the culture time, the gas production of each treatment group showed the same change rule, that is, the increase rate was lower before 12 h, and the gas production rate was faster after 12 h. The interaction factor A × B had significant effects on gas production (p < 0.05).
The amount of CH4 in vitro increased significantly with the accumulation of time. At any time, CH4 contents of A7, A6 and A5 were significantly higher than those of A1, A2, A3, and A4 (p < 0.05). At 6 h and 48 h, the CH4 content of A7 was significantly higher than that of the other six groups (p < 0.05). At 6 h, the content of CH4 increased with the proportion of sorghum straw (A1 < A2 < A3 < A4 < A5 < A6 < A7), except that the difference between the A2 group and A3 group was not statistically significant (p > 0.05); the difference between the other groups was statistically significant (p < 0.05). At 9 h, the A1, A2, A3, and A4 CH4 levels increased in turn, and the differences between the groups were significant (p < 0.05); the CH4 levels of A6 were significantly higher than those of A5 and A7 (p < 0.05). It can be seen in Figure 1b that the CH4 gas production in each treatment group showed the same tendency of change; in other words, with the extension of the culture time, the CH4 gas production in each treatment group increased continuously—slowly in the first 12 h and rapidly after 12 h. The interaction factor A × B had significant effects on CH4 gas production (p < 0.05).

3.4. In Vitro Fermentation Parameter Test Results

The fermentation parameters of different proportions of sorghum straw and wheat straw at different time points are shown in Table 7. According to the table, different proportions of the A factor had significant effects on pH, NH3-N, acetate, propionate and butyrate (p < 0.05). Factor B had significant effects on pH, total volatile fatty acid, propionate, butyrate, and acetate/propionate (p < 0.05). With the increase in the sorghum straw proportion, pH gradually increased, except in A7 (A1 < A2, A3, A4 < A5 < A6), and the molar ratio of propionate gradually increased, except in A3. The molar ratios of propionate in A5 and A7 were significantly higher than those in the other groups (p < 0.05). The NH3-N content of A5 was significantly higher than that of A6 and A7 (p < 0.05). The molar ratios of butyrate in A1, A2, A3 and A4 were significantly higher than those of A5, A6 and A7 (p < 0.05). With the accumulation of time, pH gradually decreased (B1 > B2 > B3 > B4 > B5), except in B2, and the molar ratios of butyrate and acetate/propionate also gradually decreased, while total volatile fatty acid and propionate gradually increased (p < 0.05). The interaction factor A × B had significant effects on pH, NH3-N and butyrate (p < 0.05).

4. Discussion

4.1. Evaluation of Mixed Ratio of Sorghum Straw and Ammoniated Wheat Straw by In Situ Nylon Bag Method

In addition to general nutrient analysis, another common method involves studying the degradation characteristics of feed nutrients in the rumen to reflect their nutritional value. The degradation of feed CP in the rumen mainly depends on the residence time of feed in the rumen and the difficulty of fermentation. In addition, the characteristics of the feed itself, such as the composition of feed CP, the content of nonprotein nitrogen and true protein, the physical and chemical properties of true protein, the existence of a cell wall inert barrier and antinutritional factors, also have direct effects [19,20,21]. The more nutrients in the feed digested and absorbed by animals, the higher the feed nutrient degradability and the higher the nutritional value of the feed [22]. Li et al. [23] evaluated the nutritional value of sorghum leaves with Dorper × small-tail Han hybrid F1 mutton sheep with a permanent rumen fistula. The results showed that the degradability of DM was 24.86%, 27.69%, 39.50%, and 51.37% when the sorghum leaves were detained in the rumen for 6 h, 12 h, 24 h, and 48 h, respectively. The degradability of CP was 36.95%, 45.27%, 59.23%, and 75.09%, respectively. Liu et al. [24] studied the degradation characteristics of 10 types of roughage in the rumen of dairy cows. The results showed that the effective degradability of DM of wheat straw was 34.20% (the lowest of the 10 types of roughage), and the effective degradability of CP was 45.11%. Yu et al. [25] studied the nutrient composition and rumen degradation characteristics of food crop straw and vine crop straw and measured the rumen degradability of wheat straw at 6 h, 12 h, 24 h, and 48 h. The rumen degradability of DM was 10.44%, 17.20%, 23.08%, and 32.17% at the respective time points. The degradability of CP in the rumen was 20.50%, 29.10%, 42.91%, and 51.59%, respectively. In this experiment, when the residence time was 6 h, 12 h, 24 h, and 48 h, the degradability of DM of S:AWS with different ratios was 19.17%, 23.14%, 27.64%, and 32.29%, respectively, and the degradability of CP was 17.95%, 21.13%, 23.69%, and 26.69%, respectively. The differences between the abovementioned reports are obvious. In our experiment, compared with the wheat straw reported by Yu et al., the degradability of DM was higher, while the degradability of CP was lower; compared with the sorghum leaves reported by Li et al., the degradability of DM and CP was lower. When the ratio of S:AWS was 8:2, the rumen degradability of DM, OM, CP, and ash was the highest. When the ratio was 2:8, the rumen degradability of DM, OM, CP, and ash was significantly lower. In other ratios, the rumen degradability of DM, OM, CP, and ash increased with the increase in sorghum straw content.
There are several reasons for these findings, as follows. First, wheat straw contains such nutrients as water, crude protein, acid detergent fiber, and soluble sugar, but the nutrient content is low, meaning it needs to be mixed with other feeds to form a complete mixed feed. Second, the crude protein in sorghum straw is higher than that in wheat straw, which can provide energy for fiber-degrading bacteria in the rumen to promote the degradation of straw fibers. Third, the sorghum energy component is the main component of the feed, accounting for 60% to 70%, and the nutritional value of sorghum is generally estimated to be 85% to 90% of wheat. The apparent degradability of sorghum is generally higher than that of wheat. The crude protein content of common sorghum is also higher than that of wheat. The essential amino acid composition is lower than that in wheat, except for lysine, methionine, and cysteine, where the content is higher than or equal to that of wheat [26]. Fourth, Mckee et al. [27] found that the difference in the chemical composition and structure of different feeds resulted in some differences in the outflow rate of rumen chyme. Poloyorach et al. [28] reported that the difference in the residence time of different feeds in the rumen (the efflux time of rumen chyme determines the residence time) is an important factor affecting their degradability. Fifth, the degradability of a feed is closely related to the nature and mix ratio of the feed to which it is paired. Therefore, the degradability of the feed is not constant, but varies with the combination and proportion of the feed. Meng et al. [29] studied the combination effect of wheat straw and four types of unconventional feeds (sprayed corn husk, soybean husk, orange peel, and apple residue) and found that the DM degradability of the combinations of wheat straw and sprayed corn husk, soybean husk, orange peel, and apple residue gradually decreased with the increase in the proportion of wheat straw.

4.2. Evaluation of Degradability In Vitro

The dietary fiber proportion and water content are the internal factors affecting dry matter intake and the degradability of the main nutrients [30]. Fiber can stimulate ruminant chewing and rumination, promote salivary secretion, improve rumen buffering capacity, and maintain rumen fermentation function. An appropriate dietary fiber level can increase dry matter intake, which is closely related to the degradability of nutrients in the diet [31]. In this experiment, the IVDMD of sorghum straw and ammoniated wheat straw mixed in different proportions was significantly different, and as the proportion of sorghum straw increased, the degradability of DM of the mixture also increased. This is because the crude fiber content of sorghum straw (346.3 g/kg) is lower than that of ammoniated wheat straw (406.3 g/kg). The higher the proportion of sorghum straw in the mixture of sorghum straw and ammoniated wheat straw, the lower the content of crude fiber, the easier it is for the rumen microorganisms to digest, the higher the degradability of DM, and the higher the nutritional value of sorghum. The results of this analysis are consistent with Luis’s [32] analysis and evaluation of the nutritional quality of sorghum and wheat straw feed, which showed that the nutritional value of hazelnut, millet, and sorghum was higher than that of wheat and oat straw. The IVOMD of sorghum straw and ammoniated wheat straw under different ratios was significantly different. When the ratio of S:AWS was 2:8, 3:7, 4:6, 6:4, 7:3 and 8:2, the IVOMD increased with the increase in the sorghum ratio, which is similar to the in vitro degradability of dry matter.
In this experiment, the DM and OM degradability of sorghum straw and ammoniated wheat straw at different ratios was measured in vitro and in vivo. It was obvious that the degradability in vitro was significantly higher than that in vivo. Xie et al. [33] compared the application of the nylon bag method and in vitro method in the study of the nutritional value of ruminant feed. It was found that the nylon bag method can directly reflect the nutritional composition and nutritional value of feed samples, but when it is used for feed containing a large number of soluble components, the rumen effective degradability will be high when measured. Although the in vitro method can completely reflect the degradation of the feed ingredients, it is not intuitive enough to reflect the nutrient composition or nutritional value of the feed.

4.3. Effect of In Vitro Gas Production Method Evaluation

The in vitro fermentation gas production of feed can reflect the fermentable degree of feed in the rumen, the number of rumen microorganisms, degradability, and the characteristics of the fermentation substrate, which together determine the gas production of feed in vitro fermentation [34,35]. Metzler et al. [36] showed that adding the nutritional value of the feed itself in the early stage of in vitro culture will underestimate the degree of fermentation of the diet, which may affect the amount of rumen fermentation gas production. In this experiment, the gas production of different feed ratios increased with the prolongation of the fermentation time, but it did not increase linearly, which is similar to the results of Robinson and other studies [37]. In the combination of sorghum straw and ammoniated wheat straw, the gas production increased with the increase in the proportion of sorghum straw, which may be caused by the different amounts and composition of carbohydrates in different proportions of straw. The source of gas production from crop straw in vitro is mainly carbohydrates. The proteins contained in them also produce a part of the gas when fermented in vitro, but the contribution of protein to gas production is much lower than that of carbohydrates in the whole process of in vitro fermentation [38]. Cone et al. [39] studied the in vitro fermentation of casein and starch and found that the gas production of protein fermentation after fermentation for 72 h was only 30% carbohydrates. Hai [40] evaluated the nutritional value of natural herbage in the Qinghai Plateau by gas production in vitro. It was found that with the increase in the culture time in vitro, the average gas production increased gradually. There was no significant difference in the average gas production between 2 and 8 h (p < 0.05), but the average gas production increased sharply from 12 to 48 h (p < 0.01). After 48 h, the average gas production increased gradually, and the difference was not significant (p > 0.05). It can be seen in Figure 1 that in this experiment, the in vitro fermentation gas production and CH4 gas production of sorghum straw and ammoniated wheat straw at different proportions tended to be flat at 6–12 h and increased sharply after 12 h. The results of these experiments are different, and the difference between the two may be due to the difference in the fermentation substrate and the composition of the fermentation broth. However, the study of Basangzhuza et al. [41] showed that the gas production of Tibetan wheat straw in vitro fermentation tended to be flat at 6–12 h and increased sharply after 12 h, which is consistent with our results. The reason may be that Hai evaluated the natural grassland in Qinghai Province, while Basangzhuza and others evaluated a straw feed. Previous studies have shown that there is a strong correlation between the gas production (CO2 and CH4) and the measured value of the in vivo degradability of the feed samples in the rumen fluid. The stronger the degradability of the feed, the higher the activity of the microorganisms in the rumen. The greater the gas production, the lower the activity of the microorganisms in the rumen [42]. In this experiment, with the increase in the proportion of sorghum, the yield of CH4 also increased, but from the absolute yield of CH4, the yield was not high (0.00194–0.03439 uL/g), and the proportion of total gas production was also low (0.0307–0.0473%). Therefore, with the increase in the proportion of sorghum straw, the proportion of ammoniated wheat straw decreased, the energy loss was small and the nutritional value could be utilized.

4.4. Evaluation of Fermentation Parameters In Vitro

Rumen fermentation parameters can comprehensively reflect the fermentation conditions and environmental changes in the rumen. The pH range of ruminants maintaining a normal rumen physiology is 5.5–7.0 [43]. High or low concentrations of NH3-N are unfavorable for rumen fermentation. If the concentration of NH3-N is too high, the rate of ammonia released from the nitrogen source by rumen microorganisms exceeds the rate of protein synthesis by microorganisms, which increases the loss of nitrogen in the nitrogen cycle of the rumen; a low concentration of NH3-N limits the efficiency of cellulose decomposition by cellulose-decomposing bacteria [44]. NH3-N is a nitrogen source for bacterial protein synthesis, and the optimal concentration of NH3-N is 0–50 mg/dL [45]. In this experiment, the pH and NH3-N content were within the normal range of rumen fermentation. With the increase in the sorghum straw proportion, the molar ratio of propionate increased, and acetate/propionate decreased. Liu et al. [46] found that with an increase in roughage quality, the concentration of propionic acid showed an upward trend, and acetate/propionate showed a downward trend, which is consistent with the results of this experiment. Propionate is the main sugar heterogeneous substance in ruminants. When the proportion of propionic acid is high, it can provide high effective energy for ruminants to some extent. This indicates that the increase in the sorghum straw proportion in the diet had a positive effect on rumen fermentation [47].

5. Conclusions

When the optimal ratio of sorghum straw to wheat straw was 8:2, the sheep better utilized the feed, but Ch4 production also increased, and some measures need to be taken to inhibit the generation of Ch4. The in vitro gas production method can replace the in vivo test to evaluate the nutritional value of roughage to a certain extent.

Author Contributions

Conceptualization, J.W. and Z.Z.; data curation, H.L.; formal analysis, J.W.; methodology, J.W., Z.Z., H.L. and J.X.; supervision, T.L. and C.Z.; validation, J.W., Z.Z., T.L. and C.W.; writing—original draft, J.W.; writing—review and editing, C.Z., J.W. and J.X. All authors have read and agreed to the published version of the manuscript.

Funding

This work was supported by the Project of Research Condition Construction and Achievement Transformation of Gansu Academy of Agricultural Sciences (Modern Biological Breeding, 2021GAAS01) and the National Natural Science Foundation of China (31860657, 32160803).

Institutional Review Board Statement

All experiments in this study were conducted following the approved guidelines of the Regulation Standing Committee of Gansu People’s Congress. All experimental protocols and sample collections were approved by the Ethics Committee of the Gansu Agriculture University under permit number GAU-LC-2020-018.

Informed Consent Statement

Not applicable.

Data Availability Statement

The data presented in this study are available upon reasonable request from the corresponding authors.

Acknowledgments

We thank the Animal Science Training and Teaching Center of Gansu Agricultural University for providing the test platform.

Conflicts of Interest

The authors declare that there are no conflict of interest.

Abbreviations

SSorghum straw
AWSAmmoniated wheat straw
IVDMDIn vitro dry matter degradability
IVOMDIn vitro organic matter degradability
DMDry matter
OMOrganic matter
CPCrude protein
EDEffective degradability

References

  1. Kaur, R.; Garcia, S.C.; Fulkerson, W.J.; Barchia, I.M. Degradation kinetics of leaves, petioles and stems of forage rape (Brassica napus) as affected by maturity. Anim. Feed Sci. Technol. 2011, 168, 165–178. [Google Scholar] [CrossRef]
  2. Getachew, G.; DePeters, E.J.; Robinson, P.H.; Fadel, J.G. Use of an in vitro rumen gas production technique to evaluate microbial fermentation of ruminant feeds and its impact on fermentation products. Anim. Feed Sci. Technol. 2005, 123, 547–559. [Google Scholar] [CrossRef]
  3. Li, S.L.; Shi, H.T.; Cao, Z.J.; Wang, Y.J. Scientific utilization and evaluation technology of forage. Chin. J. Anim. Nutr. 2014, 26, 3149–3158. [Google Scholar]
  4. Ørskov, E. Recent advances in evaluation of roughages as feeds for ruminants. In Advances in Animal Nutrition; Farell, D.J., Ed.; University of New England Printery: Armidale, Australia, 1989; pp. 102–108. [Google Scholar]
  5. Wei, C.Z.; Zhang, M.M.; Sun, Y.R.; Jiang, M.Y.; Xie, X.L. Research progress on nutritional value evaluation of roughage for meat sheep. In Proceedings of the National Sheep Production and Academic Seminar, Bengbu, China, 16 August 2018; p. 150. [Google Scholar]
  6. Li, Y.L.; Ding, J.; Lu, L.; Cao, Y.C. Ruminant feed nutritional value evaluation and the model application. China Herbiv. Sci. 2014, 34, 45–50. [Google Scholar]
  7. France, J.; Dijkstra, J.; Dhanoa, M.S.; Lopez, S.; Bannink, A. Estimating the extent of degradation of ruminant feeds from a description of their gas production profiles observed in vitro: Derivation of models and other mathematical considerations. Br. J. Nutr. 2000, 83, 143–150. [Google Scholar] [CrossRef] [PubMed] [Green Version]
  8. Grander, D.; Singh, N.P.; Dhiman, K.R. Nutritional evaluation of cultivated fodder crops grown under agro-climate of Tripura. Indian J. Anim. Sci. 2009, 79, 1143–1148. [Google Scholar]
  9. Liu, B.; Qin, T. Application of wheat straw used in animal production. Feed Rev. 2015, 11, 12–14. [Google Scholar]
  10. Kang, J.; Kuang, Y.B.; Sheng, J. Analysis of nutritive value of 10 forages straw. Prata Sci. 2014, 31, 1951–1956. [Google Scholar]
  11. Muzaffar, M.H. Simplification of Urea Treatment Method to Improve the Nutritive Value of Cereal Straw; AGRIS: Rome, Italy, 2005; Volume 22, pp. 46–54. [Google Scholar]
  12. Menke, K.H. Estimation of the energetic feed value obtained from chemical analysis and in vitro gas production using rumen fluid. Anim. Res. Dev. 1988, 28, 7–55. [Google Scholar]
  13. Akinfemi, A.; Adua, M.M.; Adu, O.A. Evaluation of nutritive values of tropical feed sources and by-products using in vitro gas production technique in ruminant animals. Emir. J. Food Agric. 2013, 24, 348–353. [Google Scholar]
  14. Lutakome, P.; Kabi, F.; Tibayungwa, F.; Laswaic, G.H.; Kimambo, A.; Ebong, C. Rumen liquor from slaughtered cattle as inoculum for feed evaluation. Anim. Nutr. 2017, 3, 300–308. [Google Scholar] [CrossRef] [PubMed]
  15. Van Soest, P.J.; Robertson, J.B.; Lewis, B.A. Methods for dietary fiber, neutral detergent fiber, and nonstarch polysaccharides in relation to animal nutrition. J. Dairy Sci. 1991, 74, 3583–3597. [Google Scholar] [CrossRef]
  16. Broderick, G.A.; Kang, J.H. Automated simultaneous determination of ammonia and total amino acids in ruminal fluid and in vitro media. J. Dairy Sci. 1980, 63, 64–75. [Google Scholar] [CrossRef]
  17. Ørskov, E.R.; McDonald, I. The estimation of protein degradability in the rumen from incubation measurements weighted according to rate of passage. J. Agric. Sci. 1979, 92, 499–503. [Google Scholar] [CrossRef] [Green Version]
  18. Dijkstra, J.; Neal, H.D.S.C.; Beever, D.E.; France, J. Simulation of nutrient digestion, absorption and outflow in the rumen: Model description. J. Nutr. 1992, 122, 2239–2256. [Google Scholar] [CrossRef]
  19. Marcondes, M.I.; Valadares Filho, S.C.; Detmann, E.; Valadares, R.F.D.; Silva, L.F.C.; Fonseca, M.A. Rumen degradation and intestinal digestibility of crud the estimation of protein degradability in the rumen from incubation measurements weighted according to rate of passage. e protein in feeds for cattle. Rev. Bras. Zootec. 2009, 38, 2247–2257. [Google Scholar] [CrossRef] [Green Version]
  20. Chen, Y.; Zhang, X.M.; Wang, Z.S.; Peng, Q.H.; Zou, H.W. Ruminal degradation characteristics and small intestinal digestibility of rumen undegraded protein of six kinds of commonly used roughages for steers. Chin. J. Anim. Nutr. 2014, 26, 2145–2154. [Google Scholar]
  21. Hao, S.H.; Ding, N.; Zhao, J.X.; Ren, Y.S.; Zhang, W.J.; Xiang, B.W.; Zhang, J.X. Ruminal degradability characteristics of different roughages for sheep. China Herbiv. Sci. 2017, 37, 16–21. [Google Scholar]
  22. Van Zijderveld, S.M.; Fonken, B.; Dijkstra, J.; Gerrits, W.J.J.; Perdok, H.B.; Fokkink, W.; Newbold, J.R. Effects of a combination of feed additives on methane production, diet digestibility, and animal performance in lactating dairy cows. J. Dairy Sci. 2011, 94, 1445–1454. [Google Scholar] [CrossRef] [Green Version]
  23. Li, H.G.; Diao, X.G.; Zhao, J.X.; Ren, Y.S.; Zhang, C.X. Ruminal degradability characteristics of four unconventional roughages in mutton sheep. China Herbiv. Sci. 2017, 37, 18–22. [Google Scholar]
  24. Liu, Y.F.; Ma, J.; Wang, Y.; Cao, Z.; Li, S.; Yu, X. Degradation characteristics of common roughage and roughage forage in the rumen of dairy cows. Chin. J. Anim. Nutr. 2018, 30, 1592–1602. [Google Scholar]
  25. Yu, S.C.; Cao, S.Q.; Ren, Y.S.; Zhang, C.X.; Zhang, W.J.; Xiang, B.W.; Zhang, J.X. Nutritional value and rumen degradability characteristics of common crop straws for sheep. Chin. J. Anim. Sci. 2017, 53, 69–74. [Google Scholar]
  26. Lin, F.D.; Knabe, D.A.; Tanksley, T.D., Jr. Apparent digestibility of amino acids, gross energy and starch in corn, sorghum, wheat, barley, oat groats and wheat middlings for growing pigs. J. Anim. Sci. 1987, 64, 1655. [Google Scholar] [CrossRef] [PubMed]
  27. McKee, C.A.; Cushnahan, A.; Mayne, C.S.; Unsworth, E.F. The effect of partial replacement of grass silage with fresh grass on rumen fermentation characteristics and rumen outflow rates in cattle. Grass Forage Sci. 1996, 51, 32–41. [Google Scholar] [CrossRef]
  28. Polyorach, S.; Poungchompu, O.; Wanapat, M.; Kang, S.; Cherdthong, A. Optimal cultivation time for yeast and lactic acid bacteria in fermented milk and effects of fermented soybean meal on rumen degradability using nylon bag technique. Asian-Australas. J. Anim. Sci. 2016, 29, 1273–1279. [Google Scholar] [CrossRef] [Green Version]
  29. Meng, M.J.; Tu, Y.L.; Bai, Y.F.; Yan, S.; Gao, L.; Liu, P.; Liu, J. Combination effects on wheat straw and non-conventional feeds. Chin. J. Anim. Nutr. 2016, 28, 3005–3014. [Google Scholar]
  30. Estrada, J.I.C.; Delagarde, R.; Faverdin, P.; Peyraud, J.L. Dry matter intake and eating rate of grass by dairy cows is restricted by internal, but not external water. Anim. Feed Sci. Technol. 2004, 114, 59–74. [Google Scholar] [CrossRef]
  31. Li, W.J.; Diao, Q.Y. Research progress on dry matter intake of mutton sheep and related influencing factors. Chin. J. Anim. Sci. 2016, 52, 95–99. [Google Scholar]
  32. Luis, E.S.; Sullivan, T.W.; Nelson, L.A. Nutritional value of proso millets, sorghum grains, and corn in turkey starter diets. Poult. Sci. 1982, 61, 321–326. [Google Scholar] [CrossRef]
  33. Xie, C.Y.; Yang, H.J.; Yao, X.B.; Yue, Q.; Wang, J.Q. Comparison of in situ nylon bag technique and in vitro gas production for evaluating the feedstuff of ruminant. Chin. J. Anim. Sci. 2007, 43, 39–42. [Google Scholar]
  34. Fan, Q.S.; Diao, Q.Y.; Bi, Y.L.; Wang, B.; Cheng, S.R.; Fu, T.; Tu, Y. Effects of three kinds of plant cakes on in vitro gas production, rumen fermentation and degradation characteristics in beef cattle. Feed Ind. 2018, 39, 9–17. [Google Scholar]
  35. Yang, H.J.; Li, D.H.; Xie, C.Y.; Yue, Q. Effects of ferulic acid esterase supplementation on rumen fermentation characteristics of Chinese wildrye, corn stalk, rice straw and wheat straw by in vitro batch culture. Chin. J. Anim. Nutr. 2010, 22, 207–211. [Google Scholar]
  36. Metzler-Zebeli, B.U.; Scherr, C.; Sallaku, E.; Drochner, W.; Zebeli, Q. Evaluation of associative effects of total mixed ration for dairy cattle using in vitro gas production and different rumen inocula. J. Sci. Food Agric. 2012, 92, 2479–2485. [Google Scholar] [CrossRef] [PubMed]
  37. Robinson, P.H.; Getachew, G.; Cone, J.W. Evaluation of the extent of associative effects of two groups of four feeds using an in vitro gas production procedure. Anim. Feed Sci. Technol. 2009, 150, 9–17. [Google Scholar] [CrossRef]
  38. Zhou, C.; Tang, S.; Jiang, H.; Tan, Z. In vitro fermentation characteristics of crop straws and their combined utilization. Chin. J. Appl. Ecol. 2005, 16, 1862–1867. [Google Scholar]
  39. Cone, J.W.; Van Gelder, A.H. Influence of protein fermentation on gas production profiles. Anim. Feed Sci. Technol. 1999, 76, 251–264. [Google Scholar] [CrossRef]
  40. Hai, C.X. Study on Nutritive Value of Assessing Native Grass on Qinghai Plateau by Gas Production Method In Vitro. Master’s Thesis, Qing Hai University, Xining, China, 2007. [Google Scholar]
  41. Chen, L.; Yu, C.; Zhao, L.; Zhou, C.; Li, B. Study on in vitro fermentation characteristics of different crop straws in Tibet region. Chin. J. Anim. Nutr. 2017, 29, 719–728. [Google Scholar]
  42. Wang, F.; Xu, Y.J.; Niu, J.L.; Zhao, M.; Zhang, Y.D.; Zhang, K.Z. Nutrient value evaluation of different type feeds by in vitro gas production method. China Anim. Husb. Vet. Med. 2016, 43, 76–83. [Google Scholar]
  43. Krause, K.M.; Oetzel, G.R. Understanding and preventing subacute ruminal acidosis in dairy herds: A review. Anim. Feed Sci. Technol. 2006, 126, 215–236. [Google Scholar] [CrossRef]
  44. Hristov, A.N.; Ropp, J.K.; Hunt, C.W. Effect of barley and its amylopectin content on ruminal fermentation and bacterial utilization of ammonia-N in vitro. Anim. Feed Sci. Technol. 2002, 99, 25–36. [Google Scholar] [CrossRef]
  45. Han, Z.K.; Chen, J. The Digestion and Metabolism of Ruminant Rumen; Science Press: Beijing, China, 1988. [Google Scholar]
  46. Liu, D.C.; Lu, D.X.; Hou, X.Z.; Gao, M.; Sun, H.Z. Effect of dietary forage of different qualities on rumen fermentation and predominant fibrolytic bacterial populations. Sci. Agric. Sin. 2008, 41, 1199–1206. [Google Scholar]
  47. Ørskov, E.R. Starch digestion and utilization in ruminants. J. Anim. Sci. 1986, 63, 1624–1633. [Google Scholar] [CrossRef] [PubMed]
Figure 1. (a) In vitro gas production at different time points. (b) In vitro CH4 production at different time points. A1 (2:8), A2 (3:7), A3 (4:6), A4 (5:5), A5 (6:4), A6 (7:3), and A7 (8:2) represent proportions of sorghum straw and ammoniated wheat straw of 2:8, 3:7, 4:6, 5:5, 6:4, 7:3 and 8:2, respectively.
Fermentation 08 00415 g001
Table 1. Chemical composition of sorghum straw and wheat straw (dry matter basis, DM %).
ItemSorghum StrawWheat StrawAmmoniated Wheat Straw
DM (%)89.391.6092.35
CP (%)6.362.806.03
Crude fiber (%)34.6340.6334.40
Ether extract (%)1.821.201.87
Ca (%)0.770.26
P (%)0.200.03
Table 2. Test diet composition and nutrient level (dry matter basis, DM %).
ItemConcentrationNutrition LevelConcentration
Corn29.29DM (%)90.27
Soybean meal9.00DE (MJ/kg)10.32
Cottonseed meal1.50CP (%)11.03
Alfalfa hay26.00DE/CP (MJ/g)0.094
Oat grass33.00Ca (%)0.53
Salt0.70P (%)0.23
Additive premix 10.51
Total100.00
1 Additive premix provides the components per kg diet: S 200 mg·kg−1, Fe 25 mg·kg−1, Zn 40 mg·kg−1, Cu 8 mg·kg−1, I 0.3 mg·kg−1, Mn 40 mg·kg−1, Se 0.2 mg·kg−1, Co 0.1 mg·kg−1, vitamin A 940 IU·kg−1, vitamin E 20 IU·kg−1.
Table 3. Effects of different proportions of sorghum straw and ammoniated wheat straw on rumen dry matter, organic matter, crude ash, and crude protein degradability at different time points.
A
Sorghum Straw:Ammoniated Wheat Straw
B Time (h)Ruminal Degradability
DM%OM%CP%Ash%
A1 (2:8)B1 (6 h)11.5416.2214.8618.35
B2 (12 h)14.7418.9216.9724.38
B3 (24 h)22.9022.6619.5627.90
B4 (48 h)28.6030.0621.6032.00
A2 (3:7)B1 (6 h)20.1117.6915.2622.20
B2 (12 h)25.0221.1619.1526.35
B3 (24 h)29.6326.4622.4930.12
B4 (48 h)34.2032.7724.0235.74
A3 (4:6)B1 (6 h)19.9817.3116.2624.15
B2 (12 h)22.6120.1120.5228.51
B3 (24 h)24.3123.5823.1334.61
B4 (48 h)31.2531.4926.0637.42
A4 (5:5)B1 (6 h)19.5018.8818.4025.38
B2 (12 h)23.7824.5622.0033.30
B3 (24 h)26.3627.4724.2036.62
B4 (48 h)29.0531.0528.4038.42
A5 (6:4)B1 (6 h)18.4719.2919.2027.14
B2 (12 h)21.5124.9521.6235.05
B3 (24 h)25.1127.3923.4939.21
B4 (48 h)29.8733.7126.7941.50
A6 (7:3)B1 (6 h)21.7922.5520.4028.24
B2 (12 h)26.6626.9823.3534.58
B3 (24 h)32.2931.5525.5037.00
B4 (48 h)39.5433.4928.5742.70
A7 (8:2)B1 (6 h)22.8322.5221.3031.43
B2 (12 h)27.6526.2324.3333.78
B3 (24 h)32.9132.3627.5039.65
B4 (48 h)40.5138.7031.4042.32
AA1 (2:8)19.45 d21.97 e18.25 f25.66 e
A2 (3:7)24.67 bc24.52 d20.23 e28.60 d
A3 (4:6)24.54 c23.12 e21.49 ed31.17 c
A4 (5:5)23.74 c25.49 cd23.25 bc33.43 b
A5 (6:4)27.24 b26.34 c22.77 cd35.72 a
A6 (7:3)30.07 a28.64 b24.45 b35.63 a
A7 (8:2)30.97 a29.95 a26.13 a36.80 a
BB1 (6 h)19.17 d19.21 d17.95 d25.27 d
B2 (12 h)23.14 c23.27 c21.13 c30.85 c
B3 (24 h)27.64 b27.35 b23.69 b35.01 b
B4 (48 h)33.29 a33.04 a26.69 a38.58 a
SEM0.650.560.400.61
p-valueA<0.001<0.001<0.001<0.001
B<0.001<0.001<0.001<0.001
A × B0.011<0.0010.3290.012
A1 (2:8), A2 (3:7), A3 (4:6), A4 (5:5), A5 (6:4), A6 (7:3) and A7 (8:2) represent proportions of sorghum straw and ammoniated wheat straw of 2:8, 3:7, 4:6, 5:5, 6:4, 7:3, and 8:2, respectively. DM, dry matter; OM, organic matter; CP, crude protein; SEM, standard error of mean. Data with different superscript letters within each column are significantly different (p < 0.05).
Table 4. Rumen kinetic parameters and effective degradability of DM and CP in different proportions of sorghum straw and ammoniated wheat straw.
A
Sorghum Straw:Ammoniated Wheat Straw
DMCP
a (%)b (%)c (%/h)a + bED (%)a (%)b (%)c (%/h)a + bED (%)
A1 (2:8)5.19 b27.950.04 ab33.14 ab20.77 d11.56 ab10.910.0622.48 c18.58 d
A2 (3:7)14.31 a21.710.06 ab36.03 ab27.98 b8.37 b16.010.0924.38 bc20.31 c
A3 (4:6)18.45 a29.860.01 b48.31 a27.11 b10.36 b16.480.0826.84 abc21.77 c
A4 (5:5)16.22 a17.410.08 a29.67 b24.81 c14.99 ab16.810.0531.80 ab23.99 b
A5 (6:4)15.20 a21.760.03 ab36.96 ab24.82 c17.09 a15.100.0332.19 ab23.47 b
A6 (7:3)16.69 a33.870.03 ab50.56 a31.73 a17.43 a12.420.0529.85 abc24.93 b
A7 (8:2)18.15 a29.320.03 ab47.46 a32.58 a18.03 a15.940.0433.97 a26.88 a
SEM1.021.650.012.070.860.910.640.011.040.59
p-value<0.0010.0660.0570.005<0.0010.0010.0640.1830.002<0.001
A1 (2:8), A2 (3:7), A3 (4:6), A4 (5:5), A5 (6:4), A6 (7:3), and A7 (8:2) represent proportions of sorghum straw and ammoniated wheat straw of 2:8, 3:7, 4:6, 5:5, 6:4, 7:3, and 8:2, respectively. DM, dry matter; CP, crude protein; a, soluble fraction (%); b, slowly degradable fraction (%); c, rate of degradation of the b fraction (%/h); a + b, potential degradability; ED, effective degradability; SEM, standard error of means. Data with different superscript letters within each column are significantly different (p < 0.05).
Table 5. In vitro degradability of dry matter and organic matter in 48 h of sorghum straw and ammoniated wheat straw with different proportions.
A
Sorghum Straw:Ammoniated Wheat Straw
IVDMD%IVOMD%
A1 (2:8)42.76 c45.21 cd
A2 (3:7)44.90 bc47.91 cd
A3 (4:6)45.89 bc49.25 bcd
A4 (5:5)48.59 ab46.88 cd
A5 (6:4)49.00 ab52.26 abc
A6 (7:3)48.56 a54.69 ab
A7 (8:2)52.01 a56.78 a
SEM2.843.95
p-value0.0110.001
A1 (2:8), A2 (3:7), A3 (4:6), A4 (5:5), A5 (6:4), A6 (7:3) and A7 (8:2) represent proportions of sorghum straw and ammoniated wheat straw of 2:8, 3:7, 4:6, 5:5, 6:4, 7:3 and 8:2, respectively. IVDMD, in vitro dry matter degradability; IVOMD, in vitro organic matter degradability; SEM, standard error of mean. Data with different superscript letters within each column are significantly different (p < 0.05).
Table 6. In vitro gas production at different time points.
A
Sorghum Straw:Ammoniated Wheat Straw
B
Time (h)
Gas Production (mL)CH4 Production (mL)
A1 (2:8)B1 (6 h)6.001.61
B2 (9 h)10.673.74
B3 (12 h)15.675.30
B4 (24 h)33.3315.23
B5 (48 h)45.3320.54
A2 (3:7)B1 (6 h)8.332.79
B2 (9 h)12.334.68
B3 (12 h)15.006.39
B4 (24 h)30.6712.84
B5 (48 h)44.6722.00
A3 (4:6)B1 (6 h)10.002.72
B2 (9 h)12.004.64
B3 (12 h)16.006.73
B4 (24 h)35.0014.96
B5 (48 h)46.3321.98
A4 (5:5)B1 (6 h)11.003.92
B2 (9 h)14.336.26
B3 (12 h)19.338.30
B4 (24 h)38.0017.49
B5 (48 h)48.6723.74
A5 (6:4)B1 (6 h)13.005.22
B2 (9 h)22.339.95
B3 (12 h)28.3312.54
B4 (24 h)54.0025.12
B5 (48 h)65.6731.41
A6 (7:3)B1 (6 h)14.506.45
B2 (9 h)21.6710.33
B3 (12 h)29.3312.89
B4 (24 h)55.0026.05
B5 (48 h)67.3331.76
A7 (8:2)B1 (6 h)16.677.34
B2 (9 h)23.0010.68
B3 (12 h)27.6712.39
B4 (24 h)54.3325.52
B5 (48 h)72.6734.39
AA1 (2:8)22.20 d9.28 d
A2 (3:7)22.13 d9.74 d
A3 (4:6)23.40 d10.21 d
A4 (5:5)26.20 c11.94 c
A5 (6:4)36.67 b16.85 b
A6 (7:3)37.40 ab17.50 ab
A7 (8:2)38.60 a18.06 a
BB1 (6 h)10.76 e4.29 e
B2 (9 h)16.62 d7.18 d
B3 (12 h)21.48 c9.22 c
B4 (24 h)42.91 b19.60 b
B5 (48 h)55.81 a26.54 a
SEM0.170.09
p-valueA<0.001<0.001
B<0.001<0.001
A × B<0.001<0.001
A1 (2:8), A2 (3:7), A3 (4:6), A4 (5:5), A5 (6:4), A6 (7:3) and A7 (8:2) represent proportions of sorghum straw and ammoniated wheat straw of 2:8, 3:7, 4:6, 5:5, 6:4, 7:3 and 8:2, respectively. SEM, standard error of mean. Data with different superscript letters within each column are significantly different (p < 0.05).
Table 7. Effects of different proportions of sorghum straw and wheat straw on fermentation parameters in vitro at different time points.
A
Sorghum Straw:Ammoniated Wheat Straw
B
Time (h)
pHNH3-N
(mg/dL)
Total Volatile Fatty Acid
(mM)
Acetate
(%)
Propionate
(%)
Butyrate
(%)
Acetate/
Propionate
A1 (2:8)B1 (6 h)6.7925.3744.4070.7911.5510.966.22
B2 (9 h)6.7828.7550.8570.5211.6710.886.04
B3 (12 h)6.7316.0750.5371.6912.0210.275.98
B4 (24 h)6.6614.3357.4682.215.327.845.39
B5 (48 h)6.5717.0898.7971.0414.327.895.10
A2 (3:7)B1 (6 h)6.8523.1636.4170.5812.0110.855.97
B2 (9 h)6.8426.2139.8770.1712.5410.685.60
B3 (12 h)6.7431.5354.5570.4612.4310.795.67
B4 (24 h)6.6815.5482.5969.815.049.184.64
B5 (48 h)6.6818.2597.4270.8215.328.174.62
A3 (4:6)B1 (6 h)6.9123.7439.8370.6712.5810.275.67
B2 (9 h)6.8716.2845.7370.5212.4610.585.66
B3 (12 h)6.8813.2948.7372.1212.429.865.82
B4 (24 h)6.5619.6393.0271.2813.898.725.13
B5 (48 h)6.5823.86107.8870.2215.58.364.53
A4 (5:5)B1 (6 h)6.9111.1839.1771.3712.89.955.54
B2 (9 h)6.8220.3243.6570.4112.9510.455.44
B3 (12 h)6.8722.3446.673.4212.339.115.96
B4 (24 h)6.5933.2684.4871.8814.058.595.12
B5 (48 h)6.6240.55109.3771.2315.018.094.76
A5 (6:4)B1 (6 h)6.9216.5129.0173.3213.098.835.51
B2 (9 h)6.9419.6340.1573.8813.148.465.62
B3 (12 h)6.8938.8750.9774.513.697.745.44
B4 (24 h)6.7141.1989.0874.214.857.165.00
B5 (48 h)6.5722.21105.8473.6915.046.904.90
A6 (7:3)B1 (6 h)6.9311.3624.4648.349.235.725.24
B2 (9 h)6.913.5633.7172.8713.878.665.26
B3 (12 h)6.9115.7848.7074.3713.767.885.41
B4 (24 h)6.8218.9566.6772.9114.797.784.93
B5 (48 h)6.8426.06100.5974.1314.277.005.20
A7 (8:2)B1 (6 h)6.9513.4736.5973.9713.57.985.40
B2 (9 h)6.8914.6244.6073.0114.068.525.20
B3 (12 h)6.8313.6741.7872.8614.518.125.02
B4 (24 h)6.8316.9359.8573.2415.197.324.83
B5 (48 h)6.7619.61100.3262.4814.507.464.29
AA1 (2:8)6.70 d20.32 abc60.6172.61 a12.81 c9.69 a5.74
A2 (3:7)6.76 cd22.94 abc60.7170.41 ab13.36 b9.99 a5.30
A3 (4:6)6.76 cd19.36 abc65.1870.94 ab13.33 b9.62 a5.36
A4 (5:5)6.76 cd25.53 ab63.2471.65 ab13.38 b9.29 a5.37
A5 (6:4)6.81 bc27.68 a61.1573.90 a13.90 a7.87 b5.30
A6 (7:3)6.88 a17.14 bc53.9873.45 a13.97 bc7.38 b5.23
A7 (8:2)6.87 ab15.66 c56.4073.14 ab14.29 a7.92 b4.92
BB1 (6 h)6.89 a17.8335.78 b71.9112.11 c9.23 a5.64 a
B2 (9 h)6.86 a19.9143.14 cd71.6312.97 c9.75 a5.54 a
B3 (12 h)6.85 a21.6548.27 c72.7713.02 bc9.11 a5.61 a
B4 (24 h)6.69 b22.8376.31 b73.6514.73 ab8.08 b4.98 b
B5 (48 h)6.66 b23.95103.93 a70.5214.85 a7.69 b4.78 c
SEM0.0060.9090.8880.8660.1640.0910.020
p-valueA<0.001<0.0010.0570.0080.033<0.0010.510
B<0.0010.297<0.0010.4200.002<0.001<0.001
A × B0.0140.0330.1970.3250.0660.0280.055
A1 (2:8), A2 (3:7), A3 (4:6), A4 (5:5), A5 (6:4), A6 (7:3) and A7 (8:2) represent proportions of sorghum straw and ammoniated wheat straw of 2:8, 3:7, 4:6, 5:5, 6:4, 7:3 and 8:2, respectively. SEM, standard error of mean. Data with different superscript letters within each column are significantly different (p < 0.05).
Publisher’s Note: MDPI stays neutral with regard to jurisdictional claims in published maps and institutional affiliations.

