Article

Investigating the Relation between Skin Cell Wall Composition and Phenolic Extractability in Cabernet Sauvignon Wines

1
Department of Viticulture and Enology, University of California, One Shields Avenue, Davis, CA 95616, USA
2
E&J Gallo Winery, 600 Yosemite Blvd, Modesto, CA 95354, USA
3
Department of Chemical Engineering, University of California, One Shields Avenue, Davis, CA 95616, USA
*
Author to whom correspondence should be addressed.
Fermentation 2022, 8(8), 401; https://doi.org/10.3390/fermentation8080401
Submission received: 8 July 2022 / Revised: 9 August 2022 / Accepted: 16 August 2022 / Published: 18 August 2022

Abstract

:
In this study, phenolic extractability of Cabernet Sauvignon grapes from two California regions (Sonoma County and Central Coast) and its relation with skin cell wall composition was investigated. Phenolic grape composition, wine phenolic content as well as berry and pomace cell wall composition of three sites per region were determined. Grape cell wall material (CWM) composition, and thus pomace CWM composition, was impacted by the growing region. The process of fermentation modified CWM composition, solubilizing some of the compounds such as pectin and polysaccharides making pomace CWM composition from different sites more similar in the case of Sonoma County and more different for the samples grown in the Central Coast. Growing region had a significant impact on grape phenolics, particularly on flavan−3-ols and polymeric phenols, whereas polymeric pigments and anthocyanin contents were more similar among samples. Wines made from Sonoma County grapes showed higher anthocyanin and polymeric phenol content when compared to wines made from Central Coast grapes. Comparing wine to grape phenolic composition suggests a large difference in extractability based on region. Of all the CWM components analyzed, only lignin and the amount of cell wall isolated were found to have a significant impact on phenolic extractability.

1. Introduction

Grape phenolics constitute a large range of diverse chemical structures. Among all the phenolics, anthocyanins and tannins are the most abundant and are located in the skins and the seeds [1,2,3]. After extraction, interactions between anthocyanins and tannins are fundamental for color stabilization and contribute to the aging potential of wines [4,5,6,7]. Wine phenolics are widely recognized as quality indicators, particularly in red wines due to their impact on color, mouthfeel and body [8,9,10].
Previous studies have shown that grape phenolic composition does not directly correlate with the final wine phenolic composition, although grape variety influences the content and extractability of phenolics. Romero-Cascales et al. [11] found that anthocyanin grape concentration and its extractability depended on the variety when comparing Monastrell, Cabernet Sauvignon, Syrah and Merlot. While Monastrell grapes contained the most anthocyanin, it was found to be the most difficult to extract. Cabernet Sauvignon and Syrah wines presented the highest wine color intensity, although their anthocyanin concentration in the grapes was lower than that found in Monastrell grapes. Therefore, the phenolic composition of the wine is mainly dependent on how easily extractable phenolic compounds are at harvest time [12,13,14].
Grape skin cell walls are a protective barrier for the extraction of phenolic compounds that consist mainly of polysaccharides, lipids, proteins and phenolics bound to the cell wall components [15,16,17]. Differences in cell wall composition could impact the extractability of phenolics and relate to the differences observed in skin degradation during fermentation [13,18,19,20]. During ripening, cell wall composition changes favor the release of phenolics; these changes include the depolymerization and solubilization of pectin and the loosening of the cellulose network [21,22,23]. At crushing, grape cell walls are physically broken helping the release of phenolic compounds into the grape must. Furthermore, the extraction of grape phenolics is linked to the diffusion and solubility of certain cell wall components into the fermenting must as well as the alcohol content and fermentation temperature [24,25,26]. Preceding studies have found that phenolic extractability is highly site specific [13,14]. Moreover, vintage has been found to have a significant effect on CWM composition [27,28], confirming that climate could have an impact on phenolic extractability.
Wine terroir is a concept that includes three broad categories: natural, human and historical factors [27]. This concept has been closely associated with food products, including wine, and implies a link between wine characteristics and its origin. Soil and climate are the main elements included in the first category [28,29] and it would be logical to assume that grape origin will impact the composition of the grape, and the resulting wine and marc after pressing [14]. Understanding the composition of the marc after pressing could give winemakers a better insight into the reason why phenolics are not being extracted.
The aim of this research study was to investigate the relation between grape cell wall composition and phenolic extractability of Cabernet Sauvignon grapes grown in two different California regions (Central Coast and Sonoma County). The study included the analysis of phenolic grape composition, wine phenolic content as well as berry and pomace skin cell wall composition of three sites per region.

2. Materials and Methods

2.1. Reagents

Bovine albumin standard solution (2.0 mg/mL) and Coomassie protein assay reagent were purchased from Thermo scientific (Waltham, MA, USA). Malvidin-3-O-glucoside (95%) was purchased from Extrasynthese (Genay, France). Acetone (reagent grade), acetonitrile (HPLC grade), methanol (reagent grade), hydrochloric acid (37%, reagent grade), trifluoroacetic acid (HPLC grade), sulfuric acid (96% reagent grade), diethyl ether (ACS reagent, 99%), phenol (reagent grade), L-ascorbic acid (molecular biology grade), HEPES buffer, potassium bitartrate (99%), Folin–Ciocalteu reagent, sodium carbonate, (+)-catechin hydrate (98%), 3-phenylphenol (85%), sodium tetraborate (99%) and D-galacturonic acid (97%) were purchased from Sigma Aldrich (St. Louis, MO, USA). Phosphoric acid (88%) (HPLC grade) and sodium hydroxide (ACS grade) were purchased from Fisher Scientific (Pittsburgh, PA, USA). Koptec brand ethanol (95%) was purchased from Decon Laboratories, Inc. (King of Prussia, PA, USA). Deionized water was prepared in-house to a final purity of 18.2 MΩ.

2.2. Grape and Pomace Samples

Cabernet Sauvignon (FPS Clone 8) was hand harvested at commercial maturity (24–26 °Brix) from two different California regions (Sonoma County and Central Coast) in 2018. Three different sites per region were harvested in order to obtain a representative sample. Nitrogen, fertilization, irrigation regimes and leaf removal were performed appropriately based on the growing region. Thus, each vineyard site was treated individually according to its needs. All the vineyards were mature, ranging in age between 6 and 26 years. Vineyard location and coding of the samples is defined in Table 1 as well as grape basic chemical analysis at harvest (°Brix, pH and titratable acidity).

2.3. Winemaking

Grapes were destemmed and crushed. Fermentation vessels were filled to a final volume of 40 L in duplicate for each individual site. Initial juice panels, °Brix, titratable acidity measured as tartaric acid equivalents, pH, malic acid concentration and yeast assimilable nitrogen, were performed on the grapes prior to crushing (Table S1). Additions were made to each vessel to adjust yeast assimilable nitrogen (YAN) to 300 mg/L using diammonium phosphate, pH to 3.7 using tartaric acid and sulfur dioxide to 60 mg/L using potassium metabisulfite. Fermentation vessels were brought to 29 °C prior to inoculation with Saccharomyces cerevisiae strain D254 (Lallemand Lalvin, Santa Rosa, CA) while cap management conditions were set to one tank volume pump-over twice a day. Fermentations were pressed off skins after 7 days and allowed to finish in temperature-controlled vessels held at 25 °C. Once dry, the wines were cold-settled at 4 °C, racked off lees into storage tanks and given a 60 mg/L sulfur dioxide addition using potassium metabisulfite. Wines were rough filtered via plate and frame unit using FibraFix AF 100 depth filter sheets (Filtrox, St. Gallen, Switzerland). Prior to bottling, wines were adjusted to free sulfur dioxide of 35 mg/L using potassium metabisulfite. Wines were sterile filtered using in-line ALpHA MF0.8-1F6RS and SteriLUX VMH0.4-1F6RS filters (Meissner, Camarillo, CA, USA), then bottled under screw cap. Final wine chemical composition can be found in Table S2.

2.4. Cell Wall Material Isolation

Cell wall material (CWM) was isolated from grape skins and pomace as 70% alcohol insoluble residue (AIR) following the method developed by De Vries et al. [30]. Shortly, grape or pomace skin (10 g) was suspended in 15 mL of boiling water (5 min) and then homogenized. The homogenate was extracted with 96% ethanol (ratio 1:2 w/v) for 30 min at 40 °C. AIRs were separated by filtration on paper (Whatman™ 1001–125 Grade 1 Qualitative Filter Paper, 97 Diameter: 12.5 cm, Pore Size: 11 μm) and sequentially extracted with 70% ethanol (40 °C, 30 min) until the Dubois test [31] indicated no sugars in the 70% ethanol phase.

2.5. Cell Wall Material Characterization

2.5.1. Carbohydrate Composition

Non-cellulosic content was determined colorimetrically using the phenol-sulfuric method [31] after digestion of one gram of CWM with 1 M sulfuric acid for 2.5 h at 100 °C. Soluble sugars were extracted with 40 mM HEPPES buffer for 1 h at room temperature [32] and determined by means of the phenol-sulfuric assay (TSS) [31]. Cellulose was determined as glucose according to Lurie et al. [33] using the phenol-sulfuric method for its spectrophotometric determination [31]. Lignin was analyzed gravimetrically as acid-insoluble residue [34].

2.5.2. Uronic Acid Analysis

Pectin content was determined as uronic acids by the colorimetric 3,5-dimethylphenol assay after the digestion of CWM in sulfuric acid [35]. Pure galacturonic acid was used as the reference standard (Sigma Aldrich, St. Louis, MO, USA). Uronic acid content was expressed as mg anhydrous galacturonic acid/g CWM.

2.5.3. Phenolic Content

Phenolic content was determined after extraction with 1 M NaOH (100 °C, 10 min) using the colorimetric Folin-Ciocalteu assay described by Singleton and Rossi [36]. Pure gallic acid was used as the reference standard (Sigma Aldrich, St Louis, MO, USA). Phenolic content was expressed as mg gallic acid/g CWM.

2.5.4. Lipid Analysis

CWM lipids were determined gravimetrically by extraction overnight with diethyl ether (35 °C) using a Soxhlet apparatus [37].

2.5.5. Protein Analysis

The protein content of CWM was determined after digestion of the sample with 1 M NaOH (10 min, 100 °C) followed by the colorimetric method described by Bradford [38]. Bovine serum albumin (BSA) solution was used as the standard to calibrate the analysis (0 to 2000 µg/mL). Protein content was expressed as mg BSA/g CWM.

2.6. Phenolic Analysis

Ten berries were grounded (IKA T18 digital ultra-turrax) and extracted in triplicate with acidified methanol (0.1% HCl) at 4 °C, until the solvent was visually colorless, in a ratio of 1:10 w/v. Methanolic extracts were sequentially pooled and combined. The final extracts were concentrated under vacuum at 34 °C to a final volume of 10 mL and stored at −20 °C until analyzed. The residue was extracted with 70% acetone overnight in a w/v ratio of 1:10 in order to extract the more hydrophobic phenolics. Extracts were concentrated under vacuum to a final volume of 5 mL and stored at −20 °C until analyzed. To determined phenolic composition of the samples (grapes and wines), an Agilent 1260 Infinity HPLC (Agilent Technologies, Santa Clara, CA, USA) equipped with a diode array detector was used. Shortly, mobile phase A (water containing 1.5% phosphoric acid v/v) and mobile phase B (80% acetonitrile and 20% mobile phase A) were used in a gradient of separation previously published by Peng et al. [39]. Twenty µL of sample was injected in a PLRP-S 100 Å 3 µm 150 × 4.6 mm column using a flow rate of 1 mL/min. Flavan-3-ols (catechin, epicatechin, gallocatechin and epigallocatechin), anthocyanin (glucosylated, acetyled glucosides and p-coumaroylated glucosides), polymeric pigments and polymeric phenols were quantified. Polymeric phenols and pigments were determined as the unresolved peak at the end of chromatograms at 280 nm and 520 nm, respectively. (+)-catechin, and malvidin-3-O-glucoside were quantified using calibration curves produced with authentic standards with limits of quantification of 0.50 and 0.30 mg/L, respectively. Flavan-3-ols and tannins were quantified as catechin equivalents, and all anthocyanins and pigmented polymers were quantified as malvidin-3-O-glucoside equivalents. Instrument control and data analysis were performed using Agilent ChemStation (Rev. B.04.03, Agilent Technologies, Santa Clara, CA, USA) software.

2.7. Statistical Analysis

XLSTAT (2019.3.2, Addinsoft, New York, NY, USA) was used for all statistical analysis; analysis of variance (ANOVA), Tukey’s test as comparison procedure, multifactor analysis (MFA) and principal component analysis (PCA).

3. Results and Discussion

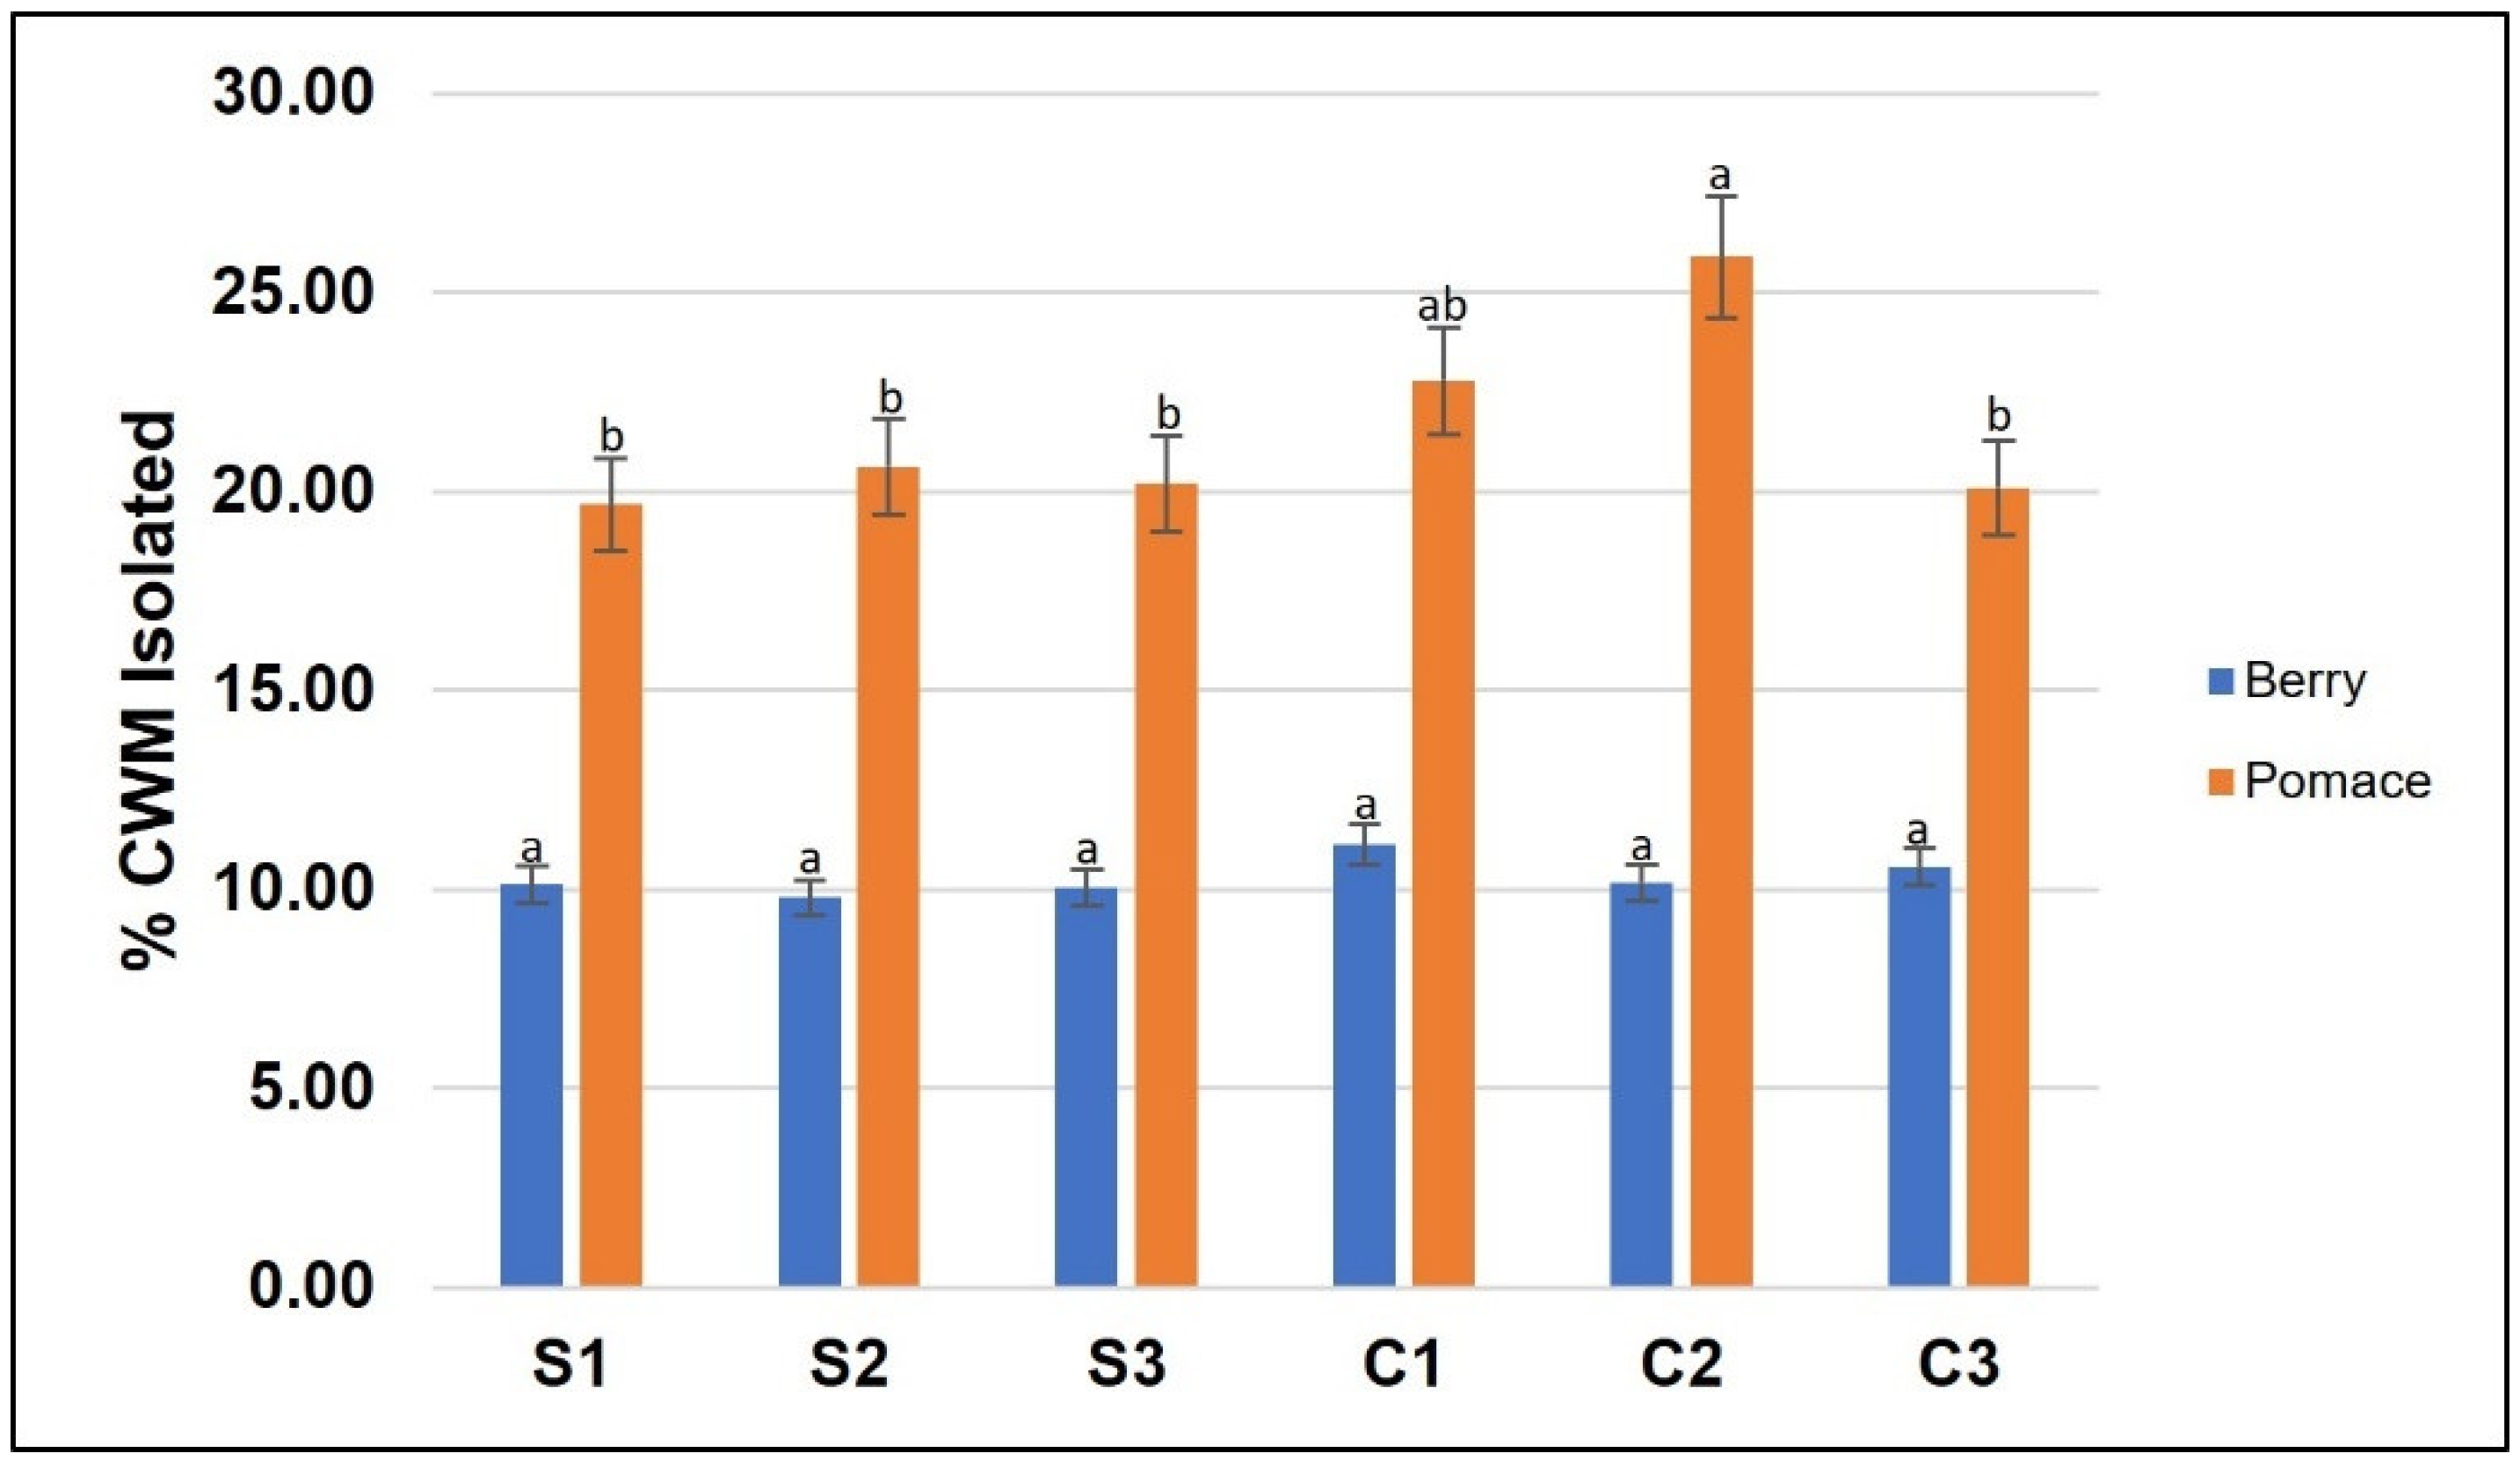
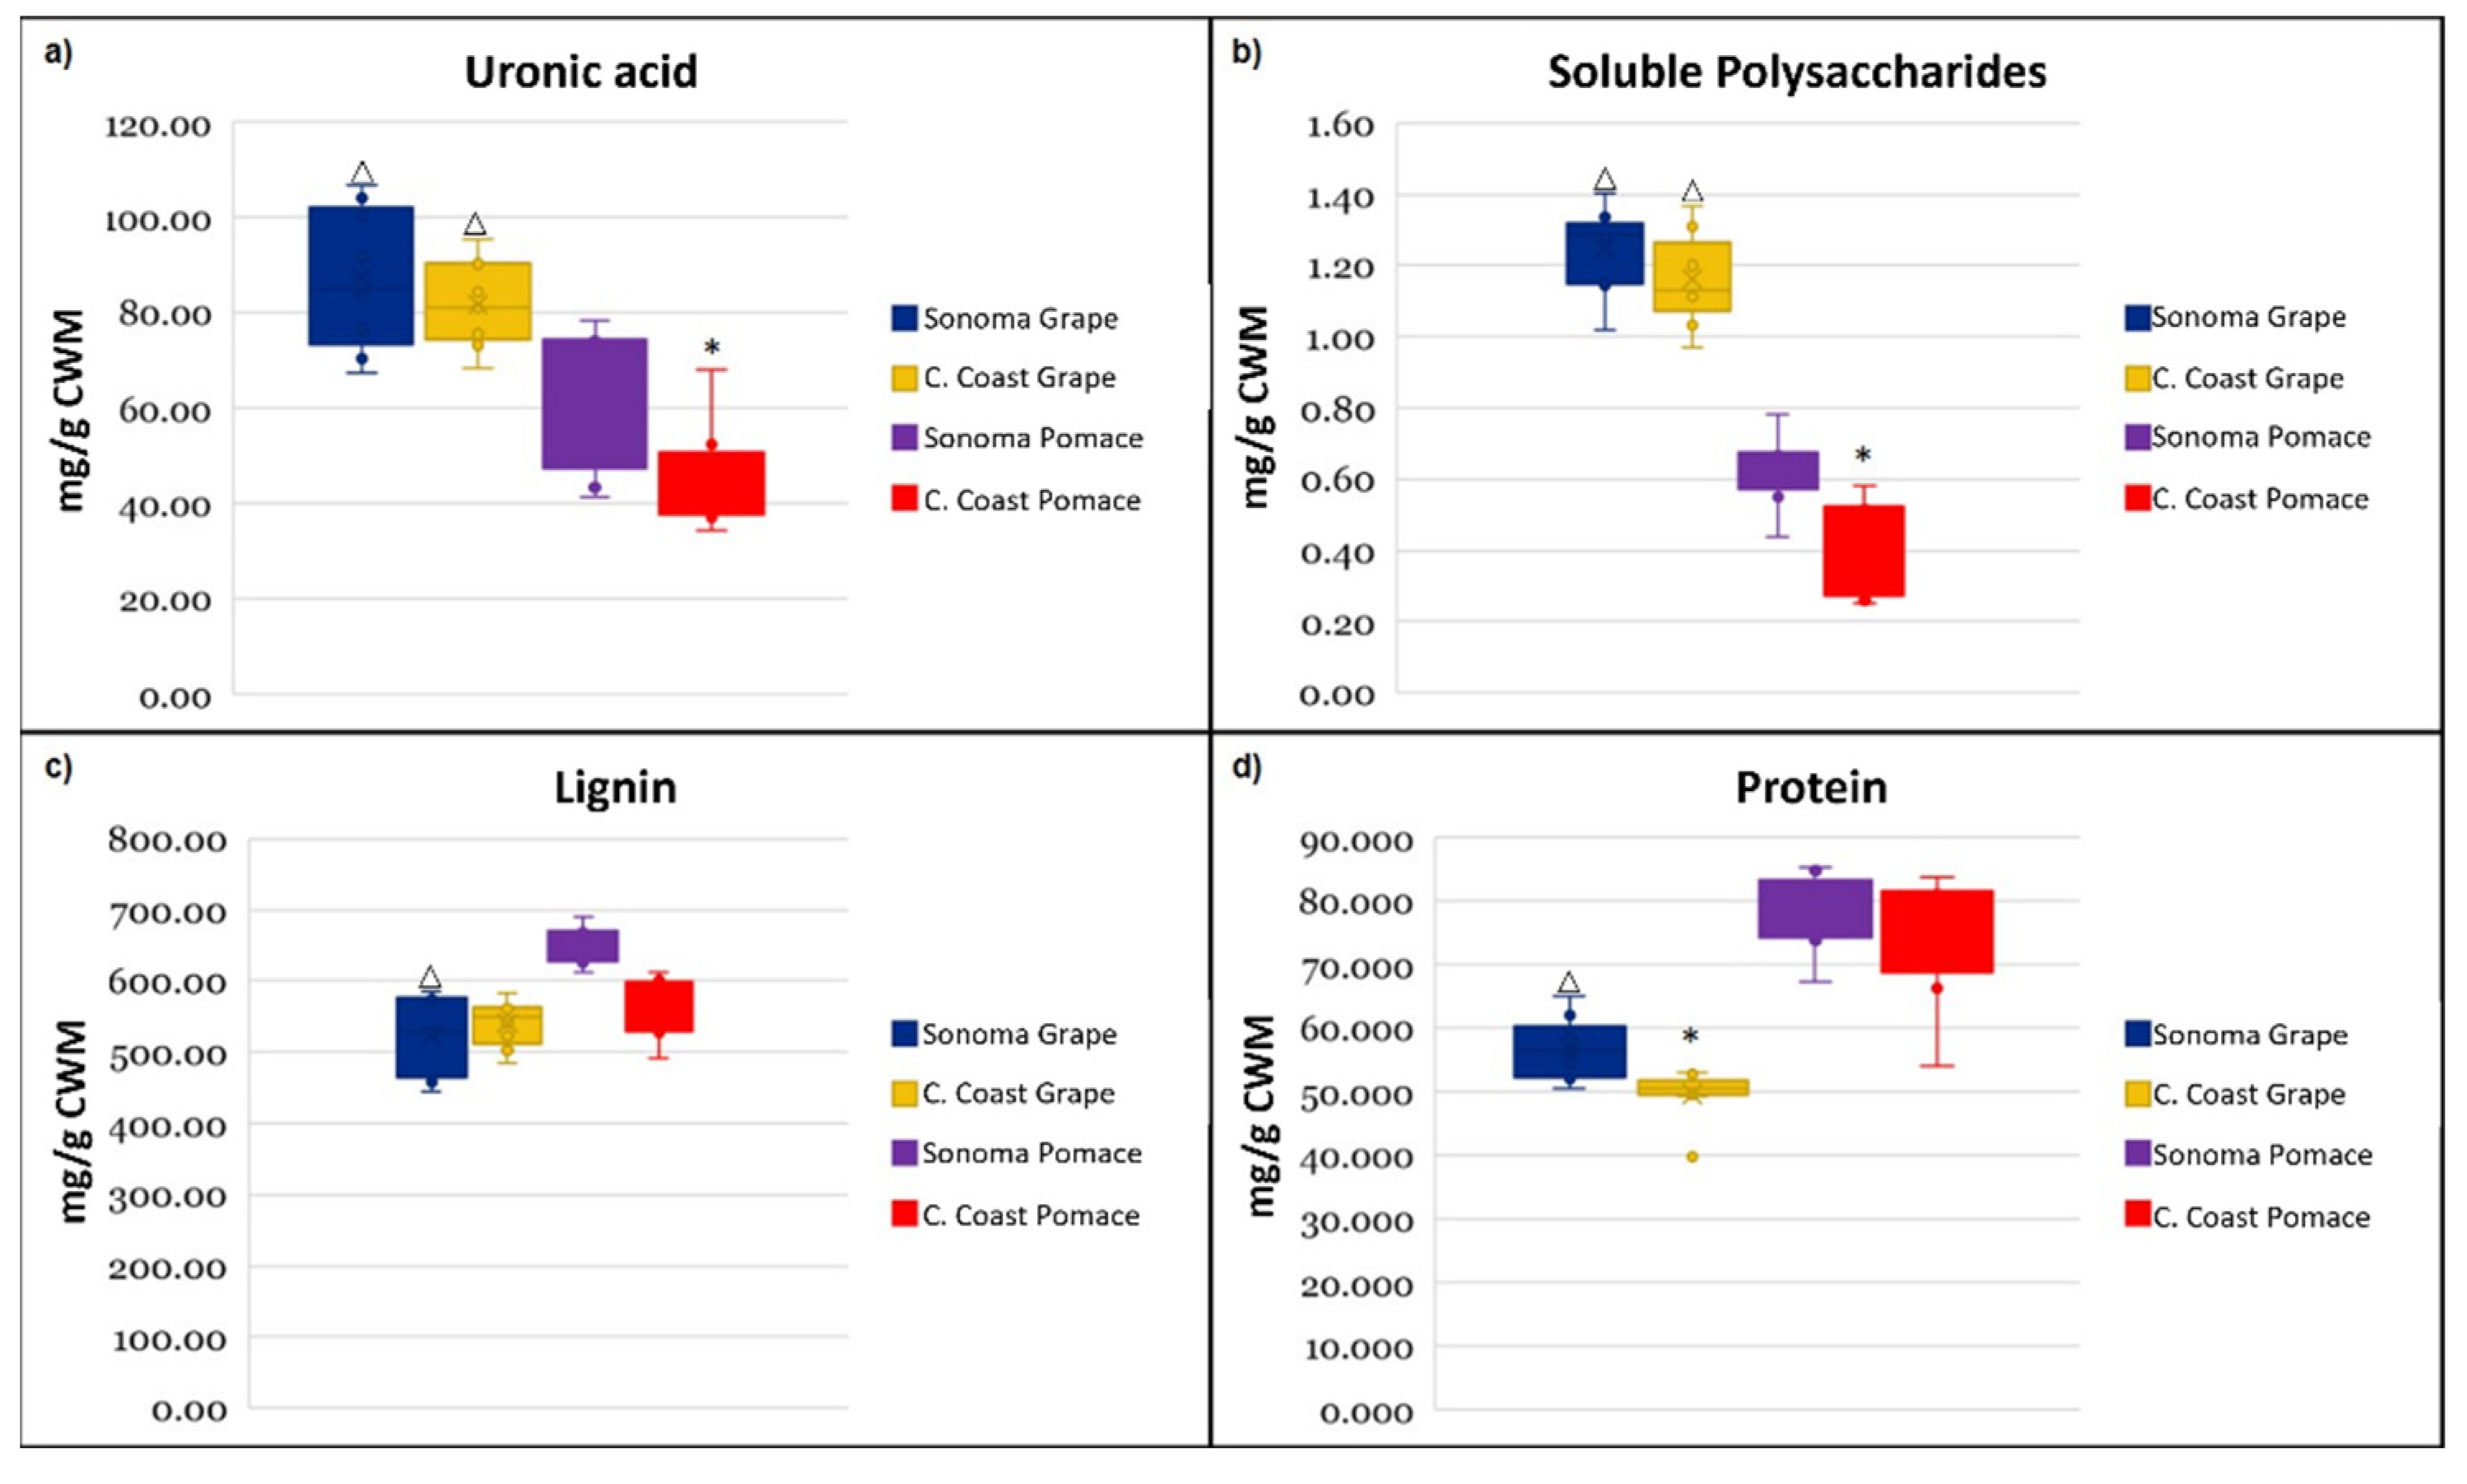
3.1. Cell Wall Material Composition

The percentage of CWM isolated (IM) from grape and pomace is presented in Figure 1. The percentage of CWM in grape skins is approximately 50% when compared to the pomace CWM isolation. Similar results, where winemaking by-products presented larger amounts of AIR, have been previously reported for other red cultivars such as Syrah, Monastrell, Merlot and Tempranillo [14,34,40]. This can be explained by the severe degradation that cell walls undergo during winemaking as well as dehydration after pressing. Regarding Cabernet Sauvignon, the difference in AIRs between pomace and grape skins has been reported to be between 2.3- and 4.5-fold depending on the origin [14,34]. In our case, samples coming from the Central Coast exhibited, in general, a larger amount of AIRs when compared to the Sonoma County region, although differences between regions were not significant. Previous studies do not state whether or not their samples were the same clone; this could also explain the small differences found in the current study when compared to previous works.
For all the individual components of the CWM analyzed, significant differences were found between pomace and grape skin cell wall composition for each site analyzed. Pectin was determined as uronic acid and, as it can be observed in Figure 2a, pectin content in the grape skins was consistently significantly larger than those in the pomace. This could be related to the partial solubilization of the pectin during winemaking, decreasing its content in the pomace [14,34]. Also, large variability among the different sites within each region can be observed. Similar results were found regarding soluble polysaccharides (Figure 2b) which were significantly reduced from grape to pomace due to soluble polysaccharide extraction during fermentation. The removal of these soluble compounds from the CWM of the grapes during fermentation is one of the factors that led to an increase in the percentage of CWM isolated from the pomace. Lignin is a complex polymer that helps with the rigidity of the cell wall, and it is very resistant to degradation [41]. Due to the latter property, it remains intact after fermentation leading to a slight increase in the amount per gram of CWM found in the pomace potentially due to the removal of the soluble components (Figure 2c). Proteins in the CWM have been described as structural constituents forming a net, reinforcing the cell wall during berry ripening [21]. The majority of the cell wall proteins are cross-linked into the polysaccharide network making them not easily extractable [42]. Proteins, similar to lignin, exhibited an increase, although to a greater extent (Figure 2d). Comparable results were found for cellulose, non-cellulosic glucose and polyphenols located in the CWM where very small differences were found between the grape skin CWM and the pomace CWM, suggesting little to no extraction during fermentation.
In order to study the similarity between regions and sites regarding CWM composition, a PCA was performed. Figure 3a shows the biplot of grape skin CWM (PC1 vs. PC2) that explains 78.59% of the variability. Sonoma County (S) samples present larger differences in grape skin CWM composition among sites than Central Coast (C), particularly S1 as it appears more separate from the rest. On the other hand, Figure 3b shows the biplot of pomace CWM where PC1 and PC2 explain 66.75% of the variance. As it can be observed, Sonoma County (S) samples appear much closer together than those from the Central Coast (C). It is generally accepted that during fermentation some components of the cell wall get dissolved into the fermenting must and removed from the skins [25,43,44,45] as supported by the CWM composition analysis of the pomace in comparison with the grapes for each site in this study (Figure 2). The similarity in the CWM of Sonoma County grape pomace could be due to the fact that the solubilization and transfer of soluble components to the fermenting must reduced the differences among sites. However, the same process made Central Coast (C) pomace CWM more different suggesting larger differences in insoluble composition of the CWM. Despite the separation among sites, both regions can be clearly distinguished with no overlapping between samples suggesting a large impact of the growing region on the CWM composition.

3.2. Phenolic Composition of Grapes and Wines

Phenolic composition was determined in the wine and after exhaustive extraction of the grapes by means of RP-HPLC-DAD. Phenolic composition in the grape skins presented some impact of the growing region, although not as significant as CWM composition. As it can be observed on Table 2, only polymeric phenols and flavan-3-ols were found significantly different between regions. Grape samples from the Central Coast contained significantly more polymeric phenols and flavan-3-ols compared to those from Sonoma County, potentially due to the differences in climate between regions. The growing degree days for the 2018 season were calculated using the closest weather station for each site. On average, the growing degree days calculated were 1926 for the Central Coast and 1695 for the Sonoma County. It has been found that these compounds increase when grapes are exposed to heat or to a warmer weather [46,47,48]. These observed temperature differences could explain the differences between regions on flavan-3-ols and polymeric phenols. Regarding anthocyanin content, the average difference between regions was minimal due to larger variance within each region, particularly in the Sonoma County. Both regions contained sites with high and low anthocyanin content, although differences were not significant for Central Coast grape samples. No regional impact was observed for the individual anthocyanin profiles. Polymeric pigment differences were not significant among sites of the same region nor between regions, potentially due to their low concentration. The variation in grape phenolic composition between growing regions is likely due to differences in climate and soil [49,50,51]. Moreover, differences found among growing sites within the same region was potentially due to mesoclimate impact and location of the vineyards, although most of the differences were not significant.
Analyzing wine phenolic composition, we found that polymeric pigment contents were very similar among the different wines. This is the only type of phenolic group that did not show significant differences due to origin (site) (Table 2). Those made from grapes cultivated in the Sonoma County contained more anthocyanins and polymer phenols while wines made from grapes originating from the Central Coast contained less of both phenolic groups. Opposite trends were found regarding flavan-3-ols with the wines made from Central Coast grapes containing significantly higher concentration compared to those made from Sonoma County grapes.
When comparing grape with wine phenolic composition, it is clear that phenolic extractability depended on the specific site for the samples analyzed. Extractability of the different phenolic classes was calculated as shown in Equation (1). Raw data for must weight and volume after pressing for each fermentation can be found in Table S3. Grapes from the Sonoma County showed a larger percentage of extractability than those cultivated in the Central Coast, with the exception of anthocyanins for which one of the sites from the Central Coast showed the largest percentage of extractability (Table 3). This specific site (C2) showed the lowest concentration of lignin, making the cell wall less resistant and easier to physically break during the winemaking process (crushing). Extractability was found significantly different between regions for all the phenolics analyzed except for anthocyanins. The large value of C2 makes the Central Coast grape anthocyanin content average similar to that from the Sonoma County, eliminating significant differences.
% Extractability = Wine   phenolics   ×   Wine volume Mass grapes   Grape   phenolics     ×   100

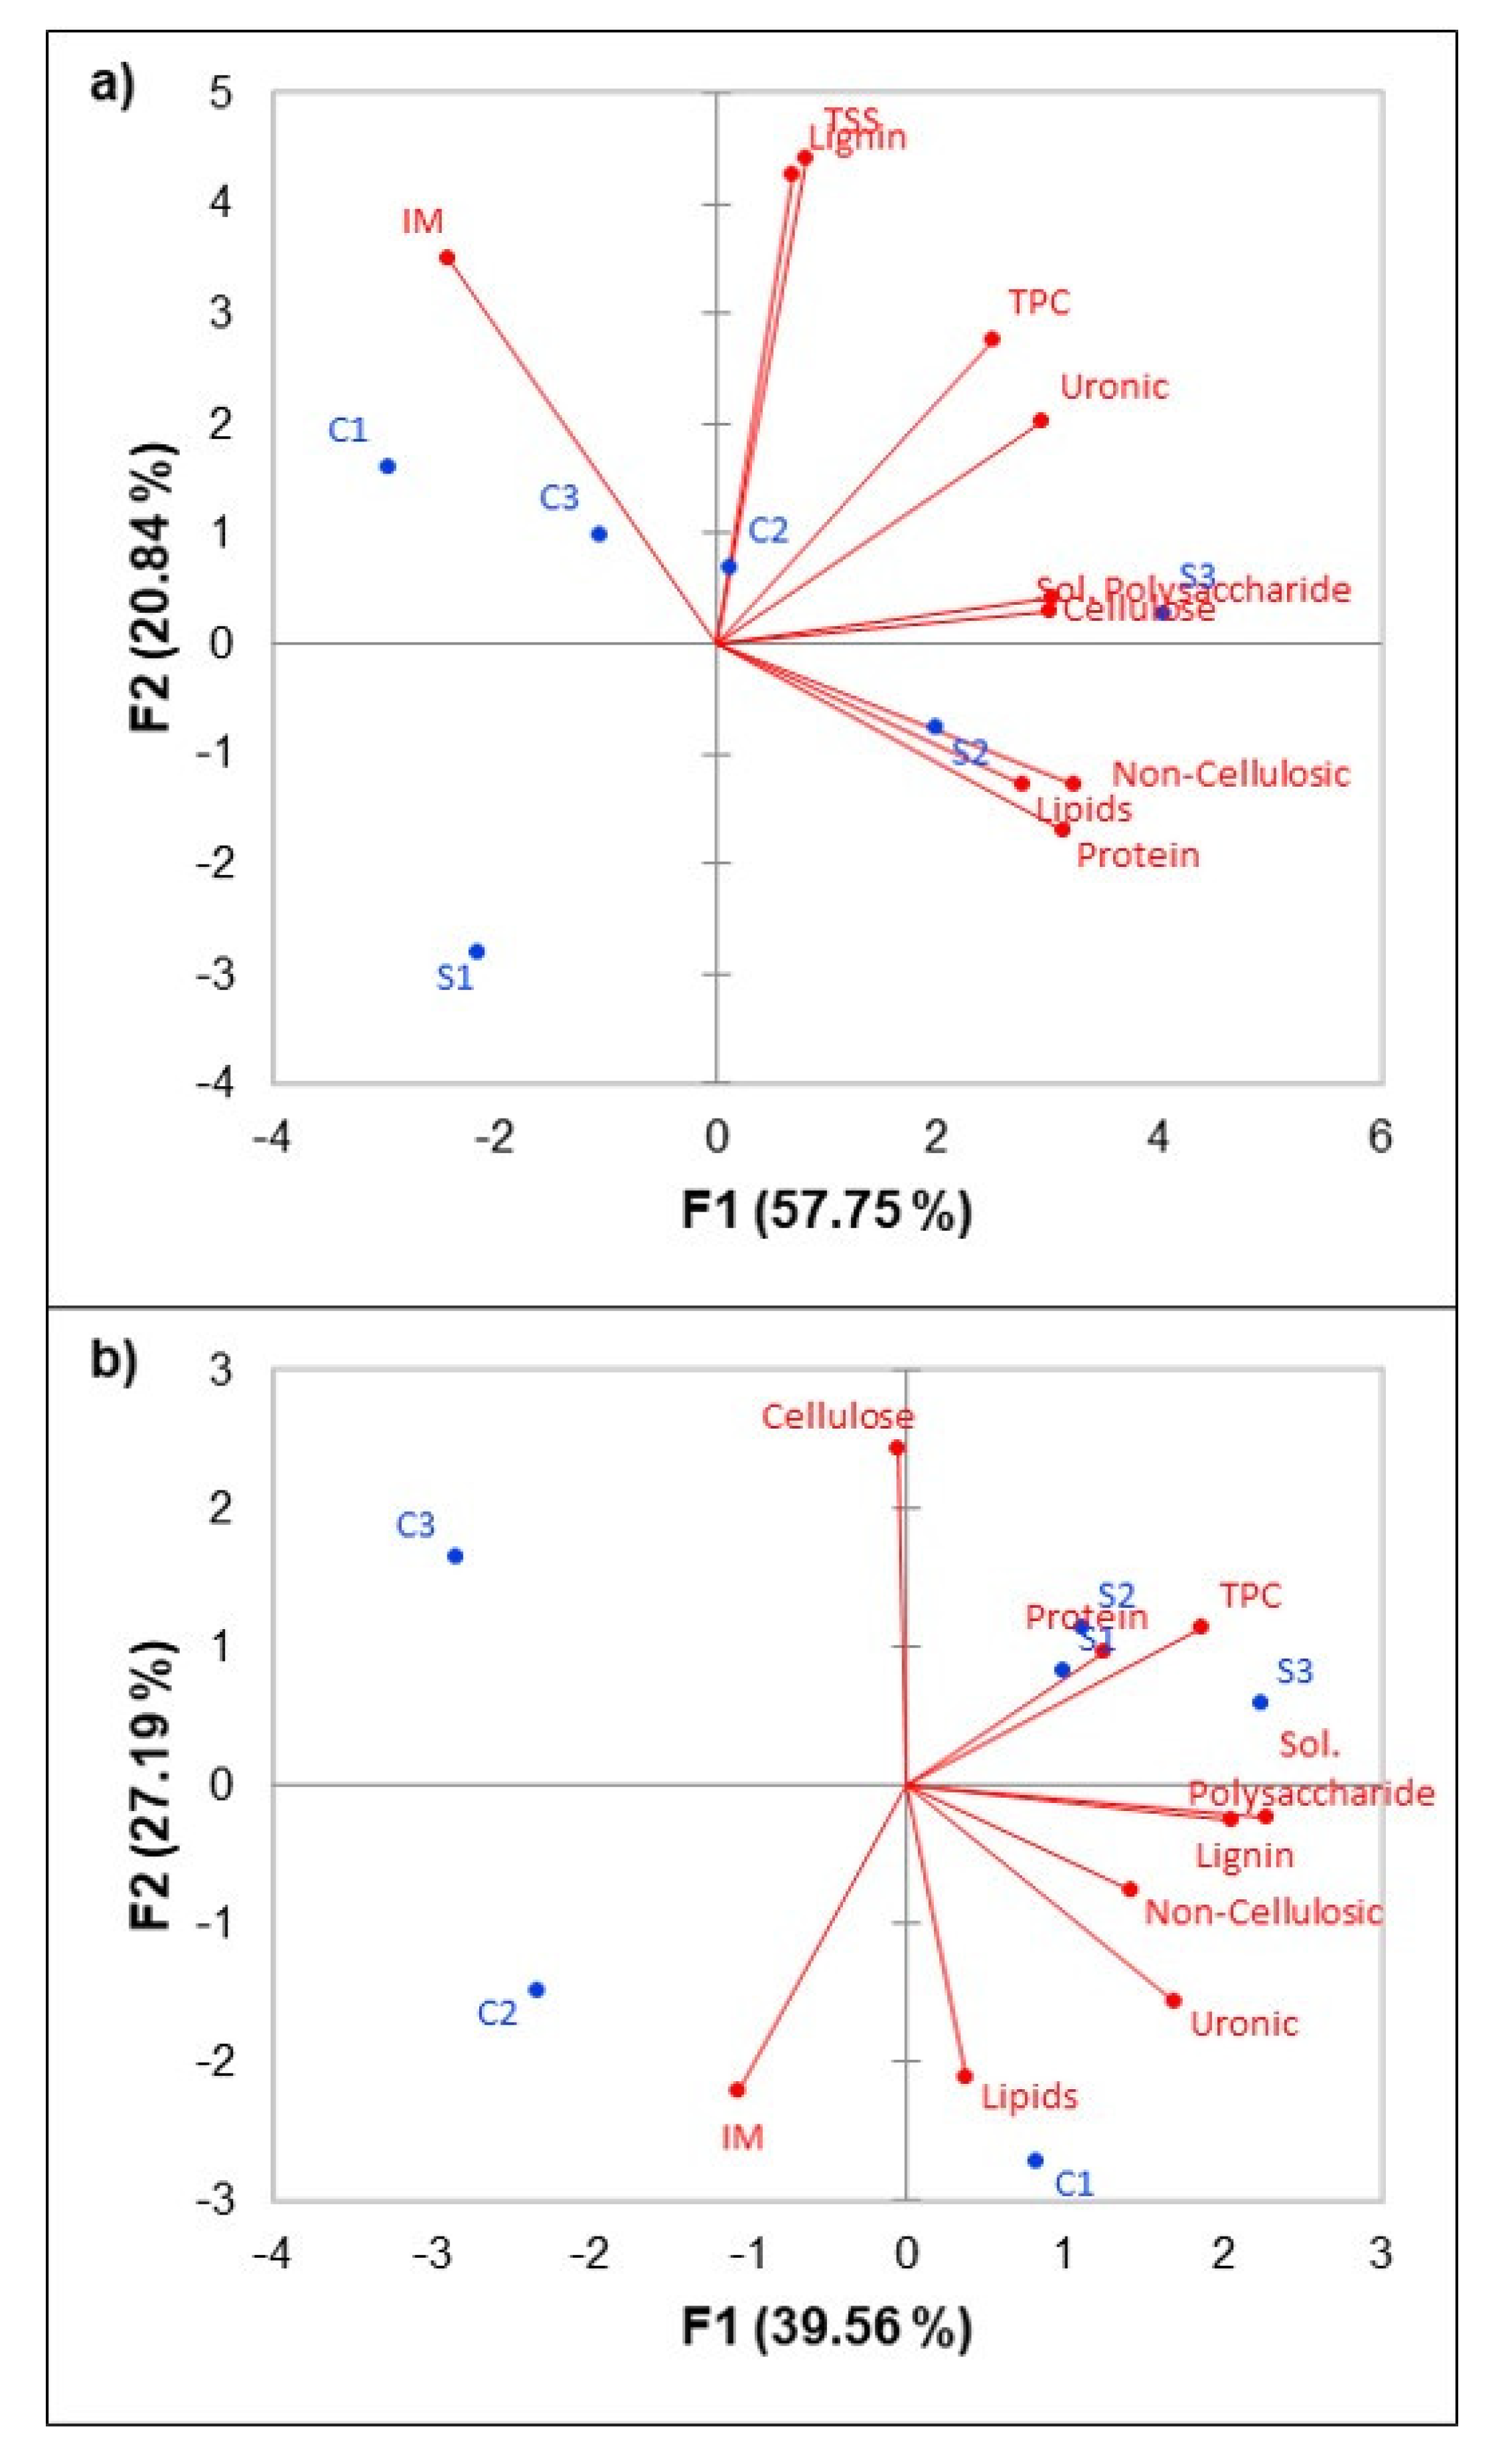
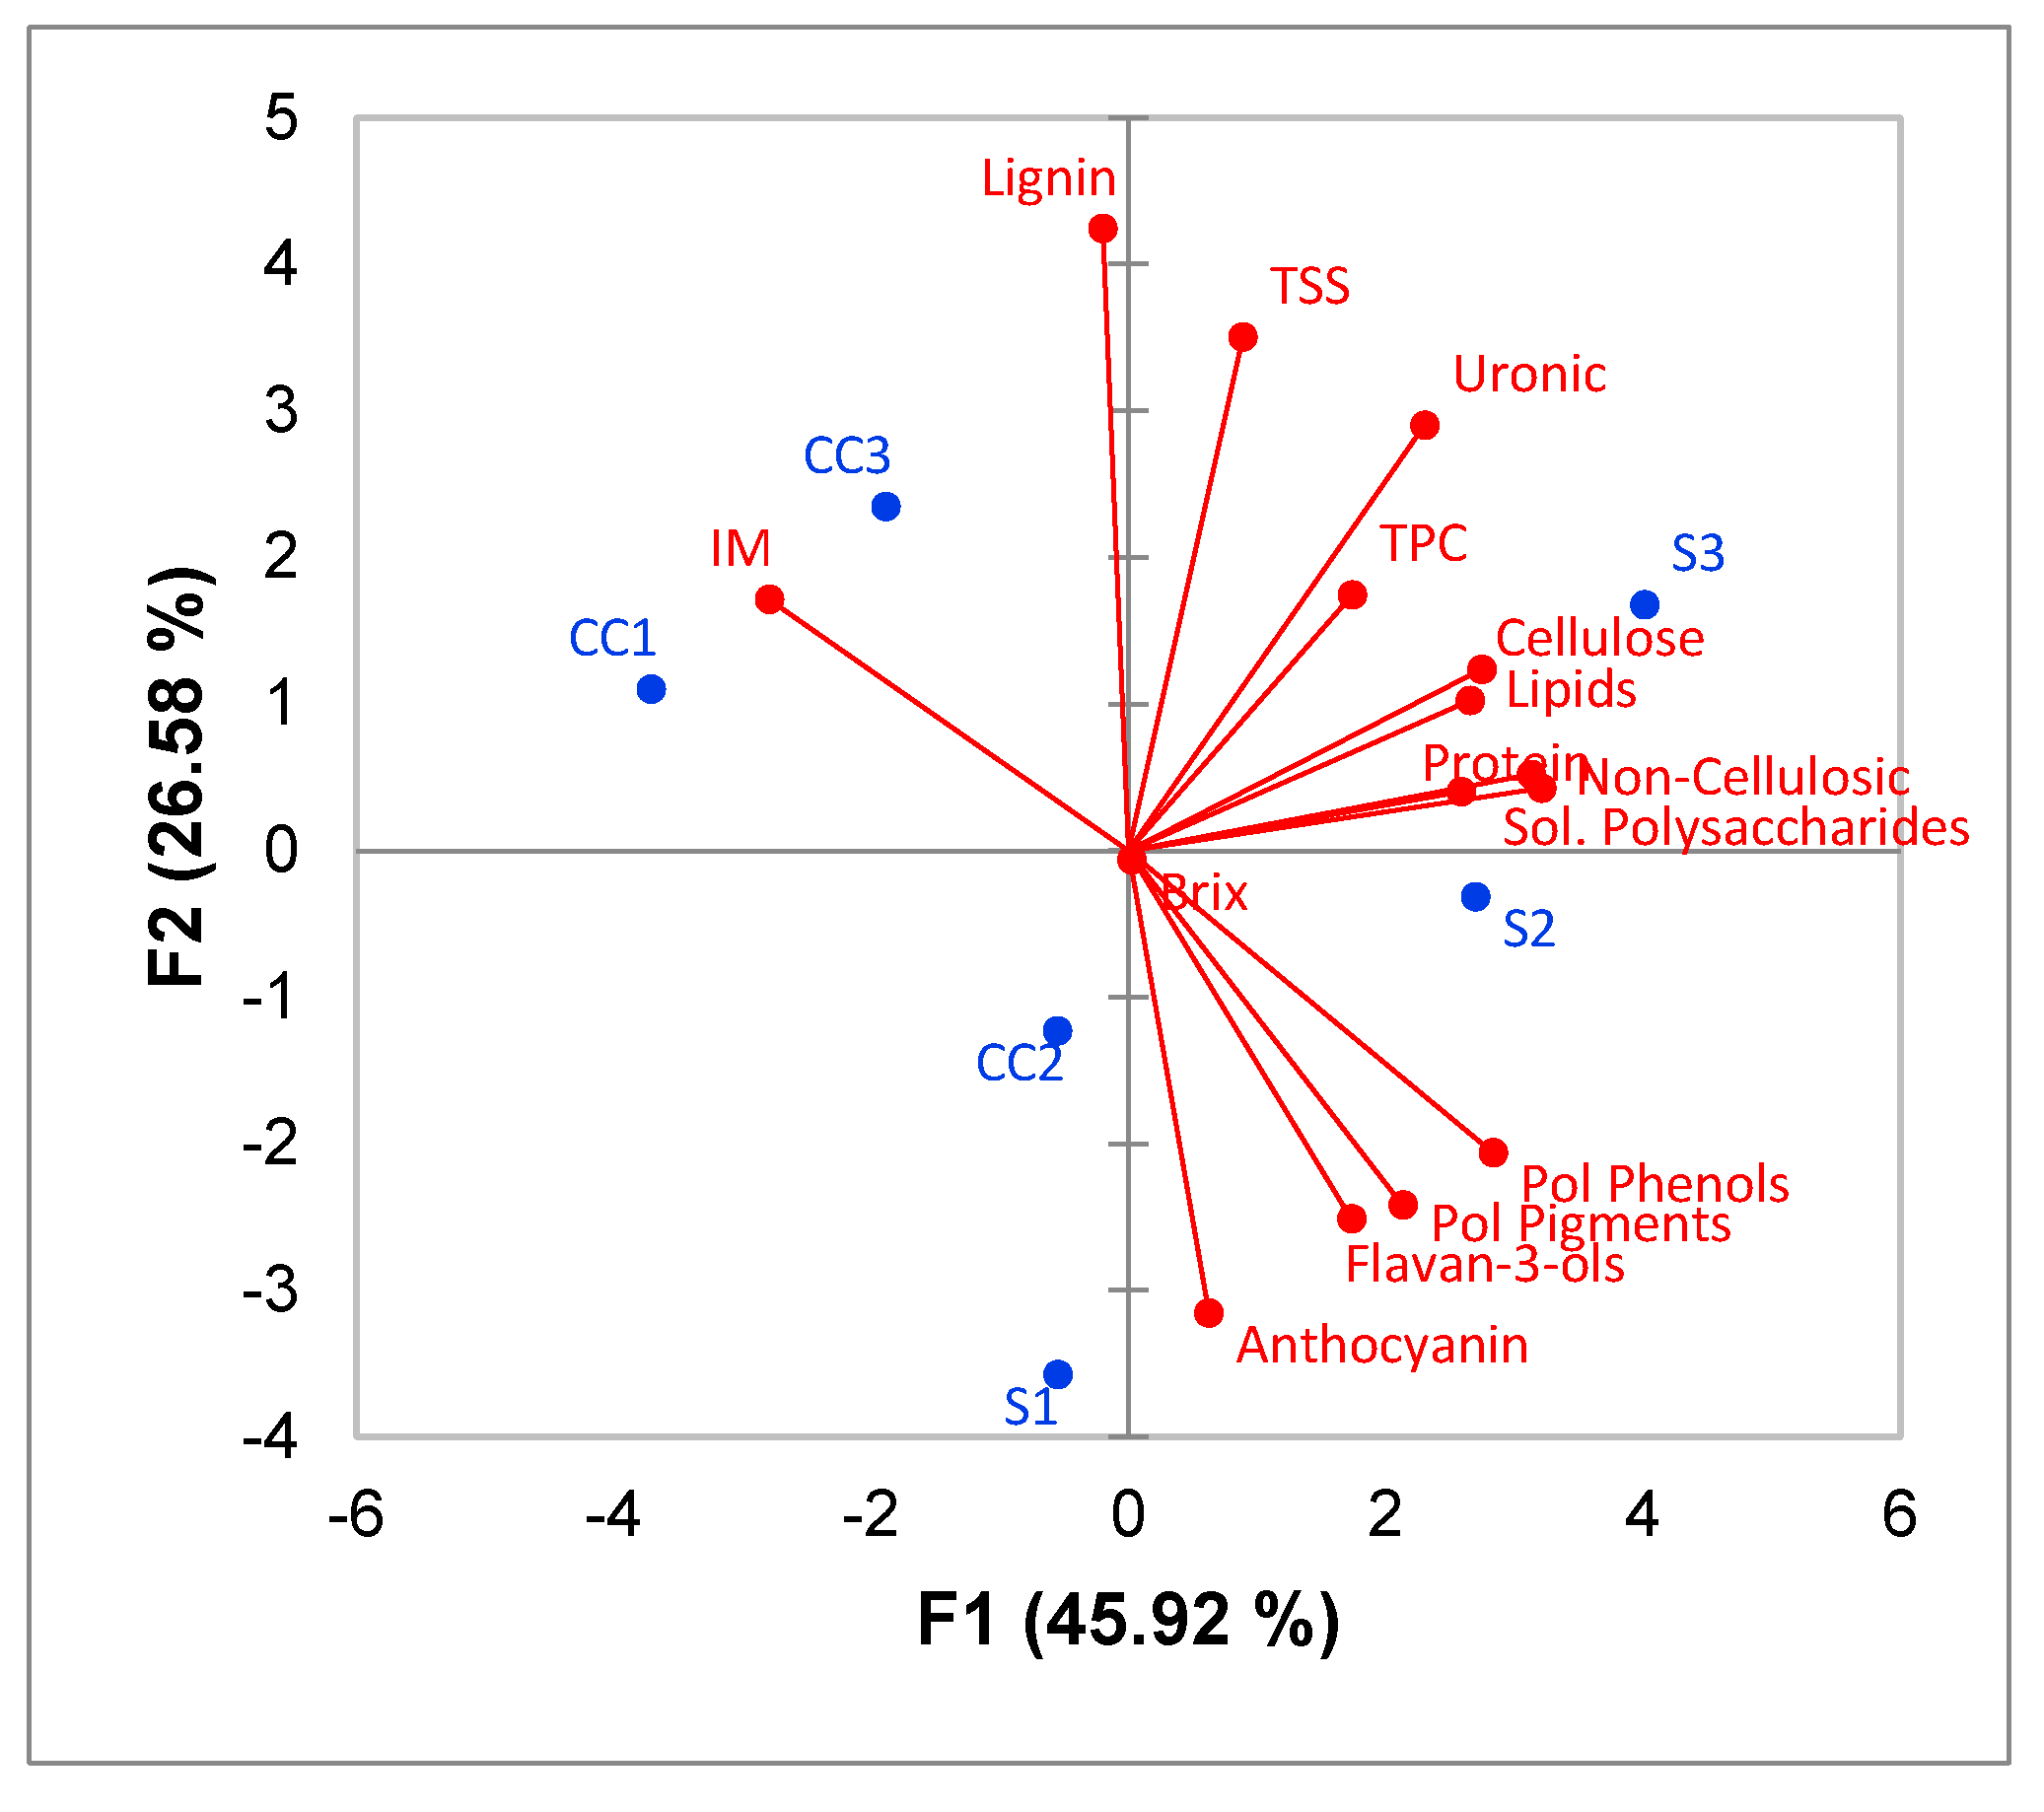
3.3. Correlation between CWM Composition and Wine Phenolics

Despite the fact that the starting grape composition was different between regions and, in some cases among sites, extractability data suggest the presence of an inherent effect to the region. PCA was applied to the correlation matrix constructed from the extraction percentages of the different phenolics analyzed, soluble solid content, Brix and CWM composition (i.e., insoluble material, lipids, protein, total polyphenolic content, cellulose, non-cellulosic glucose, uronic acid and lignin) of each site. Figure 4 shows the biplot of the PCA analysis. The first principal component explains 45.92% of the variability in the data and the second describes 26.58%. Some separation due to region can be found based on the first principal component. Lignin and total insoluble material (IM) had the strongest negative correlation with all the phenolics extracted. A higher content in lignin increases cell wall resistance and rigidity, which could explain the negative correlation with phenolic extraction. IM has been previously reported by Hernandez-Hierro et al. [52,53] as one of the variables with the largest negative impact on phenolic extractability (anthocyanin, flavan-3-ols and flavonols). Sugar related parameters (Brix and TSS) show no or negative impact on the extraction of phenolics. Phenolic extractability increases during ripening, mainly due to the degradation of the CWM. Brix is a method to determine the maturity of the grapes; however, it can be impacted by multiple external factors such as heat waves (dehydration) and rain (rehydration). Sugar parameters are not directly correlated with phenolic extractability as the latter is mainly influenced by CWM composition and its changes overtime are due to hang time and not sugar accumulation.
Previous research noted a large impact due to vintage on phenolic extractability. Garrido-Banuelos et al. [20] explored the impact of vintage on cell wall polysaccharide composition and phenolic extractability of Shiraz concluding that vintage had a strong and significant effect on grape phenolic and grape skin cell wall composition and, therefore, wine composition. They concluded that its impact was larger than any of the other variables studied and confirms the impact of seasonal variation.
Due to the influence of vintage on CWM and phenolic composition, a multi-year study is needed to confirm that the impact of certain components of CWM (particularly lignin and IM) on phenolic extractability is constant, irrespective of vintage.

4. Conclusions

This study showed the influence of CWM composition on phenolic extractability as well as the CWM modification during fermentation. The content of CWM soluble components (pectin and soluble polysaccharides) decreased in the CWM pomace compared to grapes whereas the rest of the components stayed almost intact. Grape flavan-3-ols and polymeric phenols were found significantly different between regions whereas wine composition differences were significant for all the phenolics analyzed other than polymeric pigments. Polymeric pigments were potentially similar due to low concentrations as a result of the young age of the wines at the time of analyses as well as the use of the same cultivar.
Phenolic extractability was found significantly impacted by region pointing out the synergistic effect of phenolics and CWM composition on phenolic extractability. PCA correlating grape and CWM composition with phenolic extractability showed that the amount of IM and lignin has a strong negative impact on phenolic extractability.
Nonetheless, the impact of vintage should be evaluated to confirm that these findings are constant and independent of vintage. Moreover, as lignin and IM can be related to thickness and rigidity of the skin, a comprehensive study of these variables would be helpful to extrapolate our findings to other grape varieties.

Supplementary Materials

The following supporting information can be downloaded at: https://www.mdpi.com/article/10.3390/fermentation8080401/s1, Table S1: Grape juice basic chemical composition, Table S2: Wine basic chemical composition. Table S3: Grape must weight into each fermentor and volume of wine obtained after pressing.

Author Contributions

Conceptualization, C.M.-P., N.D., R.P., T.B., D.E.B. and A.O.; methodology, C.M.-P., H.M., D.E.B. and A.O.; investigation, C.M.-P.; writing—original draft preparation, C.M.-P. and A.O.; writing—review and editing, C.M.-P., H.M., N.D., R.P., T.B., D.E.B. and A.O.; supervision, A.O.; funding acquisition, A.O. and D.E.B. All authors have read and agreed to the published version of the manuscript.

Funding

This research was funded by E&J Gallo Winery.

Institutional Review Board Statement

Not applicable.

Informed Consent Statement

Not applicable.

Conflicts of Interest

The authors declare no conflict of interest.

References

  1. Casassa, L.F.; Huff, R.; Steele, N.B. Chemical consequences of extended maceration and post-fermentation additions of grape pomace in Pinot noir and Zinfandel wines from the Central Coast of California (USA). Food Chem. 2019, 300, 125147. [Google Scholar] [CrossRef]
  2. Downey, M.O.; Harvey, J.S.; Robinson, S.P. Analysis of tannins in seeds and skins of Shiraz grapes throughout berry development. Aust. J. Grape Wine Res. 2003, 9, 15–27. [Google Scholar] [CrossRef]
  3. Lerno, L.; Reichwager, M.; Ponangi, R.; Hearne, L.; Block, D.E.; Oberholster, A. Effects of cap and overall fermentation temperature on phenolic extraction in cabernet sauvignon fermentations. Am. J. Enol. Vitic. 2015, 66, 444–453. [Google Scholar] [CrossRef]
  4. Boulton, R.B. The Copigmentation of Anthocynins and Its Role in the Color of Red Wine: Comments on a Critical Review. Am. J. Enol. Vitic. 2001, 52, 67–87. [Google Scholar]
  5. Cheynier, V.; Dueñas-Paton, M.; Salas, E.; Maury, C.; Souquet, J.-M.; Sarni-Manchado, P.; Fulcrand, H. Structure and Properties of Wine Pigments and Tannins. Am. J. Enol. Vitic. 2006, 27, 97–105. [Google Scholar]
  6. Hermosín-Gutierrez, I.; Sánchez-Palomo Lorenzo, E.; Vicario-Espinosa, A. Phenolic composition and magnitude of copigmentation in young and shortly aged red wines made from the cultivars, Cabernet Sauvignon, Cencibel, and Syrah. Food Chem. 2005, 92, 269–283. [Google Scholar] [CrossRef]
  7. War, A.R.; Paulraj, M.G.; Ahmad, T.; Buhroo, A.A.; Hussain, B.; Ignacimuthu, S.; Sharma, H.C. Mechanisms of plant defense against insect herbivores. Plant Signal. Behav. 2012, 7, 1306–1320. [Google Scholar] [CrossRef] [PubMed]
  8. Sun, B.S.; Pinto, T.; Leandro, M.C.; Ricardo-Da-Silva, J.M.; Spranger, M.I. Transfer of catechins and proanthocyanidins from solid parts of the grape cluster into wine. Am. J. Enol. Vitic. 1999, 50, 179–184. [Google Scholar]
  9. Guidoni, S.; Hunter, J.J. Anthocyanin profile in berry skins and fermenting must/wine, as affected by grape ripeness level of Vitis vinifera cv. Shiraz/R99. Eur. Food Res. Technol. 2012, 235, 397–408. [Google Scholar] [CrossRef]
  10. Cagnasso, E.; Torchio, F.; Gerbi, V.; Segade, S.R.; Giacosa, S.; Rolle, L. Evolution of the Phenolic Content and Extractability Indices During Ripening of Nebbiolo Grapes from the Piedmont Growing Areas over Six Consecutive Years. South African J. Enol. Vitic. 2011, 32, 229–241. [Google Scholar] [CrossRef]
  11. Romero-Cascales, I.; Ortega-Regules, A.; López-Roca, J.M.; Fernández-Fernández, J.I.; Gómez-Plaza, E. Differences in anthocyanin extractability from grapes to wines according to variety. Am. J. Enol. Vitic. 2005, 53, 54–59. [Google Scholar]
  12. Río Segade, S.; Soto Vázquez, E.; Díaz Losada, E. Influence of ripeness grade on accumulation and extractability of grape skin anthocyanins in different cultivars. J. Food Compos. Anal. 2008, 21, 599–607. [Google Scholar] [CrossRef]
  13. Medina-Plaza, C.; Dokoozlian, N.; Ponangi, R.; Blair, T.; Block, D.E.; Oberholster, A. Correlation between skin cell wall composition and polyphenol extractability of pinot noir and cabernet sauvignon grapes. Am. J. Enol. Vitic. 2021, 72, 328–337. [Google Scholar] [CrossRef]
  14. Apolinar-Valiente, R.; Romero-Cascales, I.; Gómez-Plaza, E.; López-Roca, J.M.; Ros-García, J.M. The composition of cell walls from grape marcs is affected by grape origin and enological technique. Food Chem. 2015, 167, 370–377. [Google Scholar] [CrossRef]
  15. Joutei, K.A.; Glories, Y.; Mercier, M. Localisation des tanins dans la pellicule de baie de raisin. Vitis 1994, 33, 133–138. [Google Scholar]
  16. Lecas, M.; Brillouet, J.-M. Cell wall composition of grape berry skins. Phytochemistry 1994, 35, 1241–1243. [Google Scholar] [CrossRef]
  17. Nunan, K.J.; Sims, I.M.; Bacic, A.; Robinson, S.P.; Fincher, G.B. Isolation and characterization of cell walls from the mesocarp of mature grape berries (Vitis vinifera). Planta 1997, 203, 93–100. [Google Scholar]
  18. Pinelo, M.; Arnous, A.; Meyer, A.S. Upgrading of grape skins: Significance of plant cell-wall structural components and extraction techniques for phenol release. Trends Food Sci. Technol. 2006, 17, 579–590. [Google Scholar] [CrossRef]
  19. Ortega-Regules, A.; Ros-García, J.M.; Bautista-Ortín, A.B.; López-Roca, J.M.; Gómez-Plaza, E. Changes in skin cell wall composition during the maturation of four premium wine grape varieties. J. Sci. Food Agric. 2008, 88, 420–428. [Google Scholar] [CrossRef]
  20. Garrido-Bañuelos, G.; Buica, A.; Schückel, J.; Zietsman, A.J.J.; Willats, W.G.T.; Moore, J.P.; Du Toit, W.J. Investigating the relationship between cell wall polysaccharide composition and the extractability of grape phenolic compounds into Shiraz wines. Part II: Extractability during fermentation into wines made from grapes of different ripeness levels. Food Chem. 2019, 278, 26–35. [Google Scholar] [CrossRef]
  21. Vicens, A.; Fournand, D.; Williams, P.; Sidhoum, L.; Moutounet, M.; Doco, T. Changes in Polysaccharide and Protein Composition of Cell Walls in Grape Berry Skin (Cv. Shiraz) during Ripening and Over-Ripening. Phytochemistry 2009, 57, 2955–2960. [Google Scholar] [CrossRef] [PubMed]
  22. Goulao, L.F.; Oliveira, C.M. Cell wall modifications during fruit ripening: When a fruit is not the fruit. Trends Food Sci. Technol. 2008, 19, 4–25. [Google Scholar] [CrossRef]
  23. Barnavon, L.; Doco, T.; Terrier, N.; Ageorges, A.; Romieu, C.; Pellerin, P. Involvement of pectin methyl-esterase during the ripening of grape berries: Partial cDNA isolation, transcript expression and changes in the degree of methyl-esterification of cell wall pectins. Phytochemistry 2001, 58, 693–701. [Google Scholar] [CrossRef]
  24. Gao, Y.; Fangel, J.U.; Willats, W.G.T.; Vivier, M.A.; Moore, J.P. Dissecting the polysaccharide-rich grape cell wall changes during winemaking using combined high-throughput and fractionation methods. Carbohydr. Polym. 2015, 133, 567–577. [Google Scholar] [CrossRef] [PubMed]
  25. Guadalupe, Z.; Ayestarán, B. Polysaccharide profile and content during the vinification and aging of tempranillo red wines. J. Agric. Food Chem. 2007, 55, 10720–10728. [Google Scholar] [CrossRef]
  26. Miller, K.V.; Noguera, R.; Beaver, J.; Medina-Plaza, C.; Oberholster, A.; Block, D.E. A mechanistic model for the extraction of phenolics from grapes during red wine fermentation. Molecules 2019, 24, 1275. [Google Scholar] [CrossRef]
  27. Barham, E. Translating terroir: The global challenge of French AOC labeling. J. Rural Stud. 2003, 19, 127–138. [Google Scholar] [CrossRef]
  28. Morlat, R. Terroirs Viticoles: Étude et Valorisation; Oenoplurimedia: Chaintré, France, 2011. [Google Scholar]
  29. White, R.E. The Value of Soil Knowledge in Understanding Wine Terroir. Front. Environ. Sci. 2020, 8, 1–6. [Google Scholar] [CrossRef]
  30. De Vries, J.A.; Voragen, A.G.J.; Rombouts, F.M.; Pilnik, W. Extraction and purification of pectins from alcohol insoluble solids from ripe and unripe apples. Carbohydr. Polym. 1981, 1, 117–127. [Google Scholar] [CrossRef]
  31. DuBois, M.; Gilles, K.; Hamilton, J.; Rebers, P. Colorimetric method for determination of sugars and related substances. Anal. Chem. 1956, 28, 350–356. [Google Scholar] [CrossRef]
  32. Olle, D.; Lozano, Y.F.; Brillouet, J.M. Isolation and characterization of soluble polysaccharides and insoluble cell wall material of the pulp from four mango (Mangifera indica L) cultivars. J. Agric. Food Chem. 1996, 44, 2658–2662. [Google Scholar] [CrossRef]
  33. Lurie, S.; Levin, A.; Greve, L.C.; Labavitch, J.M. Pectic polymer changes in nectarines during normal and abnormal ripening. Phytochemistry 1994, 36, 11–17. [Google Scholar] [CrossRef]
  34. González-Centeno, M.R.; Rosselló, C.; Simal, S.; Garau, M.C.; López, F.; Femenia, A. Physico-chemical properties of cell wall materials obtained from ten grape varieties and their byproducts: Grape pomaces and stems. LWT-Food Sci. Technol. 2010, 43, 1580–1586. [Google Scholar] [CrossRef]
  35. Ahmed, A.E.R.; Labavitch, J.M. A simplified method for accurate determination of cell wall uronide content. J. Food Biochem. 1978, 1, 361–365. [Google Scholar] [CrossRef]
  36. Singleton, V.L.; Rossi, J.A.J. Colorimetry of total phenolics with phosphomolybdic-phosphotungstic acid reagents. Am. J. Enol. Vitic. 1965, 16, 144–158. [Google Scholar]
  37. Luque de Castro, M.D.; Garcia Ayuso, L.E. Environmental Applications. Soxhlet Extraction. In Encyclopedia of Separation Science; Academic Press: San Diego, CA, USA, 2000; pp. 2701–2709. [Google Scholar]
  38. Bradford, M.M. A Rapid and Sensitive Method for the Quantitation of Microgram Quantities of Protein Utilizing the Principle of Protein-Dye Binding. Anal. Biochem. 1976, 72, 248–254. [Google Scholar] [CrossRef]
  39. Peng, Z.; Iland, P.G.; Oberholster, A.; Sefton, M.A.; Waters, E.J. Analysis of pigmented polymers in red wine by reverse phase HPLC. Aust. J. Grape Wine Res. 2002, 8, 70–75. [Google Scholar] [CrossRef]
  40. Apolinar-Valiente, R.; Romero-Cascales, I.; Gómez-Plaza, E.; López-Roca, J.M.; Ros-García, J.M. Cell wall compounds of red grapes skins and their grape marcs from three different winemaking techniques. Food Chem. 2015, 187, 89–97. [Google Scholar] [CrossRef]
  41. Saura-Calixto, F.; Goñi, I.; Mañas, E.; Abia, R. Klason lignin, condensed tannins and resistant protein as dietary fibre constituents: Determination in grape pomaces. Food Chem. 1991, 39, 299–309. [Google Scholar] [CrossRef]
  42. Cassab, G.I. Plant Cell Wall Proteins. Annu. Rev. Plant Physiol. Plant Mol. Biol. 1998, 49, 281–309. [Google Scholar] [CrossRef]
  43. Gil Cortiella, M.; Peña-Neira, Á. Extracción de polisacáridos solubles procedentes de hollejos de uva. Cienc. e Investig. Agrar. 2017, 44, 83–93. [Google Scholar]
  44. Bindon, K.A.; Kassara, S.; Smith, P.A. Towards a model of grape tannin extraction under wine-like conditions: The role of suspended mesocarp material and anthocyanin concentration. Aust. J. Grape Wine Res. 2017, 23, 22–32. [Google Scholar] [CrossRef]
  45. Osete-Alcaraz, A.; Bautista-Ortín, A.B.; Ortega-Regules, A.; Gómez-Plaza, E. Elimination of Suspended Cell Wall Material in Musts Improves the Phenolic Content and Color of Red Wines. Am. J. Enol. Vitic. 2019, 70, 201–204. [Google Scholar] [CrossRef]
  46. Cohen, S.D.; Tarara, J.M.; Kennedy, J.A. Diurnal temperature range compression hastens berry development and modifies flavonoid partitioning in grapes. Am. J. Enol. Vitic. 2012, 63, 112–120. [Google Scholar] [CrossRef]
  47. Gouot, J.C.; Smith, J.P.; Holzapfel, B.P.; Barril, C. Grape berry flavonoid responses to high bunch temperatures post véraison: Effect of intensity and duration of exposure. Molecules 2019, 24, 4341. [Google Scholar] [CrossRef] [PubMed]
  48. Cohen, S.D.; Tarara, J.M.; Kennedy, J.A. Assessing the impact of temperature on grape phenolic metabolism. Anal. Chim. Acta 2008, 621, 57–67. [Google Scholar] [CrossRef] [PubMed]
  49. Coletta, A.; Trani, A.; Faccia, M.; Punzi, R.; Dipalmo, T.; Crupi, P.; Antonacci, D.; Gambacorta, G. Influence of viticultural practices and winemaking technologies on phenolic composition and sensory characteristics of Negroamaro red wines. Int. J. Food Sci. 2013, 48, 2215–2227. [Google Scholar] [CrossRef]
  50. Downey, M.O.; Dokoozlian, N.K.; Krstic, M.P. Cultural Practice and Environmental Impacts on the Flavonoid Composition of Grapes and Wine: A Review of Recent Research. Am. J. Enol. Vitic. 2006, 3, 257–268. [Google Scholar]
  51. Teixeira, A.; Eiras-Dias, J.; Castellarin, S.D.; Gerós, H. Phenolics of Grapevine under Challenging Environments. Int. J. Mol. Sci. 2013, 14, 18711–18739. [Google Scholar] [CrossRef]
  52. Hernández-Hierro, J.M.; Quijada-Morín, N.; Martínez-Lapuente, L.; Guadalupe, Z.; Ayestarán, B.; Rivas-Gonzalo, J.C.; Escribano-Bailón, M.T. Relationship between skin cell wall composition and anthocyanin extractability of Vitis vinifera L. cv. Tempranillo at different grape ripeness degree. Food Chem. 2014, 146, 41–47. [Google Scholar] [CrossRef] [PubMed]
  53. Quijada-Morín, N.; Hernandez-Hierro, J.M.; Rivas-Gonzalo, J.C.; Escribano-Bailon, M.T. Extractability of Low Molecular Mass Flavanols and Flavonols from Red Grape Skins. Relationship to Cell Wall Composition at Different Ripeness Stages. J. Agric. Food Chem. 2015, 63, 7654–7662. [Google Scholar] [CrossRef] [PubMed]
Figure 1. Percentage of CWM isolated from grape and pomace skins. S-Sonoma County, C-Central Coast. Numbers 1, 2, 3 indicate different sites within the same region (n = 3). Different letters mean significant differences (Tukey’s test, p < 0.05).
Fermentation 08 00401 g001
Figure 2. Box plot of (a) Uronic acid, (b) Soluble polysaccharides, (c) Lignin, (d) Protein in grape skin and pomace CWM from two different California regions (n = 3). Significant differences between regions (p < 0.05) are marked with a star. Significant differences between pomace and grape skin are marked with a triangle.
Fermentation 08 00401 g002
Figure 3. PCA biplot of CWM composition. (a) Grape skin, (b) Pomace skin. S-Sonoma County, C-Central Coast. Numbers 1, 2, 3 indicate different sites within the same region. IM-Isolated Material, TSS-Total Soluble Sugars, TPC-Total Polyphenolic Content.
Fermentation 08 00401 g003
Figure 4. PCA biplot of extraction percentages of the different phenolics analyzed, soluble solid content, Brix and CWM composition. S-Sonoma County, C-Central Coast, whereas 1, 2, 3 indicate different sites within the same region. IM-Isolated Material, TSS-Total Soluble Sugars, TPC-Total Polyphenolic Content.
Fermentation 08 00401 g004
Table 1. Vineyard coordinates, sample codes, harvest date and basic chemical analysis for all the grapes analyzed. C-Central Coast, S-Sonoma County. Numbers 1, 2, 3 refer to sites within the same region. TA refers to titratable acidity expressed in g/L of tartaric acid.
RegionCodeLatitudeLongitudeHarvest Date°BrixpHTA (g/L)
Sonoma CountyS138.75926−122.99110/13/201823.653.933.90
S238.76359−122.97710/13/201826.853.714.00
S338.64369−122.91710/19/201825.353.754.50
Central CoastC135.73251−120.65210/25/201826.603.863.50
C235.87655−120.90810/26/201825.553.953.30
C335.57229−120.60110/30/201822.903.634.40
Pomace was collected after pressing, deseeded and stored at −20 °C until further analysis.
Table 2. Grape and wine phenolic composition.
Berry Composition (mg/g Berry)Wine Composition (mg/L Wine)
RegionCodeFlavan-3-ol *AnthocyaninPolymeric PigmentPolymeric Phenol *Flavan-3-ol *Anthocyanin *Polymeric PigmentPolymeric
Phenol *
SonomaS10.10 ± 0.01 a0.89 ± 0.04 b0.03 ± 0.008 a3.19 ± 0.73 a70.24 ± 0.91 a460.92 ± 42.50 a18.14 ± 1.627 a310.31 ± 45.35 a
S20.12 ± 0.01 a1.12 ± 0.16 a0.04 ± 0.002 a3.11 ± 0.06 a73.12 ± 3.22 a510.25 ± 17.58 a19.71 ± 2.25 a313.58 ± 13.51 a
S30.11 ± 0.02 a1.23 ± 0.09 a0.03 ± 0.007 a3.43 ± 0.60 a61.38 ± 0.11 b525.99 ± 16.86 a19.59 ± 0.74 a342.97 ± 11.96 a
C. CoastC10.19 ± 0.03 a1.15 ± 0.02 a0.04 ± 0.002 a4.01 ± 0.20 ab75.90 ± 0.35 a422.14 ± 7.37 b18.38 ± 2.02 a217.73 ± 28.14 a
C20.14 ± 0.01 a0.71 ± 0.07 b0.03 ± 0.003 a3.15 ± 0.49 b73.79 ± 5.83 a472.91 ± 0.87 a17.47 ± 3.20 a272.93 ± 35.47 a
C30.20 ± 0.04 a1.21 ± 0.12 a0.03 ± 0.005 a4.31 ± 0.58 a71.44 ± 1.43 a417.00 ± 11.63 b16.50 ± 1.95 a245.62 ± 31.44 a
Statistical differences within vineyards from the same region are expressed as letters. Different letters mean significant differences (Tukey’s test, p < 0.05). * Means significant differences between region averages. S-Sonoma County, C-Central Coast. Numbers 1, 2, 3 indicate different sites within the same region (n = 3).
Table 3. Percentage extractability of different phenolic classes as calculated for all the samples analyzed.
% ExtractabilityFlavan-3-ols *AnthocyaninPolymeric Pigments *Polymeric Phenols *
S150.88 ± 5.10 a36.14 ± 1.84 b42.90 ± 2.58 a6.83 ± 0.41 a
S249.89 ± 4.50 a30.61 ± 1.82 bc39.48 ± 2.39 abc7.37 ± 0.43 a
S338.74 ± 4.20 b30.77 ± 1.94 bc40.38 ± 2.71 ab7.18 ± 0.38 a
C129.78 ± 2.34 b26.76 ± 0.56 cd33.54 ± 1.96 c3.97 ± 0.21 c
C230.76 ± 2.14 b43.35 ± 3.89 a34.46 ± 2.15 bc5.62 ± 0.37 b
C333.04 ± 2.96 b22.69 ± 1.08 d33.71 ± 2.09 c3.78 ± 0.26 c
Statistical differences within vineyards from the same region are expressed as letters. Different letters mean significant differences (Tukey’s test, p < 0.05). * Means significant differences between region averages. S-Sonoma County, C-Central Coast. Numbers 1, 2, 3 indicate different sites within the same region.
Publisher’s Note: MDPI stays neutral with regard to jurisdictional claims in published maps and institutional affiliations.

