Article

Bioethanol Production Optimization from KOH-Pretreated Bombax ceiba Using Saccharomyces cerevisiae through Response Surface Methodology

1
Department of Biotechnology, Faculty of Science, University of Sargodha, Sargodha 40100, Pakistan
2
Food & Biotechnology Research Center, PCSIR Laboratories Complex Ferozepur Road, Lahore 54600, Pakistan
3
Institute of Zoology, Faculty of Life Science, University of the Punjab New Campus, Lahore 54590, Pakistan
4
Department of Clinical Laboratory Sciences, College of Applied Medical Sciences, King Khalid University, Abha 62529, Saudi Arabia
5
Institute of Biochemistry & Biotechnology, University of Veterinary and Animal Sciences, Lahore 54000, Pakistan
6
Shenyang No. 126 Middle School, Shenyang 110000, China
7
College of Bioscience & Biotechnology, Shenyang Agricultural University, Shenyang 110065, China
*
Authors to whom correspondence should be addressed.
Fermentation 2022, 8(4), 148; https://doi.org/10.3390/fermentation8040148
Submission received: 16 March 2022 / Accepted: 23 March 2022 / Published: 28 March 2022
(This article belongs to the Special Issue Biofuels Production and Processing Technology)

Abstract

:
The present study was based on the production of bioethanol from alkali-pretreated seed pods of Bombax ceiba. Pretreatment is necessary to properly utilize seed pods for bioethanol production via fermentation. This process assures the accessibility of cellulase to the cellulose found in seedpods by removing lignin. Untreated, KOH-pretreated, and KOH-steam-pretreated substrates were characterized for morphological, thermal, and chemical changes by scanning electron microscopy (SEM), thermogravimetric analysis (TGA), X-ray diffraction (XRD), and Fourier transform infrared spectroscopy (FTIR). Hydrolysis of biomass was performed using both commercial and indigenous cellulase. Two different fermentation approaches were used, i.e., separate hydrolysis and fermentation (SHF) and simultaneous saccharification and fermentation (SSF). Findings of the study show that the maximum saccharification (58.6% after 24 h) and highest ethanol titer (57.34 g/L after 96 h) were observed in the KOH-steam-treated substrate in SSF. This SSF using the KOH-steam-treated substrate was further optimized for physical and nutritional parameters by one factor at a time (OFAT) and central composite design (CCD). The optimum fermentation parameters for maximum ethanol production (72.0 g/L) were 0.25 g/L yeast extract, 0.1 g/L K2HPO4, 0.25 g/L (NH4)2SO4, 0.09 g/L MgSO4, 8% substrate, 40 IU/g commercial cellulase, 1% Saccharomyces cerevisiae inoculum, and pH 5.

1. Introduction

High dependence on conventional nonrenewable fuels and global warming have urged humankind to search for alternative renewable fuels. Ethanol from lignocellulosic biomass could be an encouraging substitute for gasoline, as it has a higher octane number which causes less emission of air pollutants. For this purpose, lignocellulosic biomass including grasses, agricultural wastes, and forest residues has gained much attention due to its ubiquitous availability and nature of being eco-friendly [1,2,3,4]. Bioethanol is a type of biofuel obtained after the hydrolysis and fermentation of lignocellulosic resources. Basically, three steps are involved in bioethanol production, which are pretreatment, saccharification, and fermentation. Pretreatment is the first step, which is achieved by various methods such as physical, chemical, biological, or a combination. The major aim of pretreatment is to alter the structure of biomass exposing maximum cellulose content. Therefore, pretreatment is essential for enzymatic saccharification of lignocellulosic biomass. The pretreated lignocellulosic matter becomes more digestible as compared to the untreated biomass, although it may have nearly the same amount of lignin as raw biomass. Pretreatment has both chemical and physical effects. Physically it damages the structure of lignin and increases the surface area, hence causing physical or chemical perforation of the plant cell wall. Chemically it alters the solubility and depolymerization of the biomass and decomposes cross-linking between macromolecules. The alkali causes swelling of the biomass, which leads to disruption or disintegration of the lignin. Therefore, lignocellulosic biomass requires pretreatment to make the substrate digestible for commercial cellulase, or cellulase-producing microorganisms, to release sugars for fermentation [5,6,7]. The second step is saccharification, which is conversion of cellulose into sugars by cellulase enzymes. The third step is fermentation of saccharified material to ethanol yeast such as Saccharomyces cerevisiae [8,9]. Different technical approaches such as X-ray diffraction (XRD), scanning electron microscopy (SEM), Fourier transform infrared spectroscopy (FTIR), and thermogravimetric analysis (TGA) have been extensively used to study the structural and chemical changes generated by pretreatments of lignocellulosic biomass [10].
The most common processes of fermentation used in ethanol production are simultaneous saccharification and fermentation (SSF) and separated hydrolysis and fermentation (SHF) [11]. In SSF, sugars produced by the action of cellulase are immediately converted by S. cerevisiae into ethanol [12]. Thus, the inhibition effect caused by the sugars over the cellulases is neutralized [13]. This process has various studied advantages such as cost-effectiveness, requirements for fewer enzymes, high saccharification efficacy, high yield of ethanol, reduced operational time, and low chances of contamination or inhibition, as well as it not requiring reactors with large volumes [14,15,16].
In the case of SHF, saccharification and fermentation proceed in separate units at their optimal conditions. However, it has some issues regarding inhibition and risk of contamination as it is a prolonged process [12,15]. Several fermenting microorganisms have been studied to convert sugars but Saccharomyces is the most commonly used microorganisms for this purpose because it can produce ethanol from glucose with almost 90% of theoretical yield [11,17]. In this study, KOH-pretreated seed pods of Bombax ceiba were hydrolyzed by commercial as well as indigenous cellulase, then hydrolysate was fermented into ethanol by S. cerevisiae in SSF and SHF. Ethanol production was further optimized by one factor at a time (OFAT) and central composite design (CCD). There are some reasons for the selection of this substrate as it is easily and abundantly available. It is an inexpensive source. It has a good polysaccharide content. Use of this tree waste is nature-friendly because it is a second-generation feedstock; it would not compete with food sources and would also lead to waste management. There is no research reported on this feedstock for bioethanol production.

2. Materials and Methods

2.1. Substrate

Seed pods of B. ceiba were picked from native areas of district Sargodha, Punjab, Pakistan. The substrate was processed and pretreated with KOH as described in our earlier report [1].

2.2. Substrate Characterization

Raw and two other samples with maximum cellulose contents, each from different treatments (chemical and thermochemical), were selected for further characterization through X-ray diffraction (XRD) D8 Advance model [18], thermogravimetric analysis (TGA) SDT Q600 V8.0 Build 95 [10], Fourier transform infrared spectroscopy (FTIR) Align technologies Cary 630 and scanning electron microscopy (SEM) S-3700 (Hitachi, Tokyo, Japan) [9].

2.3. Saccharification and Fermentation

Untreated substrate (raw) and pretreated substrates from each pretreatment with maximum cellulose contents, i.e., KOH-pretreated and KOH-steam-treated, were employed for ethanol production through SHF and SSF [9,19].

2.4. Separate Hydrolysis and Fermentation (SHF)

For separate hydrolysis, three parameters including time (2, 4, 6, 8, 24, 26, 28, 30 h), substrate loading (1, 2, 3, 4, 5, 6, 7, 8, 9, 10% (w/v)), and enzyme concentration (FPU range of 20, 40, 60, 80, 100, and 120 IU/mL) were optimized by following OFAT. For SHF, substrate loading (2%) was hydrolyzed with 100 IU/mL of indigenous cellulase (produced by Bacillus aerius MG597041) in a 250 mL Erlenmeyer flask. In parallel, substrate (2%) was also saccharified with 40 IU/mL of commercial cellulase (obtained from the microbiology lab, PCSIR) in citrate buffer of pH 5. Hydrolysis was conducted at 50 °C for the total time period of 24 h. Material was centrifuged at 10,000 rpm for 10 min at the end of saccharification. The supernatant was collected for the analysis of sugar. Saccharification (%) was calculated using the following formula [9]. One unit (U) of enzyme activity was described as the total extent of the enzyme, which released 1 micromole of glucose under the standard assay conditions.
Saccharification   ( % ) = Reducing   sugars   released   ( mg / mL ) Substrate   used   ( mg / mL )   × 100

2.5. Inoculum Preparation of Saccharomyces Cerevisiae

Locally isolated and identified strains of S. cerevisiae were revived on potato dextrose agar (PDA) slants. The inoculum medium used was composed of (%) 1 glucose, 0.25 (NH4)2SO4, 0.1 KH2PO4, 0.05 MgSO4, and 0.25 yeast extract. S. cerevisiae suspension (inoculum) was prepared by adding a loopful of S. cerevisiae culture from slant to S. cerevisiae growth media (inoculum media) at 30 °C for 24 h [9,20]. The vegetative cells obtained after 24 h were used as an inoculum source.

2.6. Bioethanol Production

The hydrolysates obtained from saccharification of untreated and pretreated substrates using indigenous and commercial cellulase were fermented in different flasks for bioethanol production. S. cerevisiae media components (%, 0.25 (NH4)2SO4, 0.1 KH2PO4, 0.05 MgSO4, and 0.25 yeast extract) were added to the hydrolysates and then autoclaved at 121 °C for 15 min. After sterilization, the media were allowed to cool at room temperature. Then, 1% (v/v) suspension of S. cerevisiae was inoculated in each hydrolysate media mixture and incubated anaerobically at 30 °C for a 96 h fermentation period. At the end of fermentation, ethanol produced was analyzed by HPLC [9].

2.7. Simultaneous Saccharification and Fermentation

SSF of untreated and pretreated substrate (with maximum cellulose content from both pretreatments) was performed in a 1 L fermenter (Eyla, Japan). About 8% of substrate was mixed in 1 L citrate buffer and then sterilized [21]. After autoclaving, indigenously produced cellulase (FPU 100 IU/mL) from Bacillus aerius, accession number MG597041, was added to the substrate to make a mixture of enzyme and substrate at 40 °C at 200 rpm. After 24 h, the mixture was aseptically incorporated with 1% culture of S. cerevisiae containing various nutrients, i.e., 10 g glucose, 2.5 g (NH4)2SO4, 1g KH2PO4, 0.5 g MgSO4, and 2.5 g yeast extract, and incubated at 30 °C at 200 rpm. In parallel, the same experiment was performed with commercial cellulase (FPU 40 IU/mL). The samples were withdrawn periodically at intervals of 24 h for estimation of sugars and ethanol.

2.8. Optimization of Physical Parameters for Ethanol Production in SSF

KOH-steam-pretreated seedpods offered maximum ethanol production in SSF when hydrolyzed with commercial cellulase. Ethanol production from this KOH-steam treated-substrate in SSF was further optimized through OFAT [22] by varying different physical parameters, i.e., concentration of substrate (2%, 4%, 6%, 8%, 10%), pH (4, 5, 6, 7, 8), cellulase concentration FPU (20, 40, 60, 80, 100, 120) and S. cerevisiae inoculum size (1%, 2%, 3%, 4%, 5% v/v) in media containing nutrients (g/L), i.e., glucose 10, (NH4)2SO4 2.5, KH2PO4 1, MgSO4 0.5, and yeast extract 2.5.

2.9. Optimization of Nutritional Parameters for Ethanol Production in SSF

Central composite design was used to optimize the different components of the medium for ethanol production in SSF [23]. Each variable was designated and used with a high (+) and a low (−) concentration. The nutrient factors tested included concentrations of yeast extract, K2HPO4, (NH4)2SO4, and MgSO4 (Table 1). CCD was conducted by the experiment of 31 runs and ethanol was measured by HPLC.

2.10. Ethanol Estimation

Samples were taken aseptically after every 24 h during the fermentation process. Consumed glucose and ethanol produced were determined by HPLC (PerkinElmer, Waltham, MA, USA) using a BioRad Aminex HPX 87H (250 mm × 4.6 mm) column with a mobile phase of 5 mM H2SO4, flow rate of 0.7 mL/min, and column temperature of 60 °C. All samples were passed through a 0.2 µm sterile membrane filter and an injection volume of 20 µL was used for estimation. Concentrations of ethanol and glucose were determined by a calibration curve [9].

2.11. Ethanol Fermentation Kinetics

Kinetic parameters for biomass and bioethanol were measured as described by Pirt [24] and Okpokwasili and Nweke [25]. Different kinetic parameters such as μ (h−1), Yp/x, Yp/s, Yx/s, qs, and qp were examined in the fermentation process.

3. Results and Discussion

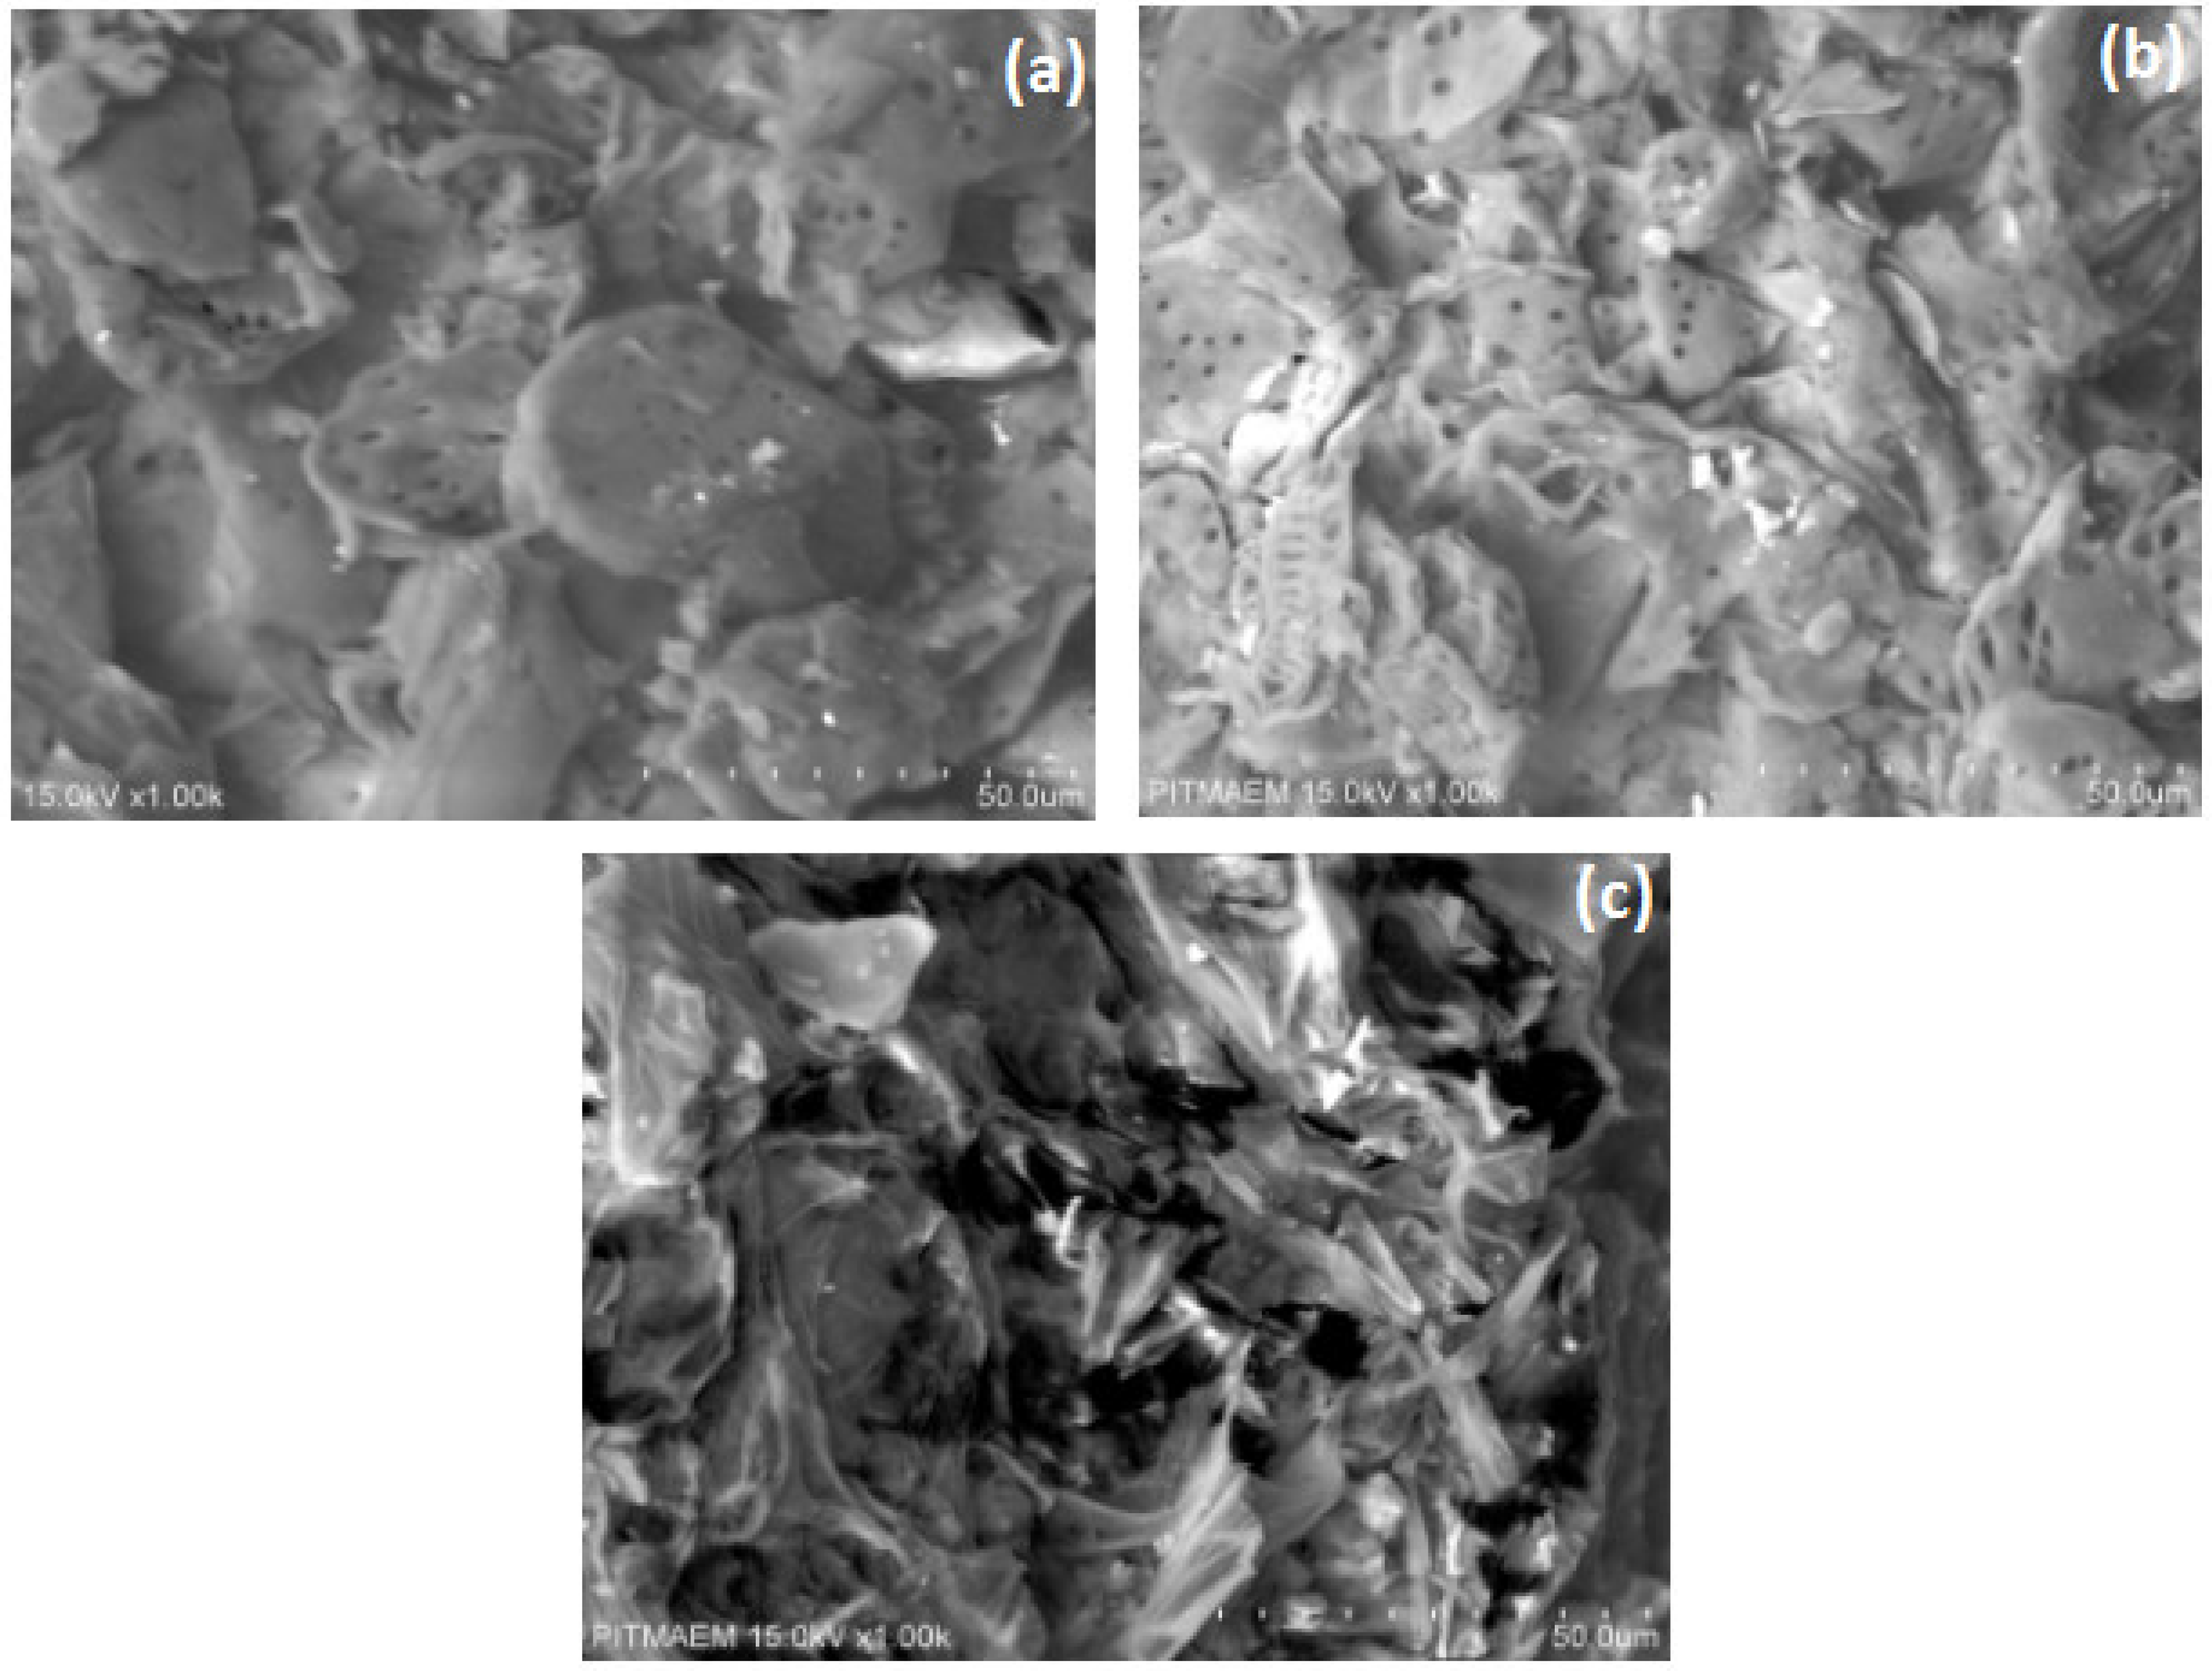
3.1. SEM of KOH-Pretreated B. ceiba

Scanning electron microscopy was used to observe the structural modifications in B. ceiba biomass after KOH and KOH steam pretreatment. SEM micrographs revealed that the surface texture and morphology after both pretreatments were significantly different from those of untreated B. ceiba (Figure 1). The SEM micrograph of the untreated specimen exhibits a non-porous, smooth, and more compact surface, while a greater degree of porosity is seen on both the pretreated samples. The size and number of pores are greater in the thermochemically treated substrate, showing more lignin breakdown. This indicates that a large portion of lignin and hemicellulose can be eliminated by pretreatment. Relative to untreated substrate, remarkable changes were observed in the morphology of treated samples. A possible reason may be the breaking of the lignin xylan bond caused by acid/base pretreatment [26,27]. Tsegaye et al. [10] examined NaOH-pretreated rice straw by FE-SEM, showing that a significant amount of lignin was removed, which helps in releasing cellulose tangled in lignin. Jabasingh and Nachiyar [28] also observed such changes in bagasse. Irfan et al. [9] and Kusmiyati et al. [29] noticed a rough surface with holes in pretreated wheat straw and palm tree trunk waste, respectively, through SEM.

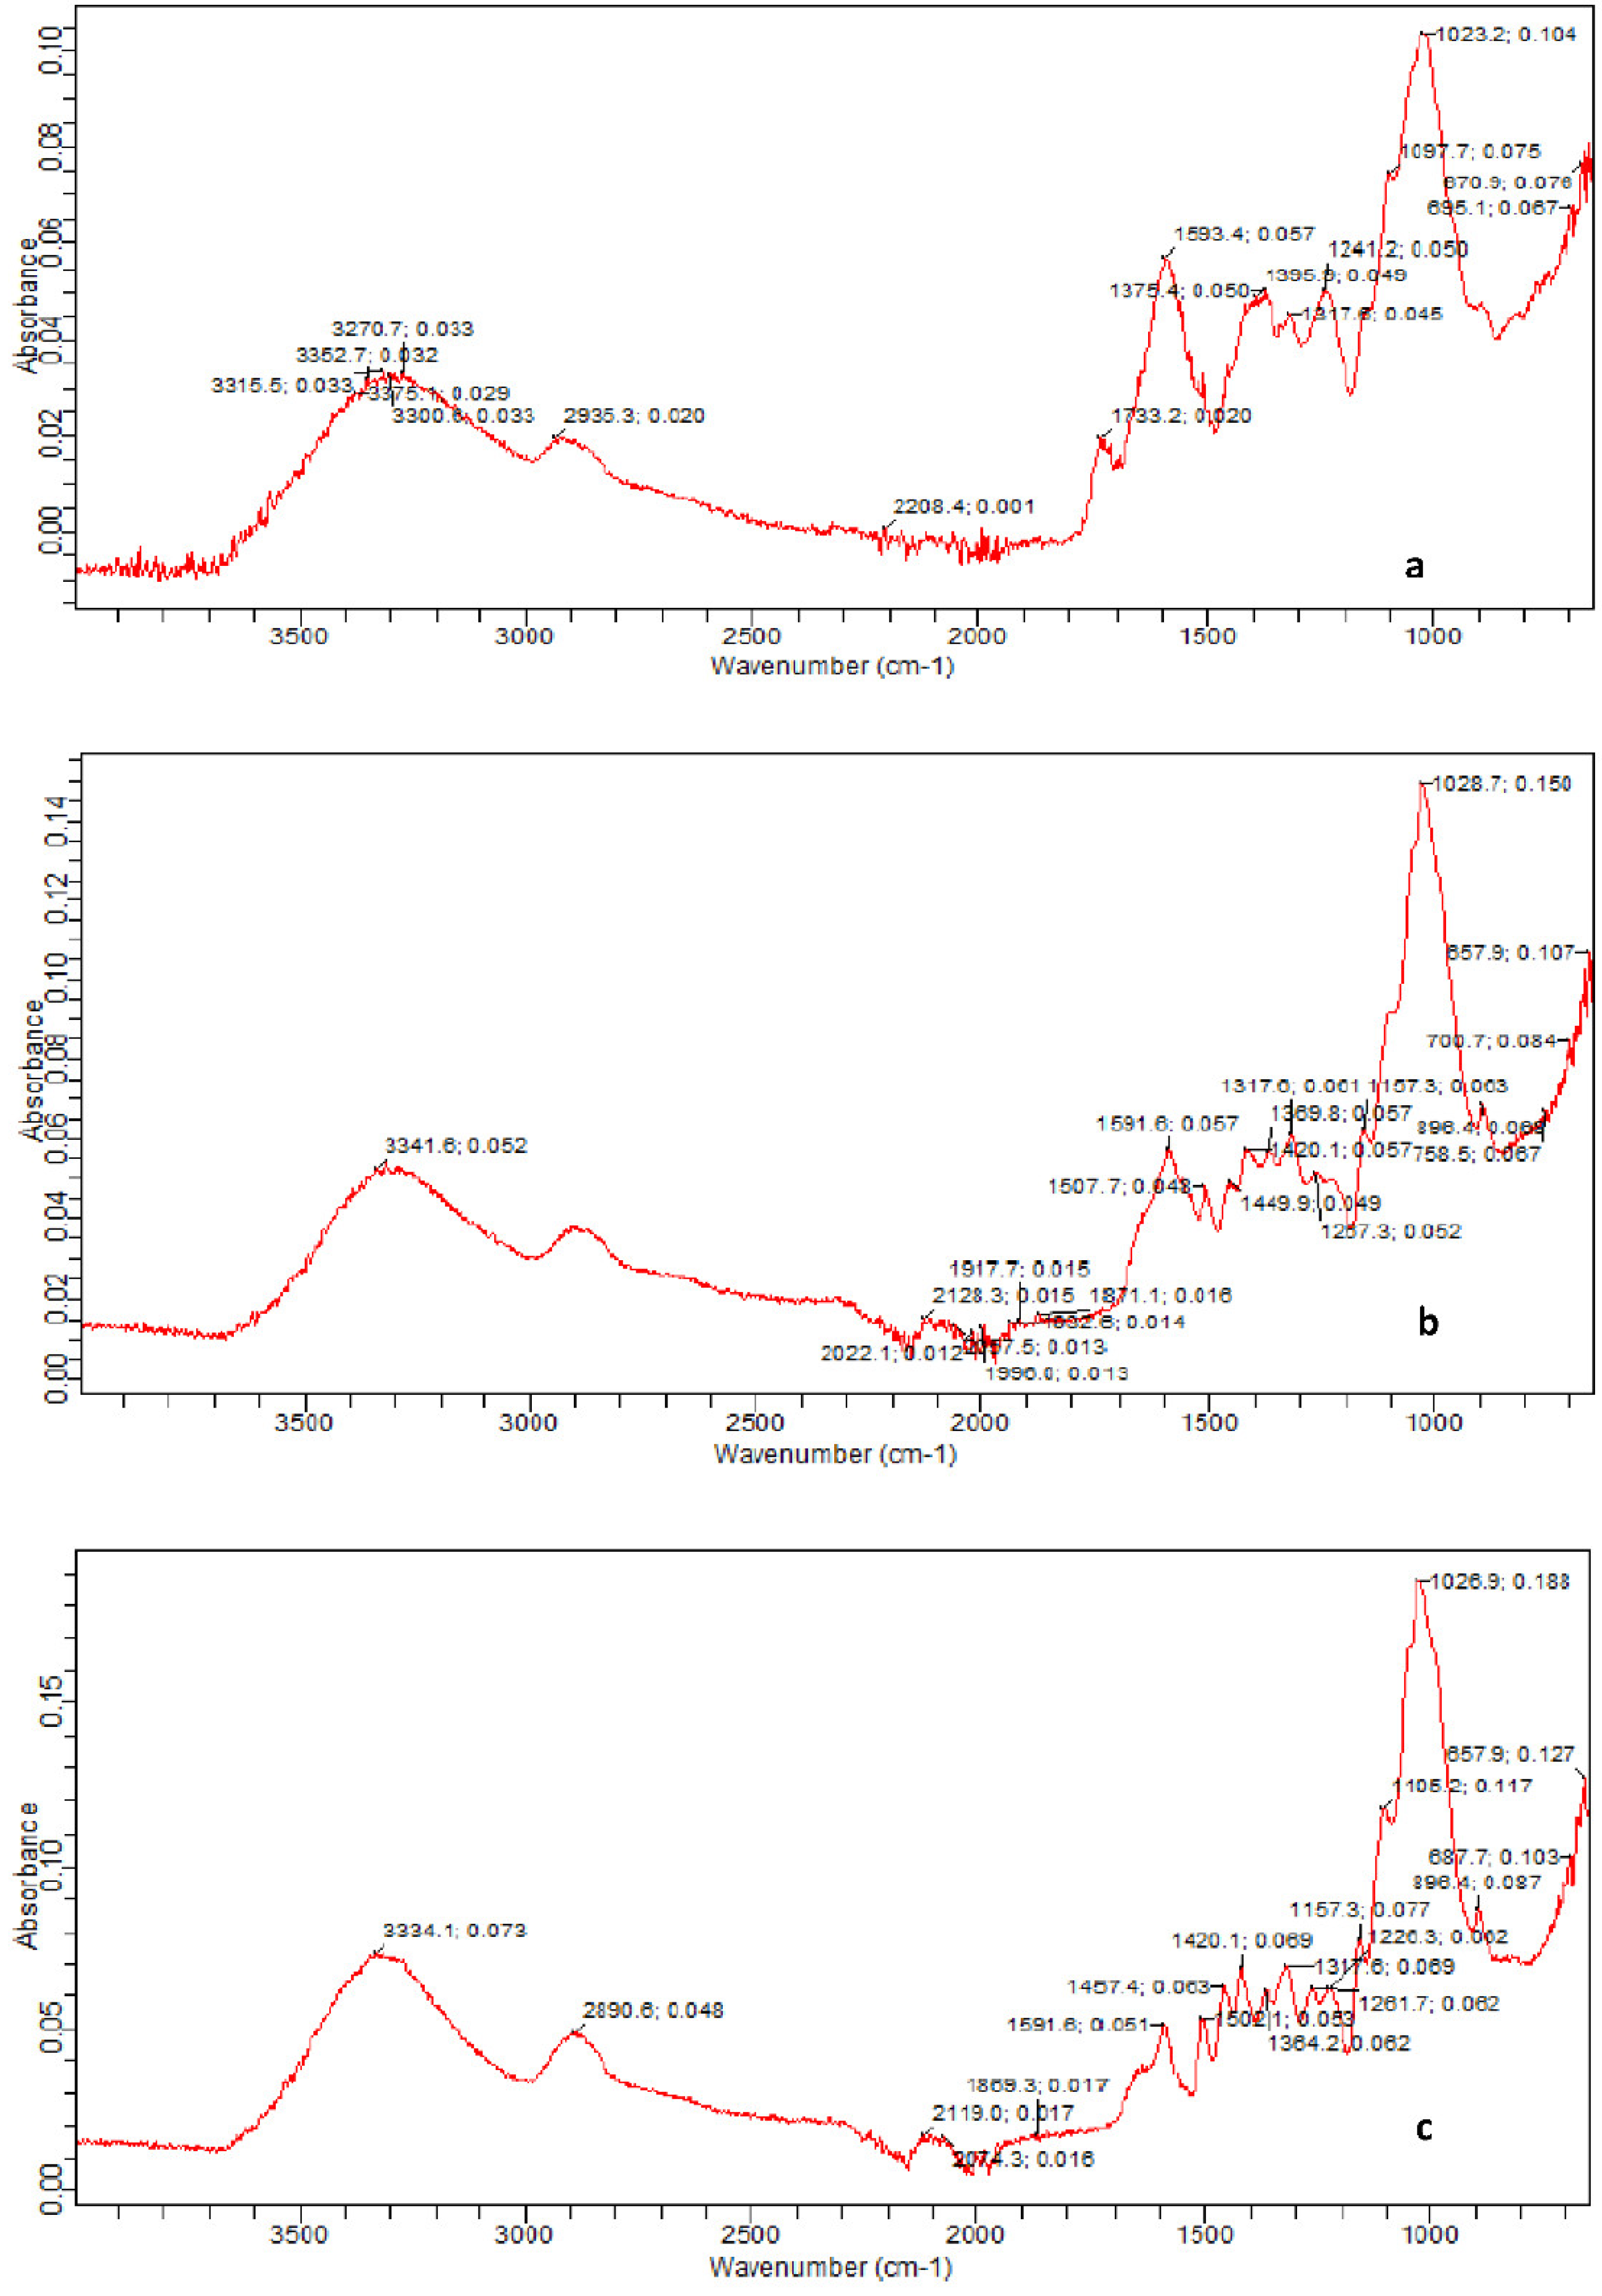
3.2. FTIR of KOH-Pretreated B. ceiba

FTIR of B. ceiba substrate (seed pods) pretreated with KOH and KOH steam was carried out to observe the alterations in the structural composition. The FTIR spectra of untreated and pretreated substrate were in the range 4000–400 cm−1. FTIR analysis revealed differences in untreated and pretreated B. ceiba (Figure 2). Many high- and low-intensity peaks were examined for all sample spectra. The highest peak seen in the untreated specimen was 1023.2 cm−1, which increased up to 1028.7 cm−1 and 1026.9 cm−1 in KOH and KOH steam treated substrates, respectively. This peak shift represents changes in C-O stretching in cellulose. The peak at 3352.7 cm−1 in untreated B. ceiba was seen at 3341.6 cm−1 after chemical treatment, whereas in thermochemical treatment this band was stretched to 3334.1 cm−1. The peak at 1593.4 cm−1 in untreated B. ceiba shifted to 1591.6 cm−1 in both treated samples, representing breakdown of lignin due to pretreatment. In the result of the alkalization process, OH bond distortion in the absorption region around 1518 cm−1 occurred, which illustrated the water immersion by cellulose and may also represent the occurrence of bands of the lignin and guasil ring.
The ester and acetyl groups in the hemicellulose, the COOH in the ferulic, and p coumeric bands in lignin shown in the spectra should be around 1740 cm1, specified by C=O groups, where the 1236 cm1 peak may specify the existence of lignin siringil groups [30]. Carbon hydrogen bond vibrations in cellulose and carbon oxygen bond vibrations in syringyl derivatives were illuminated by the peak observed at 1317.6 cm−1, where syringyl derivatives are salient constituents of lignin. When poplar substrate was pretreated with acid followed by steam, the C–O–C vibrations in cellulose and hemicellulose were demonstrated by the peak at 1157.3 cm−1. C–O vibrations in cellulose and hemicellulose were denoted by the band at 1028 cm−1 [20].

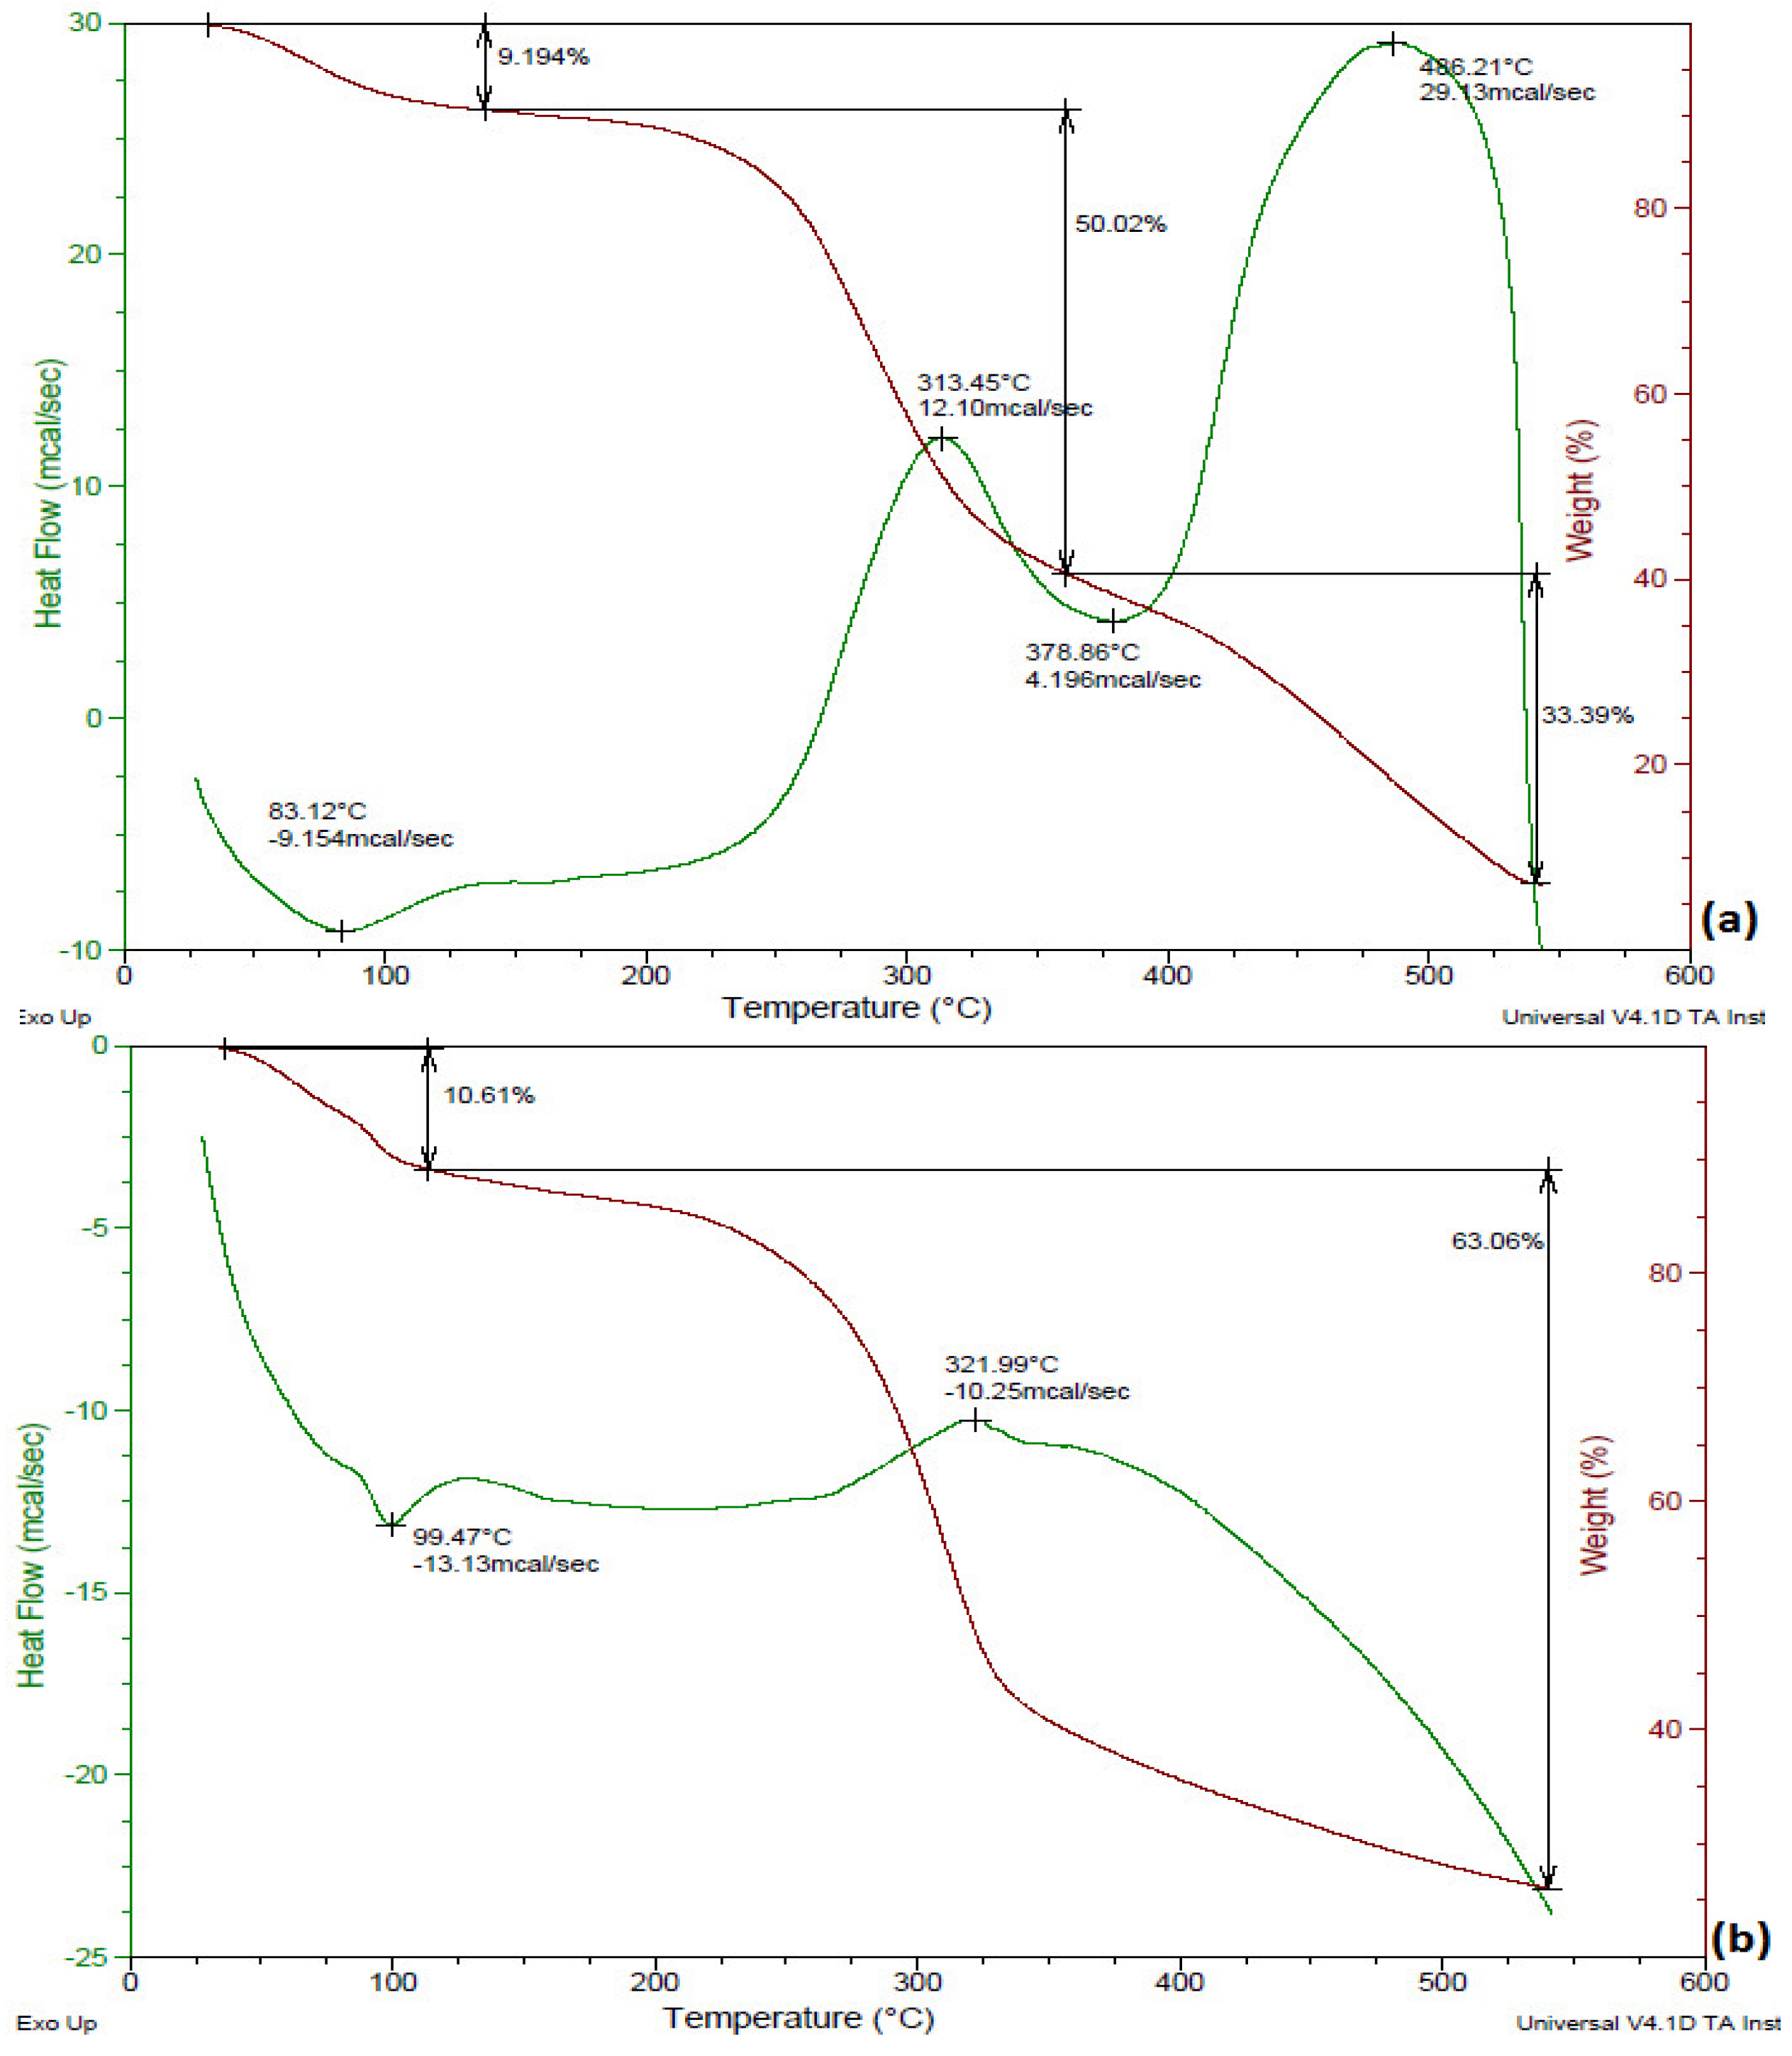
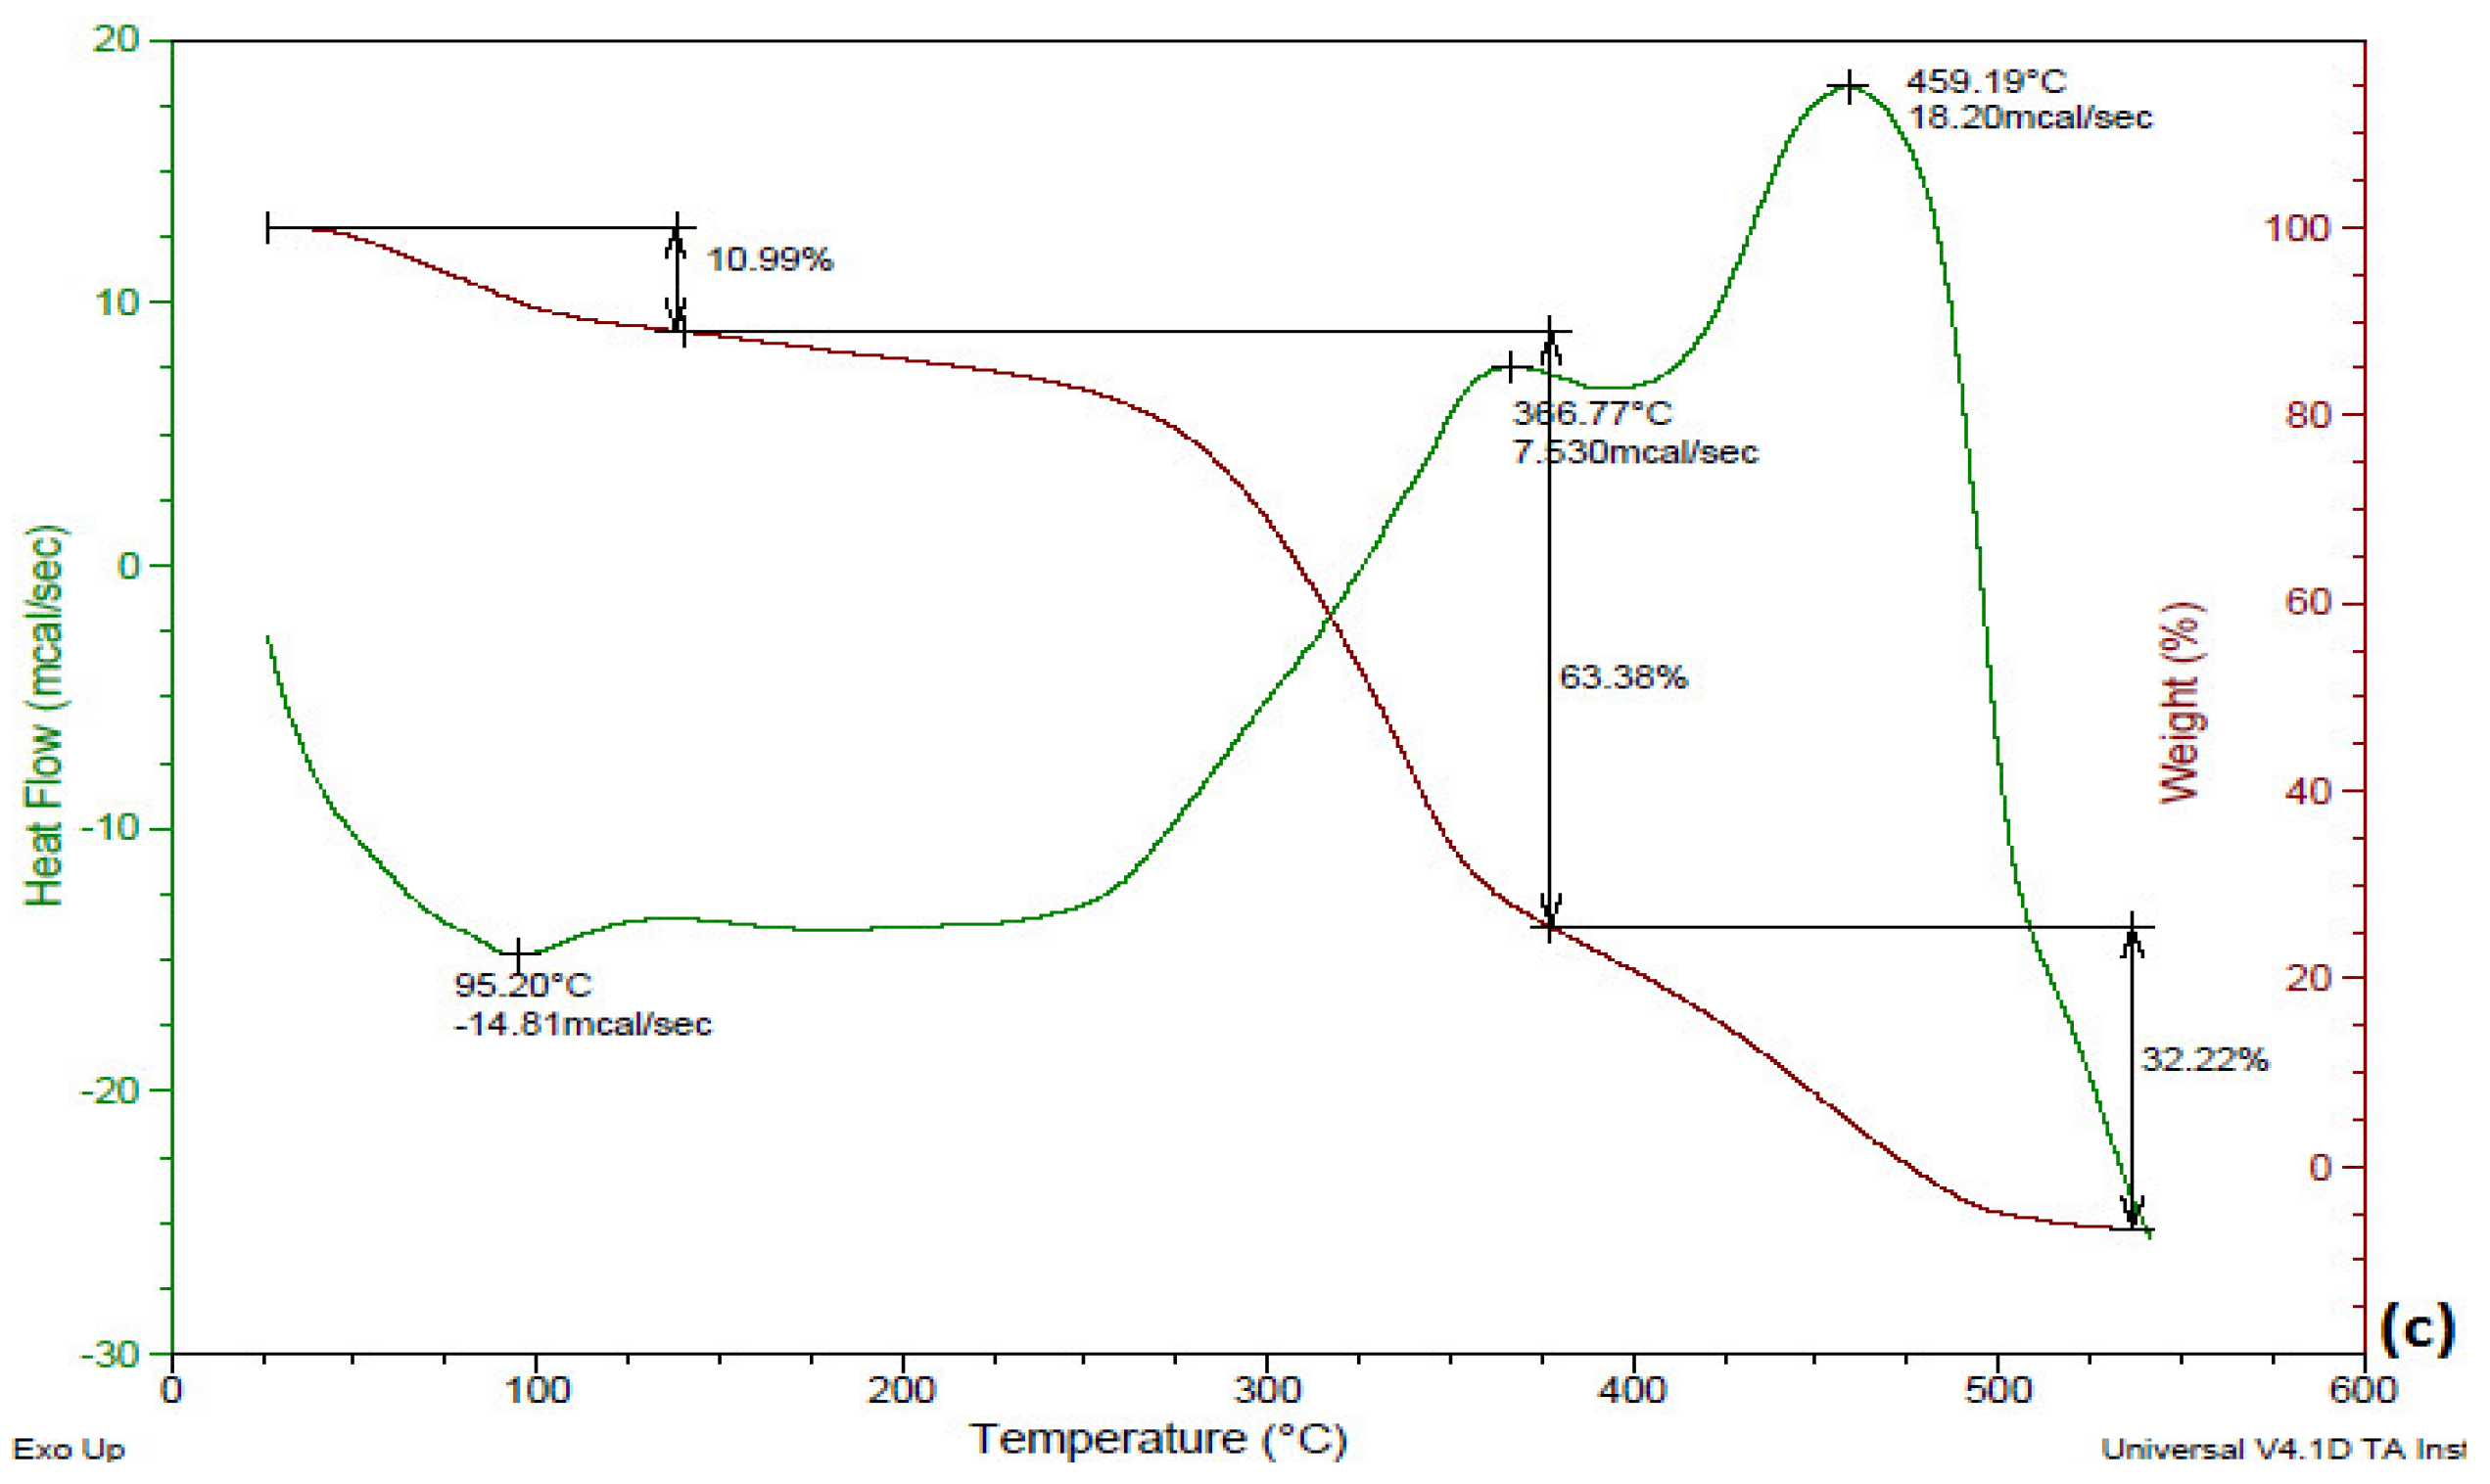
3.3. TGA of KOH-Pretreated B. ceiba

Thermal degradation behavior of raw and treated (KOH and KOH steam pretreatment) B. ceiba was studied by performing thermogravimetric analysis. Figure 3a reveals decomposition of raw substrate with time and temperature; 9.194% degradation was observed at 100–200 °C (first stage), 50.02% at 300–400 °C (second stage), and 33.39% at 500–600 °C (third stage). During the first stage the KOH-treated substrate showed 10.61% conversion, and it showed 63.06% during the third stage, as shown in Figure 3b, whereas the KOH-steam-treated substrate exhibited degradation of 10.99% during the first stage, 63.38% during the second stage, and 32.22% at 500–600 °C (Figure 3c). The KOH-steam-treated substrate exhibited a maximum degradation of 63.38% during the second stage. In an earlier investigation, TGA revealed the highest (74.48%) decomposition of Pinus ponderosa (sawdust) followed by Shorea robusta (sawdust) (70.03%) and Areca catechu (nut husk) (69.09%) in the temperature range 200–500 °C (second stage). Hemicellulose degraded at temperatures in the range 180–340 °C, cellulose conversion occurred at 230–450 °C, and lignin decomposed at temperatures greater than 500 °C [31]. A recent study by Tsegaye et al. [10] reported that the rate of loss of weight was very high (nearly 80%) in the temperature range 200–500 °C for all treatments considered.

3.4. XRD of KOH-Pretreated B. ceiba

Figure 4 reveals the XRD spectra of controlled and treated (both KOH and KOH steam) samples. The crystallinity index presents the crystalline features of cellulose. Two peaks obtained at 2θ = 22° and 2θ = 18° represent the crystalline part (cellulose only) and amorphous part (cellulose, hemicellulose, and lignin) of B. ceiba biomass, respectively. The crystallinity index of raw B. ceiba substrate was 34.5%, which increased in KOH-treated (44.6%) and KOH steam pretreatment (50.5%). Removal of the amorphous portion, such as hemicellulose and lignin, from biomass caused an increase in the crystallinity index. Irfan et al. [9] performed XRD of biomass and concluded that the crystallinity index of pretreated biomass was increased relative to the control, which specified the elimination of lignin and hemicellulose. Our findings were in accordance with a previous study by Barman et al. [32]. They reported that the crystallinity index (53.3%) of raw wheat straw increased up to 60.3% after 1.5% NaOH pretreatment. A recent study performed XRD of the NaOH-pretreated pith of coconut husk and determined that the removal of the aromatic layer increased the crystallinity index from 65% to 81.7% [33].

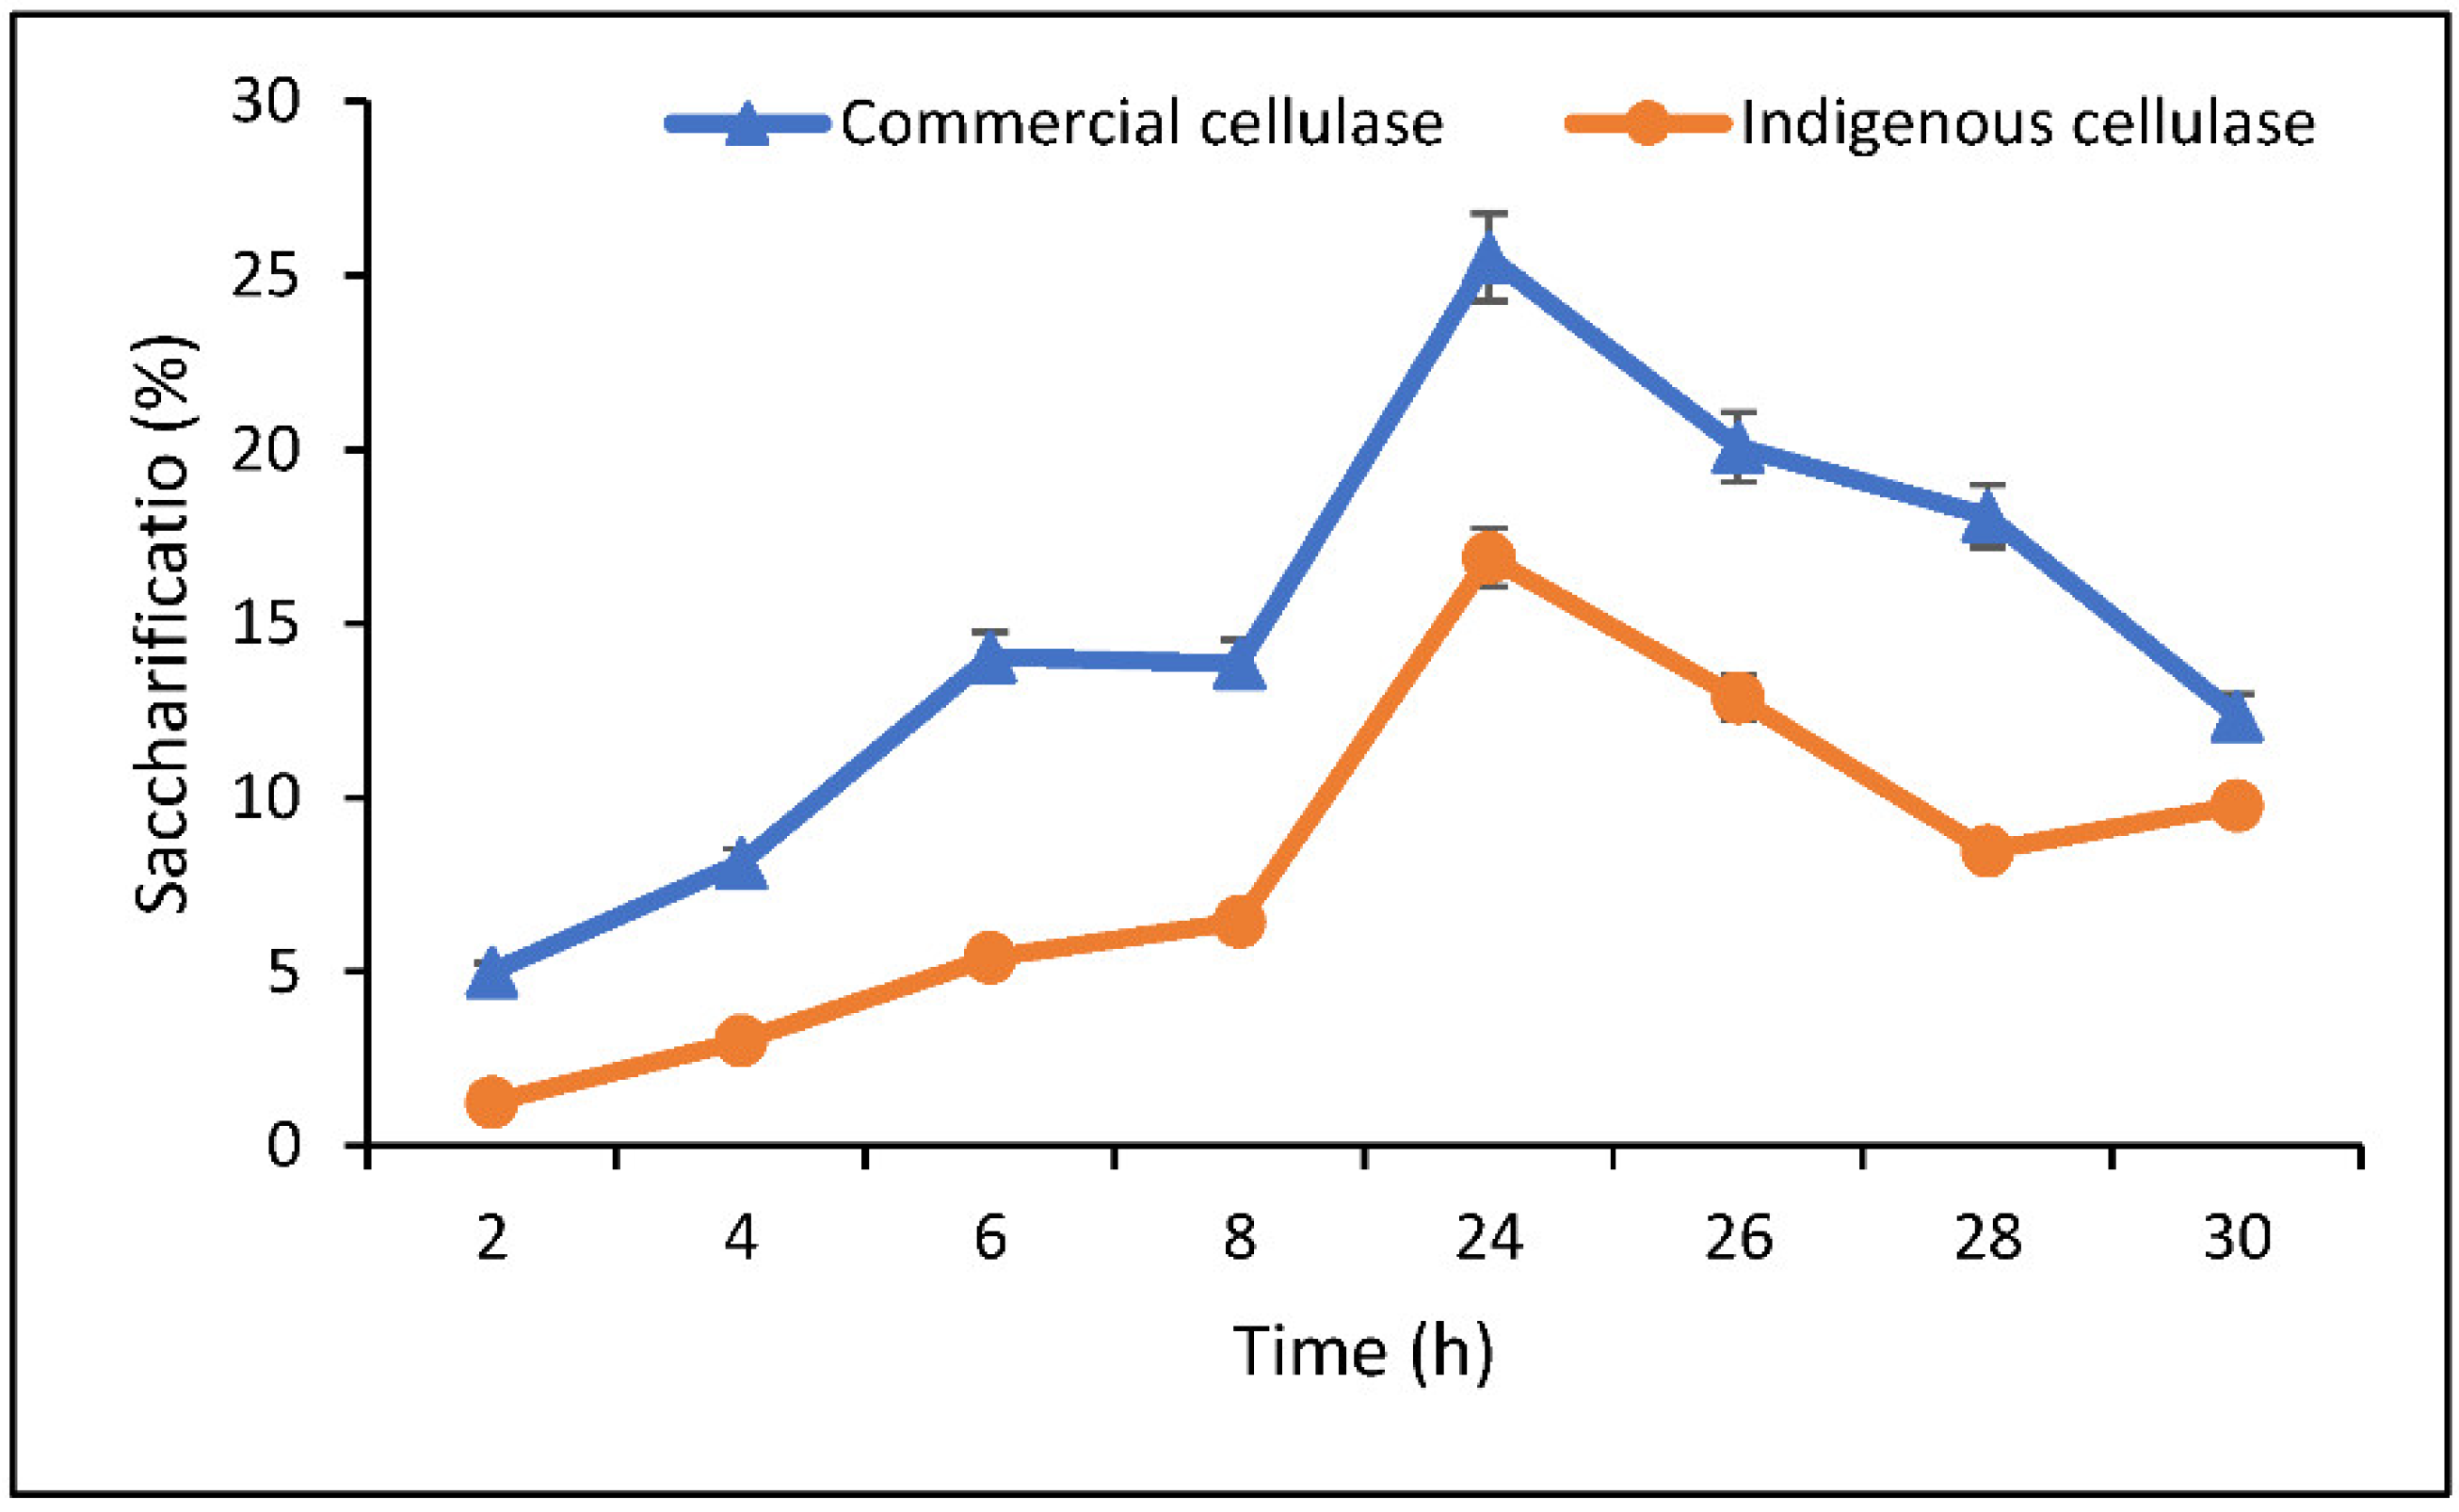
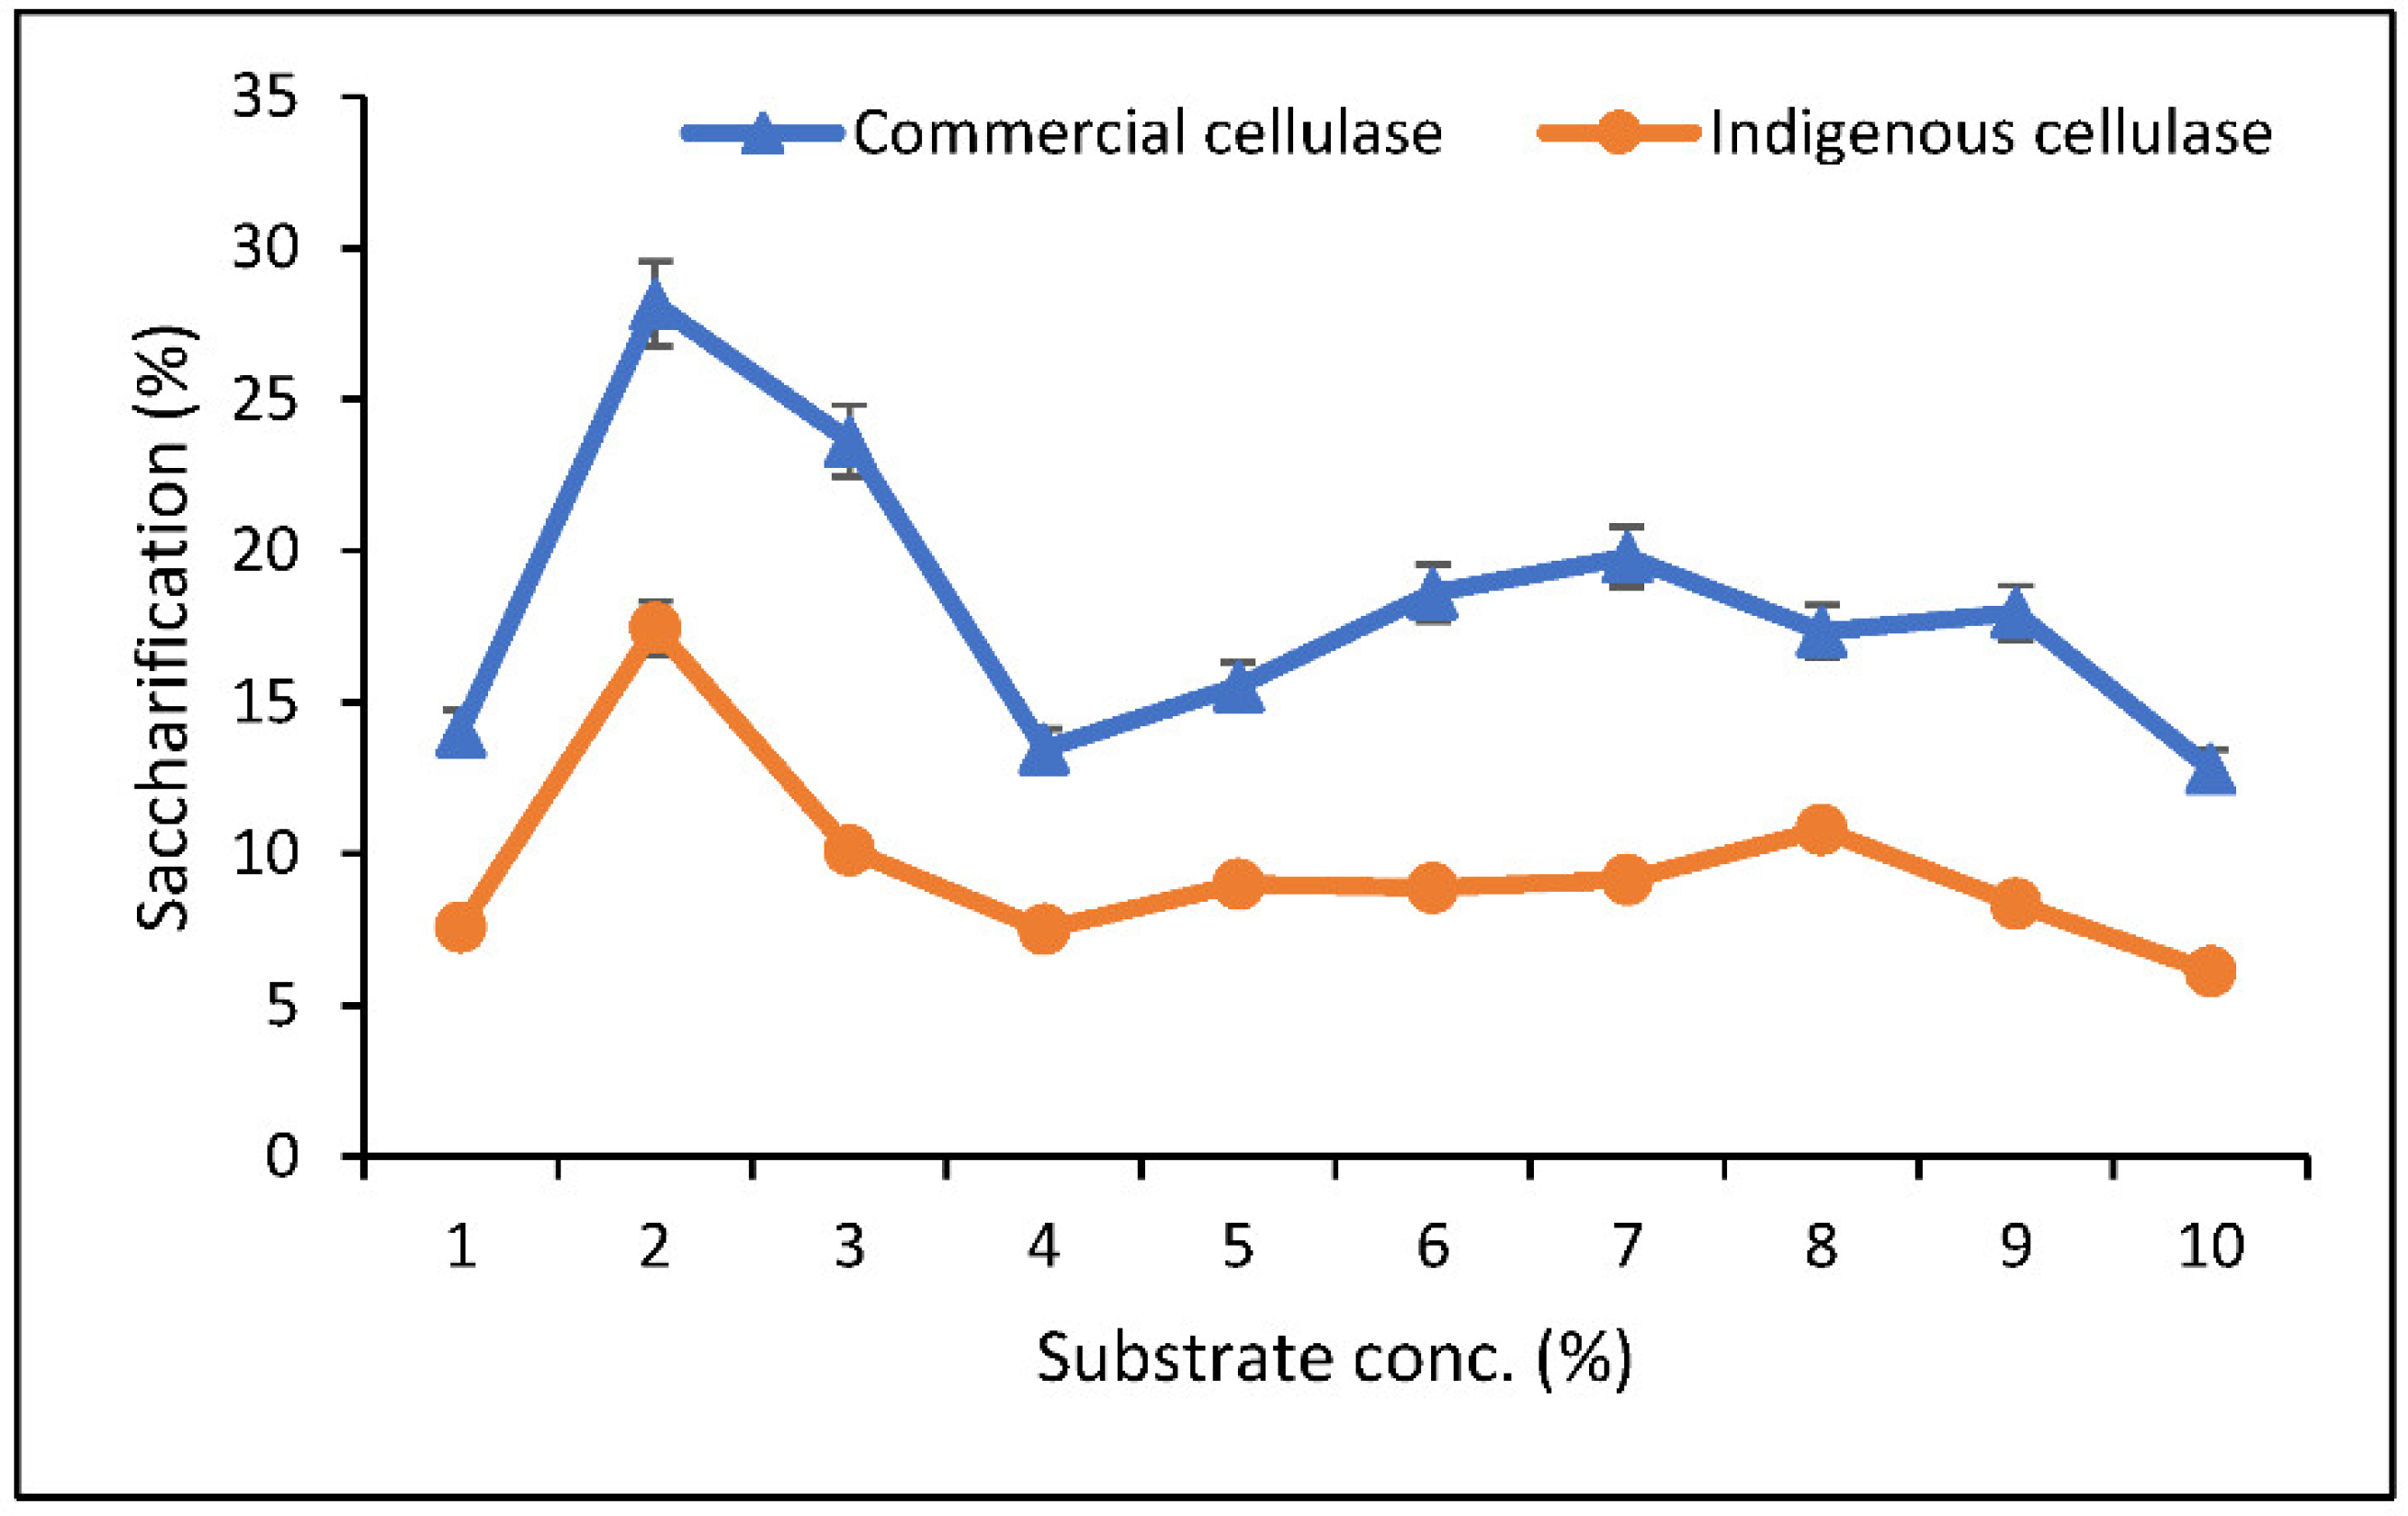
3.5. Optimization of Saccharification

The process of saccharification was optimized for both commercial and indigenous cellulase. Optimization was investigated with three parameters, i.e., time, substrate concentration, and cellulase concentration. The study found maximum saccharification (25.5%) with commercial cellulase and maximum saccharification (16.8%) with indigenous cellulase after 24 h. A gradual increase in hydrolysis (%) was observed until 24 h and after this optimum time, a decline in hydrolysis was observed in both cases (Figure 5).
For optimization of substrate concentration, maximum saccharification (28% with commercial cellulase and 14.4% with indigenous cellulase) was found at 2% substrate concentration in both hydrolysis with commercial cellulase as well as with indigenous enzymes. A decline in saccharification percentage was observed by increasing substrate concentration from 2–4%. Hydrolysis (%) remained constant on further increases in substrate concentration (Figure 6).
In the case of optimization of enzyme concentration, maximum saccharifications of 43% and 25.8% were found at FPU 40 IU/mL of commercial cellulase and 100 IU/mL of indigenous cellulase, respectively. Beyond these optimal conditions a distinct decline in saccharification (%) was noticed (Figure 7). In other research, the optimized conditions observed for maximum saccharification (40.15%) of wheat straw were 2% wheat straw, 0.5% cellulase loading, and a time period of 6 h [9]. Sindhu et al. [34] used BBD for optimizing hydrolysis and obtained maximum RS (0.651 g/g) at 11.25% (w/w) of substrate concentration, 50 FPU of commercial cellulase, and an incubation period of 42 h. Asghar et al. [35] obtained maximum hydrolysis (52.93%) with 2.5% biomass loading, 0.5% enzyme loading, and an incubation period of 8 h at 50 °C.

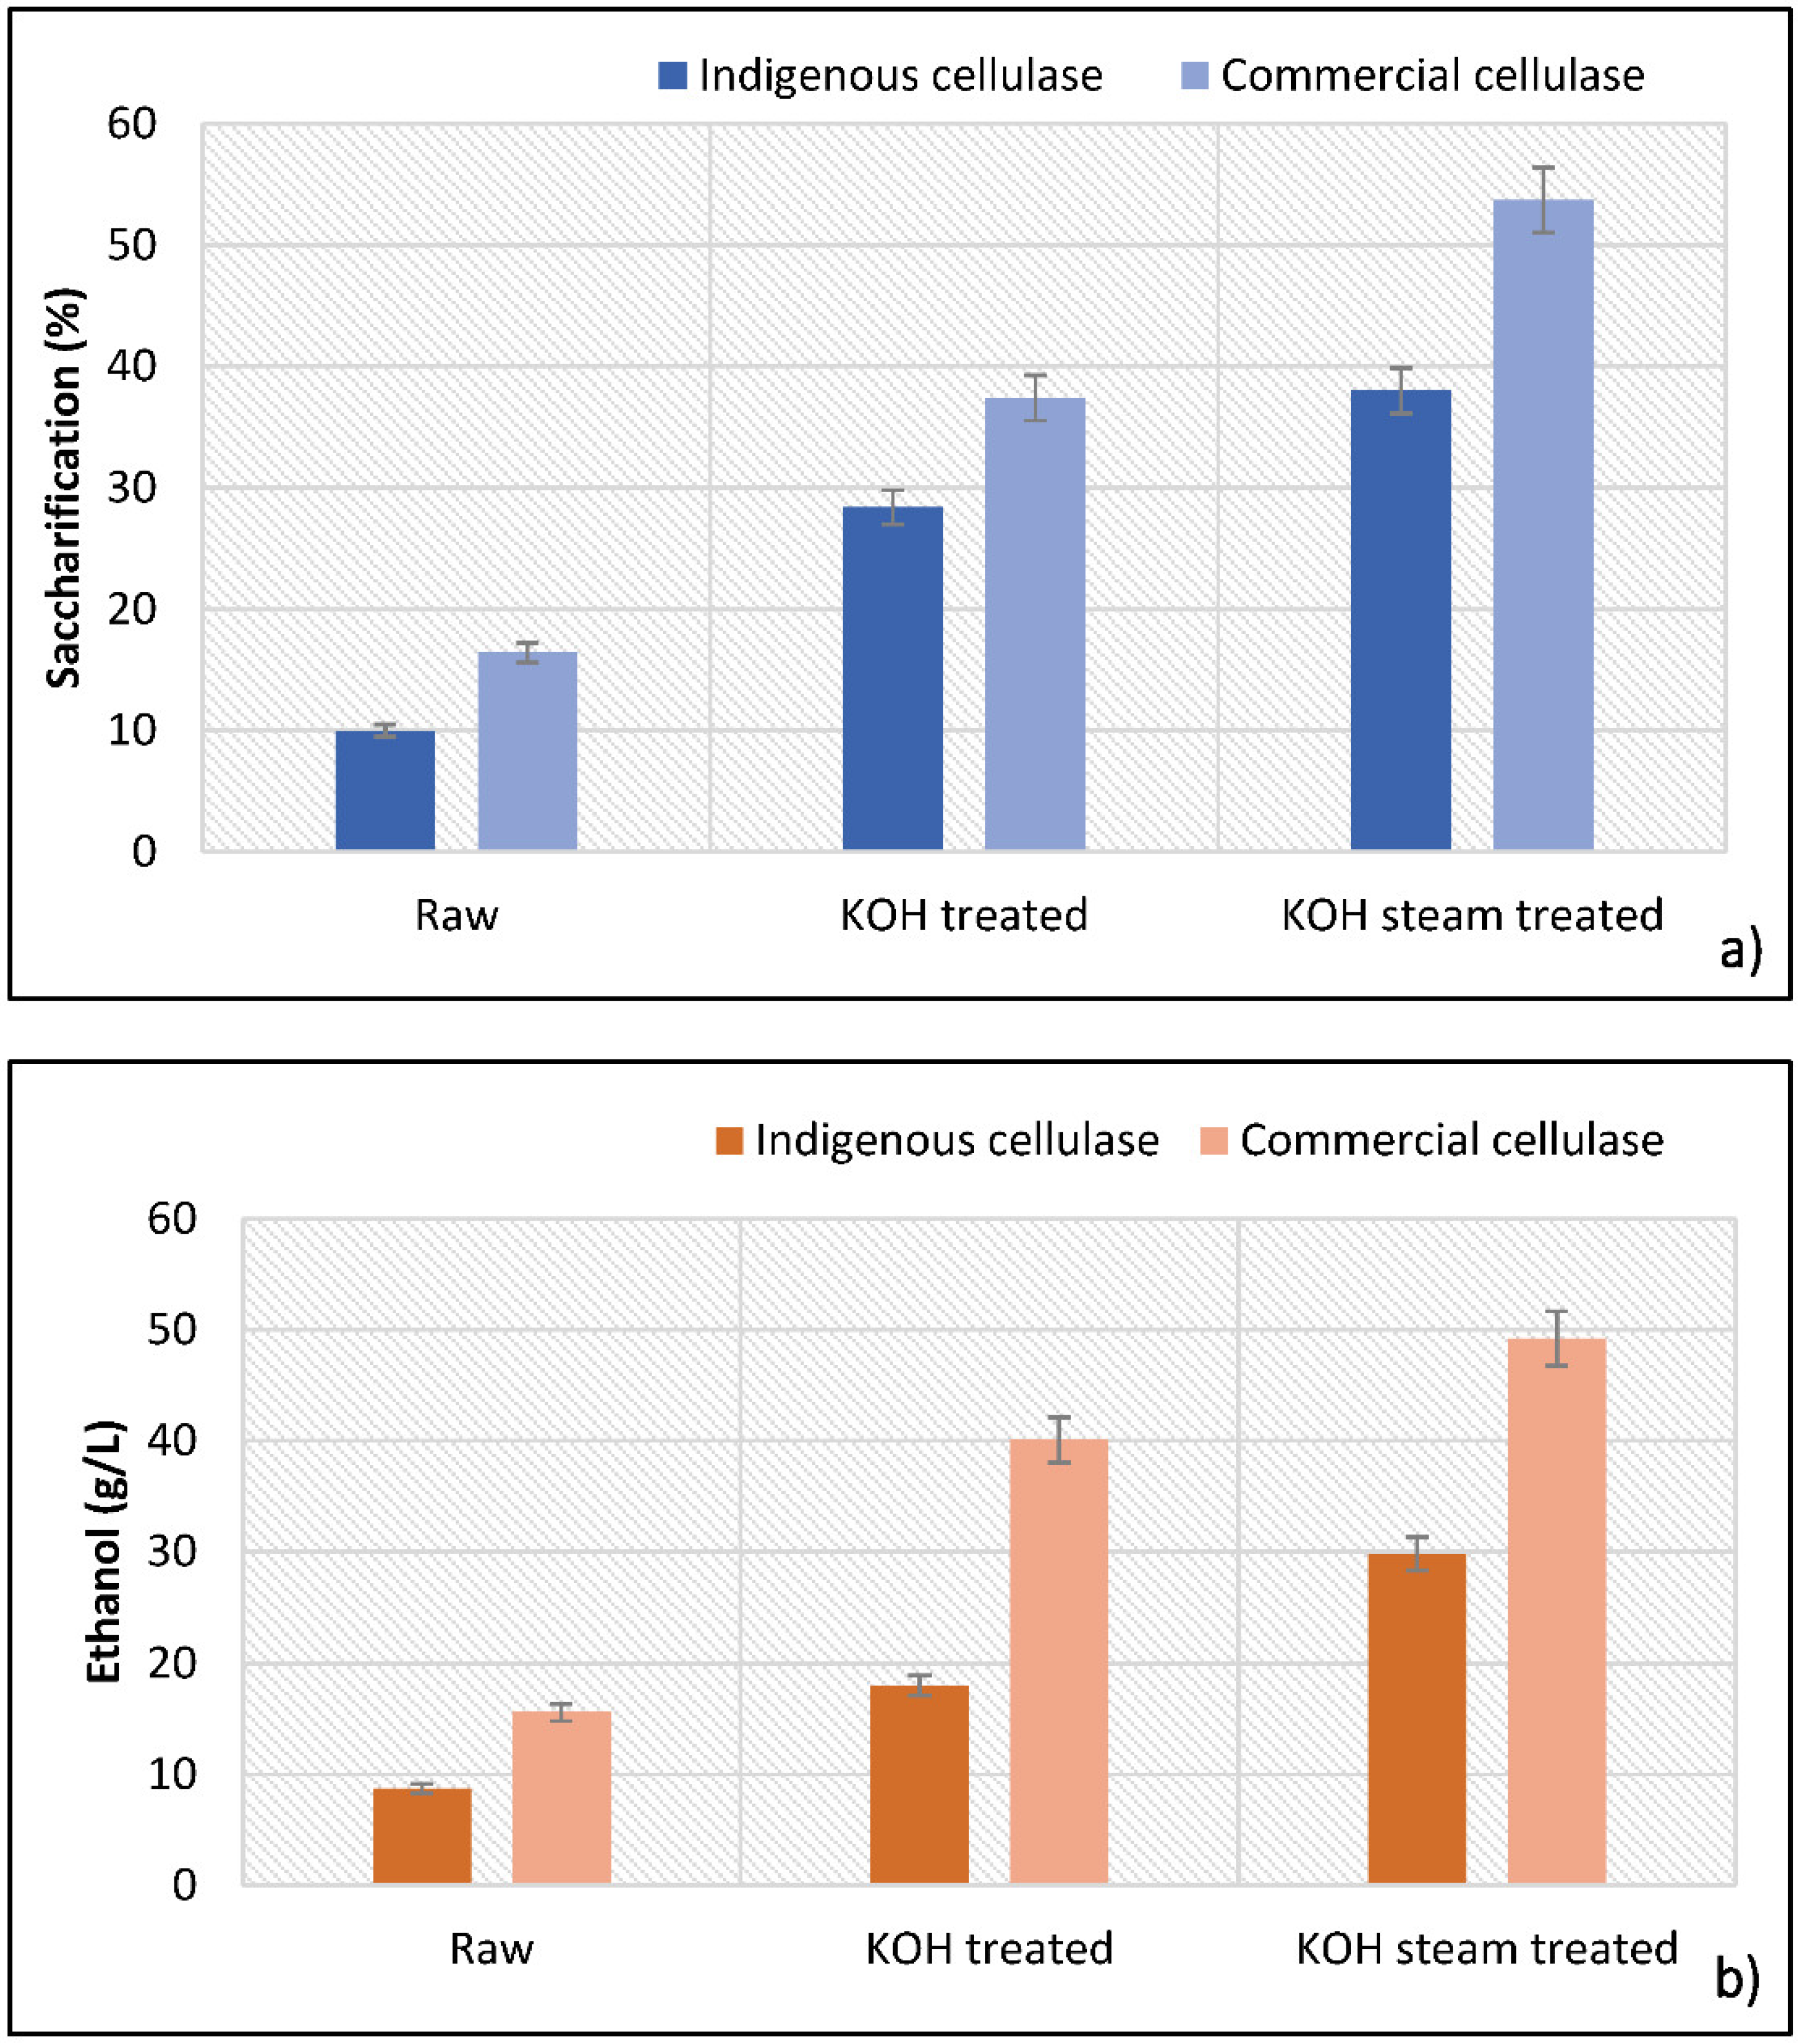
3.6. Separate Hydrolysis and Fermentation (SHF)

Saccharification was carried out in the optimized conditions by using both indigenous cellulase and commercial cellulase. Using indigenous cellulase, maximum saccharification (38%) was obtained in substrate B (KOH-pretreated followed by steam). Maximum saccharifications with indigenous cellulase in raw and KOH-treated samples were 10% and 28.4%, respectively (Figure 8a). Hydrolysates of this saccharification were fermented using S. cerevisiae. Fermentation resulted in production of ethanol; maximum ethanol production of 29.8 g/L was seen on the fermentation of hydrolysate of KOH-treated substrate after 4 days of incubation. Ethanol yields in the hydrolysate of untreated and KOH-treated substrates were 8.73 g/L and 18.04 g/L, respectively (Figure 8b). As compared to indigenous enzymes, maximum fermentable sugars were obtained with saccharification performed by commercial enzymes.
Hydrolysis with commercial cellulase offered maximum saccharification in the KOH-steam-treated substrate (53.7%) followed by the KOH-pretreated (37.3%) and raw (16.4%) substrates, as shown in Figure 8a. Fermentation (with S. cerevisiae) of sugars obtained from this saccharification gave a significant ethanol yield. Maximum ethanol production (49.2 g/L) was seen in the KOH-pretreated substrate, followed by the KOH-treated (40.06 g/L) and raw (15.6 g/L) substrates, as illustrated in Figure 8b. Our results corroborated the findings of Irfan et al. [36] that the commercial cellulase offered better saccharification as compared to the indigenous cellulase. They noticed 63.3% and 33.6% saccharifications in pretreated sugarcane bagasse and wheat straw, respectively, with commercial enzymes. The saccharification recorded with indigenously produced cellulase was in the range 6–14%.

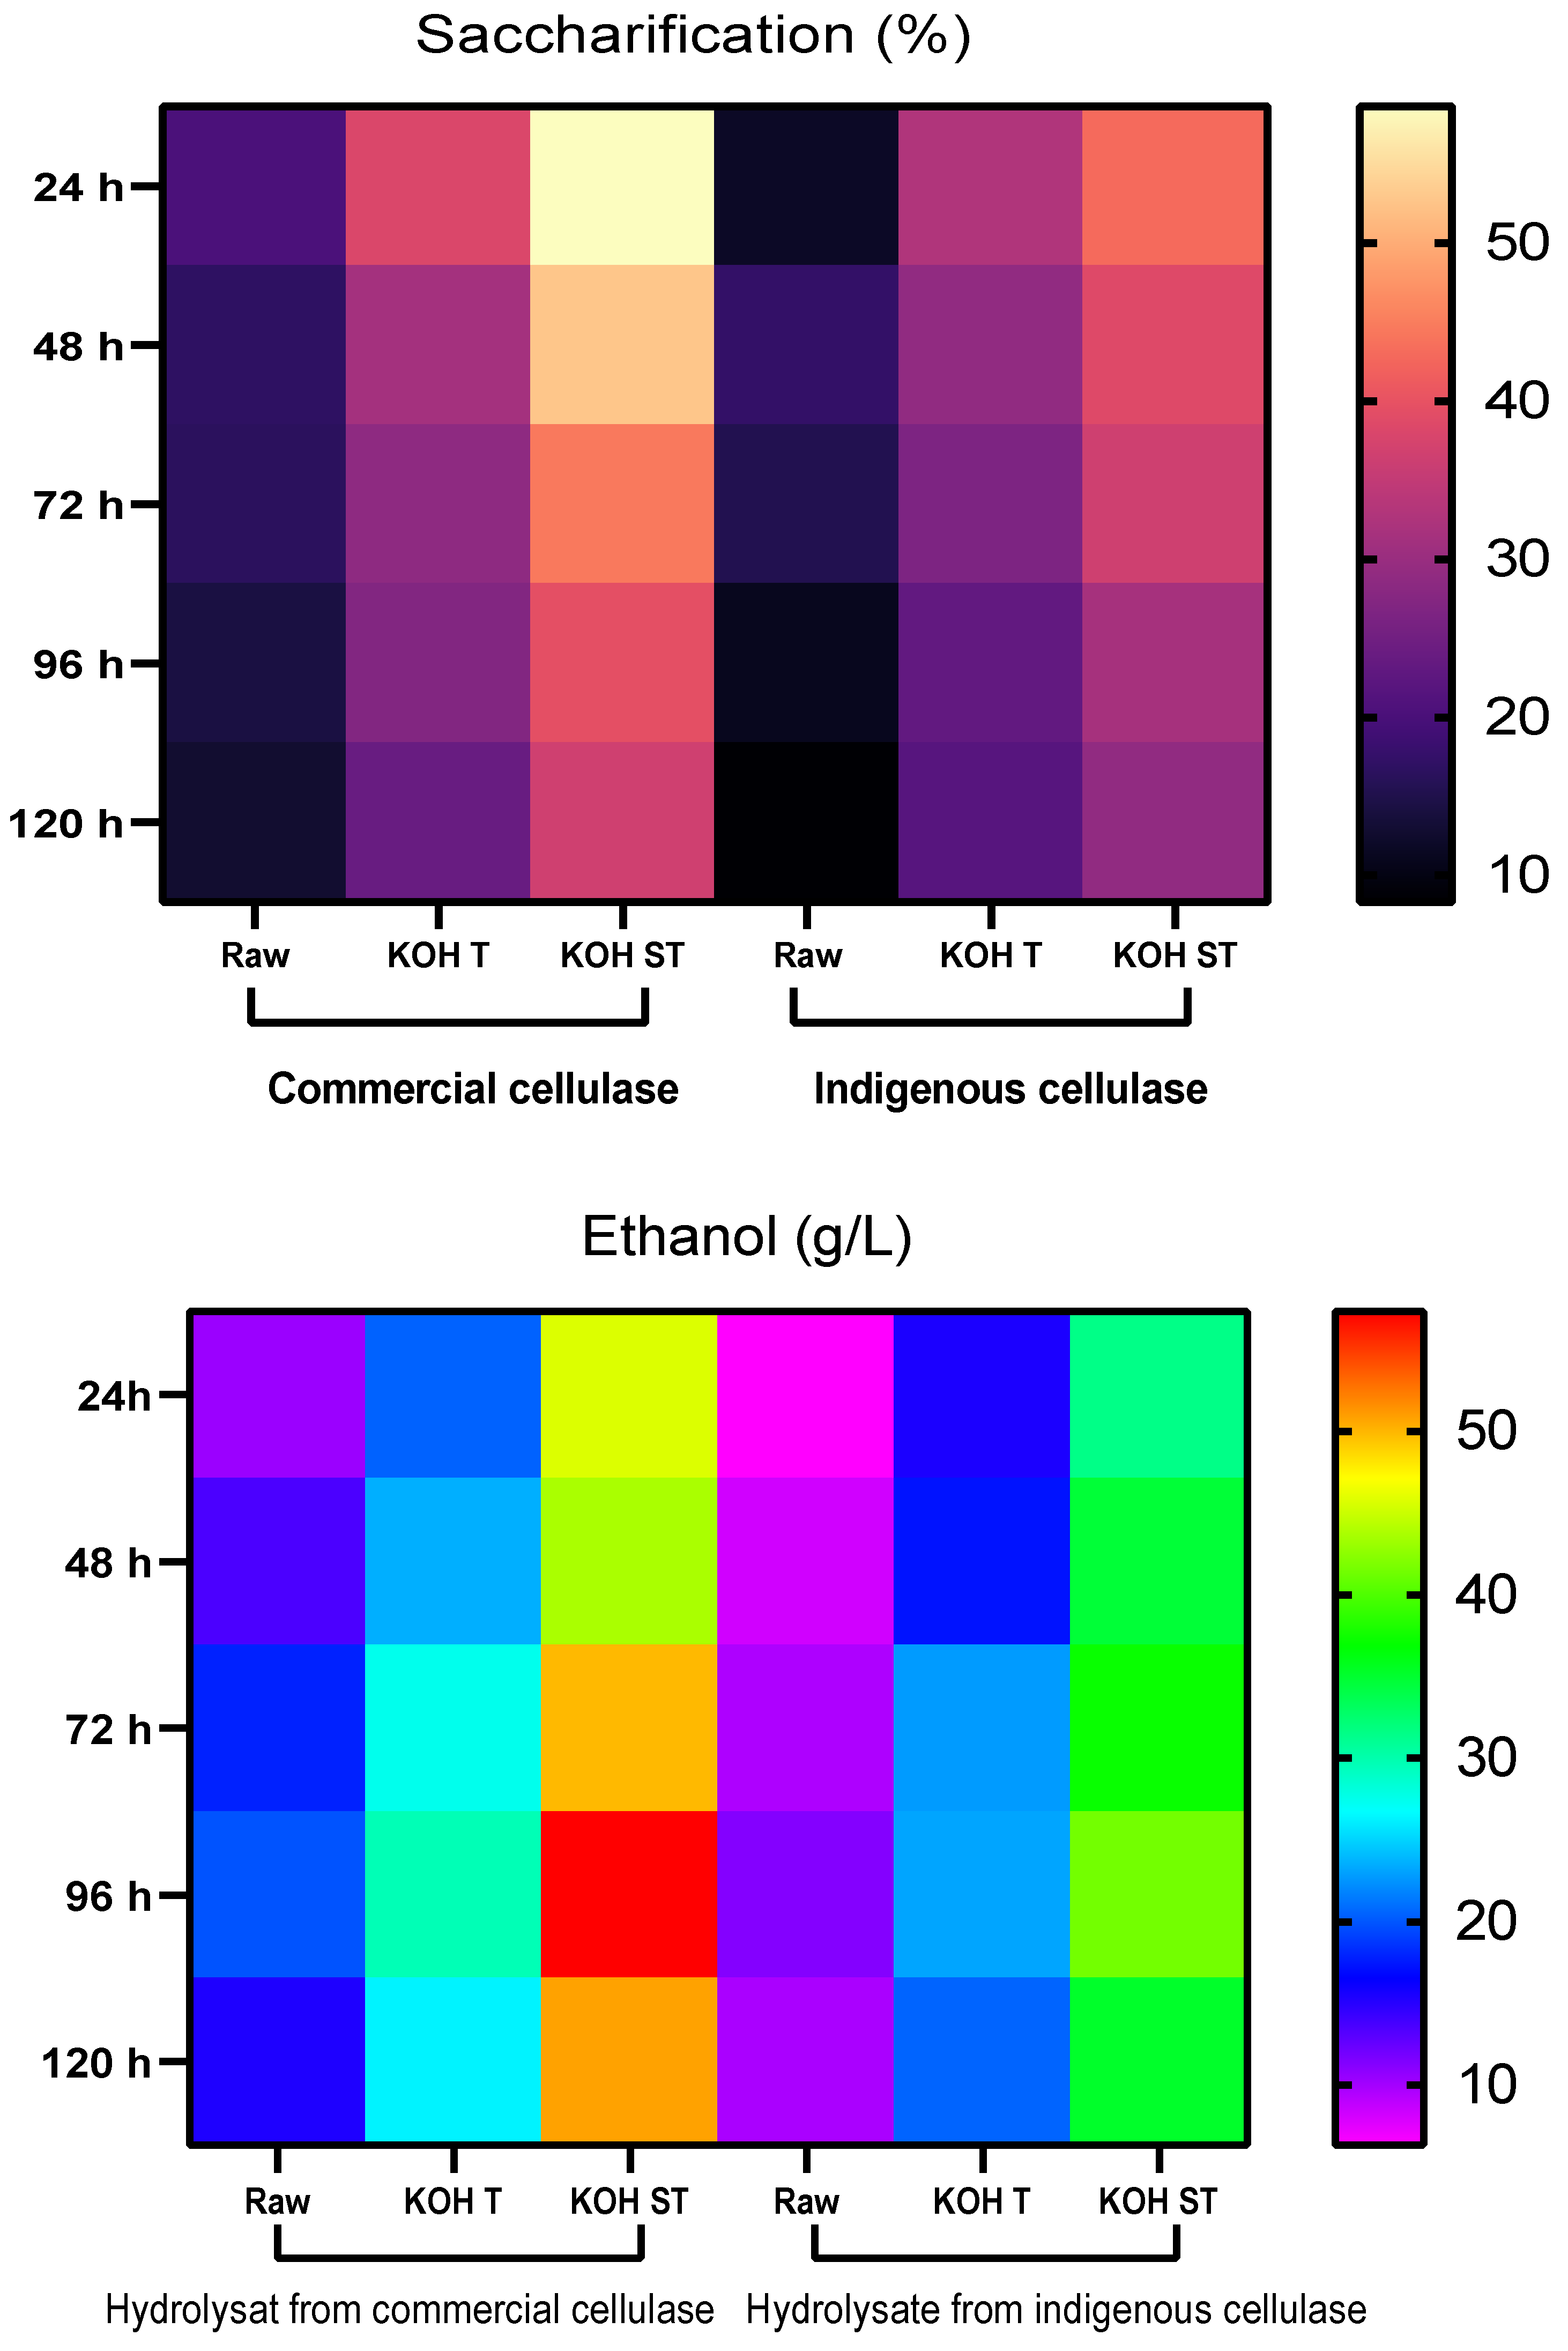
3.7. Simultaneous Saccharification and Fermentation (SSF)

SSF of untreated and treated B. ceiba biomass was conducted in a 1 L fermenter with both indigenous cellulase and commercial cellulase separately. Samples were taken every 24 h aseptically for estimation of glucose and ethanol. Estimation of glucose and ethanol was performed by HPLC. With indigenous cellulase, untreated biomass offered maximum saccharification (17.3%) after 48 h of hydrolysis. Among pretreated substrates, maximum saccharification of 42.9% was seen in KOH-steam-pretreated substrate followed by KOH treated (32.7%) after 24 h of hydrolysis. After 24 h, sugar contents started to decline due to the consumption of sugars by S. cerevisiae, as the fermentation process proceeded. KOH-steam-treated B. ceiba offered the highest ethanol production of 41.5 g/L after 96 h of fermentation. Maximum ethanol production (g/L) in raw (11.2) and KOH-treated (23.1) biomass was also observed after 96 h of fermentation at 40 °C (Figure 9).
In SSF with commercial cellulase enzymes, results showed maximum saccharification in KOH-steam-treated (58.6%), KOH-treated (37.9%), and untreated seedpods (20.2%) after 24 h of hydrolysis. Maximum ethanol yield (57.34 g/L) was observed in KOH-steam-pretreated substrate followed by KOH-treated (29.67 g/L) and raw (19.87 g/L) after 96 h of fermentation at 40 °C (Figure 9). The findings of Sukhang et al. [37] and Vintila et al. [38] corroborate our results that the SSF offered a higher yield of ethanol from lignocellulosic material than that of SHF. The findings show that SSF is more effective than SHF in terms of energy consumption, time, cost, and greater bioethanol yield. Kusmiyati and coworkers [29] reported 2.648% bioethanol production from pretreated palm tree trunk waste through SSF using S. cerevisiae and cellulase enzymes at 37 °C temperature, 4.8 pH, 10% substrate, and 100 rpm for 120 h. Another study noticed a remarkable ethanol titer from the SHF of an oil palm empty fruit bunch. Hydrolysis at 50 °C, pH 4.8, and 150 rpm of agitation for 96 h yielded 75.48% glucose, which subsequently produced 78.95% ethanol [39].

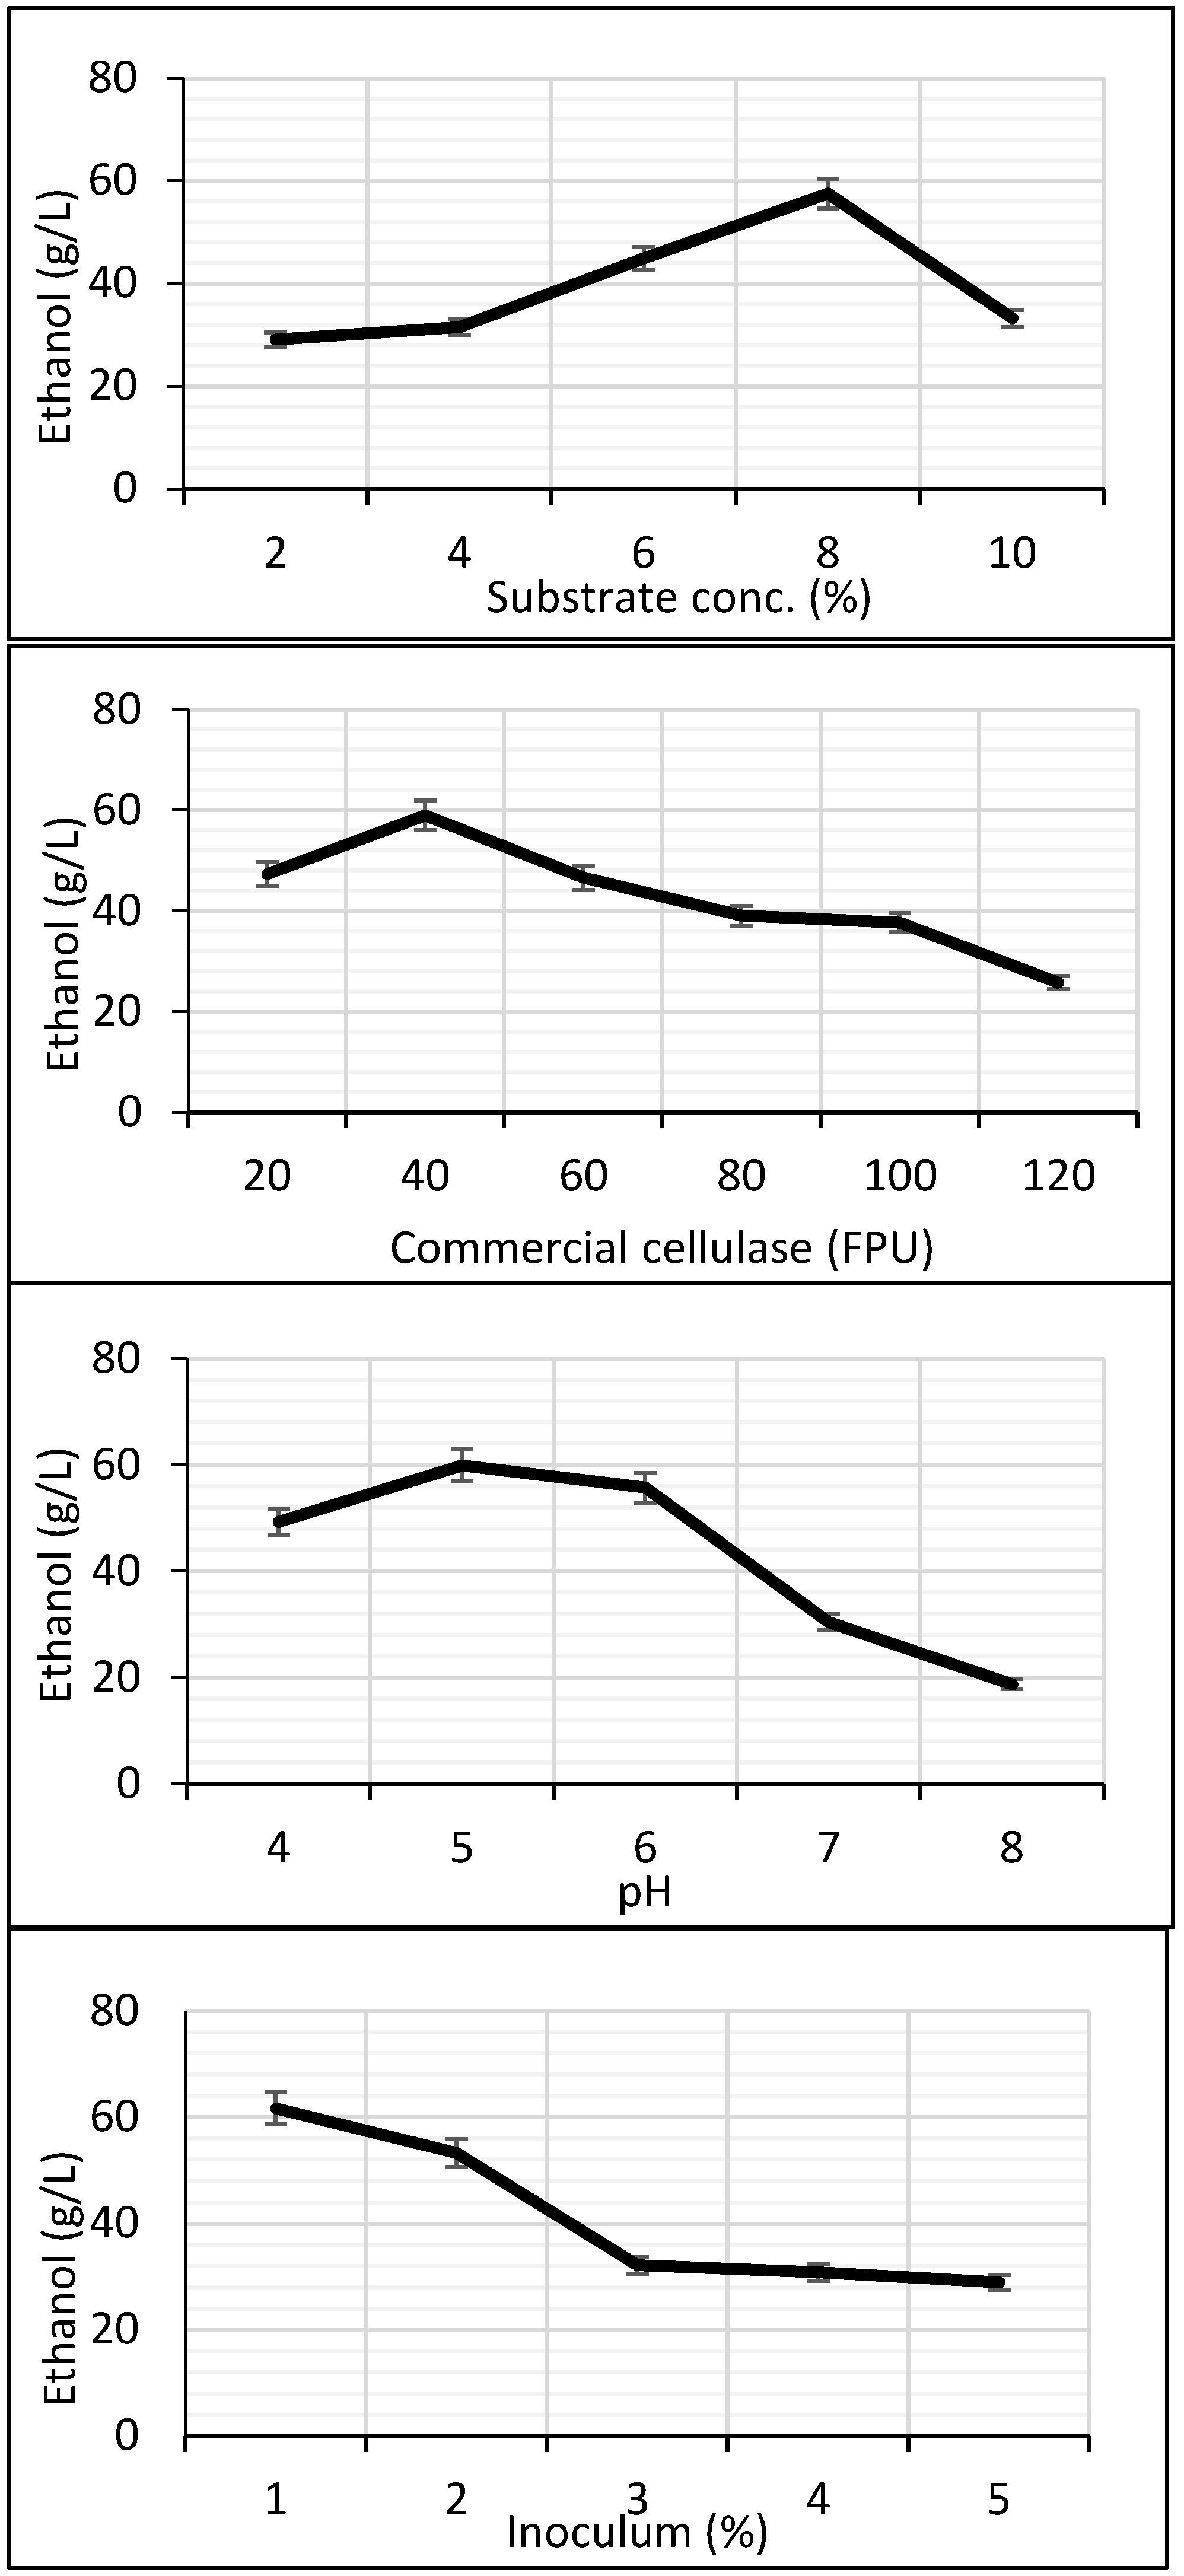
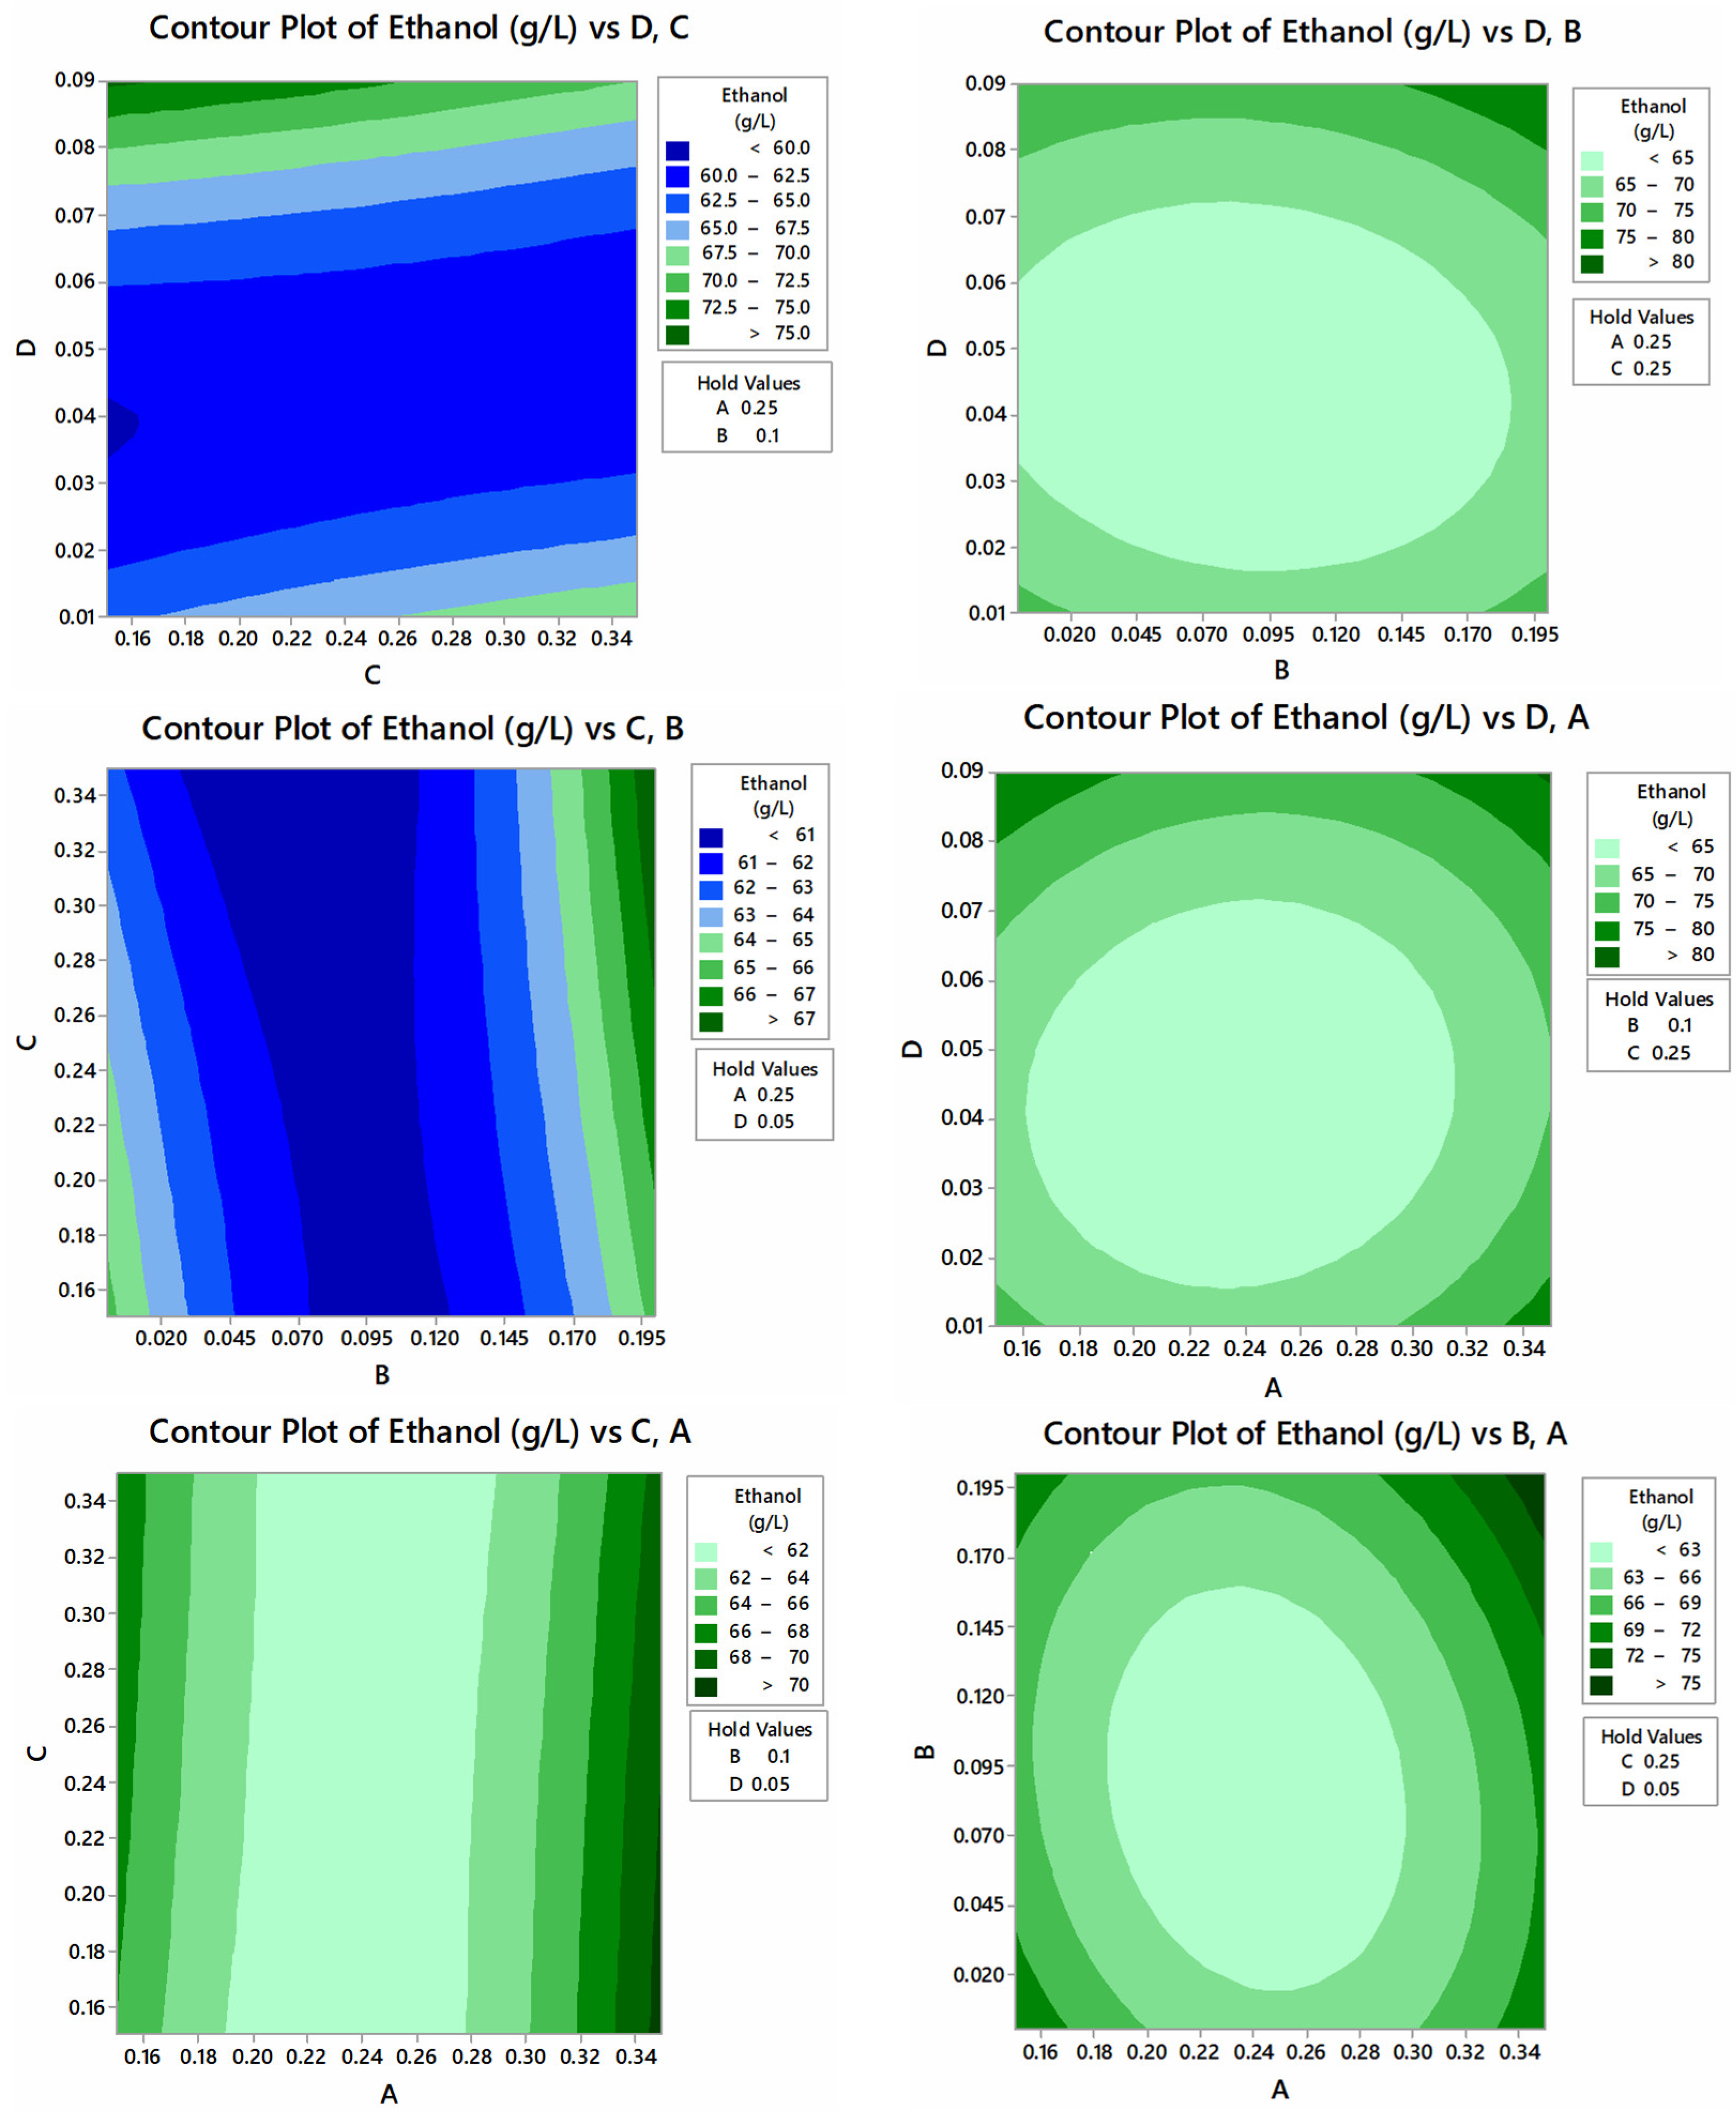
3.8. Optimization of Physical and Nutritional Parameters for Ethanol Production in SSF

KOH-steam-pretreated seedpods offered maximum ethanol production in SSF when hydrolyzed with commercial cellulase. Physical parameters of SSF for this substrate were further optimized by OFAT for improved yield of ethanol. HPLC was used to check ethanol production. The ethanol titer increased gradually with an increase in the concentration of the substrate. Maximum yield (57.53 g/L) was observed with 8% substrate. A further increase in the substrate caused a sudden drop in activity (Figure 10). Error bars in the graphs indicate variation among triplicates.
For cellulase optimization, the best ethanol titer of 59.07 g/L was attained when 40 FPU of commercial cellulase was used in SSF. A gradual decline in ethanol production was recorded with an increase in the FPU of enzymes until 120 (Figure 10). Maximum ethanol (59.96 g/L) in the case of pH optimization was observed at pH 5; a decline in activity was seen as the pH increased towards neutrality. A sharp decline in ethanol production was observed at pH 7 and 8 (Figure 10). Optimization of the inoculum size of S. cerevisiae resulted in the maximum ethanol yield of 61.74 g/L at 1% inoculum. Ethanol production decreased from inoculum size 2% to 3% and then it remained almost constant from 3% to 4% and 5% as inoculum size increased as shown in Figure 10.
To obtain the maximum ethanol titer, four nutritional parameters (yeast extract, K2HPO4, (NH4)2SO4, and MgSO4) were optimized by CCD. The optimum medium composition for maximum ethanol production (72.0 g/L) was 0.25 g/L yeast extract, 0.1 g/L K2HPO4, 0.25 g/L (NH4)2SO4, and 0.09 g/L MgSO4 (Table 2). ANOVA was performed, which depicts the F-value 26.26 and p-value 0.00 (Table 3). The regression equation indicates the significance of the results (Equation 2). Contour plots for interactions of yeast extract, K2HPO4, (NH4)2SO4, and MgSO4 for ethanol production are displayed in Figure 11. Tan and Lee [40] reported a higher bioethanol yield in SSF (90.9%) than in SHF (55.9%). They suggested that the SSF of seaweed biomass using S. cerevisiae had various merits over SHF, as the former technique is a simple single-step process that can save energy, time, and cost while attaining a high production of bioethanol. A study obtained the maximum ethanol titer of 85.71% at 30 °C with 2% wheat straw and 30 FPU of enzyme loading in SSF [41]. The results of a study on the production of bioethanol from rice husk also supports our findings that SSF was better than SHF in yielding ethanol titer [42]. Berłowska and coworkers [43] employed S. cerevisiae in SSF and achieved the highest ethanol concentration reaching 26.9 ± 1.2 g/L and 86.5 ± 2.1% fermentation efficiency relative to the theoretical yield. Ballesteros et al. [44] reported maximum production of ethanol at 72 h of fermentation period. They also described that the reason for a good yield of enzymes in SSF may be due to the immediate conversion of formed sugars into ethanol, thus avoiding any feedback inhibition. Wang et al. [45] obtained 5.16 g/L of ethanol using commercial cellulase after 24 h in SSF from biologically delignified poplar chips and the yield was 75%. Kusmiyati and coworkers [29] reported 2.648% bioethanol production from HNO3-pretreated palm tree trunk waste through SSF using S. cerevisiae and cellulase enzymes at 37 °C temperature, 4.8 pH, 10% substrate, and 100 rpm for 120 h.
Ethanol (g/L) = 109.6 − 346.9A − 171.2B + 48.5C − 292D + 768.0A*A + 464.0B*B − 15.0C*C + 5853D*D + 172.5A*B − 87.5A*C − 334A*D + 137.0B*C + 298B*D − 675C*D

3.9. Fermentation Kinetics

The results presented in Table 4 and Table 5 show that ethanol yield was increased and the substrate (glucose) concentration decreased with the increase in fermentation time. It was observed that the specific growth rate also increased with the passage of fermentation time. However, after 96 h of fermentation, a noticeable decline in specific growth rate was observed. Maximum ethanol yield (0.451) per substrate utilization was observed after 96 h of simultaneous saccharification and fermentation using commercial cellulase, while using indigenous cellulase the maximum ethanol yield (0.434) was also observed at 96 h of fermentation in SSF (Table 4). Maximum ethanol yields of 0.443 and 0.413 were observed after 96 h in SHF using commercial and indigenous enzymes, respectively (Table 5).
Our findings are in accordance with a study by Irfan et al. [9], which reported that production of ethanol increased with an increase in fermentation time, whereas glucose concentration declined with time. Specific growth rate also improved with the passage of fermentation time. Maximum ethanol titer (0.497) per substrate consumption was recorded after 96 h of fermentation. Sathendra et al. [46] achieved a maximum biomass and ethanol yield at pH 4.5 and 40 °C with biomass yield (Yx/s) 14.7 g/L−1, specific growth rate (μ) 0.021 h, and bioethanol yield (Yp/s) 21.89 g/L−1. Hadiyanto et al. [47] found a maximum specific growth rate of 0.186 h−1, Yx/s 0.32 g g−1, and Yp/s 0.21 g g−1 at 30 °C.

4. Conclusions

Alkali-pretreated substrate B. ceiba (64% cellulose) was explored in the present research for the production of bioethanol. A set of optimum parameters offered the highest ethanol yield of 72.0 g/L using commercial cellulase and S. cerevisiae during SSF. The findings of the research highly recommend this cheap and novel biomass as a promising feedstock for pilot-scale production of second-generation bioethanol.

Author Contributions

M.G. performed experiments and wrote the first draft; M.I. conceived the study design and critically edited the manuscript; M.N. helped in the analysis; H.A.S. and M.K. helped in the analysis and critical revision; I.A. and L.C. acquired funding; S.S. helped with data interpretation; Y.C. helped with the literature survey. All authors have read and agreed to the published version of the manuscript.

Funding

This work was supported by the Scientific Research Deanship at King Khalid University, Abha, Saudi Arabia, with financial support through the Large Research Group Project under grant number RGP.02/205/42, the National Key R & D Program of China (2019YFD1001002), and the China Agriculture Research system of MOF and MARA (CARS-23).

Institutional Review Board Statement

Not applicable.

Informed Consent Statement

Not applicable.

Data Availability Statement

Data is available within the article.

Acknowledgments

The authors are also grateful to the Department of Biotechnology, University of Sargodha, Pakistan, for technical help with this study.

Conflicts of Interest

The authors declare no conflict of interest.

References

  1. Ghazanfar, M.; Irfan, M.; Nadeem, M. Statistical modeling and optimization of pretreatment of Bombax ceiba with KOH through Box– Behnken design of response surface methodology. Energy Sour. Part A Recov. Utiliz. Environ. Eff. 2018, 40, 1114–1124. [Google Scholar] [CrossRef]
  2. Mejica, G.F.C.; Unpaprom, Y.; Whangchai, K.; Ramaraj, R. Cellulosic-derived bioethanol from Limnocharis flava utilizing alkaline pretreatment. Biomass Conver. Biorefin. 2021, 1–7. [Google Scholar] [CrossRef]
  3. Wannapokin, A.; Ramaraj, R.; Unpaprom, Y. An investigation of biogas production potential from fallen teak leaves (Tectona grandis). Emergent Life Sci. Res. 2017, 3, 1–10. [Google Scholar]
  4. Sophanodorn, K.; Unpaprom, Y.; Whangchai, K.; Duangsuphasin, A.; Manmai, N.; Ramaraj, R. A biorefinery approach for the production of bioethanol from alkaline-pretreated, enzymatically hydrolyzed Nicotiana tabacum stalks as feedstock for the bio-based industry. Biomass Conver. Biorefin. 2020, 12, 1–9. [Google Scholar] [CrossRef]
  5. Desvaux, M. Clostridium cellulolyticum: Model organism of mesophilic cellulolytic Clostridia. FEMS Microbial. Rev. 2005, 29, 741–764. [Google Scholar] [CrossRef] [Green Version]
  6. Bajpai, P. Structure of lignocellulosic biomass. In Pretreatment of Lignocellulosic Biomass for Biofuel Production; Springer: Singapore, 2016; pp. 7–12. [Google Scholar]
  7. Rajendran, K.; Drielak, E.; Varma, V.S.; Muthusamy, S.; Kumar, G. Updates on the pretreatment of lignocellulosic feedstocks for bioenergy production–A review. Biomass Conver. Bioref. 2018, 8, 471–483. [Google Scholar] [CrossRef]
  8. Maceiras, R.; Alfonsín, V.; Seguí, L.; González, J.F. Microwave Assisted Alkaline Pretreatment of Algae Waste in the Production of Cellulosic Bioethanol. Energies 2021, 14, 5891. [Google Scholar] [CrossRef]
  9. Irfan, M.; Asghar, U.; Nadeem, M.; Nelofer, R.; Syed, Q.; Shakir, H.A.; Qazi, J.I. Statistical optimization of saccharification of alkali pretreated wheat straw for bioethanol production. Waste Biomass Valor. 2016, 7, 1389–1396. [Google Scholar] [CrossRef]
  10. Tsegaye, B.; Balomajumder, C.; Roy, P. Microbial delignification and hydrolysis of lignocellulosic biomass to enhance biofuel production: An overview and future prospect. Bull N Res. Cent. 2019, 43, 51. [Google Scholar] [CrossRef] [Green Version]
  11. Gupta, A.; Verma, J.P. Sustainable bio-ethanol production from agro-residues: A review. Renew. Sustain. Energy Rev. 2015, 41, 550–567. [Google Scholar] [CrossRef]
  12. Kamzon, M.A.; Abderafi, S.; Bounahmidi, T. Promising bioethanol processes for developing a biorefinery in the Moroccan sugar industry. Internat. J. Hydro. Energy 2016, 41, 20880–20896. [Google Scholar] [CrossRef]
  13. Stenberg, K.; Galbe, M.; Zacchi, G. The influence of lactic acid formation on the simultaneous saccharification and fermentation (SSF) of softwood to ethanol. Enz. Microb. Technol. 2000, 26, 71–79. [Google Scholar] [CrossRef]
  14. Sun, Y.; Cheng, J. Hydrolysis of lignocellulosic materials for ethanol production: A review. Biores. Technol. 2002, 83, 1–11. [Google Scholar] [CrossRef]
  15. Chen, H.; Fu, X. Industrial technologies for bioethanol production from lignocellulosic biomass. Renew. Sustain. Energy Rev. 2016, 57, 468–478. [Google Scholar] [CrossRef]
  16. Hakim, A.; Chasanah, E.; Uju, U.; Santoso, J. Bioethanol production from seaweed processing waste by simultaneous saccharification and fermentation (SSF). Squ. Bull. Mar. Fish. Postharv. Biotechnol. 2017, 12, 41–47. [Google Scholar] [CrossRef] [Green Version]
  17. Tong, Z.; Pullammanappallil, P.; Teixeira, A.A. How ethanol is made from cellulosic biomass constituents of cellulosic biomass. Agricul. Biol. Engin. 2012, 2012, 12. [Google Scholar]
  18. Segal, L.G.J.M.A.; Creely, J.J.; Martin Jr, A.E.; Conrad, C.M. An empirical method for estimating the degree of crystallinity of native cellulose using the X-ray diffractometer. Textile Res. J. 1959, 29, 786–794. [Google Scholar] [CrossRef]
  19. Tabassum, F.; Irfan, M.; Shakir, H.A.; Qazi, J.I. Statistical optimization for deconstruction of poplar substrate by dilute sulfuric acid for bioethanol production. Green Chem. Lett. Rev. 2017, 10, 69–79. [Google Scholar] [CrossRef] [Green Version]
  20. Iram, M.; Asghar, U.; Irfan, M.; Huma, Z.; Jamil, S.; Nadeem, M.; Syed, Q. Production of bioethanol from sugarcane bagasse using yeast strains: A kinetic study. Energy Sour. Part A Recov. Util. Environ. Eff. 2018, 40, 364–372. [Google Scholar] [CrossRef]
  21. Gul, A.; Irfan, M.; Nadeem, M.; Syed, Q.; Haq, I.U. Kallar grass (Leptochloa fusca L. Kunth) as a feedstock for ethanol fermentation with the aid of response surface methodology. Environ. Prog. Sustain. Energy 2018, 37, 569–576. [Google Scholar]
  22. Sharma, N.; Kalra, K.L.; Oberoi, H.S.; Bansal, S. Optimization of fermentation parameters for production of ethanol from kinnow waste and banana peels by simultaneous saccharification and fermentation. Indian J. Microbiol. 2007, 47, 310–316. [Google Scholar] [CrossRef] [PubMed] [Green Version]
  23. Thontowi, A.; Perwitasari, U.; Kholida, L.N.; Prasetya, B. Optimization of simultaneous saccharification and fermentation in bioethanol production from sugarcane bagasse hydrolyse by Saccharomyces cerevisiae BTCC 3 using response surface methodology. IOP Conf. Ser. Earth Environ. Sci. 2018, 183, 012010. [Google Scholar] [CrossRef] [Green Version]
  24. Pirt, S.J. Principles of Microbe and Cell Cultivation; Blackwell Scientific Publications: Hoboken, NJ, USA, 1975. [Google Scholar]
  25. Okpokwasili, G.C.; Nweke, C.O. Microbial growth and substrate utilization kinetics. Afr. J. Biotechnol. 2006, 5, 305–317. [Google Scholar]
  26. Ravindran, R.; Jaiswal, A.K. A comprehensive review on pre-treatment strategy for lignocellulosic food industry waste: Challenges and opportunities. Biores. Technol. 2016, 199, 92–102. [Google Scholar] [CrossRef] [Green Version]
  27. Gao, C.; Xiao, W.; Ji, G.; Zhang, Y.; Cao, Y.; Han, L. Regularity and mechanism of wheat straw properties change in ball milling process at cellular scale. Biores. Technol. 2017, 241, 214–219. [Google Scholar] [CrossRef]
  28. Jabasingh, S.A.; Nachiyar, C.V. Utilization of pretreated bagasse for the sustainable bioproduction of cellulase by Aspergillus nidulans MTCC344 using response surface methodology. Indust. Crops Prod. 2011, 34, 1564–1571. [Google Scholar] [CrossRef]
  29. Kusmiyati, K.; Anarki, S.T.; Nugroho, S.W.; Widiastutik, R.; Hadiyanto, H. Effect of dilute acid and alkaline pretreatments on enzymatic saccharfication of palm tree trunk waste for bioethanol production. Bull. Chem. Reac. Engin. Catal. 2019, 14, 705–714. [Google Scholar] [CrossRef]
  30. Gunam, I.B.W.; Setiyo, I.Y.; Antara, I.N.S.; Wijaya, I.M.M.; ST, I.; Wijaya, M.M.; Arnata, I.W.; Arnata, I.W. Enhanced delignification of corn straw with alkaline pretreatment at mild temperature. Rasayan J. Chem. 2020, 13, 1022–1029. [Google Scholar] [CrossRef]
  31. Mishra, R.K.; Mohanty, K. Pyrolysis kinetics and thermal behavior of waste sawdust biomass using thermogravimetric analysis. Biores. Technol. 2018, 251, 63–74. [Google Scholar] [CrossRef]
  32. Barman, D.N.; Haque, M.A.; Kang, T.H.; Kim, M.K.; Kim, J.; Kim, H.; Yun, H.D. Alkali pretreatment of wheat straw (Triticum aestivum) at boiling temperature for producing a bioethanol precursor. Biosci, Biotechnol. Biochem. 2012, 76, 120480–120486. [Google Scholar] [CrossRef] [Green Version]
  33. Gundupalli, M.P.; Kajiura, H.; Ishimizu, T.; Bhattacharyya, D. Alkaline hydrolysis of coconut pith: Process optimization, enzymatic saccharification, and nitrobenzene oxidation of Kraft lignin. Biomass Conver. Bioref. 2020, 1–19. [Google Scholar] [CrossRef]
  34. Sindhu, R.; Kuttiraja, M.; Binod, P.; Sukumaran, R.K.; Pandey, A. Bioethanol production from dilute acid pretreated Indian bamboo variety (Dendrocalamus sp.) by separate hydrolysis and fermentation. Indus. Crops Prod. 2014, 52, 169–176. [Google Scholar] [CrossRef]
  35. Asghar, U.; Irfan, M.; Iram, M.; Huma, Z.; Nelofer, R.; Nadeem, M.; Syed, Q. Effect of alkaline pretreatment on delignification of wheat straw. Nat. Prod. Res. 2015, 29, 125–131. [Google Scholar] [CrossRef] [PubMed]
  36. Irfan, M.; Gulsher, M.; Abbas, S.; Syed, Q.; Nadeem, M.; Baig, S. Effect of various pretreatment conditions on enzymatic saccharification. Songklan. J. Sci. Technol. 2011, 33, 397–404. [Google Scholar]
  37. Sukhang, S.; Choojit, S.; Reungpeerakul, T.; Sangwichien, C. Bioethanol production from oil palm empty fruit bunch with SSF and SHF processes using Kluyveromyces marxianus yeast. Cellulose 2020, 27, 301–314. [Google Scholar] [CrossRef]
  38. Vintila, T.; Vintila, D.; Neo, S.; Tulcan, C.; Hadaruga, N. Simultaneous hydrolysis and fermentation of lignocellulose versus separated hydrolysis and fermentation for ethanol production. Rom. Biotechnol. Lett. 2011, 16, 106–112. [Google Scholar]
  39. Triwahyuni, E. Valorization of oil palm empty fruit bunch for bioethanol production through separate hydrolysis and fermentation (SHF) using immobilized cellulolytic enzymes. IOP Conf. Ser. Earth Environ. Sci. 2020, 439, 12–18. [Google Scholar] [CrossRef]
  40. Tan, I.S.; Lee, K.T. Enzymatic hydrolysis and fermentation of seaweed solid wastes for bioethanol production: An optimization study. Energy 2014, 78, 53–62. [Google Scholar] [CrossRef]
  41. Ruiz, H.A.; Silva, D.P.; Ruzene, D.S.; Lima, L.F.; Vicente, A.A.; Teixeira, J.A. Bioethanol production from hydrothermal pretreated wheat straw by a flocculating Saccharomyces cerevisiae strain–Effect of process conditions. Fuel 2012, 95, 528–536. [Google Scholar] [CrossRef] [Green Version]
  42. Pabón, A.M.; Felissia, F.E.; Mendieta, C.M.; Chamorro, E.R.; Area, M.C. Improvement of bioethanol production from rice husks. Cellulose Chem. Technol. 2020, 54, 689–698. [Google Scholar]
  43. Berłowska, J.; Kręgiel, D.; Klimek, L.; Orzeszyna, B.; Ambroziak, W. Novel yeast cell dehydrogenase activity assay in situ. Pol. J. Microbiol. 2006, 300, 127–131. [Google Scholar]
  44. Ballesteros, I.; Negro, M.; Dominguez, J.; Cabañas, A.; Manzanares, P.; Ballesteros, M. Ethanol production from steam-explosion pretreated wheat straw. Appl. Biochem. Biotechnol. 2006, 129–132, 496–508. [Google Scholar] [CrossRef]
  45. Wang, K.; Yang, H.; Wang, W.; Sun, R.C. Structural evaluation and bioethanol production by simultaneous saccharification and fermentation with biodegraded triploid poplar. Biotechnol. Biofuels 2013, 6, 42–50. [Google Scholar] [CrossRef] [PubMed] [Green Version]
  46. Sathendra, E.R.; Baskar, G.; Praveenkumar, R. Production of bioethanol from lignocellulosic banana peduncle waste using Kluveromyces marxianus. J. Environ. Biol. 2019, 40, 769–774. [Google Scholar] [CrossRef]
  47. Hadiyanto, H.; Ariyanti, D.; Aini, A.; Pinundi, D. Optimization of ethanol production from whey through fed-batch fermentation using Kluyveromyces marxianus. Energy Proc. 2014, 47, 108–112. [Google Scholar] [CrossRef] [Green Version]
Figure 1. SEM images of B. ceiba biomass. (a) KOH-treated biomass, (b) KOH-steam-treated biomass, (c) untreated biomass.
Fermentation 08 00148 g001
Figure 2. FTIR spectroscopy images of (a) untreated, (b) KOH-pretreated, and (c) KOH-steam-pretreated B. ceiba.
Fermentation 08 00148 g002
Figure 3. TGA of B. ceiba: (a) untreated, (b) KOH-treated, (c) KOH-steam-treated.
Fermentation 08 00148 g003aFermentation 08 00148 g003b
Figure 4. XRD analysis of B. ceiba substrate pretreated with KOH and KOH followed by steam.
Fermentation 08 00148 g004
Figure 5. Optimization of time (h) for saccharification.
Fermentation 08 00148 g005
Figure 6. Optimization of substrate concentration (%) for saccharification.
Fermentation 08 00148 g006
Figure 7. Optimization of enzyme concentration (IU/mL) for saccharification.
Fermentation 08 00148 g007
Figure 8. Separate hydrolysis and fermentation. (a) Saccharification after 24 h, (b) ethanol produced after 96 h.
Fermentation 08 00148 g008
Figure 9. Saccharification (%) and ethanol production (g/L) in SSF (KOH T = KOH-treated substrate, KOH ST = KOH-steam-treated substrate).
Fermentation 08 00148 g009
Figure 10. Optimization of physical parameters for ethanol production in SSF after 96 h.
Fermentation 08 00148 g010
Figure 11. Contour plots of interactions of yeast extract, K2HPO4, (NH4)2SO4, and MgSO4 for ethanol production.
Fermentation 08 00148 g011
Table 1. Range of parameters used for central composite design.
Sr. No.Parameters (g/L)LabelCodes
+1−1
1Yeast extractA0.20.3
2K2HPO4B0.050.15
3(NH4)2SO4C0.20.3
4MgSO4D0.030.07
Table 2. CCD for optimizing nutritional parameters (g/L) for production of ethanol in SSF.
Run No.ABCDEthanol (g/L)
ObservedPredictedResidual
10.250.10.250.0561.0160.750.252
20.30.050.20.0768.7267.870.845
30.2500.250.0563.5864.01−0.432
40.350.10.250.0569.6670.01−0.357
50.250.10.250.0560.7160.75−0.047
60.20.050.30.0364.1864.140.037
70.250.10.250.056060.75−0.757
80.250.10.250.056060.75−0.757
90.30.050.30.0765.4865.310.165
100.250.10.250.097272.95−0.959
110.250.10.250.056060.75−0.757
120.20.150.20.0362.3362.37−0.04
130.30.150.20.0367.1765.911.251
140.20.150.20.076867.820.18
150.20.150.30.036564.750.245
160.30.150.30.0367.0167.42−0.417
170.250.10.250.0561.2360.750.472
180.20.050.30.0765.5465.7−0.161
190.250.10.250.0562.3560.751.592
200.250.10.250.0167.0367.28−0.255
210.250.10.350.056060.51−0.519
220.30.050.20.0363.8264.95−1.13
230.30.050.30.036665.090.91
240.30.150.20.0770.1270.030.087
250.30.150.30.0769.0668.840.218
260.250.20.250.056666.78−0.782
270.20.050.20.036463.120.871
280.20.050.20.0767.9367.380.542
290.250.10.150.056060.69−0.695
300.150.10.250.056666.85−0.857
310.20.150.30.0768.7667.51.255
A = yeast extract, B = K2HPO4, C = (NH4)2SO4, D = MgSO4.
Table 3. Analysis of variance for ethanol production by S. cerevisiae.
SourceDFAdj SSAdj MSF-Valuep-Value
Model14352.61825.18726.260.000
Linear474.81518.70419.500.000
A114.97814.97815.620.001
B111.50911.50912.000.003
C10.0470.0470.050.828
D148.28048.28050.340.000
Square4261.69765.42468.210.000
A×A1105.425105.425109.920.000
B×B138.48438.48440.120.000
C×C10.0400.0400.040.841
D×D1156.758156.758163.440.000
2-Way Interaction616.1062.6842.800.047
A×B12.9762.9763.100.097
A×C10.7660.7660.800.385
A×D11.7821.7821.860.192
B×C11.8771.8771.960.181
B×D11.4161.4161.480.242
C×D17.2907.2907.600.014
Error1615.3460.959
Lack-of-Fit1010.7991.0801.430.345
Pure Error64.5470.758
Total30367.964
A = yeast extract, B = K2HPO4, C = (NH4)2SO4, D = MgSO4.
Table 4. Kinetic parameter estimation for ethanol fermentation in simultaneous saccharification and fermentation (SSF).
Fermentation Time (h)Kinetic Parameters
µYx/sqsYp/sYp/xqp
KOH + Steam (commercial cellulase)240.00790.1780.0310.4030.2790.014
480.01310.1990.1520.4243.410.071
720.01770.2070.1230.4364.220.063
960.01860.2190.1170.4515.370.059
1200.01000.1190.1280.4316.860.061
KOH + Steam (indigenous cellulase)240.00670.1730.0240.3970.2720.012
480.00990.1910.1410.4023.010.062
720.01110.1980.1120.4183.930.053
960.01200.2060.1070.4344.710.052
1200.00640.2010.1190.4175.780.053
µ (h − 1), specific growth rate; Yx/s, g of cell biomass/g of glucose consumed; qs, g of glucose consumed/g of cell biomass per h; Yp/x, ethanol produced/g of cells formed; Yp/s, ethanol produced/g of glucose consumed; qp, ethanol produced/g of cells per h.
Table 5. Kinetic parameter estimation for ethanol fermentation in separate hydrolysis and fermentation (SHF).
Fermentation Time (h)Kinetic Parameters
µYx/sqsYp/sYp/xqp
KOH + Steam (commercial cellulase)240.00750.1730.0250.3950.2610.009
480.01120.1940.1470.4173.210.054
720.01600.2030.1150.4344.010.049
960.01820.2190.1090.4434.920.045
1200.0960.1180.1230.4155.760.050
KOH + Steam (indigenous cellulase)240.00650.1690.0210.3870.2680.010
480.00970.1870.1390.3962.980.058
720.01080.1930.1080.4063.910.049
960.01150.2090.1050.4134.650.054
1200.00610.1950.1170.3895.810.051
Publisher’s Note: MDPI stays neutral with regard to jurisdictional claims in published maps and institutional affiliations.

