Article

Staphylococcal Protein A with Engineered Cysteine: Comparison of Monomeric Content as a Critical Quality Attribute during Intracellular and Extracellular Expression

1
Bioprocess and Bioproduct Development Laboratory, University School of Biotechnology, Guru Gobind Singh Indraprastha University, Sector 16C, Dwarka, New Delhi 110078, India
2
Serum Institute of India Private Limited, Pune 411028, India
3
School of Biotechnology, Jawaharlal Nehru University, New Delhi 110067, India
*
Author to whom correspondence should be addressed.
Fermentation 2022, 8(4), 150; https://doi.org/10.3390/fermentation8040150
Submission received: 8 March 2022 / Revised: 24 March 2022 / Accepted: 25 March 2022 / Published: 28 March 2022
(This article belongs to the Section Microbial Metabolism, Physiology & Genetics)

Abstract

:
Background: The introduction of engineered cysteine in staphylococcal protein A (SPA-cys) for site-specific conjugation results in a substantial amount of dimerized SPA due to spontaneous oxidation during its production, leading to inaccessibility and thus rendering it unusable. Monomers are usually recovered from dimers by using reducing agents before conjugation in subsequent steps. However, this leads to low conjugation efficiency and increases overall cost and production time. This study aims to systematically compare and quantify the monomeric and dimeric content of SPA when produced through intracellular and extracellular routes in E. coli. Methods: Purified SPAs with and without cysteine from both intracellular and extracellular processes are compared for their monomeric content and efficiency to conjugate on solid support matrix with and without an additional pre-step of reduction. Results: The monomeric form of SPA-cys, which is a desired key quality attribute, is less than 50% when produced extracellularly. SPA-cys produced through the intracellular production process has high monomeric content (≥85%) and shows higher binding to solid support. Conclusion: The study demonstrates that the intracellular route for production of SPA-cys should be the preferred method, and the release assays for SPA-cys products should include the amount of monomeric content as one of the quality attributes. The abundance of monomeric content enhances the site-specific conjugation efficiency and density of SPA on the resin matrix.

1. Introduction

Escherichia coli is the microbial host of choice for heterologous recombinant protein production because of its high specific growth rate and high specific protein yield [1,2]. However, it is unable to secrete recombinant protein easily into its extracellular medium in spite of the addition of the leader signal sequence. Whenever the requirement for recombinant protein is in the magnitude of kilograms, the extracellular secretion of recombinant protein is advantageous over intracellular or periplasmic localization in E. coli in terms of economics as well as process simplicity [3,4]. Many recombinant proteins are sequestered into soluble form through extracellular expression, and staphylococcal protein A (SPA) is one of them. SPA is being produced in huge volumes to cater to the needs of protein A resin manufacturers and diagnostic industries.
Staphylococcal protein-A (SPA) is a highly stable cell surface receptor protein of Staphylococcus aureus [5,6]. The unique property of SPA to bind specifically to the Fc region of immunoglobulin G (IgG) [7,8] has been extensively used in industrial processes such as downstream processing of various monoclonal antibodies [9,10], immunoassays, immuno-histochemistry, and as an antibody binding agent during antibody immobilisation [11,12]. SPA is covalently attached as a ligand to a functionally active solid support (matrix) for immunoglobulin purification [13]. The success of SPA conjugations to matrix depends on the following two factors: (i) nature of covalent bonds between SPA (ligand) and matrix and (ii) accessibility of functional groups on solid support and ligand. Inaccessibility of these functional groups on support for binding leads to either low yields or no reaction. Linkers are used to extend the arms of these functional groups to improve accessibility [14]. SPA is quite often conjugated on the matrix through its free amine groups present on multiple available lysine residues. Lysine residue in SPA forms a random amide bond at multiple points between the protein molecule and functionalised solid support and may result in conjugation with undesired orientation. Such improper orientation affects the availability of the binding site for immunoglobulins due to steric hindrance [15], thereby leading to loss of SPA functionality. A potential way to overcome this constraint could be to utilise site-specific conjugation techniques, which may yield a uniform orientation of immobilised protein molecules where the active site is freely available for further applications. This can be performed by the insertion of a single additional cysteine (-SH group) by recombinant DNA technology (RDT), since SPA does not have any cysteine in its sequence [16].
During the production process of SPA with engineered cysteine (SPA-Cys), dimers are formed due to spontaneous oxidation, which leads to the inaccessibility of free sulfhydryl of SPA-cys, thus impacting the efficiency of effective conjugation of SPA due to the decrease in availability of free thiols [17]. Thus, rendering it unusable for the conjugation step. The quantity of dimers produced is expected to be higher during extracellular production since SPA-cys has to cross the oxidative periplasmic space. An additional step is routinely followed for reversion to sulfhydryl group from disulfides using reducing agents such as dithiothreitol (DTT), Beta-mercaptoethanol, or tris(2-carboxyethyl) phosphine (TCEP) [18]. The residual reducing agents from reversion steps could interfere in subsequent coupling reactions.
A number of functionally activated solid supports exploiting different chemistries are used to conjugate the sulfhydryl of SPA with solid support. The chemistry includes thiols, maleimides, and epoxides [19,20,21,22]. The conjugation of SPA using thiol and maleimides has already been reported with certain disadvantages, including reversible reduction and low ligand density due to low reaction rate [14,16,22]. Both maleimides and epoxide have hetero-functionality to form multiple point bonds using -SH, -NH2, and -OH groups. However, the reaction using -OH group only happens at a higher pH (pH > 10).
There are no reports so far that detail the quantification and comparison of the monomeric and dimeric content of proteins produced through intracellular and extracellular approaches due to the lack of any model protein which can be produced both intracellularly and extracellularly with a high specific yield. SPA and the addition of a single cysteine to SPA together form a useful protein model to compare the monomeric and dimeric content when produced in E. coli through intracellular and extracellular approaches. This work attempts to study and compare processes for the production of native SPA with C-terminus cysteine through intracellular and extracellular routes. Conventionally, extracellular is advantageous over intracellular expression as the product will have more purity and the process will be more economical because of lower pyrogen levels and minimum purification steps. Engineering cysteine at the C-terminus in SPA has resulted in a high degree of intermolecular dimerization when produced through an extracellular route [23]. Our data indicates that intermolecular dimerization of cysteine is substantially reduced by expressing it through an intracellular route (15%) as compared to an extracellular route (52%). Intracellular expression is optimized, resulting in a specific yield of 150 mg/g dry cell weight for SPA-cys. For comparative analysis, SPA-cys produced through two different processes are conjugated over solid support through functionalised epoxide. Intracellularly produced SPA-cys protein shows a higher coupling efficiency compared to extracellularly produced SPA-cys.

2. Materials and Methods

2.1. Strains, Plasmids, Chemicals, Mediums, and Filters

E. coli strain DH5α was used for cloning, and BL21(DE3) strain was used for expression. pET-28b and pET-22b plasmids were used for intracellular and extracellular expression of recombinant SPA, respectively. Details of hosts and plasmids are provided in Table 1. Agarose ITM (cat No.: 0710), acrylamide (cat No.: 0341), bis-acrylamide (cat No.: 0172), sodium dodecyl sulphate (SDS) (cat No.: 0227), ammonium per sulphate (APS) (cat No.: 0486), Isopropyl β-D-1-thiogalactopyranoside (IPTG) (cat No.: 0487), and TEMED (cat No.: 0761) were purchased from Ameresco, Framingham, MA, USA. GeneJET plasmid miniprep kit (cat No.: K0502) and GeneJET gel extraction kit (cat No.: K0691) was purchased from Thermo Fisher Scientific, Lithuania, Europe. Luria Bertani (LB) medium (cat No.: M1245), kanamycin (cat No.: MB105) and ampicillin (cat No.: CMS645) was purchased from HiMedia, Mumbai, India. Sodium hydroxide (cat No.: 68451), ethylene diamine tetra-acetic acid (EDTA) (cat No.: 054960) from SRL, Gurugram, India. All other chemicals, buffer salts were procured from Merck-Millipore, Darmstadt, Germany. Amicon® ULTRAcel® 10K (cat No.: UFC901096) centrifugal filters from Merk-Millipore, Cork, Ireland. Restriction enzymes, ligase, and polymerase enzymes from Fermentas, Vilnius, Lithuania. PierceTM BCA protein assay kit (cat No.: 23227), Ellman’s reagent (cat No.: 22582) and L- cysteine. HCl.H2O (cat No.: 44889) were from Thermo Fisher Scientific, Tokyo, Japan. ProfinityTM Epoxide resin (cat No.: 156-0200) was procured from Bio-Rad, Feldkirchen, Germany and Ethanolamine (cat No.: E9508) was procured from Sigma-Merck, St. Louis, MO, USA.

2.2. Construction of Plasmids and Recombinant Strains

Codon-optimised nucleotide sequence for four IgG binding domains of SPA for heterologous expression in E. coli was synthesised at Genscript, Piscataway, NJ, USA. Required restriction sites and codons for cysteine were incorporated using PCR through specific primers. pET-22b vector with pelB signal sequence was used for extracellular expression while pET-28b vector was used for intracellular expression. Primer sequences used in the study are provided in Table 2. The PCR amplification consisted of 30 cycles, where each cycle consisted of a denaturation step at 94 °C for 30 s, annealing at 62 °C for 30 s and elongation at 72 °C for 45 s. This was followed by a final extension step at 72 °C for 5 min. Amplified genes and vectors were digested with restriction enzymes and ligated suitably. The ligated products were transformed in E. coli DH5α cells for screening of positive clones. The positive clones were screened by colony PCR and were further transformed in BL21(DE3) strain for expression studies. The glycerol stocks were prepared and stored at −70 °C for further use.

2.3. Protein Expression Studies

Cultures from glycerol stock were inoculated in 10 mL LB medium supplemented with kanamycin (50 µg/mL)/ampicillin (100 µg/mL) and incubated overnight at 37 °C at 200 rpm in an incubator shaker. From the overnight grown culture, appropriate volume was used to inoculate 100 mL of fresh LB medium so as to obtain initial optical density at 600 nm (OD600 nm) of 0.05. Culture was incubated at 37 °C in a shaker incubator. Once the culture reached an OD600 nm of 0.6–0.8, it was induced with 0.5 mM IPTG. Culture was maintained at 37 °C and harvested 8 h post induction for intracellular expression and 24 h post induction for extracellular expression. For expression studies, in process samples were collected at 2 h intervals for intracellular and 6 h intervals for extracellular expression. The samples were analysed for growth at OD600 nm. Cultures were harvested by centrifugation at 6000× g for 10 min. Pellet and supernatant both were stored at −20 °C for characterisation. For expression analysis, appropriate amount of 5× gel loading dye was added to both pellet and supernatant, heated for 10 min at 100 °C, centrifuged and loaded on 12% SDS-PAGE gel. The experiments were carried out in triplicates. The gels were then stained with Coomassie brilliant blue, and the bands were quantified through densitometry.

2.4. Purification Process

For intracellular SPA purification, cell pellets were lysed in lysis buffer (10 mM Tris (pH 6.5), 50 mM NaCl, 250 mM Triton X-100, 2 mM lysozyme, and 5 mM Benzamidine HCL), and cell supernatant was collected for further purification of intracellular protein after centrifugation. While for extracellular SPA purification the media obtained from the culture after centrifugation was buffer exchanged with (10 mM Tris pH 6.5) and reduced to one-fifth of its original volume using 10 kDa cut-off filters. To prevent the spontaneous oxidation of sulfhydryl groups, degassed buffers were used during downstream processing. Both extracellular and intracellular SPA were captured on a Q-Sepharose column. A linear NaCl salt gradient (in range of 10 mM to 500 mM) was used to elute the protein on Cytiva ÄKTA start. Individual peak fractions were collected and analysed on SDS-PAGE gel. Positive peaks of SPA were pooled, and buffer exchanged with phosphate buffer saline (PBS pH 7.2).

2.5. Qualitative and Quantitative Analysis of Purified Protein

2.5.1. Purity through SDS PAGE

For purity, SDS-PAGE was carried out using BIORAD Mini PROTEAN® Tetra Cell unit as per Laemmli-SDS-PAGE procedure [24,25]. ~10 µg of proteins were loaded in each well of SDS-PAGE for Coomassie staining. Samples were run in both reducing (2-mercaptoethanol) and non-reducing conditions. The gels were then stained with Coomassie brilliant blue, and the bands quantified through densitometry.

2.5.2. Protein Concentration through BCA

Protein concentration in final purified SPA was quantified through BCA kit by following manufacturer’s instructions. In brief, a standard curve with a concentration ranging from 125 µg/mL to 1000 µg/mL was prepared from supplied BSA stock (2 mg/mL) using PBS buffer as diluent. Samples were taken with proper dilution. 25 µL of standards and sample(s) from tubes were added to wells of 96 microwell plate in duplicate. 200 µL of BCA working reagent (1 part of protein sample and 8 parts of BCA working reagent) was added to each well. The samples were incubated for 30 min at 37 °C. The absorbance was measured at 562 nm in a plate reader.

2.6. Size-Exclusion High-Pressure Liquid Chromatography (SE-HPLC)

To quantify the monomer and dimer content of SPA in the intracellular and extracellular conditions, SE-HPLC was carried out in Agilent 1200 infinity (Santa Clara, CA, USA). 100 µg of SPA (1 mg/mL stock) was injected into the SEC column (YarraTM 3 µM SEC-2000, 300 × 7.8 mm) at ambient temperature. Phosphate buffer saline (PBS) pH 7.4 was used as mobile phase in HPLC. Dimer/monomer formation and protein purity were determined by retention time and peak area.

2.7. Free Cysteine Estimation

To quantify the free sulfhydryl group of the protein samples, Thermo Scientific Ellman’s reagent [26] was used. In brief a compound DTNB (5,5′-dithio-bis-2-nitrobenzoic acid) produces a measurable yellow-coloured product when it reacts with sulfhydryl. Ellman’s reagent is very specific for SH groups at neutral pH and has a very short reaction time, i.e., only 15 min. The absorbance was measured at a wavelength of 412 nm. Free sulfhydryl content was estimated through comparison to a standard curve of known concentrations of cysteine.

2.8. Ligand SPA Immobilization and Coupling Efficiency

Epoxide functionalised resin was used for site specific conjugation. Conjugation was carried out as per manufacturer’s instructions. Briefly, 1 g dry epoxide resin was taken, and 8 mL of distilled water was added to it. Upon addition of water the resin swelled to almost 8 mL. Coupling buffer (carbonate-bicarbonate buffer pH 8.5) was added in a ratio of 2:1 (buffer: resin) and incubated over night at 4 °C with continuous rotation at a slow pace. Unbound ligand was washed off with 2 column volumes of coupling buffer. Remaining active groups were blocked by incubating the resin in 1 M ethanolamine (pH 8.0–9.0) for 4 h. After blocking, the resin was washed sequentially with coupling buffer, acidic buffer (100 mM acetate, 500 mM NaCl pH 4.0) and basic buffers (100 mM phosphate, 500 mM NaCl pH 8.0). Coupled resin–ligand was stored at 2–8 °C for subsequent use. The protein content of unbound ligand in flowthrough after incubation and subsequent washes was determined by BCA. The bound fraction was calculated from the difference between the total ligand used for conjugation vs. unbound ligand. The coupling efficiency is calculated using nmol (bound ligand) per mL of the resin.

2.9. Evaluation of Binding Capacity

The epoxide resins were conjugated with SPA and SPA-cys ligands. Conjugated resins were equilibrated with binding/wash buffer (sodium phosphate pH 7.2). Known amount of purified IgG samples (~1000 µg) were mixed with 100 µL of conjugated resins, incubated for an hour and allowed to flow through the resin bed. Bound IgG was eluted with elution buffer (0.1–0.2 M glycine. HCl pH 2.5–3.0). Concentration of eluted IgG (bound) and flow-through fractions (unbound) was measured by BCA estimation kit (Thermo Fisher Scientfic, Waltham, MA, USA). The binding capacity of the conjugated SPA-resins was compared by presenting the bound IgGs per 100 µL of conjugated resin.

2.10. Circular Dichroism (CD) Spectroscopy

CD spectra were acquired using J-815 CD spectrophotometer (Jasco Corporation, Hachioji, Tokyo, Japan) equipped with a Peltier temperature controller using the sample in quartz cuvette of 1 mm pathlength (Starna, Ilford, Essex, UK). The optimal temperature was maintained at 25 °C. Samples were analysed at a final protein concentration at 0.1 mg/mL in 10 mM phosphate buffer pH 7.5. Scanning was performed between 250–190 nm with parameter values of scanning speed, band width, and data pitch being 50 nm/min, 1 nm, and 0.1 nm, respectively. Spectra were recorded and five scans for each measurement were averaged.

2.11. Fluorescence Spectroscopy

The fluorescence studies were performed on Varian, Carry Eclipse (Santa Clara, CA, USA) at room temperature. Appropriately diluted protein samples of 0.3 mg/mL in 10 mM phosphate buffer were taken. The fluorescence was monitored at emission wavelength of 280–400 nm using excitation wavelength of 270 nm. The excitation and emission slit widths were 5 nm each.

3. Results and Discussion

3.1. Expression Studies of SPA and SPA-Cys

Protein A naturally occurs with either four (E D A C) or five (E D A B C) homologous domains in different strains of S. aureus with an almost similar propensity for binding with immunoglobulins. Previous reports on the production of recombinant SPA with a single C-terminal cysteine have mostly reported Z domain (modified B) repeats and B domain repeats [17,18,23]. Dimerization of SPA-cys when produced extracellularly through secretion has been previously reported, although not quantitated [17], and was found to increase during storage. However, the information regarding the purification of SPA-cys in degassed condition is missing [16]. In two studies, SPA with multiple B-domain repeats was produced intracellularly [16,22]. However, the monomeric and dimeric content were not quantified. In this experiment, intracellular and extracellular expressions of SPA in E. coli with and without engineered cysteine were compared. The yield of SPA produced and the relative abundance of monomeric SPA obtained after final purification were evaluated. The Native Protein A sequence (Accession number: P99134, amino acids 39–422) with domains E, D, A, and C was chosen for the study. Four strains were constructed (Table 2). Cloning data is provided in a supplementary data file (Supplementary Figures S1–S3) to compare and analyse the expression of SPA and SPA-cys both intracellularly and extracellularly in the cultivation medium. Various parameters, including inducer concentration, temperature, and harvest time, were studied to optimise the expression of SPA (data not shown). The optimal value for IPTG concentration was 0.5 mM, temperature was 30 °C and harvest time was 4 h for intracellular and 12 h for extracellular post induction. Strain 1 and Strain 3 expressed SPA and SPA-cys, respectively, through an intracellular route, and Strain 2 and Strain 4 expressed SPA and SPA-cys by an extracellular route, respectively. Under optimised conditions, the strains with and without engineered cysteine exhibited comparable expression during intracellular and extracellular production, as shown under reducing conditions on SDS-PAGE in Figure 1.
Densitometry analysis shows that specific SPA formation was maximum at 4 h post induction for intracellular expression and 12 h post induction for extracellular expression in the cultivation medium. Specific yields were 148.3 ± 9.1, 154.1 ± 5.6 mg/g for intracellular (Strains 1 and 3) and 275.0 ± 8.9 and 297.4 ± 16.9 mg/g for extracellular (Strains 2 and 4), respectively. The specific protein production for all four strains was found to be quite similar.

3.2. Purification and Qualitative Analysis of SPA for Monomeric Forms Produced by Different Strains

For estimation of dimeric and monomeric content in each case, strains were cultivated and harvested at optimal times (4 h for intracellular and 12 h for extracellular expression). Proteins expressed from all four strains were purified through anion exchange chromatography (Q-Sepharose). Crude SPA produced from the respective strains was loaded onto the column, bound, and eluted at 250 mM of NaCl concentration. Samples from all steps were collected and eluted peak fractions were pooled. Samples were analysed by SDS-PAGE. The optimised process produced proteins with a purity of >90% with a protein recovery of around 70% (data not shown). Purified pooled fractions were buffer exchanged and concentrated with 10 mM phosphate buffer pH7.5 by 10 kDa cut off centrifugal filter for performing further characterisations.
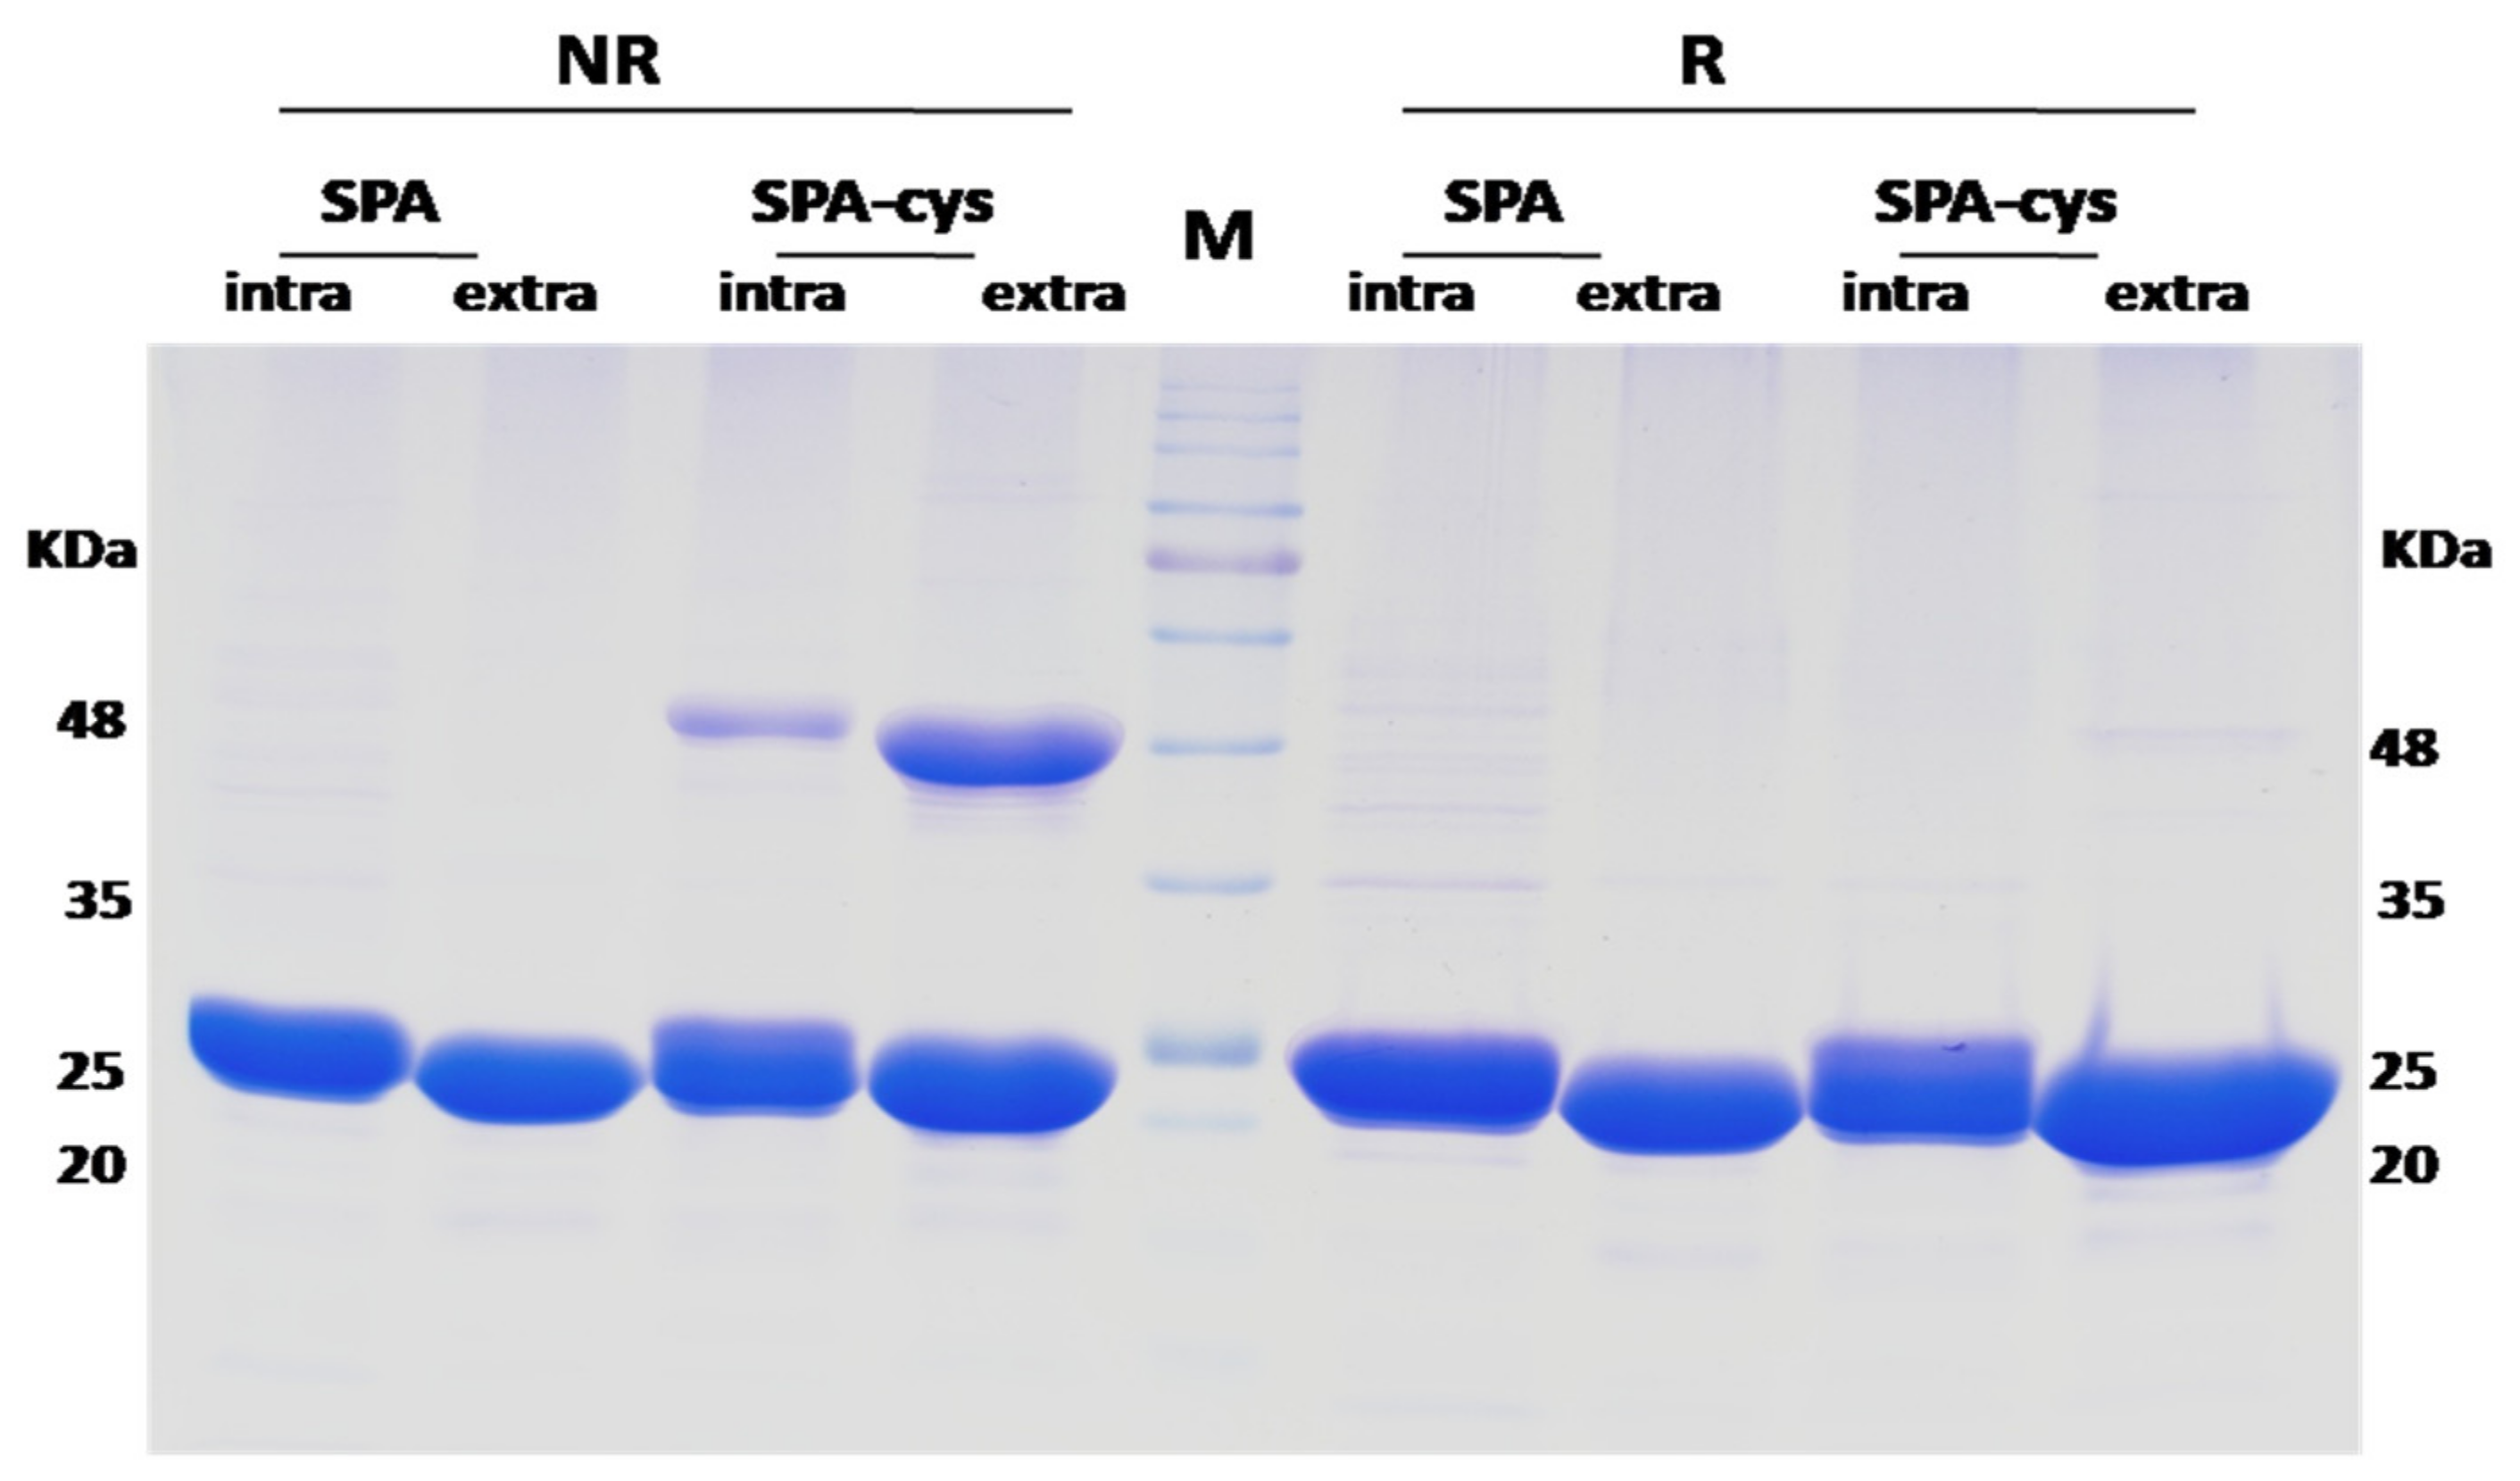
To characterise the purified proteins from all strains, purified SPA samples were run through reduced and non-reduced SDS-PAGE (Figure 2). Purified SPA isolated from all strains showed a prominent band at ~25 kDa in both non-reduced and reduced conditions (triplicate data Supplementary Figure S4). Intracellularly obtained proteins had a slightly higher (~3 kDa) molecular weight than extracellularly produced proteins. The difference in the size of the protein between the intracellular and extracellular expression is due to an additional 20 amino acids which are there as part of the histidine tag while cloning in pET-28b. However, purified SPA-cys expressed through Strains 3 and 4 also showed an extra prominent band at a molecular weight of ~50 kDa under non-reduced conditions, which confirms the formation of dimers of SPA-cys which contain cysteine at the C-terminus. The band was more prominent in the protein produced in Strain 4 as compared to Strain 3. No dimers were observed for SPA purified from Strain 1 and 2 due to unavailability of cysteine residue. These observations are consistent with previous reports which suggests formation of spontaneous dimer of SPA-cys. However, in previous reported studies, proteins were neither isolated and purified in controlled degassed conditions nor was quantification of monomer and dimer performed [16].

3.3. Quantitative Analysis of SPA-Cys Dimer and Monomer Fraction during Intracellular and Extracellular Production

To further characterise the exact size of intracellular and extracellularly produced SPA-cys proteins, intact mass (MALDI-TOF) analysis was performed. The sizes of SPA-cys produced intracellularly and extracellularly were found to be 28.179 kDa and 26.146 kDa, respectively. The expected calculated size of expressed SPA-cys (intracellular) is 28.311 kDa and SPA-cys (extracellular) is 26.148 kDa. The size difference between SPA-cys produced intracellularly and the calculated size may be because of the deletion of the first methionine at the N-terminus, sometimes observed for certain recombinant proteins produced in E. coli [27]. There was no size difference for SPA-cys produced extracellularly. The dimer peaks were also found at 56.358 kDa and 52.292 kDa, respectively. Chromatogram for Intact Mass are provided as supplementary data (Supplementary Figure S5).
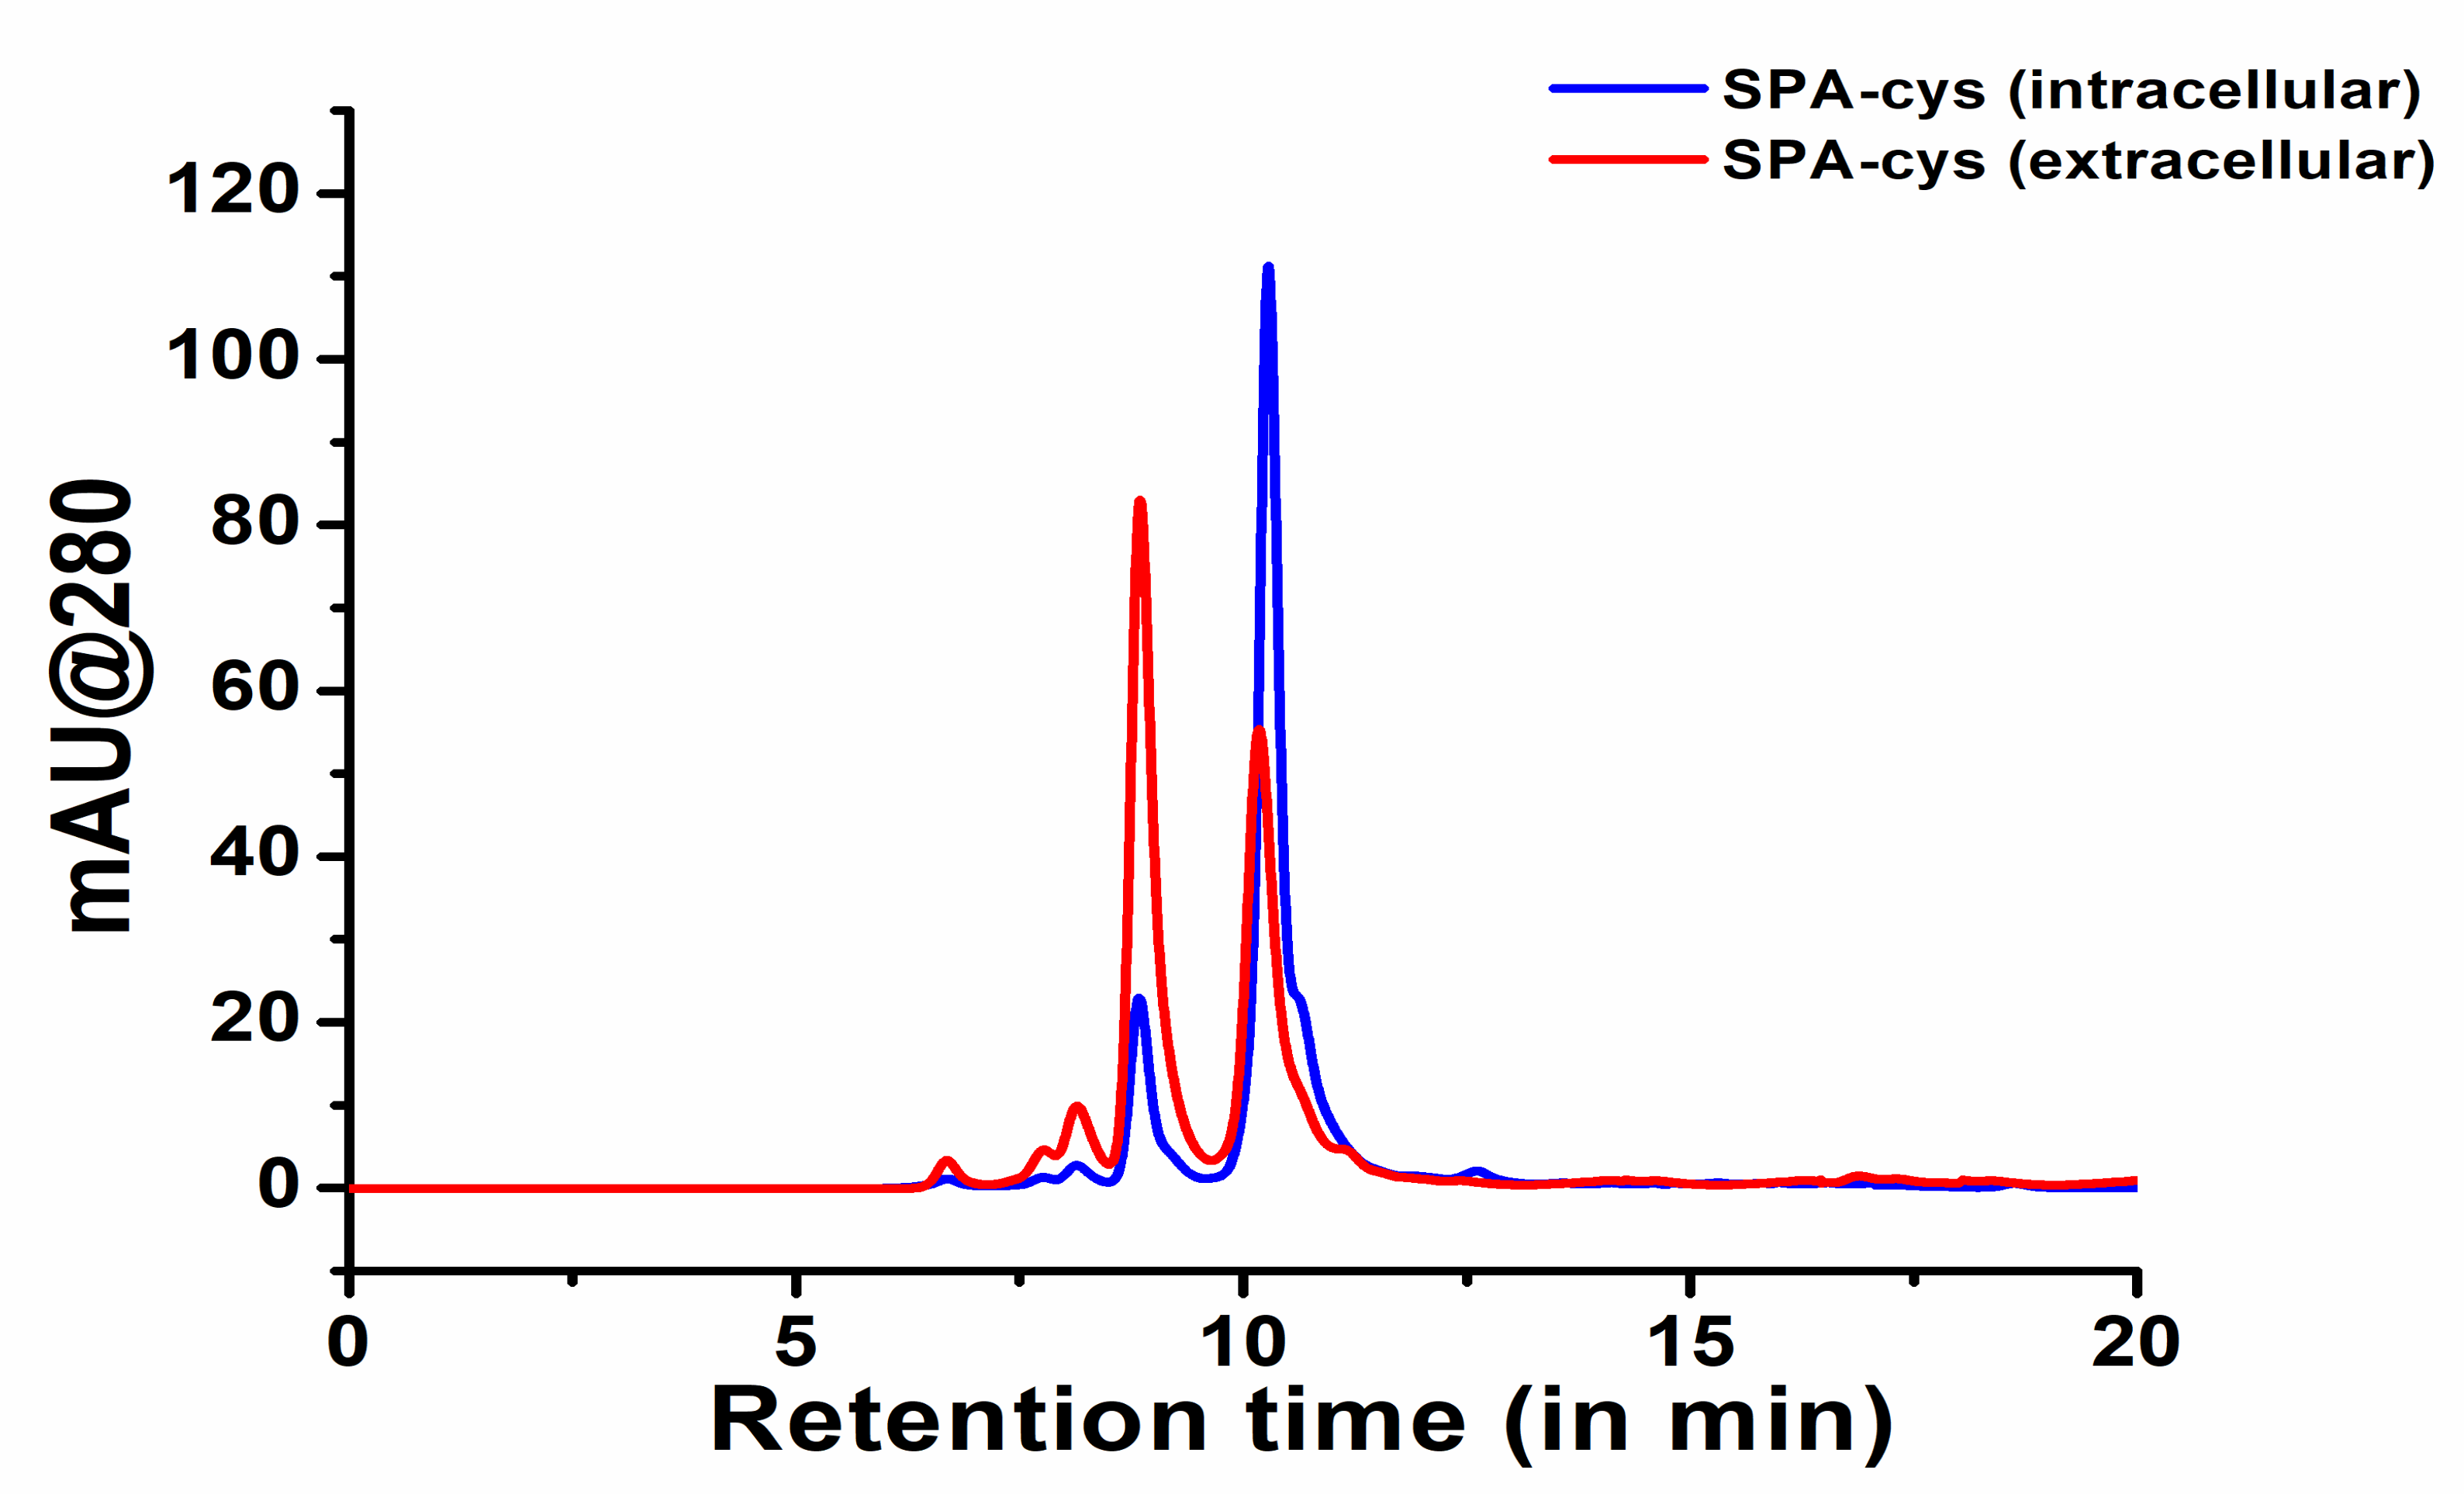
SE-HPLC is routinely used to determine the aggregation as well as dimeric and monomeric content of various proteins [28]. The SPA-cys produced intracellularly and extracellularly when quantified through SE-HPLC for its monomeric and dimeric content revealed that intracellular expression results in a higher monomer content of 85% as compared to its dimer, whereas extracellular expression of SPA-cys resulted in an almost equal proportion distribution of monomers and dimers (48:52) (Figure 3). Details of retention time and peak percentage have been provided in Table 3 (chromatogram Supplementary Figure S7). The purified SPA-cys was stored at −80 °C for further use. After 4 months of storage, there was almost no increase in dimeric content (by 2%) for SPA-cys produced extracellularly, while there was a slight increase in dimeric content (by 7%) for SPA-cys produced intracellularly (Supplementary Figure S8).
The intact mass and HPLC data (Figure 3, Supplementary Figures S5 and S7) show certain low-signal higher molecular weight (HMW) peaks along with prominent monomer and dimer fractions. These HMWs may be the oligomers of SPA, as confirmed by western blot (Supplementary Figure S6).

3.4. Free Cysteine Estimation

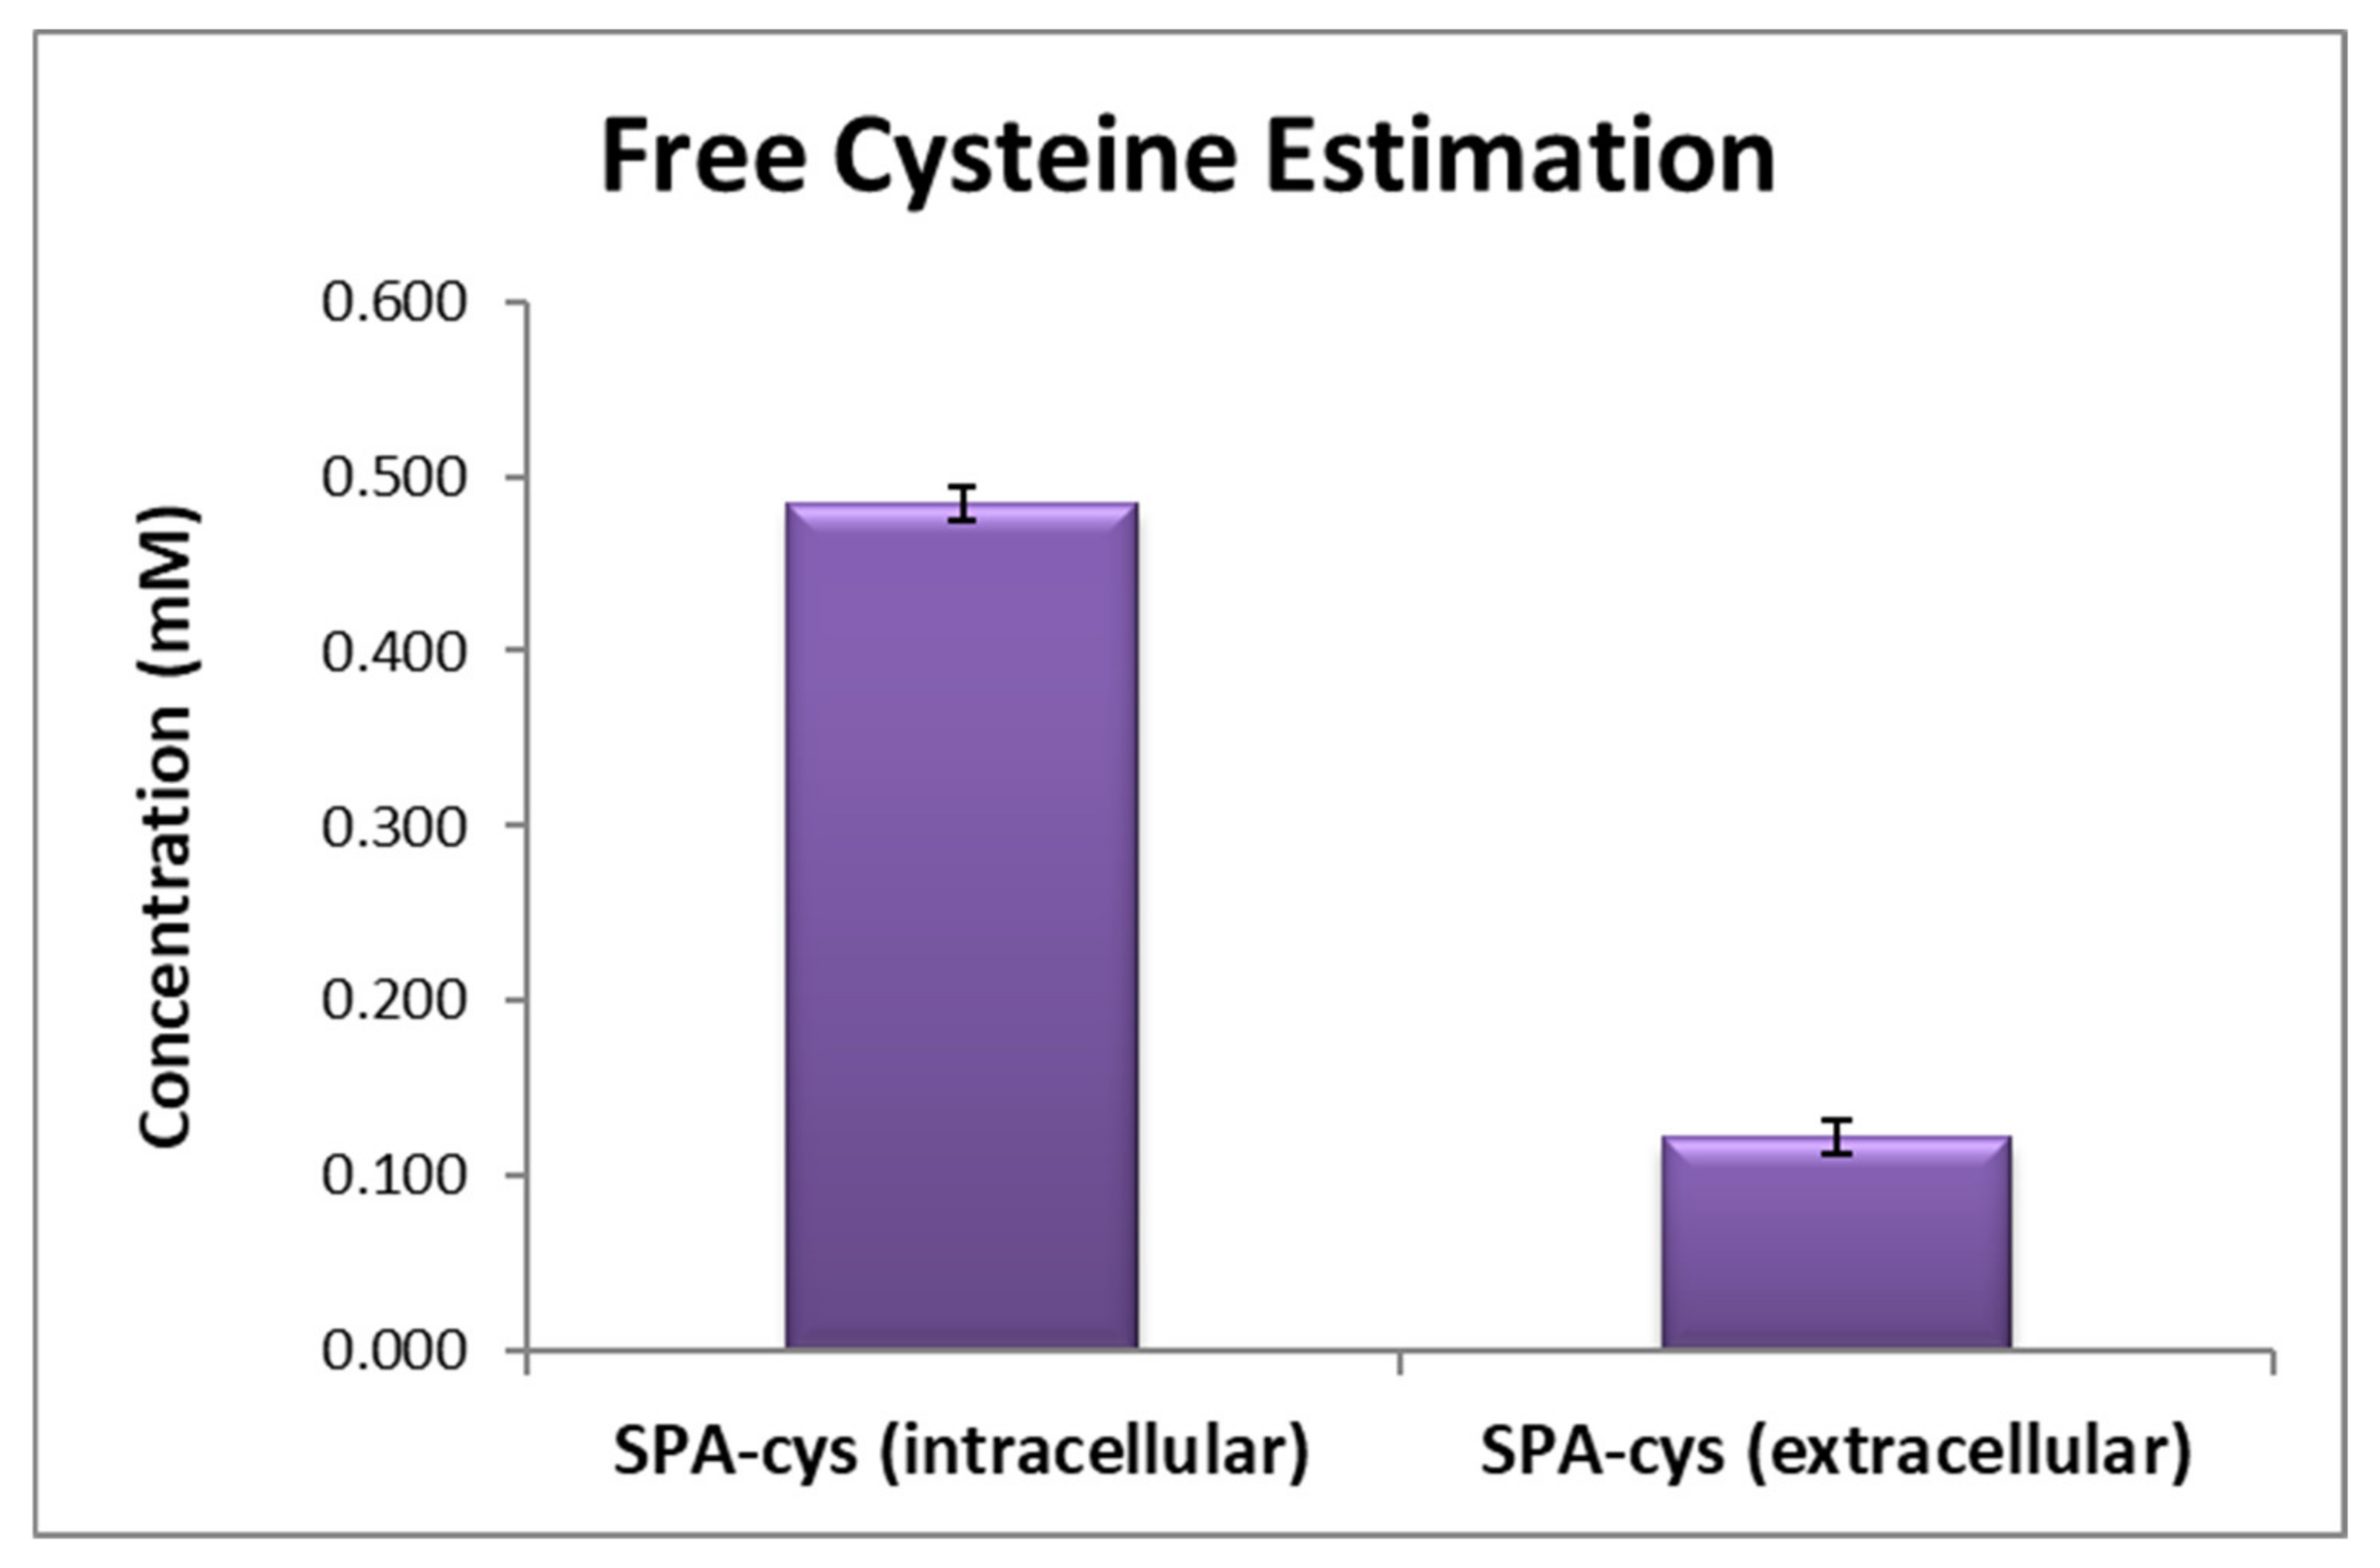
To further confirm the availability of reactive SH groups from cysteines in purified SPA-cys, free sulfhydryl group estimation of cysteine was performed using Ellman’s reagent. SPA-cys produced intracellularly showed a higher concentration of around 0.48 mM of free cysteine available in the protein solution. Whereas SPA-cys produced extracellularly had only 0.10 mM of free cysteine available (Figure 4). The estimation also confirms the similar observation obtained from the monomeric content as observed through SE-HPLC. A SPA without cysteine produced intracellularly and extracellularly was used as a negative control. (Data not shown).

3.5. Fluorescence Spectroscopy and Circular Dichroism Spectroscopy

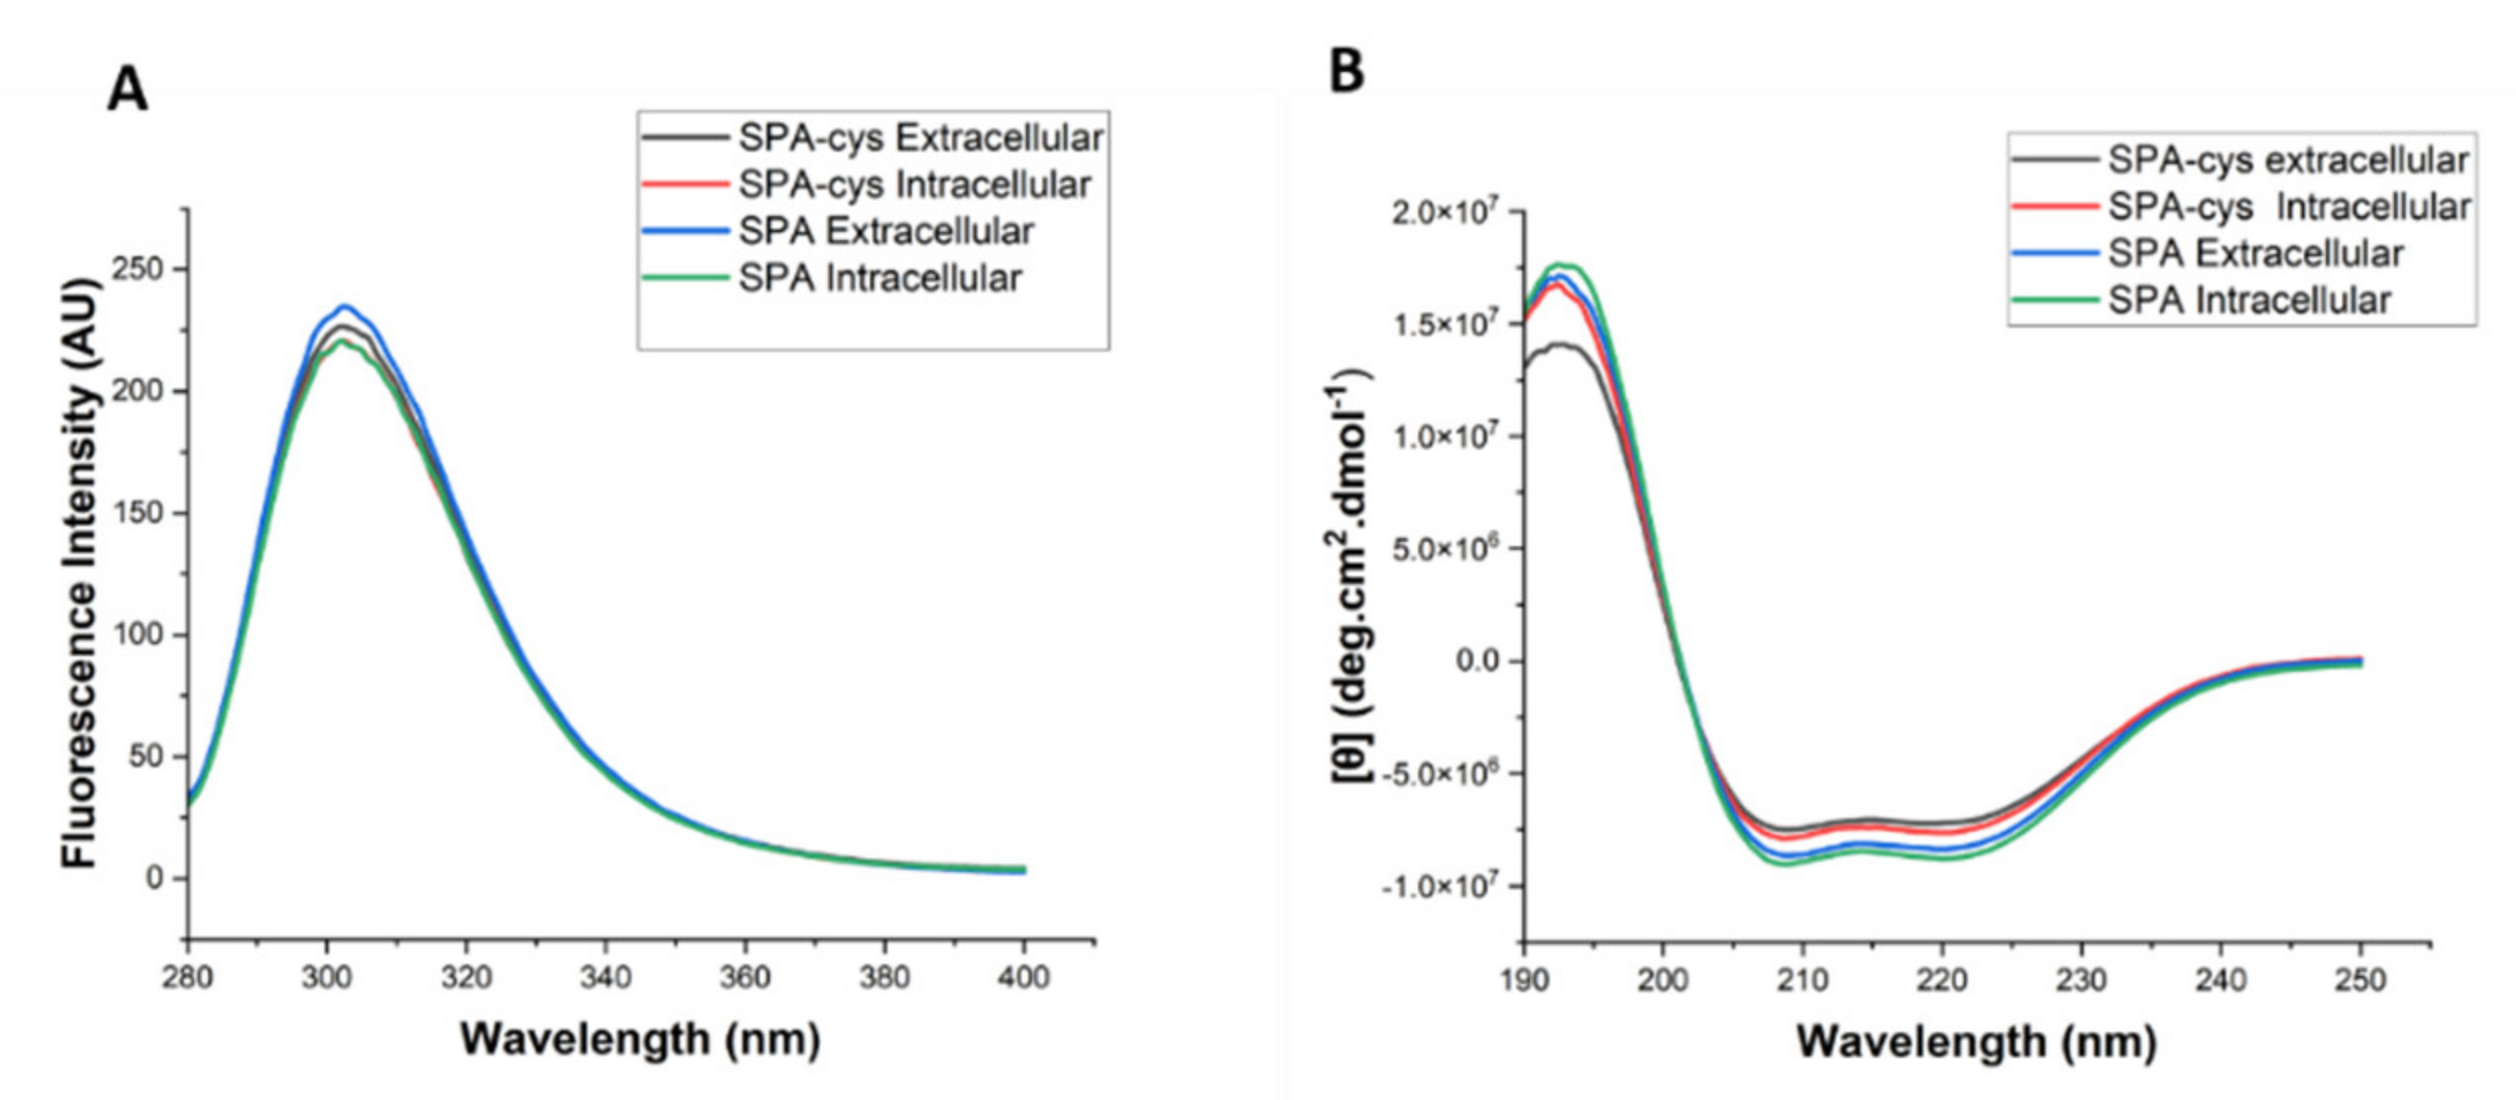
To confirm whether different approaches to production (i.e., intracellular vs. extracellular) have any impact on secondary and tertiary structure, which may influence the binding to solid support, purified extracellular and intracellular proteins SPA with and without cysteines were characterised for secondary and tertiary structure by circular dichroism (CD) and fluorescence spectroscopy, respectively. As tryptophan is not present in the primary sequence of SPA, fluorescence spectroscopy was carried out at an excitation of 270 nm, which gives mainly tyrosine fluorescence. The tertiary structure characterisation of intracellular and extracellular SPA through intrinsic fluorescence resulted in very similar fluorescence spectra in terms of intensity, wavelength maxima, and band shape, thus confirming the similar structure of the proteins. The wavelength maxima of the proteins were 304 nm, which is typical of tyrosine fluorescence (Figure 5A). The presence of similar secondary structures of SPA-cys and SPA expressed through different routes was also confirmed through CD spectroscopy, where CD spectra were collected from 250 to 190 nm. Similar CD spectra were observed for all the variant proteins where they showed predominantly alpha helical negative signature peaks at 222 and 208 nm and a positive peak at around 195 nm (Figure 5B).

3.6. Protein A Conjugation to Solid Support

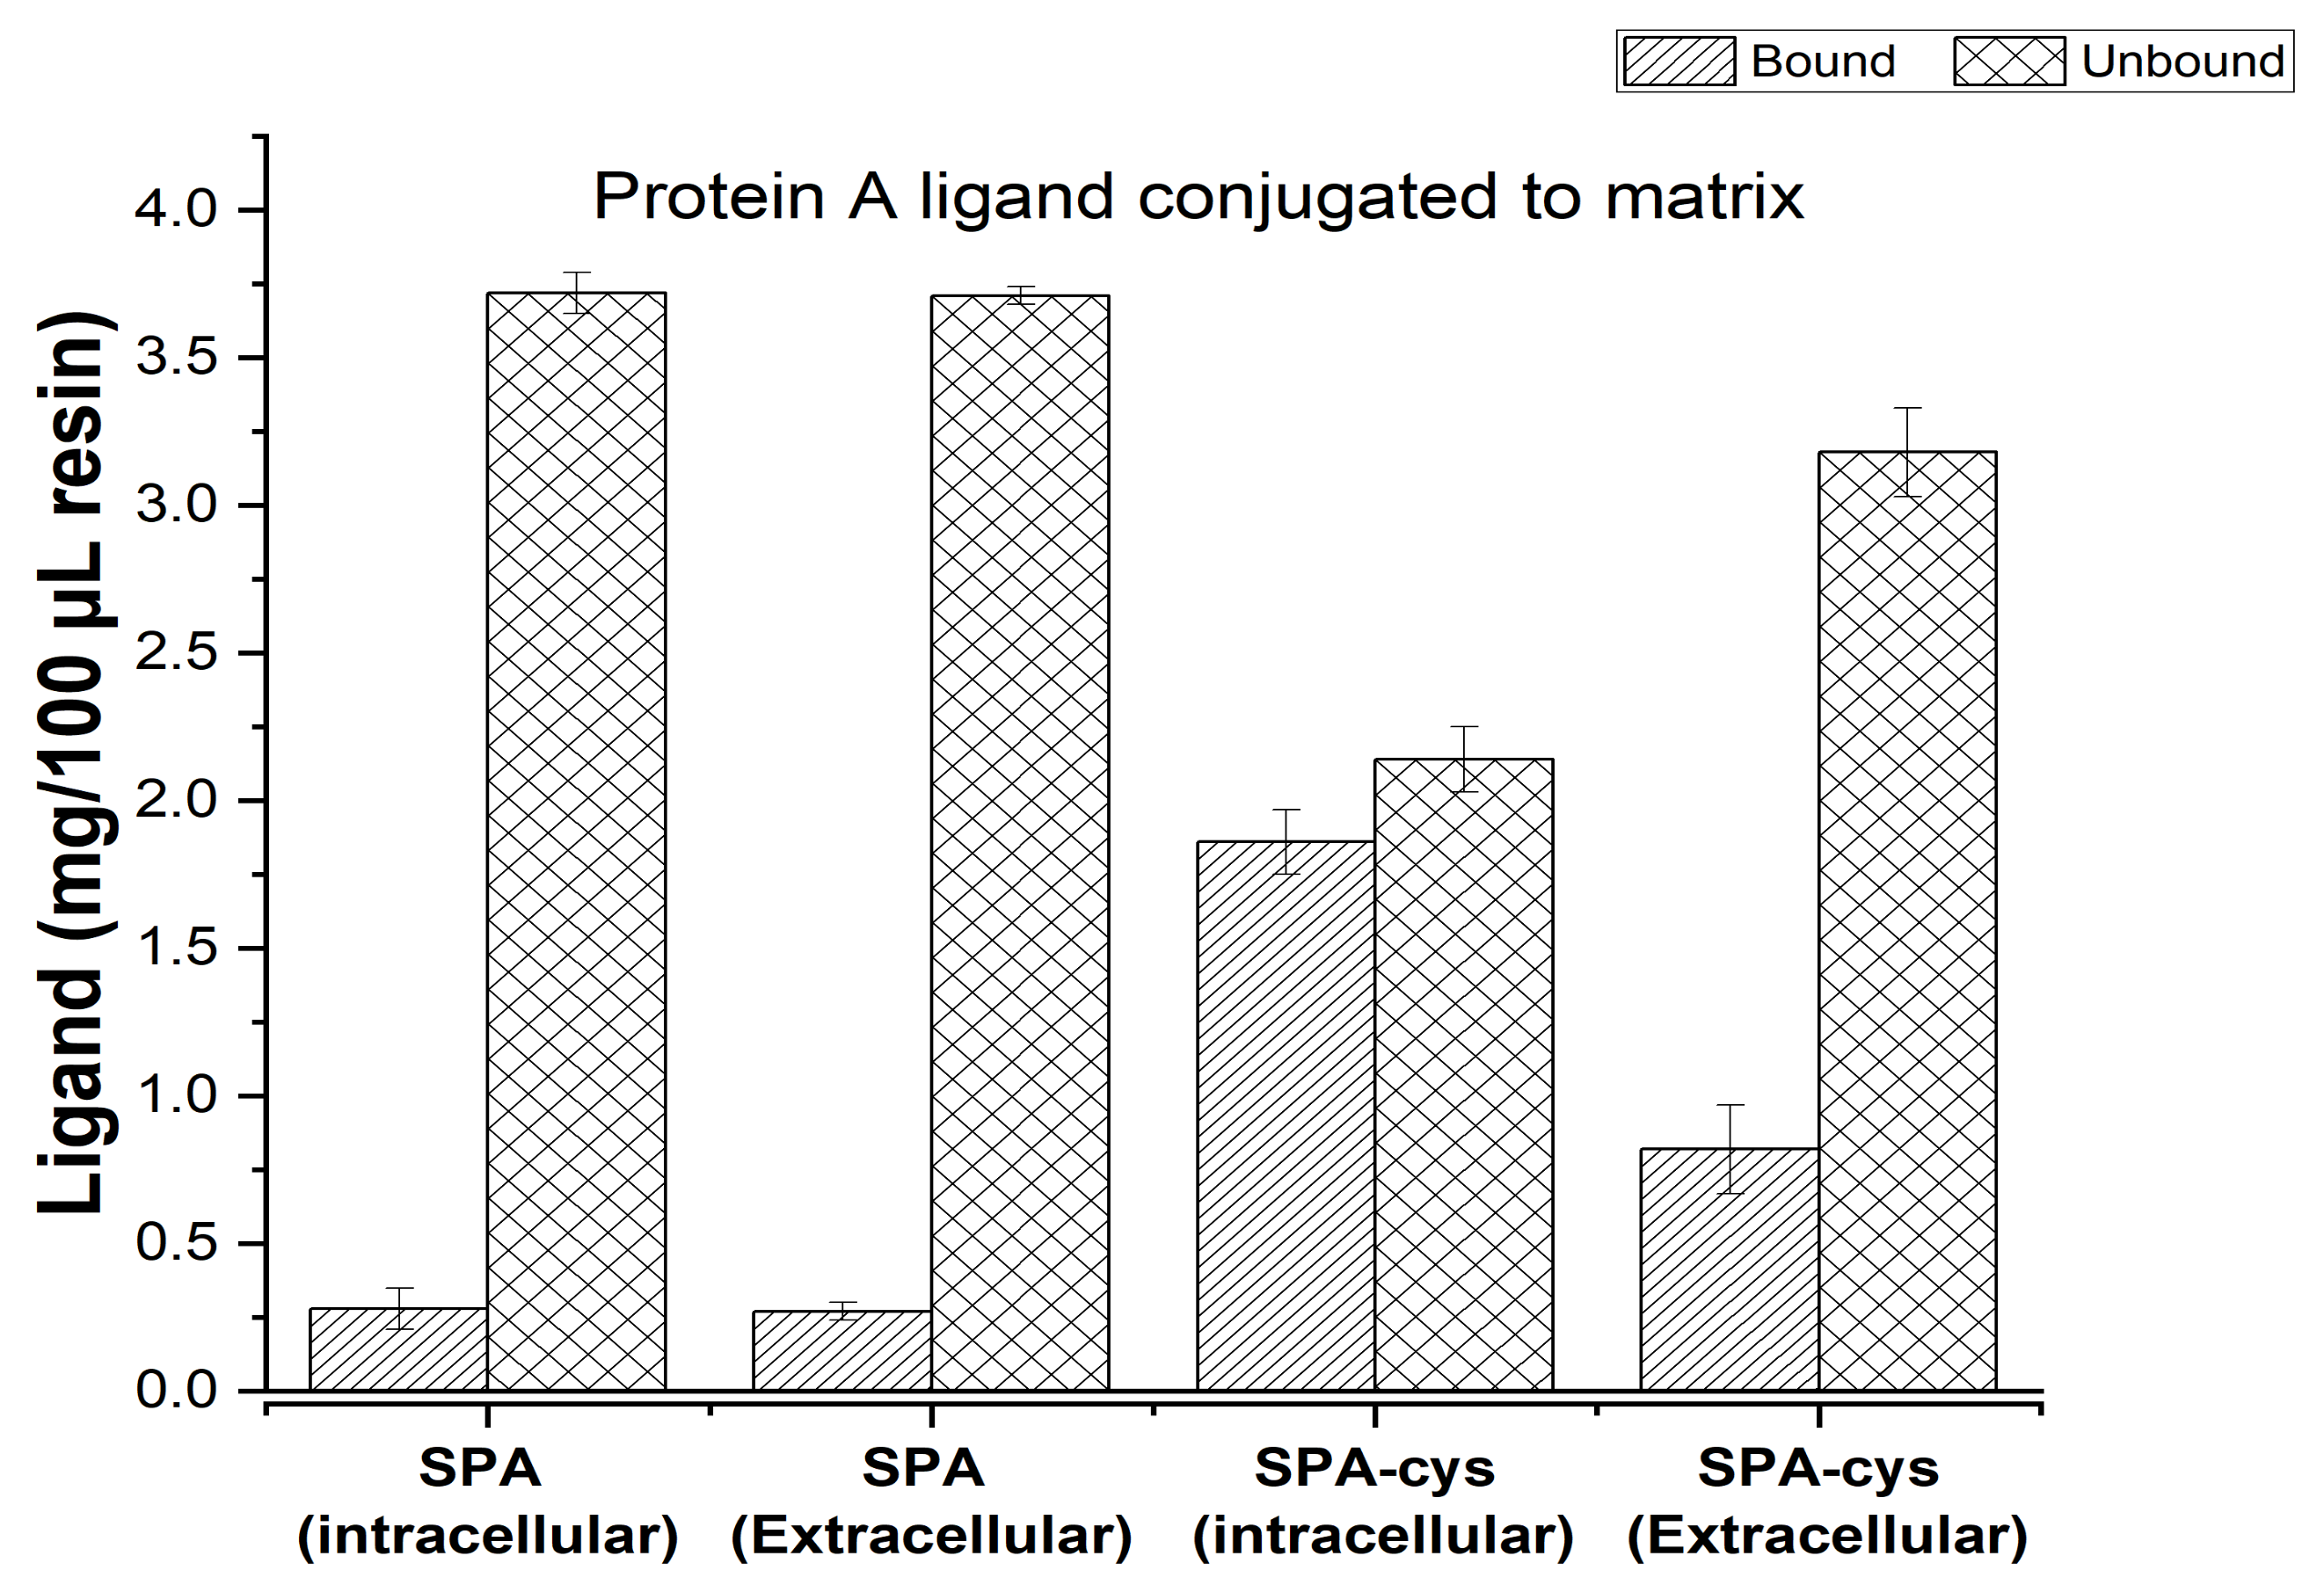
To evaluate the capability of the free cysteines available for conjugation to solid support without using any reducing agent and separation step, both preparation of proteins i.e., SPA-cys and SPA produced through intracellular and extracellular routes were conjugated using epoxy group functionalised on resin. Epoxy functional group normally reacts with the -SH, -NH2, and -OH groups of proteins [29]. To evaluate whether the -SH group is preferentially preferred for its reaction with the epoxide group on the solid support, 4 mg of each protein SPA (intracellularly produced), SPA (extracellularly produced), SPA-cys (intracellularly produced) and SPA-cys (extracellularly produced) were made to react with 12.5 mg of epoxy functionalised resin. Around 45 ± 3% of SPA-cys produced intracellularly was bound to the activated beads, 24 ± 5% of SPA-cys produced extracellularly, and just 7 ± 2% of SPA without any cysteine was able to bind to the epoxide resin (Figure 6). Due to the higher monomeric content of SPA-cys produced intracellularly, the binding is greater, while the low monomeric content of SPA-cys protein is produced extracellularly. Thus, the binding is less, and the amount of protein remaining unutilized for conjugation is quite high. It may also be seen that SPA without cysteine produced intracellularly or extracellularly also binds to epoxy beads; however, at a very low density (Table 4). This may be due to the non-accessibility of the epoxy group to -NH2 groups of lysine and hence the reaction may be slow. A similar observation of low reactivity because of the non-accessibility of small epoxy groups with -NH2 group was also reported earlier too [14]. Moreover, the use of low salt concentration, as reported earlier, may have favoured the binding [30]. This may have helped in the preferential binding of the -SH group of engineered cysteine present at the C-terminus with the epoxy group on solid support. The -NH2 group available from lysine may not be readily available as lysines are part of helices close to helices and may have steric hindrance to reacting with an epoxide group with a short spacer arm. However, the accessibility of engineered cysteine may be better as cysteine is not part of the rigid secondary structure of SPA but is available with a small flexible stretch at the end of helices, and thus this flexible stretch may be mimicked, such as by a short linker immobilising the SPA with a small epoxide group. Thus, it makes it a site-specific single point conjugation with support.
It has been reported that intracellularly produced SPA-cys has shown significant dimeric content due to spontaneous oxidation. The disulphides were reverted by the addition of a reducing agent before conjugation [16,22]. Further gel filtration chromatography was added to remove the residual reducing agent. We have also evaluated the coupling efficiency after the reversion along with the reducing agent, and also after its removal using buffer exchange. We found that the reversion step actually declines the coupling efficiency (Supplementary Figure S9).
The binding capacity of the SPA-resin prepared with SPA-cys produced intracellularly and extracellularly were checked by loading the known concentration of IgG (~1000 µg) and eluted at a very low pH. IgG was eluted around 8 times higher in the case of ligands produced intracellularly in comparison to ligands produced extracellularly (Supplementary Figure S10).

4. Conclusions

Staphylococcal protein A or any other protein with an engineered cysteine or single cysteine is a preferential choice for site-specific conjugation. However, the quality attributes ensuring the ligand is produced for conjugation must ensure the presence of a free SH functional group in the ligand. This desired critical quality attribute (CQA) and its obliviousness may affect yields and consistency of the conjugation process. Thus, the CQA must confirm the presence of the ligand, majorly in monomeric form. Our study demonstrates that the recombinant SPA-cys produced through intracellular expression vs. extracellular expression strategy may have similar purity, but the production process directs the existence of SPA-cys in monomeric and dimeric form. Although, the extracellular production may have its advantages in terms of yields and ease of purification, but it may lose on CQA (monomeric content), which is important for subsequent development and use. We have also checked the secondary structure and tertiary structure of purified SPA-cys produced intracellularly and extracellularly and found they are similar at the structural level using either the intracellular or extracellular route. Our data also indicates that SPA-cys produced through intracellular production has around two to three folds more availability of useful SPA with active free cysteine as compared to extracellular production. We have also demonstrated that a single cysteine engineered at the C-terminal of SPA provides preferential binding to an epoxide group with a short spacer arm functionalised on solid support, thus favouring it as a site-specific single point conjugation to resin. Based on the data incorporated into the study, we propose that the production strategy of SPA should be decided upon its downstream use. The intracellular route for production of SPA-cys should be the preferred method, and the final characterisation method should include the monomeric content as part of quality control and release assays. The abundance of monomeric content enhances the site-specific conjugation efficiency and density of SPA on the resin matrix.

Supplementary Materials

The following supporting information can be downloaded at: https://www.mdpi.com/article/10.3390/fermentation8040150/s1, Figure S1: Vector maps and insert sequence of SPA-cys. Figures S2–S3: Cloning results. Figure S4: 12% SDS PAGE analysis of purified protein in reducing and non-reducing conditions for three purified batches. Figure S5: INTACT MASS data (MALDI_TOF). Figure S6: Western Blot result. Figure S7: SEC-HPLC raw DATA. Figure S8: Stability data (SE-HPLC) after 4 months at −80 °C. Figure S9: Evaluation of reducing agent to reduce the dimeric content to monomeric content in extracelluarly produced SPA on conjugation efficiency. Figure S10: Raw data for IgG bound and Unbound Fractions.

Author Contributions

Conceptualization, G.P.; methodology, G.P., L.C., E.S. and V.Y.; software, formal analysis, L.C., R.J. and R.M.; investigation, L.C., E.S., A.A. and V.Y.; Validation, E.S.; resources, G.P.; data curation, L.C.; writing—original draft preparation, L.C.; writing—review and editing, G.P.; visualization, L.C., R.J. and R.M.; supervision, G.P.; project administration, G.P.; funding acquisition, G.P. All authors have read and agreed to the published version of the manuscript.

Funding

This work was supported by BIRAC under scheme Promoting Academic Research Conversion to Enterprise (Grant-in-Aid No. AIR0625/PACE to GP).

Institutional Review Board Statement

Not Applicable.

Informed Consent Statement

Not Applicable.

Data Availability Statement

Not Applicable.

Acknowledgments

Infrastructural support through FRGS GGS Indraprastha University, New Delhi is gratefully acknowledged. L.C. and E.S. were supported through fellowship scheme (STRF) from GGS Indraprastha University. We are grateful to Ranjith Kumar C. T. for critically reading the manuscript.

Conflicts of Interest

The authors declare no conflict of interest.

References

  1. Kleiner-Grote, G.R.M.; Risse, J.M.; Friehs, K. Secretion of recombinant proteins from E. coli. Eng. Life Sci. 2018, 18, 532–550. [Google Scholar] [CrossRef] [PubMed] [Green Version]
  2. Saraswat, V.; Kim, D.Y.; Lee, J.; Park, Y.-H. Effect of specific production rate of recombinant protein on multimerization of plasmid vector and gene expression level. FEMS Microbiol. Lett. 1999, 179, 367–373. [Google Scholar] [CrossRef] [PubMed]
  3. Khushoo, A.; Pal, Y.; Mukherjee, K.J. Optimization of extracellular production of recombinant asparaginase in Escherichia coli in shake-flask and bioreactor. Appl. Microbiol. Biotechnol. 2005, 68, 189–197. [Google Scholar] [CrossRef] [PubMed]
  4. Mergulhão, F.; Monteiro, G.; Kelly, A.; Taipa, M.A.; Cabral, J. Recombinant human proinsulin: A new approach in gene assembly and protein expression. J. Microbiol. Biotechnol. 2000, 10, 690–693. [Google Scholar]
  5. Behere, K.; Cha, B.; Yoon, S. Protein a resin lifetime study: Evaluation of protein a resin performance with a model-based approach in continuous capture. Prep. Biochem. Biotechnol. 2018, 48, 242–256. [Google Scholar] [CrossRef]
  6. Pabst, T.M.; Palmgren, R.; Forss, A.; Vasic, J.; Fonseca, M.; Thompson, C.; Wang, W.K.; Wang, X.; Hunter, A.K. Engineering of novel Staphylococcal Protein A ligands to enable milder elution pH and high dynamic binding capacity. J. Chromatogr. A 2014, 1362, 180–185. [Google Scholar] [CrossRef] [Green Version]
  7. Cruz, A.R.; den Boer, M.A.; Strasser, J.; Zwarthoff, S.A.; Beurskens, F.J.; de Haas, C.J.; Aerts, P.C.; Wang, G.; de Jong, R.N.; Bagnoli, F.; et al. Staphylococcal protein A inhibits complement activation by interfering with IgG hexamer formation. Proc. Natl. Acad. Sci. USA 2021, 118, e2016772118. [Google Scholar] [CrossRef]
  8. Falugi, F.; Kim, H.K.; Missiakas, D.M.; Schneewind, O.; Gilmore, M.S. Role of Protein A in the Evasion of Host Adaptive Immune Responses by Staphylococcus aureus. MBio 2013, 4, e00575-13. [Google Scholar] [CrossRef] [Green Version]
  9. Bolton, G.R.; Mehta, K.K. The role of more than 40 years of improvement in protein A chromatography in the growth of the therapeutic antibody industry. Biotechnol. Prog. 2016, 32, 1193–1202. [Google Scholar] [CrossRef]
  10. Rigi, G.; Ghaedmohammadi, S.; Ahmadian, G. A comprehensive review on staphylococcal protein A (SpA): Its production and applications. Biotechnol. Appl. Biochem. 2019, 66, 454–464. [Google Scholar] [CrossRef]
  11. Goding, J.W. Use of staphylococcal protein A as an immunological reagent. J. Immunol. Methods 1978, 20, 241–253. [Google Scholar] [CrossRef]
  12. Balachandran, M.; Giannone, R.J.; Bemis, D.A.; Kania, S.A. Molecular basis of surface anchored protein A deficiency in the Staphylococcus aureus strain Wood 46. PLoS ONE 2017, 12, e0183913. [Google Scholar] [CrossRef] [Green Version]
  13. Langone, J.J. Applications of immobilized protein A in immunochemical techniques. J. Immunol. Methods 1982, 55, 277–296. [Google Scholar] [CrossRef]
  14. Zhang, X.; Wang, Y.; Zhong, T.; Feng, X. Optimal spacer arm microenvironment for the immobilization of recombinant Protein A on heterofunctional amino-epoxy agarose supports. Process Biochem. 2020, 91, 90–98. [Google Scholar] [CrossRef]
  15. Wang, H.C.; Yu, C.C.; Liang, C.F.; Huang, L.D.; Hwu, J.R.; Lin, C.C. Site-selective protein immobilization through 2-cyanobenzothiazole-cysteine condensation. Chembiochem A Eur. J. Chem. Biol. 2014, 15, 829–835. [Google Scholar] [CrossRef]
  16. Zhang, X.; Duan, Y.; Zeng, X. Improved Performance of Recombinant Protein A Immobilized on Agarose Beads by Site-Specific Conjugation. ACS Omega 2017, 2, 1731–1737. [Google Scholar] [CrossRef] [Green Version]
  17. Ljungquist, C.; Jansson, B.; Moks, T.; Uhlén, M. Thiol-directed immobilization of recombinant IgG-binding receptors. Eur. J. Biochem. 1989, 186, 557–561. [Google Scholar] [CrossRef]
  18. Hansen, R.E.; Winther, J.R. An introduction to methods for analyzing thiols and disulfides: Reactions, reagents, and practical considerations. Anal. Biochem. 2009, 394, 147–158. [Google Scholar] [CrossRef]
  19. Kim, Y.; Ho, S.O.; Gassman, N.R.; Korlann, Y.; Landorf, E.V.; Collart, F.R.; Weiss, S. Efficient site-specific labeling of proteins via cysteines. Bioconjugate Chem. 2008, 19, 786–791. [Google Scholar] [CrossRef] [Green Version]
  20. Mateo, C.; Abian, O.; Fernández-Lorente, G.; Pedroche, J.; Fernández-Lafuente, R.; Guisan, J.M.; Tam, A.; Daminati, M. Epoxy sepabeads: A novel epoxy support for stabilization of industrial enzymes via very intense multipoint covalent attachment. Biotechnol. Prog. 2002, 18, 629–634. [Google Scholar] [CrossRef]
  21. Henkel, M.; Röckendorf, N.; Frey, A. Selective and Efficient Cysteine Conjugation by Maleimides in the Presence of Phosphine Reductants. Bioconjugate Chem. 2016, 27, 2260–2265. [Google Scholar] [CrossRef]
  22. Freiherr von Roman, M.; Berensmeier, S. Improving the binding capacities of protein A chromatographic materials by means of ligand polymerization. J. Chromatogr. A 2014, 1347, 80–86. [Google Scholar] [CrossRef]
  23. Uhlén, M.; Abrahmsén, L. Secretion of recombinant proteins into the culture medium by Escherichia coli and Staphylococcus aureus. Biochem. Soc. Trans. 1989, 17, 340–341. [Google Scholar] [CrossRef] [Green Version]
  24. He, F. Laemmli-SDS-PAGE. Bio-Protocol 2011, 1, e80. [Google Scholar] [CrossRef]
  25. Dhayalan, A.; Velramar, B.; Govindasamy, B.; Ramalingam, K.R.; Dilipkumar, A.; Pachiappan, P. Isolation of a bacterial strain from the gut of the fish, Systomus sarana, identification of the isolated strain, optimized production of its protease, the enzyme purification, and partial structural characterization. J. Genet. Eng. Biotechnol. 2022, 20, 24. [Google Scholar] [CrossRef]
  26. Ahamed, M.; Akhtar, M.J.; Khan, M.A.M.; Alhadlaq, H.A. Enhanced Anticancer Performance of Eco-Friendly-Prepared Mo-ZnO/RGO Nanocomposites: Role of Oxidative Stress and Apoptosis. ACS Omega 2022, 7, 7103–7115. [Google Scholar] [CrossRef]
  27. Piatkov, K.I.; Vu, T.T.; Hwang, C.S.; Varshavsky, A. Formyl-methionine as a degradation signal at the N-termini of bacterial proteins. Microb. Cell (Graz Austria) 2015, 2, 376–393. [Google Scholar] [CrossRef] [Green Version]
  28. Bond, M.D.; Panek, M.E.; Zhang, Z.; Wang, D.; Mehndiratta, P.; Zhao, H.; Gunton, K.; Ni, A.; Nedved, M.L.; Burman, S.; et al. Evaluation of a Dual-Wavelength Size Exclusion HPLC Method With Improved Sensitivity to Detect Protein Aggregates and Its Use to Better Characterize Degradation Pathways of an IgG1 Monoclonal Antibody. J. Pharm. Sci. 2010, 99, 2582–2597. [Google Scholar] [CrossRef]
  29. Mateo, C.; Grazu, V.; Palomo, J.M.; Lopez-Gallego, F.; Fernandez-Lafuente, R.; Guisan, J.M. Immobilization of enzymes on heterofunctional epoxy supports. Nat. Protoc. 2007, 2, 1022–1033. [Google Scholar] [CrossRef]
  30. Wheatley, J.B.; Schmidt, D.E. Salt-induced immobilization of affinity ligands onto epoxide-activated supports. J. Chromatogr. A 1999, 849, 1–12. [Google Scholar] [CrossRef]
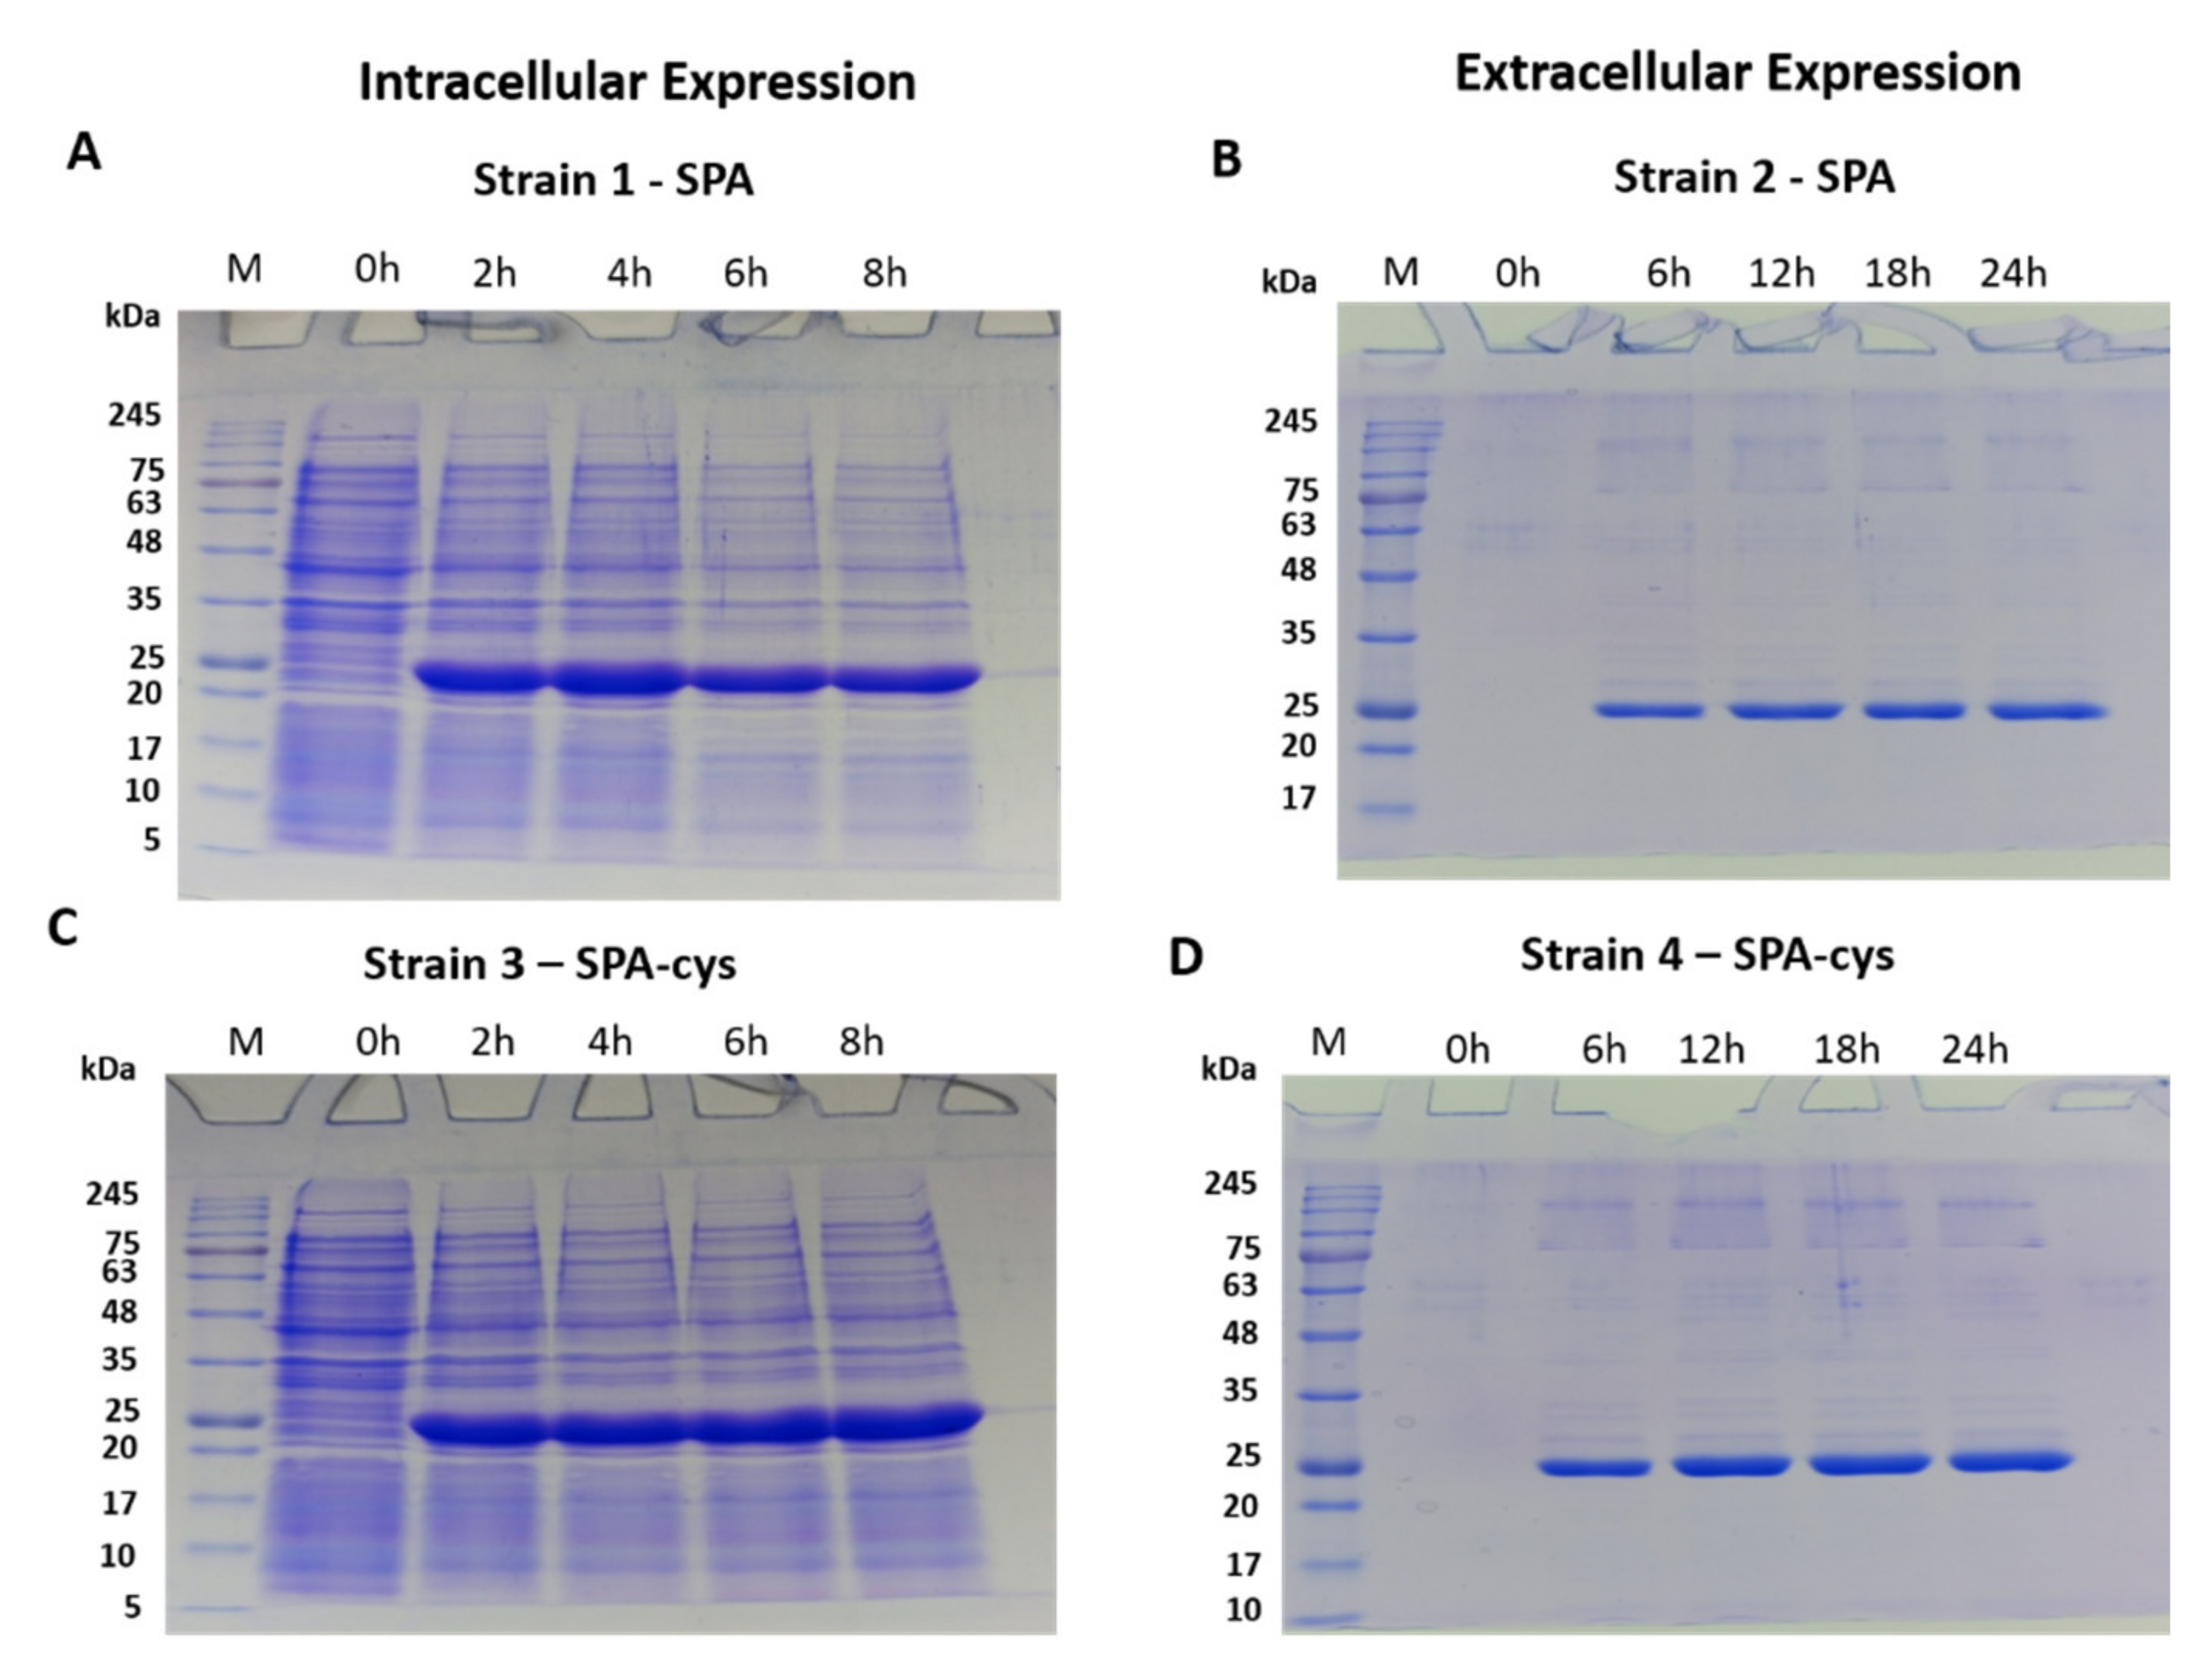
Figure 1. 12% reducing SDS-PAGE gel showing post induction expression studies up to 8 h for intracellular protein (A: Strain 1- SPA, C: Strain 3- SPA-cys) and up to 24 h for extracellular protein (B: Strain 2- SPA, D: Strain 4- SPA-cys). Lane M: pre-stained molecular weight marker, Lane 0 h: pre induced, Lane 2–8 h: post induction samples at 2 h, 4 h, 6 h, and 8 h (Strain 1 and Strain 3). Lane M: pre-stained molecular weight marker, Lane 0 h: pre-induced, Lane 6–24 h: post induction samples at 6 h, 12 h, 18 h, and 24 h (Strain 2 and Strain 4).
Fermentation 08 00150 g001
Figure 2. 12% SDS-PAGE analysis of purified protein in reducing and non-reducing conditions. M: Prestained molecular marker, R: purified protein in reduced form, and NR: protein in non-reducing condition, Intra: SPA produced intracellularly, Extra: SPA produced extracellularly.
Fermentation 08 00150 g002
Figure 3. SEC-HPLC graph showing peaks of Strain 3: SPA-cys intracellular (blue) and Strain 4: SPA-cys extracellular (red) with monomeric and dimeric form.
Fermentation 08 00150 g003
Figure 4. The bar graph showing the concentration of free cysteine available in purified samples for SPA-cys produced intracellular and extracellularly estimated by Ellman’s reagent.
Fermentation 08 00150 g004
Figure 5. (A) Fluorescence emission spectra of SPA-cys intracellular (red), SPA-cys extracellular (black), SPA intracellular (green) and SPA extracellular (blue) in 10 mM phosphate buffer, pH 7.5. (B) CD spectra of SPA-cys intracellular (red), SPA-cys extracellular (black), SPA intracellular (green), and SPA extracellular (blue) in 10 mM phosphate buffer, pH 7.5.
Fermentation 08 00150 g005
Figure 6. The bar graph showing binding of protein A ligand to solid support. The bound and unbound fraction of to 12.5 mg of resin when coupled with 4 mg of SPA (intracellular), SPA-cys (intracellular), SPA-cys (extracellular).
Fermentation 08 00150 g006
Table 1. Host strains and plasmids used.
Strain/PlasmidCharacteristicsReferences
Strains
DH5αsupE44 ΔlacU169 (Φ80 lacZ ΔM15) hsdR17 recA1 endA1 gyrA96 thi-1 relA1Amersham Biosciences, Piscataway, NJ, USA
BL21(DE3)Fomp Thsd SB (rB −mB −) gal dcm lon (DE3)Novagen, Madison, WI, USA
Plasmids
pET-22b (5493 bp)5.4 kb, Amp, T7 promoter, lacO, pelB Signal SequenceNovagen, Madison, WI, USA
pET-28b (5369 bp)5.4 kb, Kan, T7 promoter, lacONovagen, Madison, WI, USA
Table 2. Strain details with nucleotide sequence of primers with inserted restriction sites and clones constructed.
Sr. No.PlasmidOligonucleotide SequenceRestriction Site Inserted
Strain 1pET-28b-SPAFP: GACATATGGATGAGGCGCAG
RP: GAGGATCCTTACTTCGGCGCCTGC
NdeI
BamHI
Strain 2pET-22-b-SPAFP: GCGCCATGGATGAGGCGCCAGCAAAACGCGTTCTAT
RP: GAGGATCCTTACTTCGGCGCCTGC
NcoI
BamHI
Strain 3pET-28b-SPA-cysFP: GACATATGGATGAGGCGCAG
RP: GAGAATTCTTAGCACTTCGGCGCCTGC
NdeI
EcoRI
Strain 4pET-22b-SPA-cysFP: GCGCCATGGATGAGGCGCCAGCAAAACGCGTTCTAT
RP: GAGAATTCTTAGCACTTCGGCGCCTGC
NcoI
EcoRI
FP: Forward primer and RP: Reverse primer. Restriction sites inserted are marked by underline. Codons for cysteine are marked in bold.
Table 3. SEC-HPLC table showing retention time, peak area, and peak area percentage in monomeric and dimeric forms.
Route of ExpressionProtein FormRetention Time (Min)Peak AreaPeak Area (%)
SPA-cys intracellularDimer8.83421.9714.87 + 6.61
Monomer10.282416.2585.13 + 6.80
SPA-cys extracellularDimer8.881551.1651.95 + 1.85
Monomer10.181434.8048.05 + 1.85
Table 4. Overview of coupled proteins with their densities in epoxide resin.
LigandLigand Density (nmol/mL)
SPA (Intracellular)100.51 ± 26.12
SPA (Extracellular)107.66 ± 12.34
SPA-cys (Intracellular)658.19 ± 40.41
SPA-cys (Extracellular)313.23 ± 56.46
Publisher’s Note: MDPI stays neutral with regard to jurisdictional claims in published maps and institutional affiliations.