Article

Quality Traits of Sourdough Bread Obtained by Novel Digital Technologies and Machine Learning Modelling

by
Claudia Gonzalez Viejo
*,
Natalie M. Harris
and
Sigfredo Fuentes
Digital Agriculture, Food and Wine Sciences Group, School of Agriculture and Food, Faculty of Veterinary and Agricultural Sciences, University of Melbourne, Melbourne, VIC 3010, Australia
*
Author to whom correspondence should be addressed.
Fermentation 2022, 8(10), 516; https://doi.org/10.3390/fermentation8100516
Submission received: 13 September 2022 / Revised: 4 October 2022 / Accepted: 6 October 2022 / Published: 7 October 2022

Abstract

:
Sourdough bread (SB) has increased popularity due to health benefits and higher interest in artisan breadmaking due to social isolation during the COVID-19 pandemic. However, quality traits and consumer assessment are still limited to complex laboratory analysis and sensory trials. In this research, new and emerging digital technologies were tested to assess quality traits of SB made from six different flour sources. The results showed that machine learning (ML) models developed to classify the type of wheat used for flours (targets) from near-infrared (NIR) spectroscopy data (Model 1) and a low-cost electronic nose (Model 2) as inputs rendered highly accurate and precise models (96.3% and 99.4%, respectively). Furthermore, ML regression models based on the same inputs for NIR (Model 3) and e-nose (Model 4) were developed to automatically assess 16 volatile aromatic compounds (targets) using GC-MS as ground-truth. To reiterate, models with high accuracy and performance were obtained with correlation (R), determination coefficients (R2), and slope (b) of R = 0.97; R2 = 0.94 and b = 0.99 for Model 3 and R = 0.99; R2 = 0.99 and b = 0.99 for Model 4. The development of low-cost instrumentation and sensors could make possible the accessibility of hardware and software to the industry and artisan breadmakers to assess quality traits and consistency of SB.

1. Introduction

Sourdough bread is produced from a dough fermented either by adding commercial yeast and cultures or using a starter exposed to the environment for spontaneous fermentation. This type of bread, especially with whole grain flour, has gained popularity due to associated health benefits, such as reduced incidence of type-2 diabetes, cardiovascular disease, and other diseases [1]. During lockdowns due to the COVID-19 pandemic, artisan sourdough making became a popular activity, which offered further health-related benefits, such as reductions in stress, sense of isolation, boredom, and frustration, among others [2]. For the latter case, the assessment of quality traits of sourdough bread (SB) was based mainly on trial and error and through non-objective feedback from family members and friends with whom the bread was shared. In the case of the breadmaking industry, SB quality assessment is not that far from artisan breadmaking among consumers; for example, breadmakers gain clients and popularity mainly through trial and error and word of mouth in their respective localities [3].
Quality traits and sensory characteristics of SB are dependent on many microbiological and physicochemical factors, such as microbiological ecology [4], amylopectin and protein digestibility [5], volatile compounds produced [6], and the physicochemical properties given by the type of starters and type of flour used [7,8,9,10,11,12]. These quality traits also can affect sourdough bread’s shelf life [13,14] and, therefore, consumer acceptability, overall liking, and willingness to re-purchase. Many of these quality traits are difficult to assess, requiring complex laboratory assessments involving microbiological, physicochemical instrumentation, and/or the use of consumer or trained sensory panels. The latter procedures can be time-consuming and cost-prohibitive, which often do not offer objective and sensible information to consumers [15,16,17].
New and emerging digital technologies have been recently used for food and beverage quality trait assessment, including non-invasive sensor technologies, such as photogrammetry and computer vision algorithms (CV), near-infrared spectroscopy (NIR), and the development of novel and low-cost electronic noses (e-nose) coupled with data analysis techniques such as artificial intelligence and machine/deep learning (ML) [18,19,20,21,22,23,24,25,26,27,28].
This research explores the implementation of novel digital technologies, coupled with AI and ML, to assess quality traits of sourdough bread from different flour sources. This work also explores the development of computer applications (Apps) that can be used by industrial and artisan breadmakers to assess sourdough bread quality traits.

2. Materials and Methods

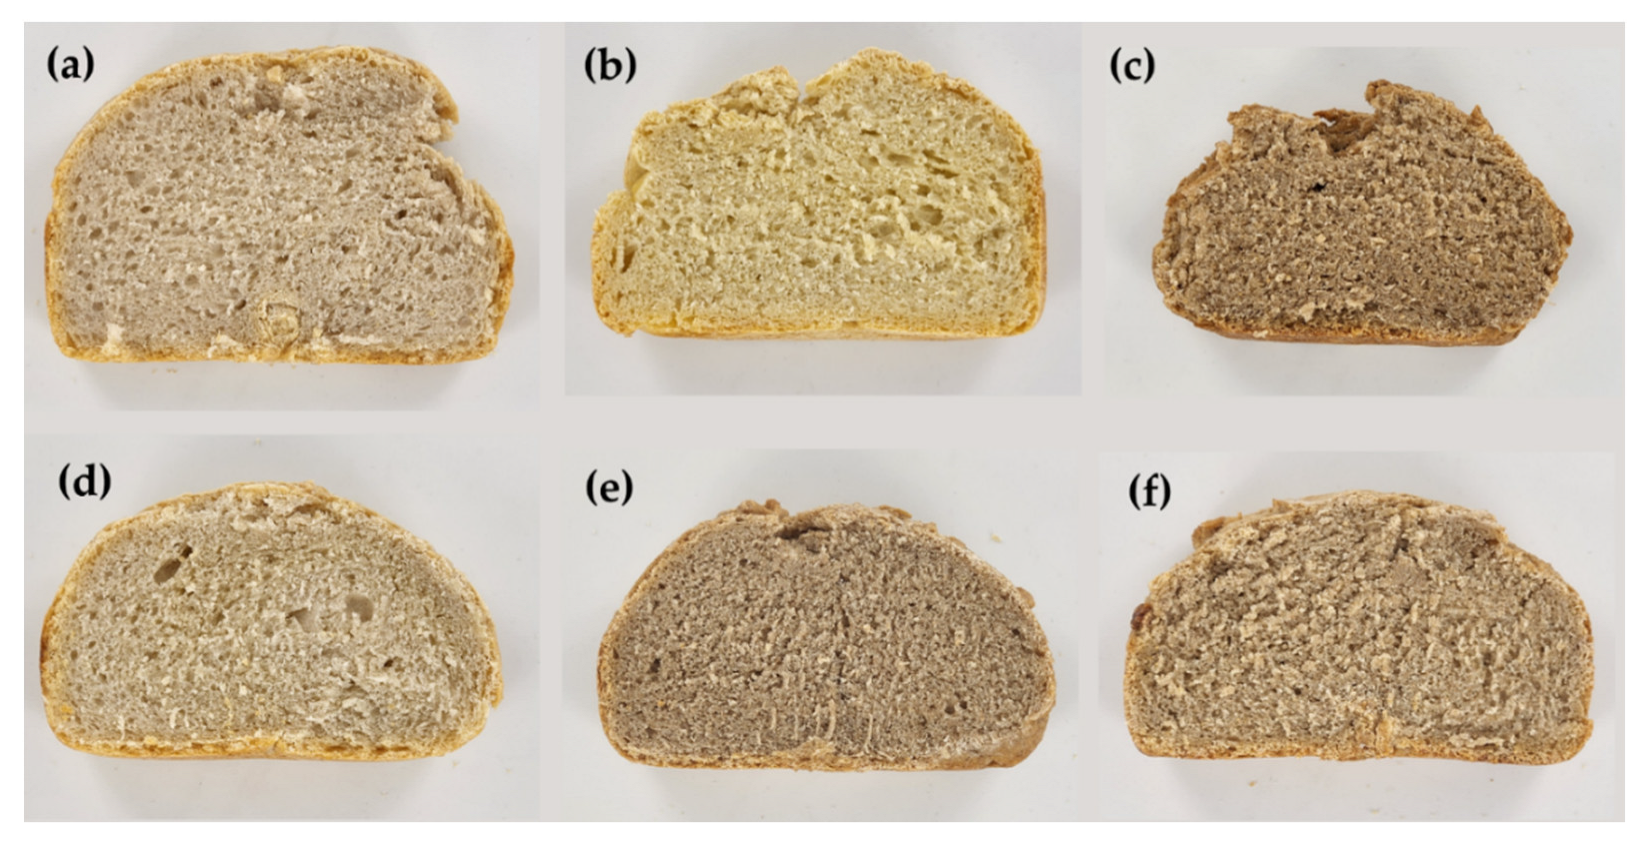
2.1. Samples Description

Six treatments of sourdough bread were made using different types of wheat flour (i) soft wheat (So), (ii) semola (Se), (iii) Emmer wheat (E), (iv) 50% soft wheat + 50% semola (SoSe), (v) 50% soft wheat + 50% Emmer wheat (SoE), and (vi) 50% semola + 50% Emmer wheat (SeE) (Figure 1). All samples were made using the same formulation as recommended in the breadmaker manual and only differed in the type of wheat flour used (Table 1); the commercial Mad Millie Sourdough Culture (Mad Millie, Wellington, New Zealand) used to make the starter consisted of a mix of yeast, the specific formulation from the yeast mix is unknown since it is a commercial product, dextrose, and lactic acid bacteria (Lactococcus lactis subspecies cremoris, L. lactis subsp. lactis, L. lactis subsp. lactis biovar diacetylactis, and Leuconostoc). Samples’ starter, dough, and baking were made using a Panasonic breadmaker SD-YR2550SST (Panasonic Corporation, Kadoma, Osaka, Japan) using the corresponding recommended settings for each stage to maintain consistency in the breadmaking process. Figure S1 in Supplementary Materials depicts the making process and measurements.

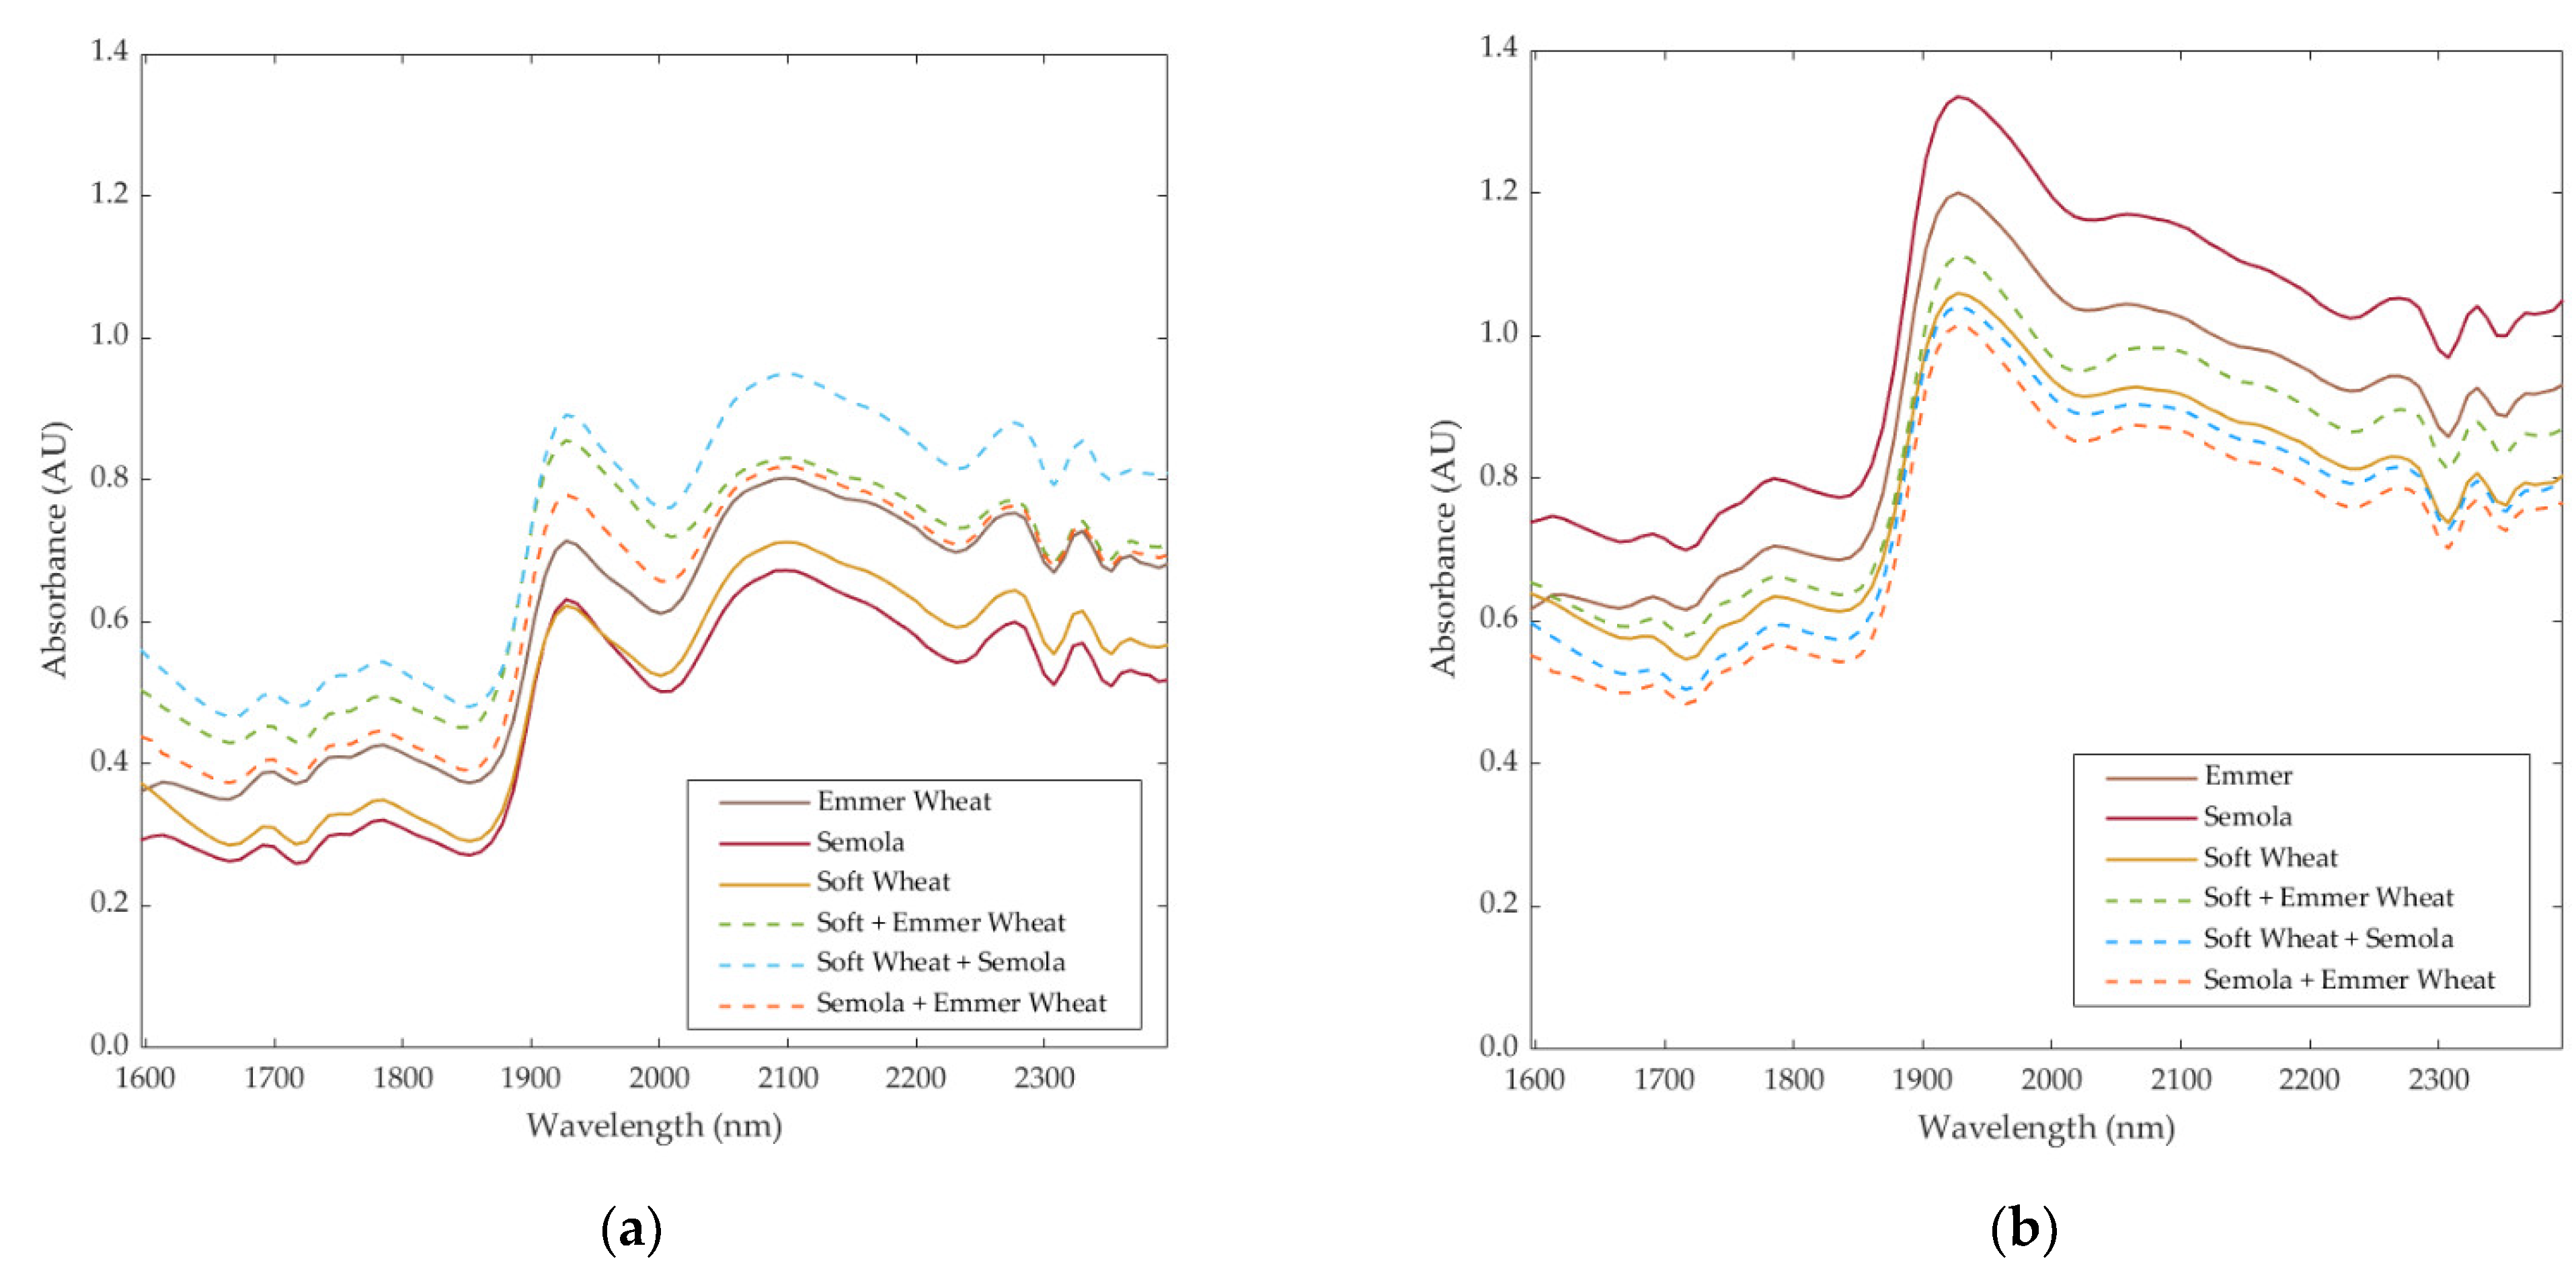
2.2. Near-Infrared Measurements

All treatments were measured in triplicates in the crust and the crumb with three measurements per replicate (n = 9 per treatment for each the crust and the crumb) using a portable handheld near-infrared MicroPHAZIR™ RX Analyzer (Thermo Fisher Scientific, Waltham, MA, USA). This device measures the chemical fingerprinting within the range of 1596–2396 nm of the light spectra. A white reference background was read at the start and every 10 measurements as calibration.

2.3. Gas Chromatography Mass-Spectroscopy

Samples (crust + crumb combined) were analyzed in triplicates to assess the volatile aromatic compounds (VAC) using a high-efficiency source gas chromatograph with mass selective detector 5977B (GC-MS; detection limit 1.5 fg; Agilent Technologies, Inc., Santa Clara, CA, USA) paired with a PAL3 autosampler (CTC Analytics AG, Zwingen, Switzerland). The method used was as described by Gonzalez Viejo et al. [29], with an HP-5MS column (length: 30 m; diameter: 0.25 mm; film: 0.25 µ; Agilent Technologies, Inc., Santa Clara, CA, USA) used. The gas carrier was Helium at a flow rate of 1 mL mm−1. The injection method used consisted of headspace with a solid-phase microextraction (SPME) divinylbenzene-carboxen–polydimethylsiloxane (DVB–CAR–PDMS) 1.1 mm grey fiber (Agilent Technologies, Inc., Santa Clara, CA, USA). An empty vial was used at the start of the analysis to avoid any carryover effects from previous tests. The results were analyzed using the National Institute of Standards and Technology (NIST; National Institute of Standards and Technology, Gaithersburg, MD, USA) library to identify the volatile compounds with >80% certainty.

2.4. Electronic Nose Measurements

Three middle slices of each treatment were analyzed using a low-cost and portable e-nose developed by the digital agriculture food and wine research group from The University of Melbourne (DAFW-UoM) to assess volatile compounds. This device is composed of nine different gas sensors (i) MQ3: alcohol, (ii) MQ4: Methane (CH4), (iii) MQ7: Carbon monoxide (CO), (iv) MQ8: Hydrogen (H2), (v) MQ135: ammonia/alcohol/benzene, (vi) MQ136: hydrogen sulfide (H2S), (vii) MQ137: ammonia, (viii) MQ138: benzene/alcohol/ammonia and (ix) MG811: Carbon dioxide (CO2) [30]. A slice of bread was broken into pieces and added to a 600 mL beaker. The e-nose was placed on top of the container to measure the volatile compounds for 1 min with 30 s recorded from the environment before and after measuring the samples for calibration. The outputs were analyzed using a customized Matlab® R2021a (Mathworks, Inc., Natick, MA, USA) developed by the DAFW-UoM, which is able to display the curves to select the most stable area of the signals and subdivide it into 10 parts to calculate 10 mean values per curve automatically [24].

2.5. Physicochemical Measurements

The loaf of each treatment was measured for dimensions (length, width, and height) using a standard ruler in mm as well as weight using an ANYSCALES THB 3000 scale (Any Scales Online Pty. Ltd., Acacia Ridge, QLD, Australia). Due to the nature of these measurements, no replicates were evaluated since dimensions and weight did not vary significantly in a single loaf (middle section) per treatment due to the breadmaker used. Both the crust and crumb of each treatment were measured in triplicates for texture in Newtons using a digital Gy-4 penetrometer (Yucheng Technologies, Beijing, China). Furthermore, six replicates (three crust + three crumb) of the samples were analyzed using a Nix™ PRO colorimeter (Nix Sensor Ltd., Hamilton, Ontario, Canada) to assess variables in two color channels, CIELab and RGB. On the other hand, triplicates of each sample were measured for salt and pH using a PAL-SALT Mohr salt meter (Atago Co., Ltd. Saitama, Japan) and a PAL-pH pH-meter (Atago Co., Ltd. Saitama, Japan), respectively. For both salt and pH, 7.5 g of the crumb was mixed into 50 mL of distilled water and stirred for 15 min [31]; one drop of the liquid was then used to measure the samples.

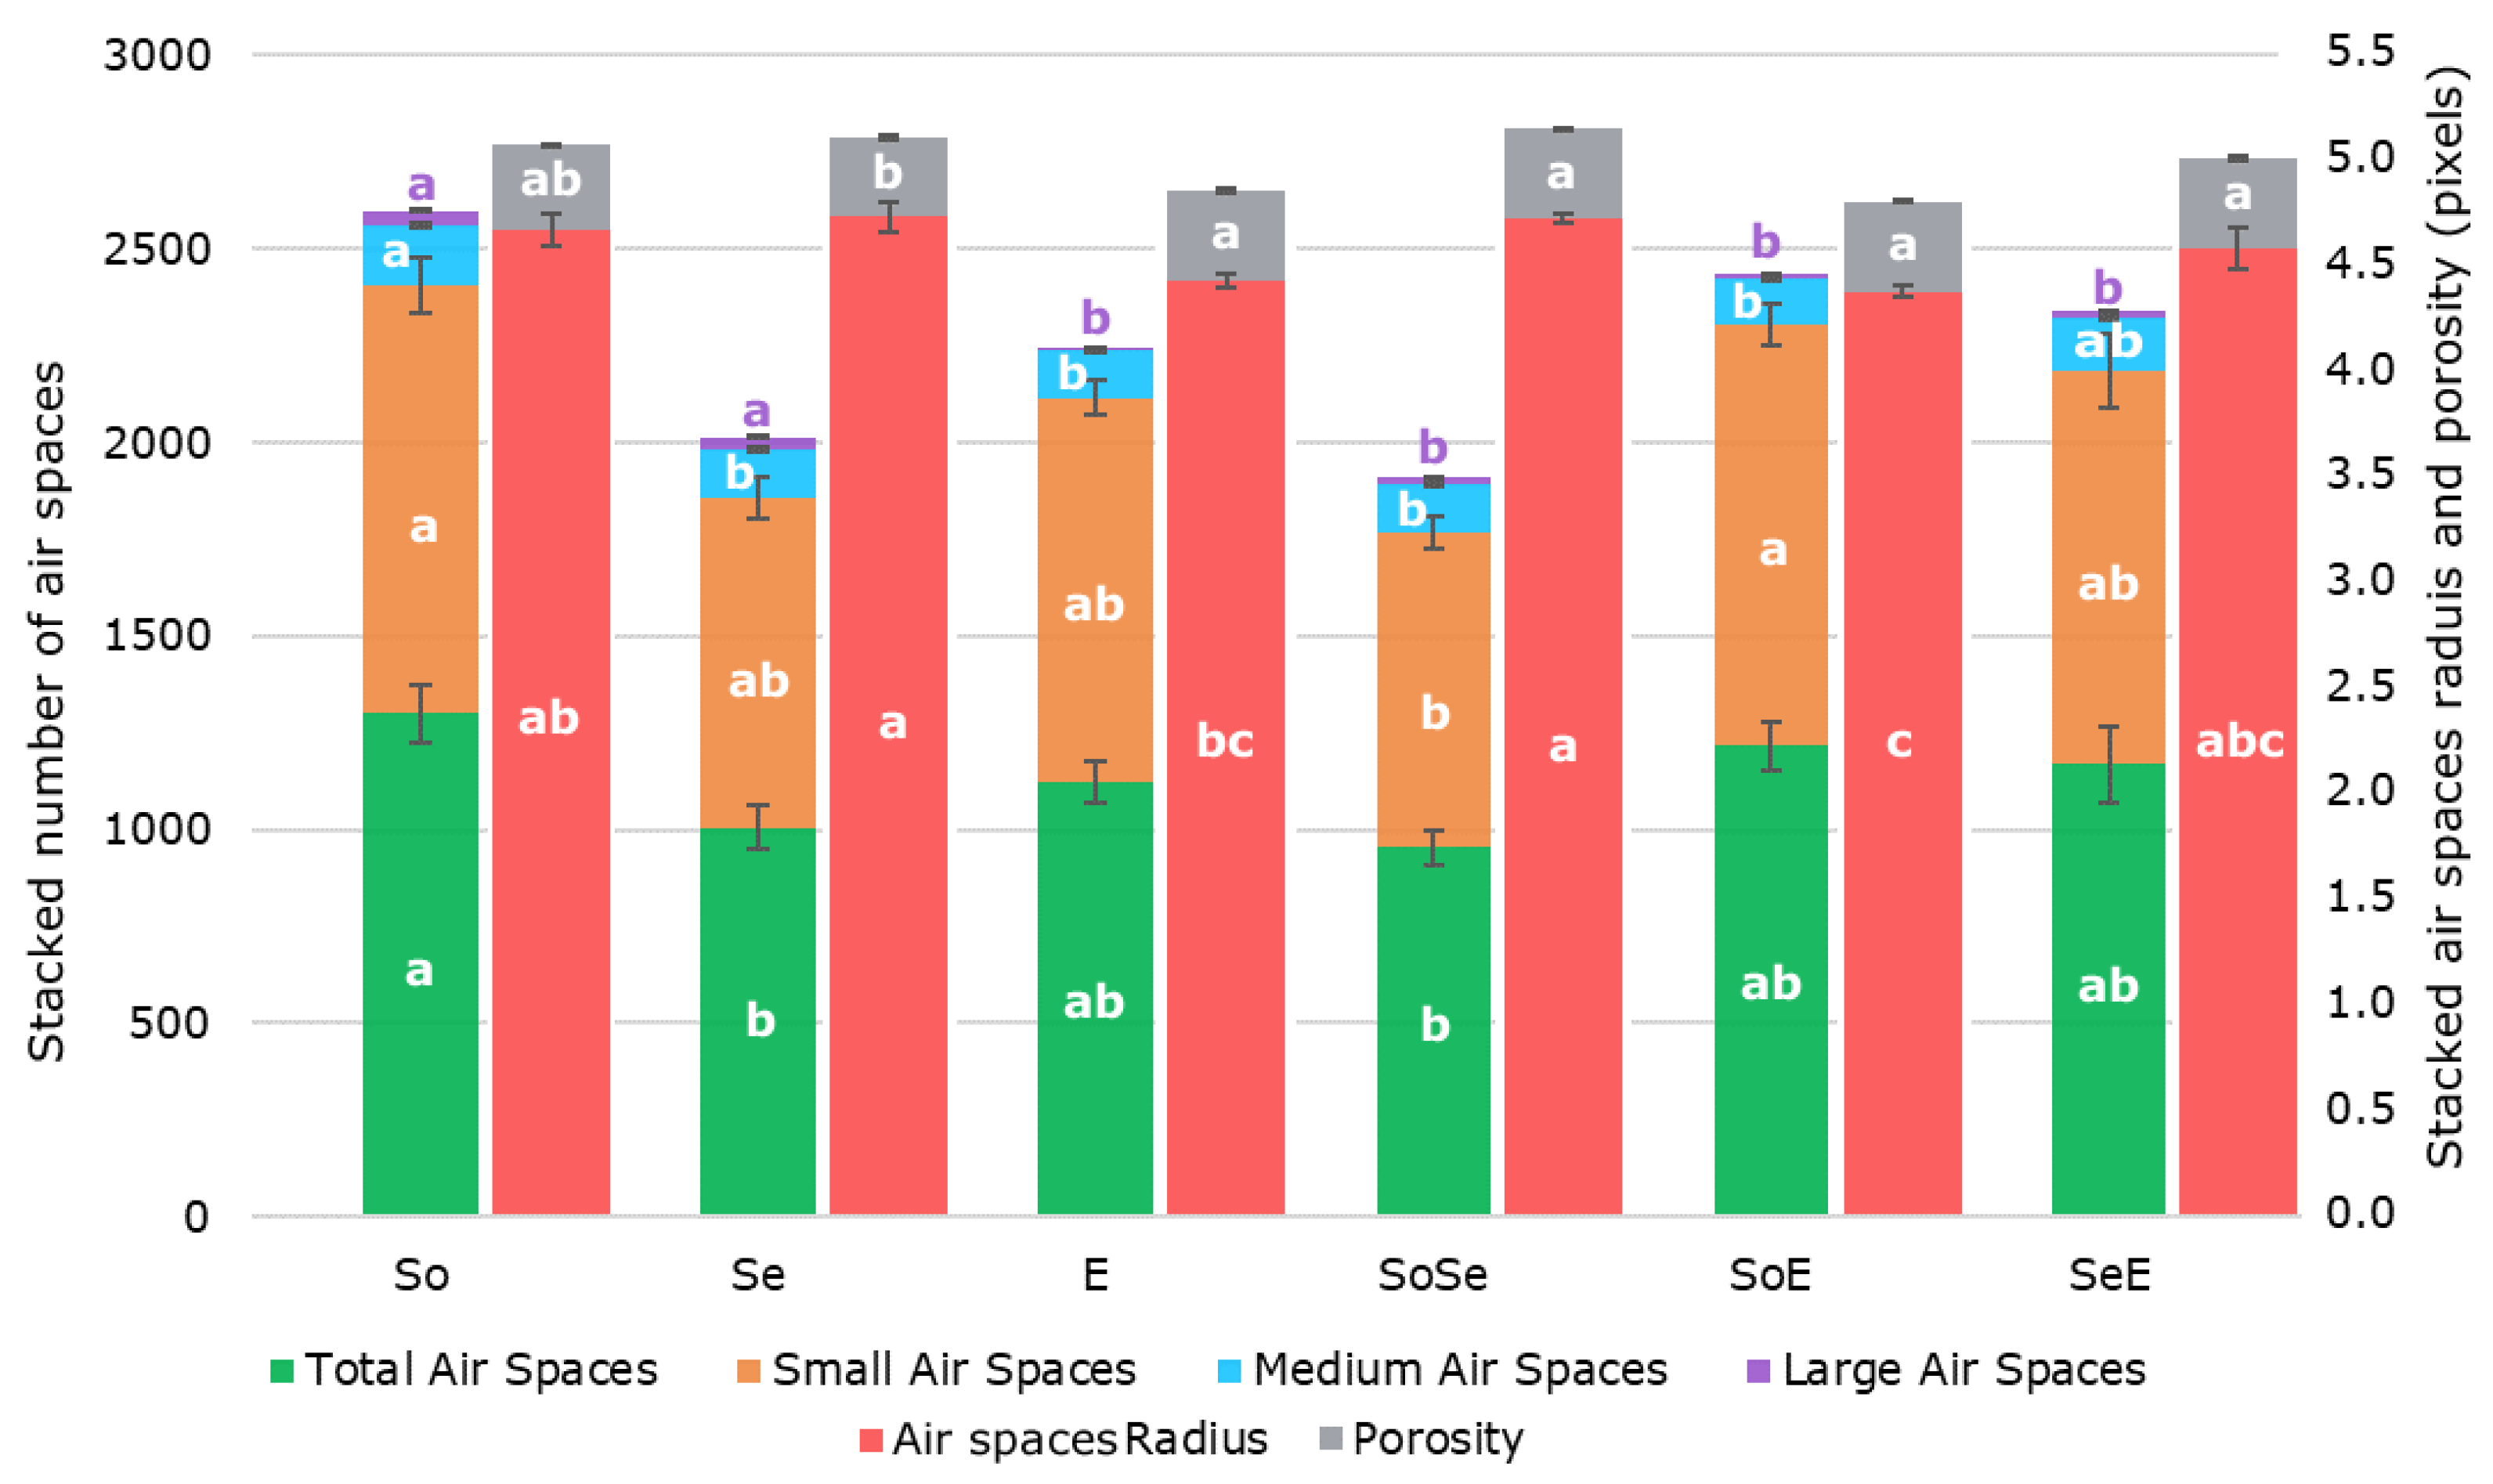
2.6. Computer Vision Analysis

Images of three bread slices of each treatment were taken using the 3× camera of a Samsung Galaxy S22 (Samsung, Seoul, Korea). Slices were placed inside a Lightbox 2 (2D PhotoBench 120, Ortery Technologies Inc., Irvine, CA, USA) to provide uniform lighting. Images were analyzed in three different sections from the crumb in Matlab® R2021a using a modified version of the code developed by Rabbani and Salehi [32] to assess porosity and air space size distribution. Figure 2 shows the images of the different stages of computer vision analysis.

2.7. Statistical Analysis and Machine Learning Modelling

Data from e-nose and physicochemical measurements were analyzed using ANOVA to assess statistically significant differences between samples with Tukey’s honest significant difference (HSD) post hoc test (α = 0.05) in XLSTAT 2020.3.1 (Addinsoft, New York, NY, USA). Furthermore, a multivariate data analysis based on principle components analysis (PCA) was developed in Matlab® R2021a using covariance to find relationships between variables and their associations with the samples and as parameter engineering for the ML models inputs and targets.
Four ML models were constructed using artificial neural networks (ANN) with a code developed in Matlab® 2021a, automatically testing 17 training algorithms to find the most accurate models with no under- or overfitting [28,33]. Models 1 and 2 were developed for classification using the absorbance values of NIR data and e-nose outputs, respectively as inputs to predict the type of wheat flour in the bread (i) soft wheat, (ii) semola, (iii) Emmer wheat, (iv) 50% soft wheat + 50% semola, (v) 50% soft wheat + 50% Emmer wheat, and (vi) 50% semola + 50% Emmer wheat (Figure 3a). Model 1 was constructed using the Levenberg Marquardt algorithm, while Model 2 used Bayesian Regularization. Data were randomly divided into 70:15:15 (%) for training, validation, and testing for Model 1 and 70:30 (%) for training and testing for Model 2. Performance was analyzed using means squared error (MSE).
Models 3 and 4 were developed using regression ANN with absorbance values of NIR data and e-nose outputs, respectively, to predict the peak area of 16 VAC (Figure 3b). Both models were developed using Bayesian Regularization algorithm. Data were randomly divided into 70:30 (%) for training and testing, respectively, using a performance algorithm based on MSE. A neuron trimming test was conducted for the four models to assess the optimal number of neurons with no under- or overfitting.

3. Results and Discussion

3.1. Analysis of Variance of Data from Digital Sensors Used (ANOVA)

Figure 4 shows that the crust and crumb of SB have different NIR signals. It can be observed that both the crust and crumb had overtones in the 1740–1810 nm range, where compounds such as aromatic hydrocarbons, thiols, aliphatic hydrocarbons, cellulose, water, and polyols/alcohols can be found [34]. Furthermore, both had an overtone at 1920–1936 nm, where amides, starch, and polysaccharides have been identified [34,35]. Even though the crust and crumb both have those similar overtones, these had higher absorbance units for the crumb compared to the crust. A more noticeable difference between the crust and crumb is the overtones found within 2050–2146 nm for the crust (Figure 4a), where compounds such as amides, proteins, urea, polymers, and polysaccharides have been found [34]. There were some overtones for both at >2270 nm, typical for polysaccharides, aliphatic hydrocarbons, starch, amides, and lipids [34,35]. It can be observed that for the crust, in the case of the SoSe sample, was the highest in absorbance units for all overtones, while Se was the lowest; on the contrary, for the crumb, Se was the lowest in absorbance units, while SeE was the lowest. Similar overtones and trends of the curves within the same wavelength range for the bread crumb have been reported in previous publications [36,37,38].
The use of NIR offers a chemical fingerprinting of SB related to the sensitivity of the instrument. The range of the NIR used is related to the absorbance overtones described before and can also be associated with aroma profiles for beer [18,19] and wine [26], physicochemical parameters in yogurt [39], and beer [19,40], protein content in beer [20], and consumers acceptability in yogurt [39] and beer [41], aging in wheat bread [36], and shelf life based on staling of bread [37,42], among others.
A total of 16 different VAC were found in the SB samples using GC-MS (Table 2; Table S1). It can be observed that most compounds are associated with aromas such as fruity, floral, green, and liquors. The compound α-Phenethyl alcohol was the highest in abundance for all samples, other compounds with the highest peak area detected in all samples were benzaldehyde, 2-pentylfuran, and ethyl octanoate. Bread samples with a combination of wheat flours had more VACs identified compared to the single wheat samples (Table S1). These VAC are consistent with VAC found for SB reported in other studies [6,43], especially using commercial yeast and lactic acid bacteria (LAB) [44].
Figure 5 shows significant differences (p < 0.05) between samples in all sensors integrated within the low-cost e-nose used in this study. It can be observed that semola bread (Se) was the highest in the MQ3 sensor (alcohol), and lowest in MQ136 (H2S) and MQ138 (benzene/alcohol/ammonia). Furthermore, soft wheat bread (So) was significantly lower (p < 0.05) than other samples in MQ3, MQ4, MQ8 (hydrogen), and MQ135 (ammonia/alcohol/benzene). On the other hand, the bread with the combination of soft wheat + semola (SoSe) was the highest in almost all the gas sensors except for MQ3 and MQ136. It is important to mention that the MG811 values are inverse; therefore, lower voltage implies higher CO2. The presence of H2S is expected in fermented samples as this compound is developed by the yeast [47] and is associated with a rotten egg smell [45]; therefore, it is likely to have a low concentration in food products to avoid any detectable off-aromas [30]. Other commercial e-noses have been used for SB to select the most effective factors on the aroma intensity [48], for quality assurance and control of bakery products [49], and for identification of key VAC in SB [50]. The low-cost e-nose presented in this study offers the opportunity for repeatable measurements within the whole breadmaking process and shelf-life assessments.
There were non-significant differences (p > 0.05) between samples for the texture of the crust and crumb and b from the CIELab color channel, as seen in Table 3. However, there were significant differences (p < 0.05) in pH, with the Emmer wheat bread with the highest (4.98) and soft wheat with the lowest (4.30), except for the Emmer wheat sample which was significantly higher, all samples were within the typical pH range (3.80–4.80) reported in previous publications for SB [51,52]. There were also significant differences (p < 0.05) between samples for color parameters L, a, R, G, and B, being the Emmer wheat treatment the darkest brown, as shown in Table 1. In terms of dimensions and weight, So sample was the longest (175 mm) and highest (90 mm), while SeE sample had the largest width (130.0 mm) and SoE was the heaviest (615.70 g). These differences directly affect the sensory profiles of the crust and crumb of SB for appearance, which is the first consumer perception available when selecting bread [53].
Figure 6 shows significant differences (p < 0.05) between samples in all air space variables analyzed using computer vision algorithms (Figure 2). It can be observed that soft wheat bread (So) had the highest total number of air spaces, while semola (Se) and soft wheat + semola (SoSe) had the lowest. Furthermore, both So and soft + Emmer wheat (SoE) samples had the highest number of small air spaces, while SoSe had the lowest. On the other hand, Se and SoSe samples had the highest mean air spaces radius, and Se presented the lowest porosity. These physical characteristics directly influence the texture of SB and, therefore, consumer appreciation and sensory descriptors. According to Table 3, Emmer wheat was the lowest in height and highest in weight; furthermore, it had a moderate total number of air spaces and was the lowest in large air spaces. This may be due to the firmer structure that this type of ancient wheat has in its starch granules and high protein content compared to soft wheat but lower than durum wheat [54], which is where semola flour is obtained. Therefore, based on this information, lower protein content in wheat (soft wheat) develops bread with a higher number of air spaces compared to those with high protein (durum wheat/semola).

3.2. Multivariate Data Analysis

Figure 7 shows that principal component one (PC1) represented 38% of data variability, while PC2 accounted for 25.11% (Total: 63.10%). The total data variability from PC1 and PC2 is higher than the cut-off point required for variables to be significant in PCA [55,56]. According to the factor loadings (FL), PC1 was mainly represented by a from the CIELab color channel (FL = 0.23), VAC10, and VAC13 (FL = 0.22) on the positive side of the component, and by L, R, and G (FL = −0.23) on the negative side. On the other hand, PC2 was mainly characterized by MQ7 (FL = 0.28), MQ135 (FL = 0.26), and VAC3 and VAC16 (FL = 0.25) on the positive side of the component and by total air spaces (FL = −0.25) and small air spaces (FL = −0.23) on the negative side. It can be observed that samples SoE and E were related among them and associated with variables such as MQ136, a, VAC6, VAC15, VAC9, and VAC14. In contrast, sample SeE was associated more with texture of the crumb and crust, small and total air spaces, with all these samples located on the positive side of the PC1. On the other hand, So was related to medium and large air spaces and length, while Se was inversely related to SeE and E and positively associated with width, VAC12, B, and maximum air space radius. Sample SoSe was located farthest from the other treatments and inversely related to SeE and had positive associations with VAC16, VAC3, VAC1, MQ7, and MQ3. Associations found between variables in this multivariate analysis confirm the reliability of the data to be successfully used for machine learning modelling, as presented in Section 3.3.

3.3. Machine Learning Modelling

Table 4 shows that Model 1 had an overall accuracy of 96% to classify samples according to their type of wheat using NIR absorbance values as inputs. The fact that the training MSE value (<0.01) is lower than the validation and training, and these two are similar (0.04 and 0.03, respectively) means there was no under- or overfitting of the data. On the other hand, Model 2, developed to classify samples according to the type of wheat using the e-nose outputs as inputs, had higher overall accuracy (99%) than Model 1. Similar to Model 1, this did not present signs of under- or overfitting since the training MSE value (<0.01) was lower than the testing (0.01).
Figure 8a shows the receiver operating characteristics (ROC) curve of Model 1; all samples were close to the true-positive rate (sensitivity), with the SoSe sample presenting the lowest sensitivity (83.3%). Figure 8b shows the ROC curve of Model 2, with all samples presenting very high sensitivity (>97%).
Table 5 shows that Model 3 had very high overall accuracy based on the correlation and determination coefficients (R = 0.97; R2 = 0.94) with high slope values for all stages (>0.97). Similarly, Model 4 presented very high accuracy (R = 0.99; R2 = 0.99) and slope values (>0.98). Furthermore, there were no signs of under- or overfitting since both models presented lower MSE values for the training than the testing stages.
Figure 9a shows the overall Model 3 with 95% prediction bounds; there were 1.97% outliers (34 out of 1728 data points), with the majority from VAC13 (27 out of 34 outliers). Likewise, Figure 9b depicts the overall Model 4, in which it can be observed that, according to the 95% prediction bounds, there were 3.06% outliers (88 out of 2880 data points). In this model, most outliers were also from VAC13 (44 out of 88 outliers), followed by VAC1 (24 out of 88 outliers).
Feeding the models with more samples will contribute to increasing the variability of the data, therefore, improving the model. However, the room for improvement from the accuracies reported in this paper does not warrant the requirement for more samples. If the added samples are different treatments to those used, it will help by making a more general model, which could be more widely used in different applications.
The high accuracy achieved by the models is in accordance with models and the results presented in other publications using NIR outputs as inputs to predict the peak area of volatile compounds in beer (R = 0.91) [19], detection of faulty aromas in beer (accuracy: 98%) [18] and wine (accuracy: 94–97%) [57]. Likewise, the accuracy of models reported in previous publications using e-nose inputs to predict the type of fermentation in beer (accuracy: 97%) [21], peak area of volatile compounds in coffee (R = 0.99) [24], beer (R = 0.97) [30], and wine (R = 0.99) [26], detection of faulty aromas in beer (accuracy: 96–97%) [18] and wine (accuracy: 92–97%) [57], and smoke taint in wines (accuracy: 98%) [25].
Even though the accuracy of models developed with both NIR and e-nose had very high accuracies, the advantages of the models developed with e-nose (Models 2 and 4) are that (i) they were more accurate and (ii) the device is more affordable and convenient to use as it is small, portable, and wireless [24,30]. In the commercial bakery industry, the e-nose may be installed at different stages of the bread production line to assess aromas development and detect any defects in time for early decision-making and improve quality, as well as for accelerated shelf-life analysis. On the other hand, it may be used by artisanal bakers as an affordable tool to assess their products quality traits and offer better products. For retailers, this e-nose is a very important device that may be used to develop allergen detection, authentication, and provenance assessment models.

4. Conclusions

The cost of digital technologies is continuously decreasing with the availability of connectivity of low-cost NIR and e-nose sensors to smartphones and tablet PCs. The digital technologies used in this study, coupled with ML modeling, could make it possible to implement AI technology for the breadmaking industry and artisan breadmakers. These ML models, especially Models 1 and 2, can also be implemented to assess the type of wheat used for traceability. Further models can be developed for quality assurance and composition verification purposes, such as the corroboration of gluten-based flour for celiac consumers and other ML models that could detect shelf life and development of spoilage microorganisms. The advancement in AI and digital technologies can become an important tool for fermented food and beverages, increasing consumer acceptance due to assurance of ingredients used, food security, quality traits, provenance, and estimative shelf life.

Supplementary Materials

The following supporting information can be downloaded at: https://www.mdpi.com/article/10.3390/fermentation8100516/s1, Figure S1: Diagram showing the bread making processing times and measurements for the loaf and slices; Table S1: Mean values ± standard error of the volatile aromatic compounds identified in the sourdough bread samples using gas chromatography mass spectroscopy.

Author Contributions

Conceptualization, C.G.V. and S.F.; data curation, C.G.V. and S.F.; formal analysis, C.G.V. and S.F.; investigation, C.G.V. and S.F.; methodology, C.G.V., N.M.H. and S.F.; project administration, C.G.V. and S.F.; resources, C.G.V. and S.F.; software, C.G.V. and S.F.; validation, C.G.V., N.M.H. and S.F.; visualization, C.G.V., N.M.H. and S.F.; writing—original draft, C.G.V. and S.F.; writing—review and editing, C.G.V., N.M.H. and S.F. All authors have read and agreed to the published version of the manuscript.

Funding

This research received no external funding.

Institutional Review Board Statement

Not applicable.

Informed Consent Statement

Not applicable.

Data Availability Statement

Data and intellectual property belong to The University of Melbourne; any sharing needs to be evaluated and approved by the University.

Acknowledgments

The authors want to acknowledge Robyn Warner from The University of Melbourne for providing access to the GC-MS equipment and NIST library.

Conflicts of Interest

The authors declare no conflict of interest.

References

  1. Ma, S.; Wang, Z.; Guo, X.; Wang, F.; Huang, J.; Sun, B.; Wang, X. Sourdough improves the quality of whole-wheat flour products: Mechanisms and challenges—A review. Food Chem. 2021, 360, 130038. [Google Scholar] [CrossRef]
  2. Sofo, A.; Galluzzi, A.; Zito, F. A Modest Suggestion: Baking Using Sourdough-a Sustainable, Slow-Paced, Traditional and Beneficial Remedy against Stress during the Covid-19 Lockdown. Hum. Ecol. 2021, 49, 99–105. [Google Scholar] [CrossRef]
  3. Calvert, M.D.; Madden, A.A.; Nichols, L.M.; Haddad, N.M.; Lahne, J.; Dunn, R.R.; McKenney, E.A. A review of sourdough starters: Ecology, practices, and sensory quality with applications for baking and recommendations for future research. PeerJ 2021, 9, e11389. [Google Scholar] [CrossRef]
  4. Gänzle, M.G.; Zheng, J. Lifestyles of sourdough lactobacilli–Do they matter for microbial ecology and bread quality? Int. J. Food Microbiol. 2019, 302, 15–23. [Google Scholar] [CrossRef]
  5. Mezgebe, A.G.; Taylor, J.R.; de Kock, H.L. Influence of waxy (high amylopectin) and high protein digestibility traits in sorghum on injera sourdough-type flatbread sensory characteristics. Foods 2020, 9, 1749. [Google Scholar] [CrossRef]
  6. Pétel, C.; Onno, B.; Prost, C. Sourdough volatile compounds and their contribution to bread: A review. Trends Food Sci. Technol. 2017, 59, 105–123. [Google Scholar] [CrossRef]
  7. Hanis-Syazwani, M.; Bolarinwa, I.; Lasekan, O.; Muhammad, K. Influence of starter culture on the physicochemical properties of rice bran sourdough and physical quality of sourdough bread. Food Res. 2018, 2, 340–349. [Google Scholar] [CrossRef]
  8. Ogunsakin, O.; Banwo, K.; Ogunremi, O.; Sanni, A. Microbiological and physicochemical properties of sourdough bread from sorghum flour. Int. Food Res. J. 2015, 22, 2610–2618. [Google Scholar]
  9. Breads, M.S. Microbiological and Physicochemical Properties of Wholegrain. Int. J. 2019, 4, 074–082. [Google Scholar]
  10. Limbad, M.; Gutierrez Maddox, N.; Hamid, N.; Kantono, K. Sensory and physicochemical characterization of sourdough bread prepared with a coconut water kefir starter. Foods 2020, 9, 1165. [Google Scholar] [CrossRef]
  11. Lubis, Y.; Putri, C.; Rohaya, S. Physicochemical properties of sourdough bread made from local variety sweet potato and pineapple juice. IOP Conf. Ser. Earth Environ. Sci. 2020, 425, 012079. [Google Scholar]
  12. Olojede, A.; Sanni, A.; Banwo, K. Rheological, textural and nutritional properties of gluten-free sourdough made with functionally important lactic acid bacteria and yeast from Nigerian sorghum. LWT 2020, 120, 108875. [Google Scholar] [CrossRef]
  13. Torrieri, E.; Pepe, O.; Ventorino, V.; Masi, P.; Cavella, S. Effect of sourdough at different concentrations on quality and shelf life of bread. LWT-Food Sci. Technol. 2014, 56, 508–516. [Google Scholar] [CrossRef]
  14. Crowley, P.; Schober, T.J.; Clarke, C.I.; Arendt, E.K. The effect of storage time on textural and crumb grain characteristics of sourdough wheat bread. Eur. Food Res. Technol. 2002, 214, 489–496. [Google Scholar] [CrossRef]
  15. Fuentes, S.; Tongson, E.; Gonzalez Viejo, C. Novel digital technologies implemented in sensory science and consumer perception. Curr. Opin. Food Sci. 2021, 41, 99–106. [Google Scholar] [CrossRef]
  16. Fuentes, S.; Gonzalez Viejo, C.; Torrico, D.; Dunshea, F. Development of a biosensory computer application to assess physiological and emotional responses from sensory panelists. Sensors 2018, 18, 2958. [Google Scholar] [CrossRef] [Green Version]
  17. Plemmons, L.; Resurreccion, A. Note on computerized data collection in consumer sensory evaluation. J. Sens. Stud. 1999, 14, 19–34. [Google Scholar] [CrossRef]
  18. Gonzalez Viejo, C.; Fuentes, S.; Hernandez-Brenes, C. Smart Detection of Faults in Beers Using Near-Infrared Spectroscopy, a Low-Cost Electronic Nose and Artificial Intelligence. Fermentation 2021, 7, 117. [Google Scholar] [CrossRef]
  19. Gonzalez Viejo, C.; Fuentes, S. Beer Aroma and Quality Traits Assessment Using Artificial Intelligence. Fermentation 2020, 6, 56. [Google Scholar] [CrossRef]
  20. Gonzalez Viejo, C.; Caboche, C.H.; Kerr, E.D.; Pegg, C.L.; Schulz, B.L.; Howell, K.; Fuentes, S. Development of a Rapid Method to Assess Beer Foamability Based on Relative Protein Content Using RoboBEER and Machine Learning Modeling. Beverages 2020, 6, 28. [Google Scholar] [CrossRef]
  21. Gonzalez Viejo, C.; Fuentes, S. Low-Cost Methods to Assess Beer Quality Using Artificial Intelligence Involving Robotics, an Electronic Nose, and Machine Learning. Fermentation 2020, 6, 104. [Google Scholar] [CrossRef]
  22. Gonzalez Viejo, C.; Fuentes, S.; Torrico, D.; Howell, K.; Dunshea, F. Assessment of Beer Quality Based on a Robotic Pourer, Computer Vision, and Machine Learning Algorithms Using Commercial Beers. J. Food Sci. 2018, 83, 1381–1388. [Google Scholar] [CrossRef]
  23. Gonzalez Viejo, C.; Fuentes, S.; Li, G.; Collmann, R.; Condé, B.; Torrico, D. Development of a robotic pourer constructed with ubiquitous materials, open hardware and sensors to assess beer foam quality using computer vision and pattern recognition algorithms: RoboBEER. Food Res. Int. 2016, 89, 504–513. [Google Scholar] [CrossRef]
  24. Gonzalez Viejo, C.; Tongson, E.; Fuentes, S. Integrating a Low-Cost Electronic Nose and Machine Learning Modelling to Assess Coffee Aroma Profile and Intensity. Sensors 2021, 21, 2016. [Google Scholar] [CrossRef]
  25. Summerson, V.; Gonzalez Viejo, C.; Torrico, D.D.; Pang, A.; Fuentes, S. Digital Smoke Taint Detection in Pinot Grigio Wines Using an E-Nose and Machine Learning Algorithms Following Treatment with Activated Carbon and a Cleaving Enzyme. Fermentation 2021, 7, 119. [Google Scholar] [CrossRef]
  26. Summerson, V.; Gonzalez Viejo, C.; Pang, A.; Torrico, D.D.; Fuentes, S. Assessment of Volatile Aromatic Compounds in Smoke Tainted Cabernet Sauvignon Wines Using a Low-Cost E-Nose and Machine Learning Modelling. Molecules 2021, 26, 5108. [Google Scholar] [CrossRef]
  27. Winters, M.; Panayotides, D.; Bayrak, M.; Rémont, G.; Viejo, C.G.; Liu, D.; Le, B.; Liu, Y.; Luo, J.; Zhang, P. Defined co-cultures of yeast and bacteria modify the aroma, crumb and sensory properties of bread. J. Appl. Microbiol. 2019, 127, 778–793. [Google Scholar] [CrossRef]
  28. Gonzalez Viejo, C.; Torrico, D.; Dunshea, F.; Fuentes, S. Emerging Technologies Based on Artificial Intelligence to Assess the Quality and Consumer Preference of Beverages. Beverages 2019, 5, 62. [Google Scholar] [CrossRef] [Green Version]
  29. Gonzalez Viejo, C.; Fuentes, S.; Torrico, D.; Godbole, A.; Dunshea, F. Chemical characterization of aromas in beer and their effect on consumers liking. Food Chem. 2019, 293, 479–485. [Google Scholar] [CrossRef]
  30. Gonzalez Viejo, C.; Fuentes, S.; Godbole, A.; Widdicombe, B.; Unnithan, R.R. Development of a low-cost e-nose to assess aroma profiles: An artificial intelligence application to assess beer quality. Sens. Actuators B Chem. 2020, 308, 127688. [Google Scholar] [CrossRef]
  31. Park, Y.-H.; Jung, L.-H.; Jeon, E.-R. Quality characteristics of bread using sour dough. Prev. Nutr. Food Sci. 2006, 11, 323–327. [Google Scholar] [CrossRef]
  32. Rabbani, A.; Salehi, S. Dynamic modeling of the formation damage and mud cake deposition using filtration theories coupled with SEM image processing. J. Nat. Gas Sci. Eng. 2017, 42, 157–168. [Google Scholar] [CrossRef]
  33. Gonzalez Viejo, C.; Torrico, D.; Dunshea, F.; Fuentes, S. Development of Artificial Neural Network Models to Assess Beer Acceptability Based on Sensory Properties Using a Robotic Pourer: A Comparative Model Approach to Achieve an Artificial Intelligence System. Beverages 2019, 5, 33. [Google Scholar] [CrossRef]
  34. Ciurczak, E.W.; Igne, B.; Workman, J., Jr.; Burns, D.A. Handbook of Near-Infrared Analysis; CRC Press: Boca Raton, FL, USA, 2021. [Google Scholar]
  35. Burns, D.A.; Ciurczak, E.W. Handbook of Near-Infrared Analysis; CRC Press: Boca Raton, FL, USA, 2007. [Google Scholar]
  36. Ringsted, T.; Siesler, H.W.; Engelsen, S.B. Monitoring the staling of wheat bread using 2D MIR-NIR correlation spectroscopy. J. Cereal Sci. 2017, 75, 92–99. [Google Scholar] [CrossRef]
  37. Wilson, R.; Goodfellow, B.; Belton, P.; Osborne, B.; Oliver, G.; Russell, P. Comparison of Fourier transform mid infrared spectroscopy and near infrared reflectance spectroscopy with differential scanning calorimetry for the study of the staling of bread. J. Sci. Food Agric. 1991, 54, 471–483. [Google Scholar] [CrossRef]
  38. Cevoli, C.; Gianotti, A.; Troncoso, R.; Fabbri, A. Quality evaluation by physical tests of a traditional Italian flat bread Piadina during storage and shelf-life improvement with sourdough and enzymes. Eur. Food Res. Technol. 2015, 240, 1081–1089. [Google Scholar] [CrossRef]
  39. Gupta, M.K.; Viejo, C.G.; Fuentes, S.; Torrico, D.D.; Saturno, P.C.; Gras, S.L.; Dunshea, F.R.; Cottrell, J.J. Digital technologies to assess yoghurt quality traits and consumers acceptability. J. Sci. Food Agric. 2022, 102, 5642–5652. [Google Scholar] [CrossRef]
  40. Gonzalez Viejo, C.; Fuentes, S.; Torrico, D.; Howell, K.; Dunshea, F. Assessment of beer quality based on foamability and chemical composition using computer vision algorithms, near infrared spectroscopy and machine learning algorithms. J. Sci. Food Agric. 2018, 98, 618–627. [Google Scholar] [CrossRef]
  41. Gonzalez Viejo, C.; Fuentes, S. A Digital Approach to Model Quality and Sensory Traits of Beers Fermented under Sonication Based on Chemical Fingerprinting. Fermentation 2020, 6, 73. [Google Scholar] [CrossRef]
  42. Xie, F.; Dowell, F.E.; Sun, X.S. Comparison of near-infrared reflectance spectroscopy and texture analyzer for measuring wheat bread changes in storage. Cereal Chem. 2003, 80, 25–29. [Google Scholar] [CrossRef] [Green Version]
  43. Amann, L.S.; Frank, O.; Dawid, C.; Hofmann, T.F. The Sensory-Directed Elucidation of the Key Tastants and Odorants in Sourdough Bread Crumb. Foods 2022, 11, 2325. [Google Scholar] [CrossRef]
  44. Birch, A.N.; Petersen, M.A.; Arneborg, N.; Hansen, Å.S. Influence of commercial baker’s yeasts on bread aroma profiles. Food Res. Int. 2013, 52, 160–166. [Google Scholar] [CrossRef]
  45. The Good Scents Company. The Good Scents Company Information System. Available online: http://www.thegoodscentscompany.com/data/rw1038291.html (accessed on 3 September 2022).
  46. Li, Z.; Wang, J. Identification and similarity analysis of aroma substances in main types of Fenghuang Dancong tea. PLoS ONE 2020, 15, e0244224. [Google Scholar] [CrossRef] [PubMed]
  47. Ugliano, M.; Kolouchova, R.; Henschke, P.A. Occurrence of hydrogen sulfide in wine and in fermentation: Influence of yeast strain and supplementation of yeast available nitrogen. J. Ind. Microbiol. Biotechnol. 2011, 38, 423–429. [Google Scholar] [CrossRef]
  48. Farahmand, E.; Razavi, S.H.; Mohtasebi, S.S. Investigating effective variables to produce desirable aroma in sourdough using e-nose and sensory panel. J. Food Process. Preserv. 2021, 45, e15157. [Google Scholar] [CrossRef]
  49. Ghasemi-Varnamkhasti, M.; Lozano, J. Electronic nose as an innovative measurement system for the quality assurance and control of bakery products: A review. Eng. Agric. Environ. Food 2016, 9, 365–374. [Google Scholar] [CrossRef]
  50. Yan, B.; Sadiq, F.A.; Cai, Y.; Fan, D.; Zhang, H.; Zhao, J.; Chen, W. Identification of key aroma compounds in type I sourdough-based Chinese steamed bread: Application of untargeted metabolomics analysisp. Int. J. Mol. Sci. 2019, 20, 818. [Google Scholar] [CrossRef] [PubMed] [Green Version]
  51. Ventimiglia, G.; Alfonzo, A.; Galluzzo, P.; Corona, O.; Francesca, N.; Caracappa, S.; Moschetti, G.; Settanni, L. Codominance of Lactobacillus plantarum and obligate heterofermentative lactic acid bacteria during sourdough fermentation. Food Microbiol. 2015, 51, 57–68. [Google Scholar] [CrossRef] [Green Version]
  52. Pepe, O.; Ventorino, V.; Cavella, S.; Fagnano, M.; Brugno, R. Prebiotic content of bread prepared with flour from immature wheat grain and selected dextran-producing lactic acid bacteria. Appl. Environ. Microbiol. 2013, 79, 3779–3785. [Google Scholar] [CrossRef] [Green Version]
  53. Callejo, M.J. Present situation on the descriptive sensory analysis of bread. J. Sens. Stud. 2011, 26, 255–268. [Google Scholar] [CrossRef]
  54. Șerban, L.R.; Păucean, A.; Man, S.M.; Chiş, M.S.; Mureşan, V. Ancient Wheat Species: Biochemical Profile and Impact on Sourdough Bread Characteristics—A Review. Processes 2021, 9, 2008. [Google Scholar] [CrossRef]
  55. Deep, K.; Jain, M.; Salhi, S. Logistics, Supply Chain and Financial Predictive Analytics: Theory and Practices; Springer: Berlin/Heidelberg, Germany, 2018. [Google Scholar]
  56. Hair, J.F.; Anderson, R.E.; Tatham, R.L.; Black, W.C. Multivariate Data Analysis New Jersey; Pearson Education: London, UK, 2010. [Google Scholar]
  57. Gonzalez Viejo, C.; Fuentes, S. Digital Assessment and Classification of Wine Faults Using a Low-Cost Electronic Nose, Near-Infrared Spectroscopy and Machine Learning Modelling. Sensors 2022, 22, 2303. [Google Scholar] [CrossRef]
Figure 1. Slices of the different treatments of sourdough bread made with different types of flour (a) soft wheat, (b) semola, (c) Emmer wheat, (d) soft wheat + semola, (e) soft + Emmer wheat, and (f) semola + Emmer wheat developed for this study.
Fermentation 08 00516 g001
Figure 2. Images of the computer vision analysis to assess porosity and air spaces of the sourdough bread slices, where (a) original image, (b) depth map, (c) pore space segmentation, and (d) histogram of the pore size distribution.
Fermentation 08 00516 g002
Figure 3. Diagrams of the machine learning (a) classification Models 1 and 2 and (b) regression Models 3 and 4 showing the specific inputs, targets, and number of neurons used. Abbreviations: W: weights; b: bias.
Fermentation 08 00516 g003
Figure 4. Near-infrared spectroscopy curves within the 1596–2395 nm range for the sourdough bread (a) crust and the crumb (b).
Fermentation 08 00516 g004
Figure 5. Stacked graph showing the mean voltage of the nine different gas sensors integrated into the electronic nose. Different letters a–d depict significant differences between samples based on the ANOVA and Tukey’s honest significant difference (HSD) post hoc test (α = 0.05). Abbreviations: So: soft wheat; Se: semola; E: Emmer wheat; SoSe: soft wheat and semola; SoE: soft and Emmer wheat; SeE: semola and Emmer wheat; CO: carbon monoxide; H2S: hydrogen sulfide; CO2: carbon dioxide.
Fermentation 08 00516 g005
Figure 6. Stacked graph showing the mean values of the number of air spaces assessed from images of bread slices (Figure 2; primary y-axis; green, orange, blue, and purple bars) and the air space radius and porosity (secondary y-axis; red and gray bars). Different letters a–c depict significant differences between samples based on the ANOVA and Tukey’s honest significant difference (HSD) post hoc test (α = 0.05). Abbreviations: So: soft wheat; Se: semola; E: Emmer wheat; SoSe: soft wheat and semola; SoE: soft and Emmer wheat; SeE: semola and Emmer wheat.
Fermentation 08 00516 g006
Figure 7. Principal components analysis (PCA) showing all variables from volatile aromatic compounds (VAC; red), volatile compounds assessed using the electronic nose (gray), color (green), chemical (blue), texture (brown), and physical (purple) measurements. Abbreviations: PC1 and PC2: principal components one and two; Max: maximum; So: soft wheat; Se: semola; E: Emmer wheat; SoSe: soft wheat and semola; SoE: soft and Emmer wheat; SeE: semola and Emmer wheat.
Fermentation 08 00516 g007
Figure 8. Receiver operating characteristics (ROC) curves for (a) Model 1 and (b) Model 2.
Fermentation 08 00516 g008
Figure 9. Overall Models 3 (a) and 4 (b) showing the data points of each target as well as the fitting line and 95% prediction bounds. Abbreviations: VAC: volatile aromatic compounds; T: targets; R: correlation coefficient.
Fermentation 08 00516 g009
Table 1. Formulation used to make the six sourdough bread treatments.
IngredientAmount
Starter
Flour80 g
Salt2.5 g
Culture0.1 g
Water80 mL
Dough
Sourdough Starter1 cup
Flour400 g
Salt5 g
Water150 mL
Table 2. Volatile aromatic compounds identified in the sourdough bread samples using gas chromatography-mass spectroscopy.
LabelCommon NameAroma *
VAC1Methyl isocyanatePungent
VAC2StyreneBalsamic/Floral/Sweet
VAC34-Ethylbenzoic acid, hexyl esterNR
VAC4BenzaldehydeAlmond/Cherry
VAC52,2,4,6,6-pentamethyl heptaneIrritating odor (found in tea) **
VAC62-pentylfuranFruity/Green/Earthy/Beany
VAC7Ethyl hexanoateFruity/Pineapple/Waxy/Green/Banana
VAC8D-LimoneneCitrus/Orange/Fresh
VAC95-Ethylcyclopent-1-enecarboxaldehydeNR
VAC10BenzeneacetaldehydeGreen/Sweet/Floral/Clover/Honey/Cocoa
VAC11Ethyl heptanoateFruity/Pineapple/Cognac/Rum/Wine
VAC12α-Phenethyl alcoholSweet/Gardenia/Medicinal
VAC13Ethyl octanoateFruity/Winey/Mushroom/Banana
VAC14(Z)-3-nonen-1-olFresh/Waxy/Green/Melon/Mushroom
VAC15Phenethyl formateRose/Green/Herbal
VAC16Ethyl decanoateWaxy/Apple/Grape/Brandy
Abbreviations: VAC: volatile aromatic compounds; NR: not reported. * Associated aromas were obtained from The Good Scents Company [45]. ** This associated aroma was obtained from Li and Wang [46].
Table 3. Mean values ± standard error of the physicochemical data of each sourdough bread treatment.
SampleWeightHeight (mm)Length (mm)Width (mm)Texture Crust NSTexture of the Crumb NSpHSaltLab NSRGBColour
Soft wheat604.059017512944.3849.834.30 d0.11 b66.13 a3.05 b18.04175.67 ab158.50 a128.33 a
±0.00±0.00±0.00±0.00±7.78±1.44±0.01±0.00±2.91±0.40±1.77±9.21±7.42±4.45
Semola597.158017512831.4345.784.55 c0.13 a67.77 a2.89 b26.83182.83 a162.50 a116.50 ab
±0.00±0.00±0.00±0.00±2.98±6.01±0.02±<0.01±2.17±1.10±2.02±7.35±5.61±4.56
Emmer wheat615.007017511649.149.14.98 a0.13 a50.19 b9.17 a23.06143.33 c113.33 b80.50 c
±0.00±0.00±0.00±0.00±9.08±9.08±0.00±<0.01±1.32±1.61±2.06±1.69±4.29±6.35
Soft wheat + Semola614.509017212541.8741.814.67 bc0.12 ab67.05 a3.67 b22.42180.33 ab160.50 a122.67 a
±0.00±0.00±0.00±0.00±5.85±5.88±0.03±<0.01±1.86±1.24±3.59±6.77±4.85±6.58
Soft + Emmer wheat615.707117112640.0555.174.77 b0.13 a54.66 b7.53 ab22.14153.00 bc125.50 b92.50 c
±0.00±0.00±0.00±0.00±4.11±5±0.03±<0.01±1.29±1.39±2.76±5.37±3.11±4.45
Semola + Emmer wheat557.557117313035.6847.054.63 bc0.11 b57.47 b7.14 ab23.4160.33 abc133.00 b97.33 bc
±0.00±0.00±0.00±0.00±2.97±3.01±0.07±0.01±2.02±1.29±2.19±6.30±5.32±5.40
Different letters a–d depict significant differences between samples based on the ANOVA and Tukey’s honest significant difference (HSD) post hoc test (α = 0.05). Abbreviations: NS: non-significant.
Table 4. Classification artificial neural network results for Models 1 and 2. Abbreviations: MSE: means squared error.
StageSamplesAccuracyErrorPerformance
(MSE)
Model 1: Inputs: near-infrared; Targets: type of wheat
Training76100%0.0%<0.01
Validation1687.5%12.5%0.04
Testing1687.5%12.5%0.03
Overall10896.3%3.7%-
Model 2: Inputs: electronic nose; Targets: type of wheat
Training126100%0.0%<0.01
Testing5498.1%1.9%0.01
Overall18099.4%0.6%-
Table 5. The results of the artificial neural network regression Models 3 and 4. Abbreviations: R: correlation coefficient; R2: determination coefficient; MSE: means squared error.
StageSamplesObservationsRR2SlopePerformance
(MSE)
Model 3: Inputs: near-infrared; Targets: volatile aromatic compounds
Training7612161.001.001.000.66 × 1010
Testing325120.900.820.97157.37 × 1010
Overall10817280.970.940.99-
Model 4: Inputs: electronic nose; Targets: volatile aromatic compounds
Training12620161.001.001.003.21 × 1010
Testing5410240.990.970.9818.64 × 1010
Overall18028800.990.990.99-
Publisher’s Note: MDPI stays neutral with regard to jurisdictional claims in published maps and institutional affiliations.

