Article

Methods for Oxygenation of Continuous Cultures of Brewer’s Yeast, Saccharomyces cerevisiae

by
Timothy Granata
1,*,
Cindy Follonier
1,2,
Chiara Burkhardt
1,2 and
Bernd Rattenbacher
1,2
1
Space Science Hub and Space Biology Group, Center for Bio- & Medical Engineering, Lucerne University of Applied Sciences and Arts, Obermattweg 9, 6058 Hergiswil, Switzerland
2
Biotechnology Space Support Center, Obermattweg 9, 6058 Hergiswil, Switzerland
*
Author to whom correspondence should be addressed.
Fermentation 2021, 7(4), 282; https://doi.org/10.3390/fermentation7040282
Submission received: 9 November 2021 / Revised: 19 November 2021 / Accepted: 22 November 2021 / Published: 26 November 2021
(This article belongs to the Special Issue Yeast Biotechnology 5.0)

Abstract

:
Maintaining steady-state, aerobic cultures of yeast in a bioreactor depends on the configuration of the bioreactor system as well as the growth medium used. In this paper, we compare several conventional aeration methods with newer filter methods using a novel optical sensor array to monitor dissolved oxygen, pH, and biomass. With conventional methods, only a continuously stirred tank reactor configuration gave high aeration rates for cultures in yeast extract peptone dextrose (YPD) medium. For filters technologies, only a polydimethylsiloxan filter provided sufficient aeration of yeast cultures. Further, using the polydimethylsiloxan filter, the YPD medium gave inferior oxygenation rates of yeast compared to superior results with Synthetic Complete medium. It was found that the YPD medium itself, not the yeast cells, interfered with the filter giving the low oxygen transfer rates based on the volumetric transfer coefficient (KLa). The results are discussed for implications of miniaturized bioreactors in low-gravity environments.

Graphical Abstract

1. Introduction

Many experiments conducted with Brewer’s yeast, Saccharomyces cerevisiae, use batch and continuous cultures to rear cells in growth medium. For aerobic cultures, however, oxygenation of media is often problematic and different methods have been proposed for different growth media [1]. Common methods for aerating yeast cultures are bubbling, shaking, or stirring, which promotes oxygen transfer into the culture through the free surface while newer methods use filters for aeration [1]. Some of these methods pose problems, such as the use of commercially available yeast extract peptone dextrose (YPD) medium which foams when bubbled constantly or intermittently and may oxidize compounds in the medium. Anti-foaming agents can be used, but they too may alter the composition of the medium. For situations where the free surface area is reduced or absent, oxygen is not replenished in the head space and stirring and shaking cannot be used. Therefore, other methods are needed to aerate the yeast. Additionally, if cell cultures remove oxygen faster than it can be supplied, which occurs when biomass concentrations and cell respiration rates are very high, then more effective methods are needed to replenish oxygen [2]. One of the main reasons for studying newer oxygen transfer technologies, particularly aeration filters, is to combine these with miniaturized bioreactors and sensors to improve bioreactor design for applications in space. In microgravity, head space, and thus shaking and stirring of cultures, are not feasible, nor is bubbling medium with air or oxygen [3]. Also critical is a small system size since the payload is limited [3].
Recent reviews of bioreactor aeration discuss a variety of methods [4,5,6]. There are also many variables that can influence aeration including temperature, mixing rate, membranes, biomass concentration, and media [7,8,9,10]. In this study, we use a novel sensor array to compare different filter technologies and media to conventional methods to determine if the methods can be used in space to oxygenate yeast cultures.

2. Materials and Methods

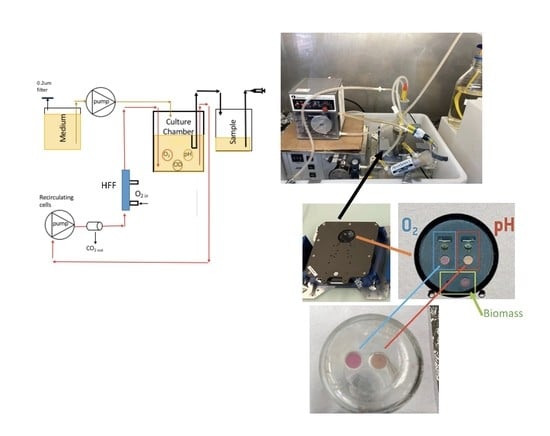
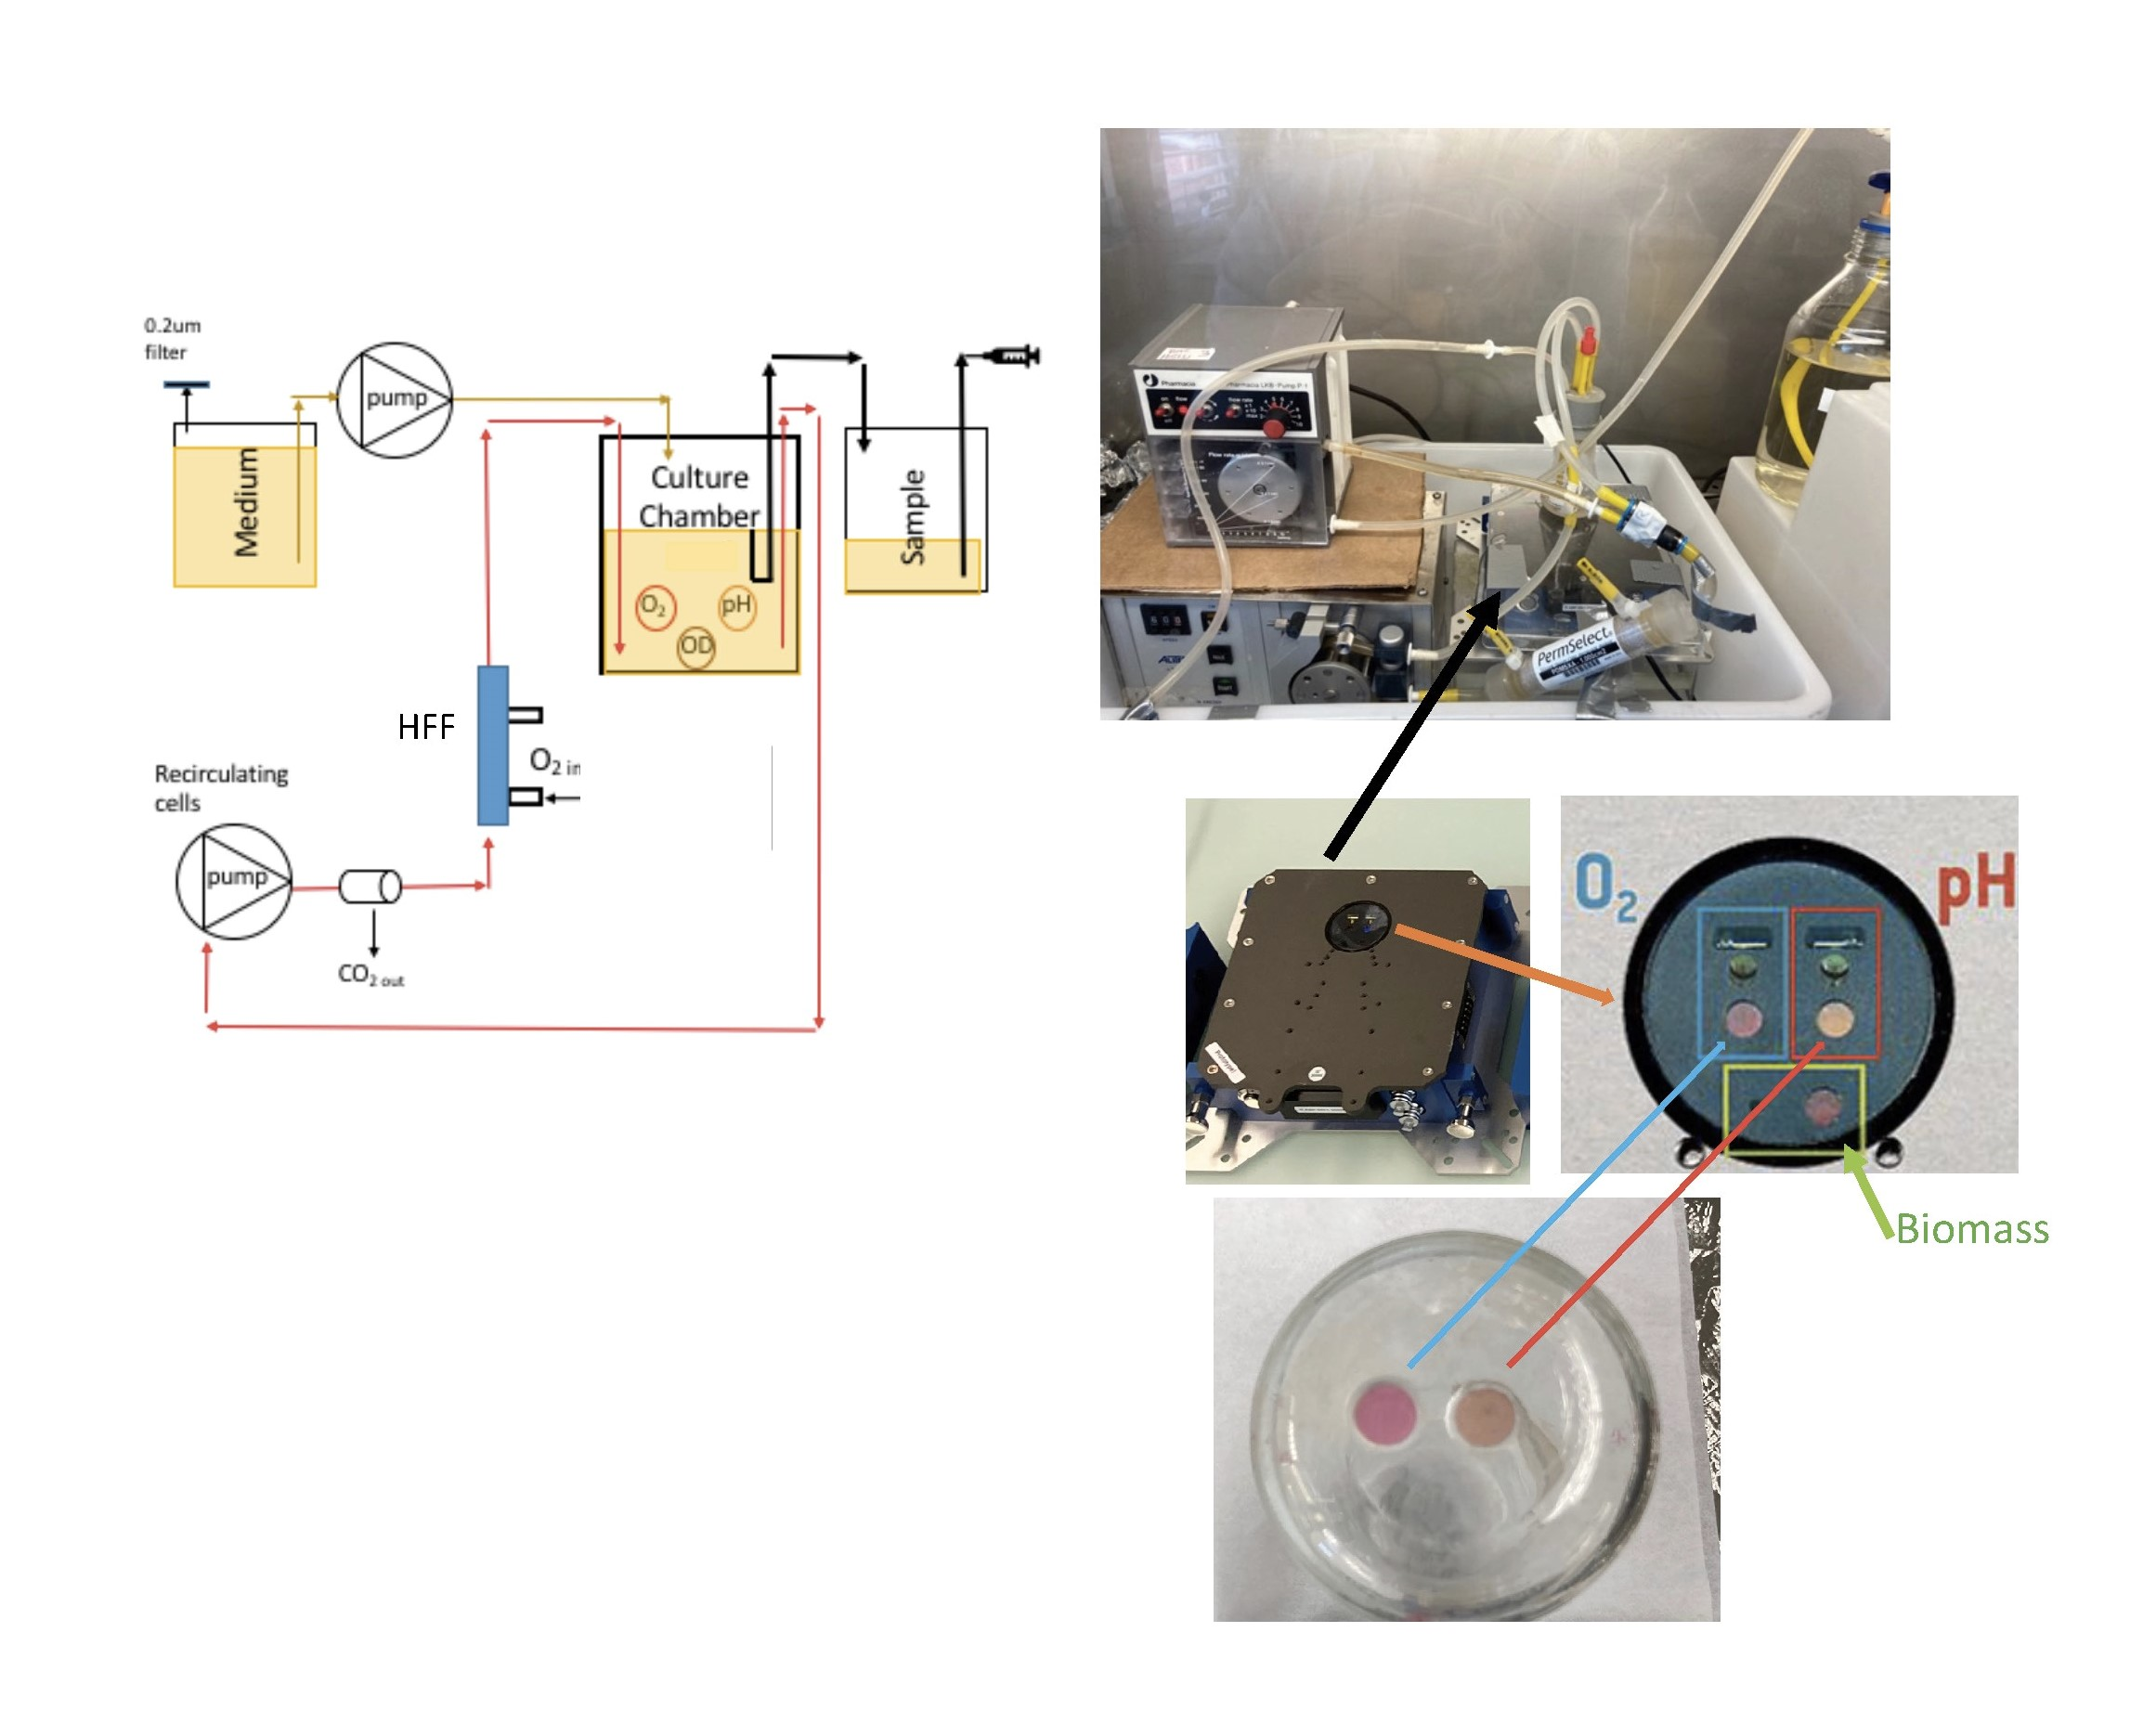
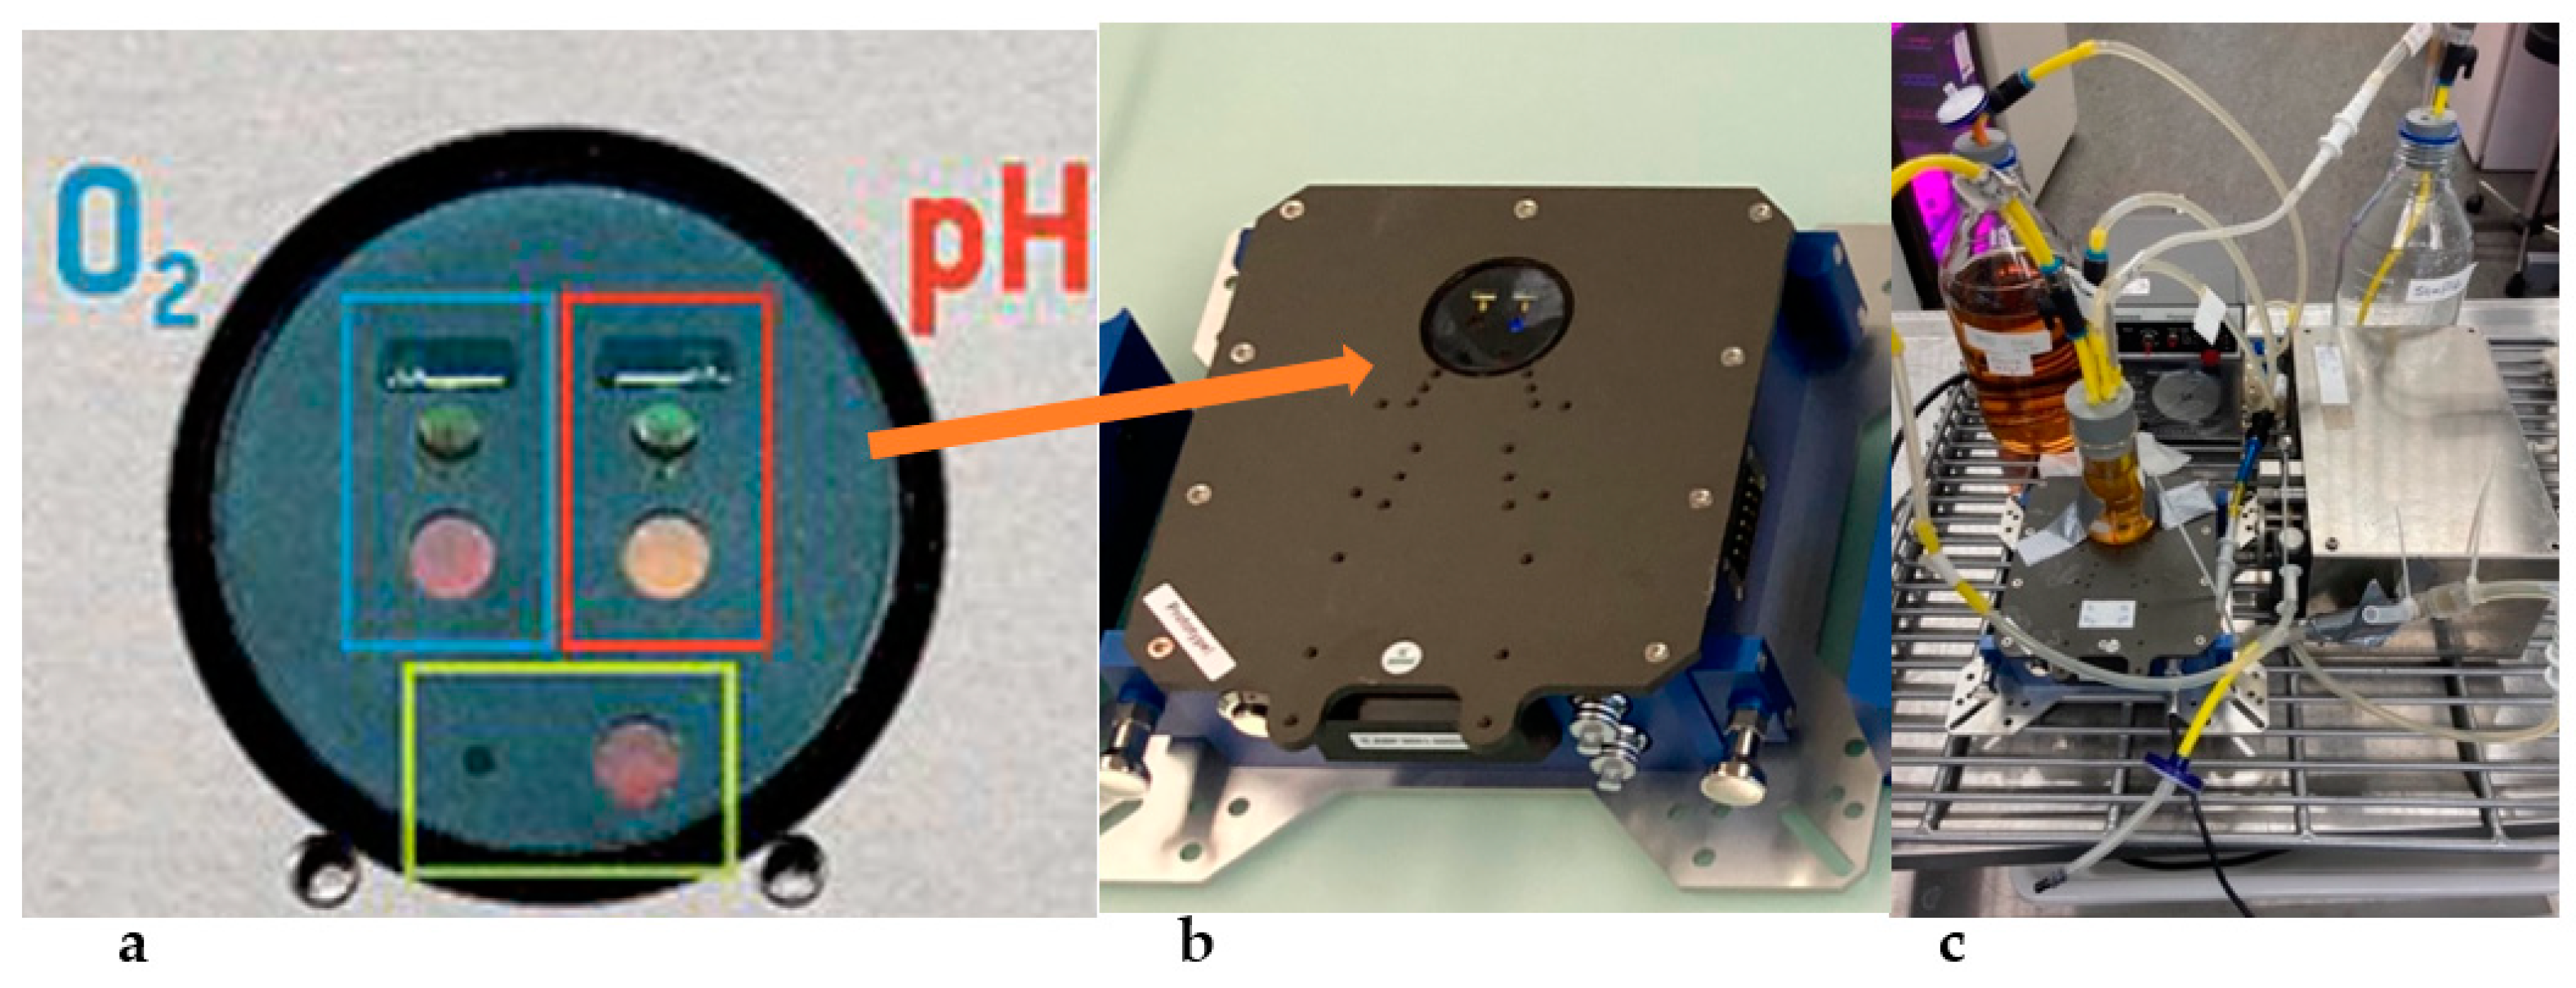
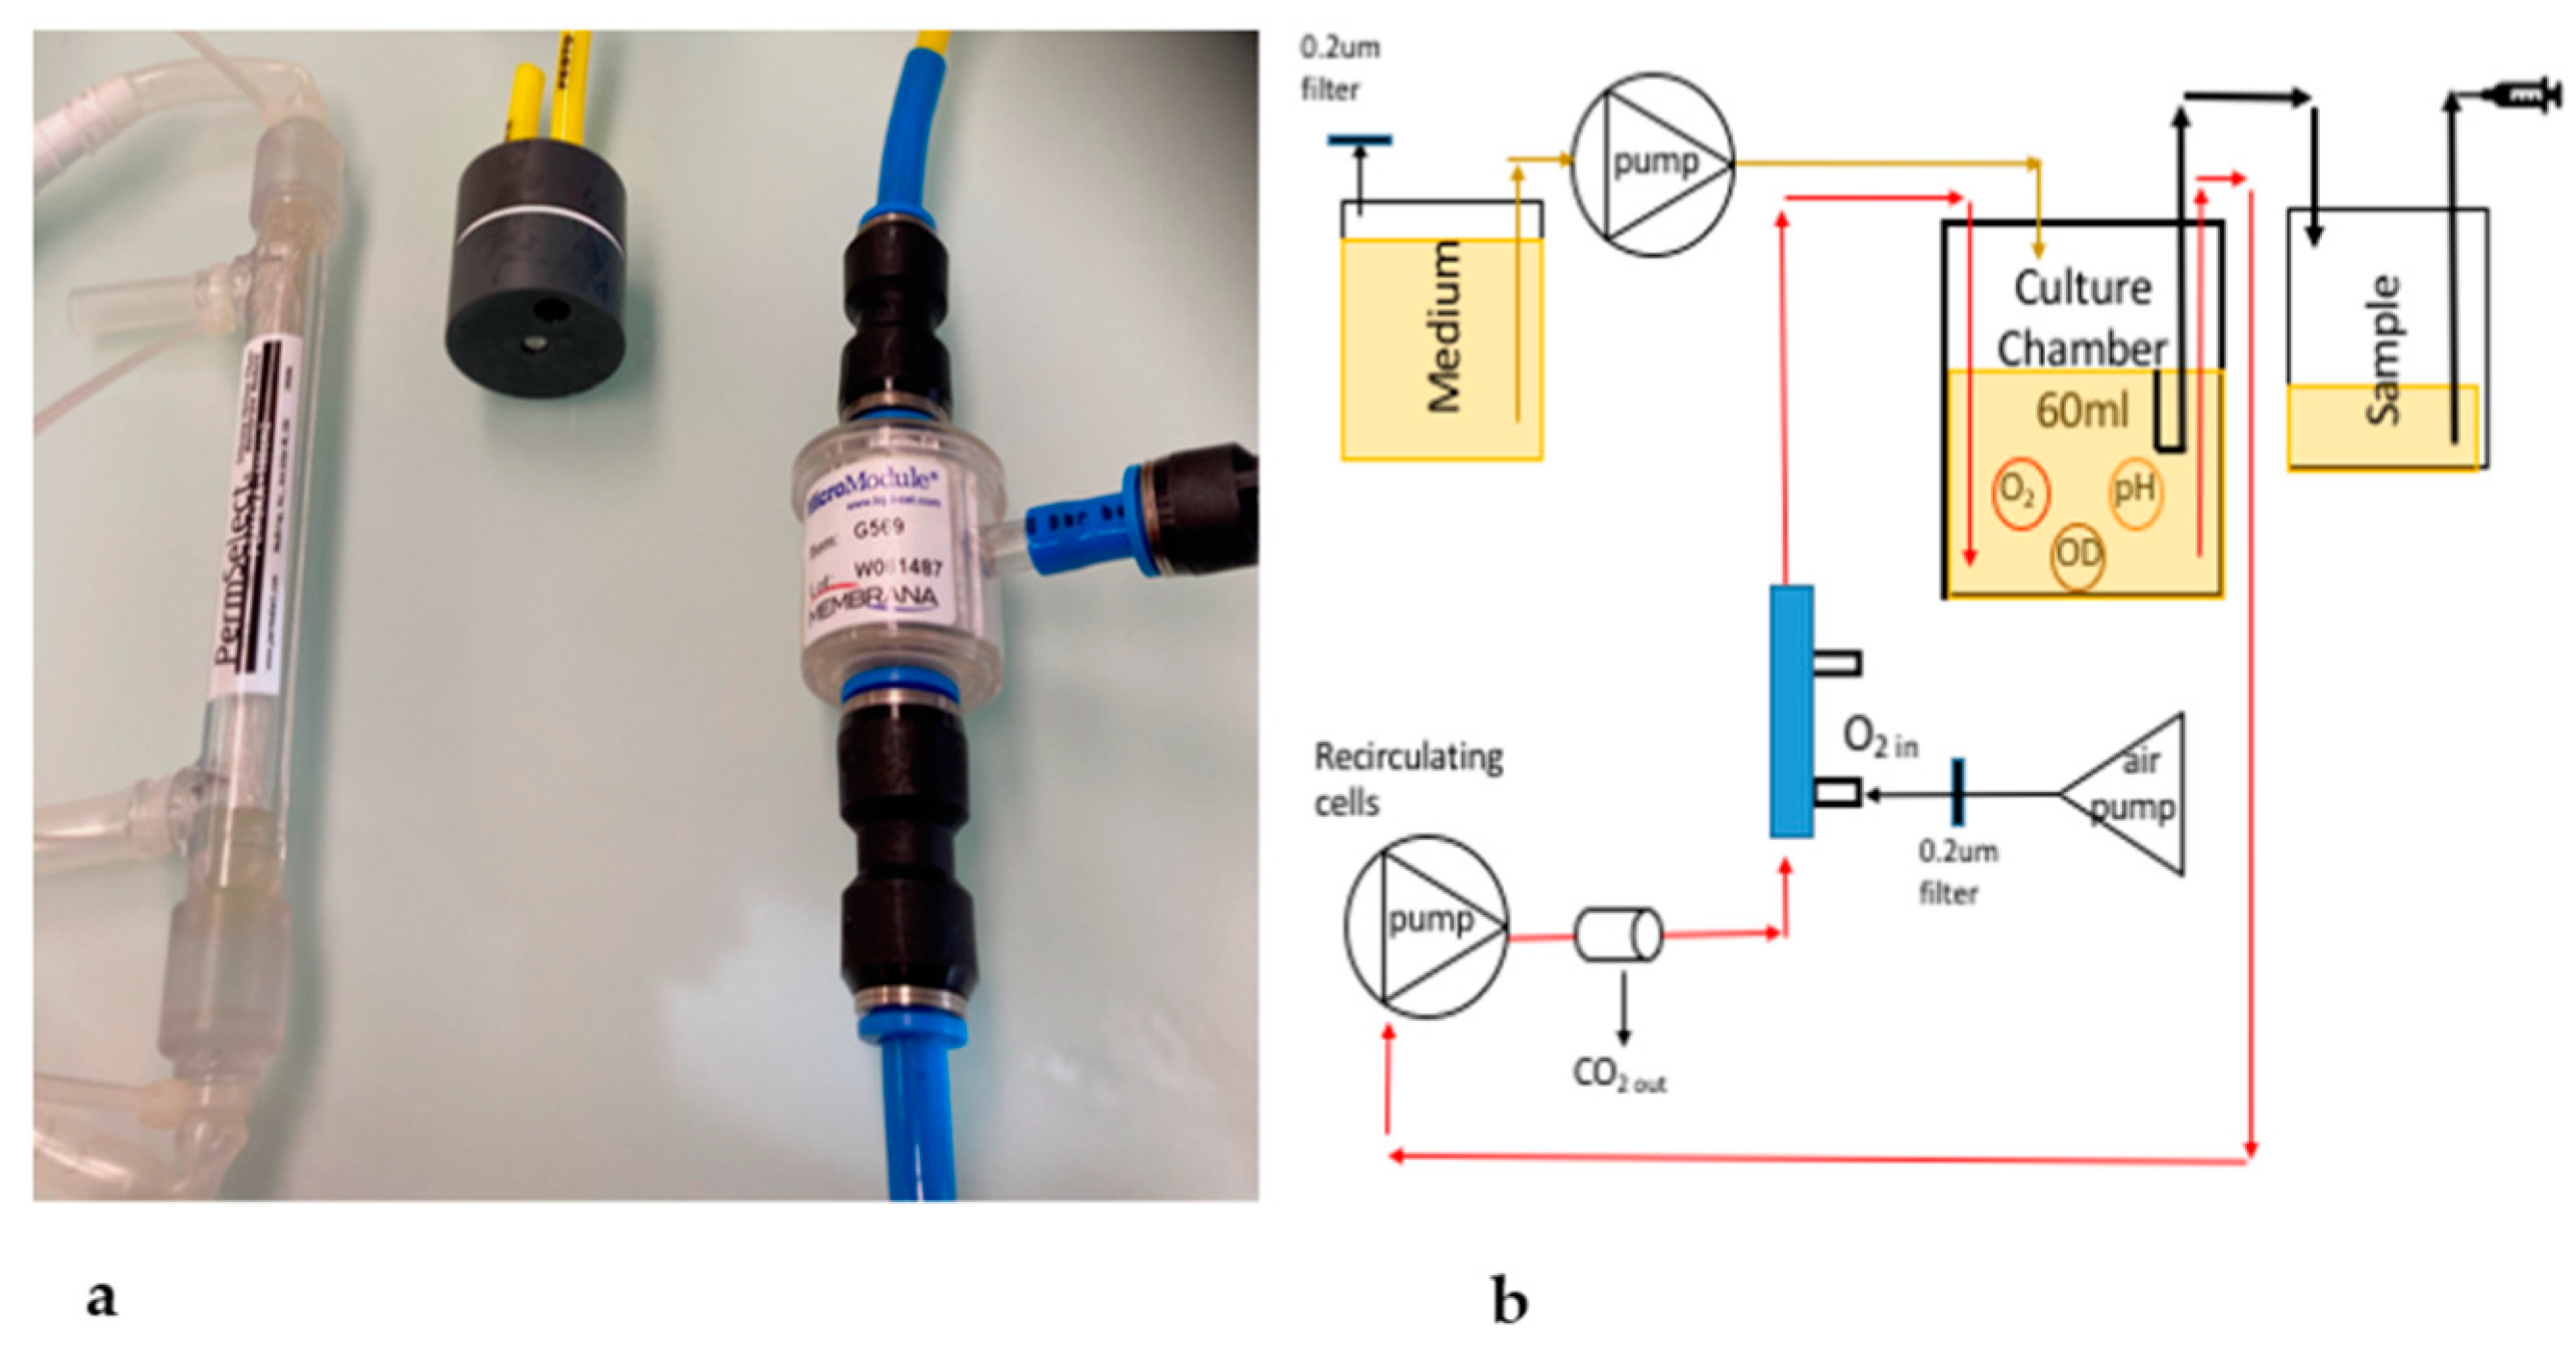
2.1. The Bioreactor and Data Analysis

A 70 mL Erlenmeyer flask was used as the bioreactor chamber. The chamber volume was kept constant at 40 mL, leaving a 2 cm head space with a surface area of 7.1 cm2. The overall volume of the system, including, tubing and filters, was 50 mL. For all experiments, a peristaltic pump (Phamacia LKBP-1, Uppsala, Sweden) with a flow rate of 10 mL h−1 was used to transfer the medium to the bioreactor giving a system dilution rate of D = 0.2 h−1. The bioreactor volume was kept constant via an overflow tube connected to a sample bottle. For experiments with filters, a second peristatic pump (Alitea-XV, Stockholm, Sweden) was used to recirculate cells through the filters at a flow rate of 26.7 mL min−1.
The bioreactor was mounted atop an optical array (model SFR vario by PreSens GmbH, Regensburg, Germany) to non-invasively and simultaneously sample time series of optical density (OD) for biomass, dissolved oxygen (DO), and pH in the bioreactor chamber (Figure 1). To sample DO and pH, the array used chemically treated spots that were autoclavable. The DO spots (SP-PSt3-YAU-D7_YOP) reacted with oxygen molecules and emitted a fluorescent signal at 505 nm. The pH spots (SP-PG1-V2-D7-US-SA-2004-1) reacted with hydrogen ions and fluoresced at 470 nm. These two spots were glued to the inside bottom of the bioreactor chamber, aligned with the optical detectors for DO and pH (Figure 1a). Optical density (OD) of yeast in the bioreactor was measured as backscatter from cells with illumination provided at a peak wavelength of 605 nm by an LED and absorption determined over the visible band by a positive intrinsic negative (PIN) photodiode. Additionally, the optical array measured ambient temperature and pressure.
Pre- and post-calibrations of DO and pH were done using standard solutions. Biomass (OD) measured by the optical array was calibrated every 10–12 h from grab samples (2 mL) analyzed on the Eppendorf spectrometer (Eppendorf plus) at 650 nm. Data dropouts were not interpolated and missing points, displayed as zeros, were deleted from the time series. This resulted in gaps in the time series. Aberrant data points were not edited, deleted, or interpolated, resulting in rapid spikes and declines in some time series.

2.2. Culture Conditions

Cultures of wild type Saccharomyces cerevisiae (BY4742, MATα his3Δ1 leu2Δ0 lys2Δ0 ura3Δ0) were obtained from Dr. R. Willaert at the University of Brussels, Vrije. For steady-state experiments, cells were grown in 7.5 g L−1 glucose in either yeast extract-peptone dextrose (YPD) or synthetic complete (SC) media. Glucose and media were autoclaved separately and combined under sterile conditions.
YPD was made with 1% yeast extract (BD 212750), 2% peptone extract (BD 211677) and either 2% glucose for inocula or 0.75% for steady-state cultures. This is the same composition as in commercial YPD, sold as Gibco® (Thermo Fisher, Waltham, MA, U.S.A.) and NutriSelect®Basic (Sigma-Aldrich, St. Louis, MO, U.S.A.). The SC media was prepared with yeast nitrogen base (YNB) without amino acids, which were added separately.
Since the composition of YPD is seldom analyzed or reported, an example of its composition is provided in Table 1 to compare with the composition of the SC medium, keeping in mind that media can vary from batch to batch depending on the contents of each extract.
Inocula were prepared in YPD batch cultures of 100 mL with 20 g L−1 glucose, and cells were grown at 30 °C on a shaker (250 rpm). Within 24 h, the yeast culture was transferred to two, 50 mL centrifuge tubes and centrifuged for 10 min at 4000 rpm to concentrate the inoculum. YPD was decanted and the remaining cell concentrate was washed with either YPD or SC medium (7.5 g L−1 glucose), then vortexed for 20 s and centrifuged again. After three washings, the inoculum was prepared by mixing cells in 10 mL of medium, then measuring OD at 650 nm on an Eppendorfplus spectrometer (Eppendorf Co.). The dry weight of the inoculum was estimated based on a predetermined linear relationship (N = 102, r2 = 0.955):
Biomass = 0.1073 + (0.2225 mg/mL OD) × ODmeasured
After inoculating the growth chamber, the volume was adjusted to 40 mL, mixed manually to homogenize the cell distribution, and the OD was measured again to determine the initial biomass, t0, in the system.

2.3. Oxygenation Methods

Since the optical spots were mounted to the bottom of the bioreactor chamber, a stir bar would have interfered with data acquisition and therefore could not be used as a means for oxygen transfer. Consequently, other methods of aeration were tested. Seven experiments were conducted to determine the oxygenation rates of the YPD medium. The ambient conditions during these aeration experiments were relatively constant. Temperatures had a maximum change of 0.5 °C, while the maximum difference in barometric pressure was 19 mbars (Table 2). This resulted in a maximum change in DOs of 0.2 mg L−1.
For experiment 1, the YPD medium was bubbled with sterile air using a 0.2 mm filter in-line with an air pump (Q = 0.2 L min−1). In experiment 2, the bioreactor operated as a continuously stirred tank reactor (CSTR) mixed with an impellor motor (3 V, Motraxx LRE-280RAC-2865) at 13800 rpm to transfer oxygen from the headspace. In experiment 3, DO levels were chemically enhanced by adding 200 mg L−1 of hydrogen peroxide (PEROX-AID®) to the bioreactor and mixed by recirculating the bioreactor volume using a peristaltic pump (Q = 26.7 mL min−1). In experiment 4, oxygenation and mixing were performed using a flat membrane filter (Evenflow, PTFE 44) in-line and downstream of the recirculating peristaltic pump. For experiment 5, a Liqui-Cel (G569.75x), hollow-fiber filter (HFF) with a volume of 2.5 mL was substituted for the flat plate membrane.
In experiment 6, yeast cultures were aerated with a polydimethylsiloxan hollow-fiber filter with a volume of 1.5 mL (PDMSXA-100 cm2 by PermSelect Ann Arbor, MI, USA)—hereafter referred to as the PDMS, in-line with the recirculating peristaltic pump (Figure 2). Lastly, in experiment 7, the SC medium was oxygenated using the PDMS downstream of the recirculating pump in order to compare with oxygenation rates of the YPD medium.
For experiments 4–7 (i.e., filters), the recirculation pump had a constant flow (26.7 mL min−1) that continuously passed cells over the filter to provide aeration. The retention time in the growth chamber was 1.9 min, which was sufficient to keep yeast suspended without causing cell lysis. Initially, the air pump was connected to the filters and a CO2 trap was placed between the filters and recirculation pump (Figure 2b), but these were omitted since they had no impact on gas transfer in the cultures.
To determine how fast the filters could replenish oxygen-free YPD and SC media, 10 mg mL−1 of Na2SO3 was prepared in stock media and 20 mL added to the sample chamber, after removing 20 mL of oxygenated medium [4]. As a control, filtered de-ionized water (FDIW) was aerated with the filters and DO was monitored without and with the addition of Na2SO3.
Generally, oxygen transfer rate to the medium, from gas to dissolved state, was quantified as the coefficient:
K L a = d D O   d t 1 ( D O s D O B r )  
where DOs is the saturated oxygen concentration and DOBr is the oxygen concentration in the bioreactor. For the impeller (treated as a CSTR), KLa was defined as:
K L a = l n ( D O s D O B r N D O s D O B r 0 ) t N t 0
where the subscripts 0 and N are for the beginning and end time of the measurement, respectively. For the membrane and hollow-fiber filters, the KLa was calculated as:
K L a = Q D O B r A   l n ( 1 D O B r D O S )
where Q is the fluid flow rate through the filters in mL min−1. The PDMS filter volume was 2.1 mL and its lumen surface area was 100 cm2. For all KLa measurements, the mass transfer rate has units of min−1.
Oxygen utilization rate (OUR) by the yeast was determined as:
d D O   d t = K L a ( D O s D O B r ) q D O X b i o m a s s
d D O   d t = K L a ( D O s D O B r ) O U R
Such that OUR = qDO(Xbiomass) where qDO is the specific respiration rate per unit biomass and Xbiomass is the biomass concentration.
Solving for OUR gives,
O U R = K L a ( D O S   D O B r ) d D O B r d t  
For steady-state conditions d/dt = 0 and Equation (7) reduces to
O U R = K L a ( D O S   D O B r )
For all experiments, DOBr and DOS were corrected for changes in temperature and atmospheric pressure (Table 2).
Analysis of variance (ANOVA) was conducted on data from the same time series and separate time series using SPSS v27 and a Tukey test was used to discriminate differences between means. Statistical tests were run for unequal variance with alpha values set to 0.01. Mean values, plus and minus one standard deviation, are used throughout the paper and in all tables where the sample size is designated by N.

3. Results

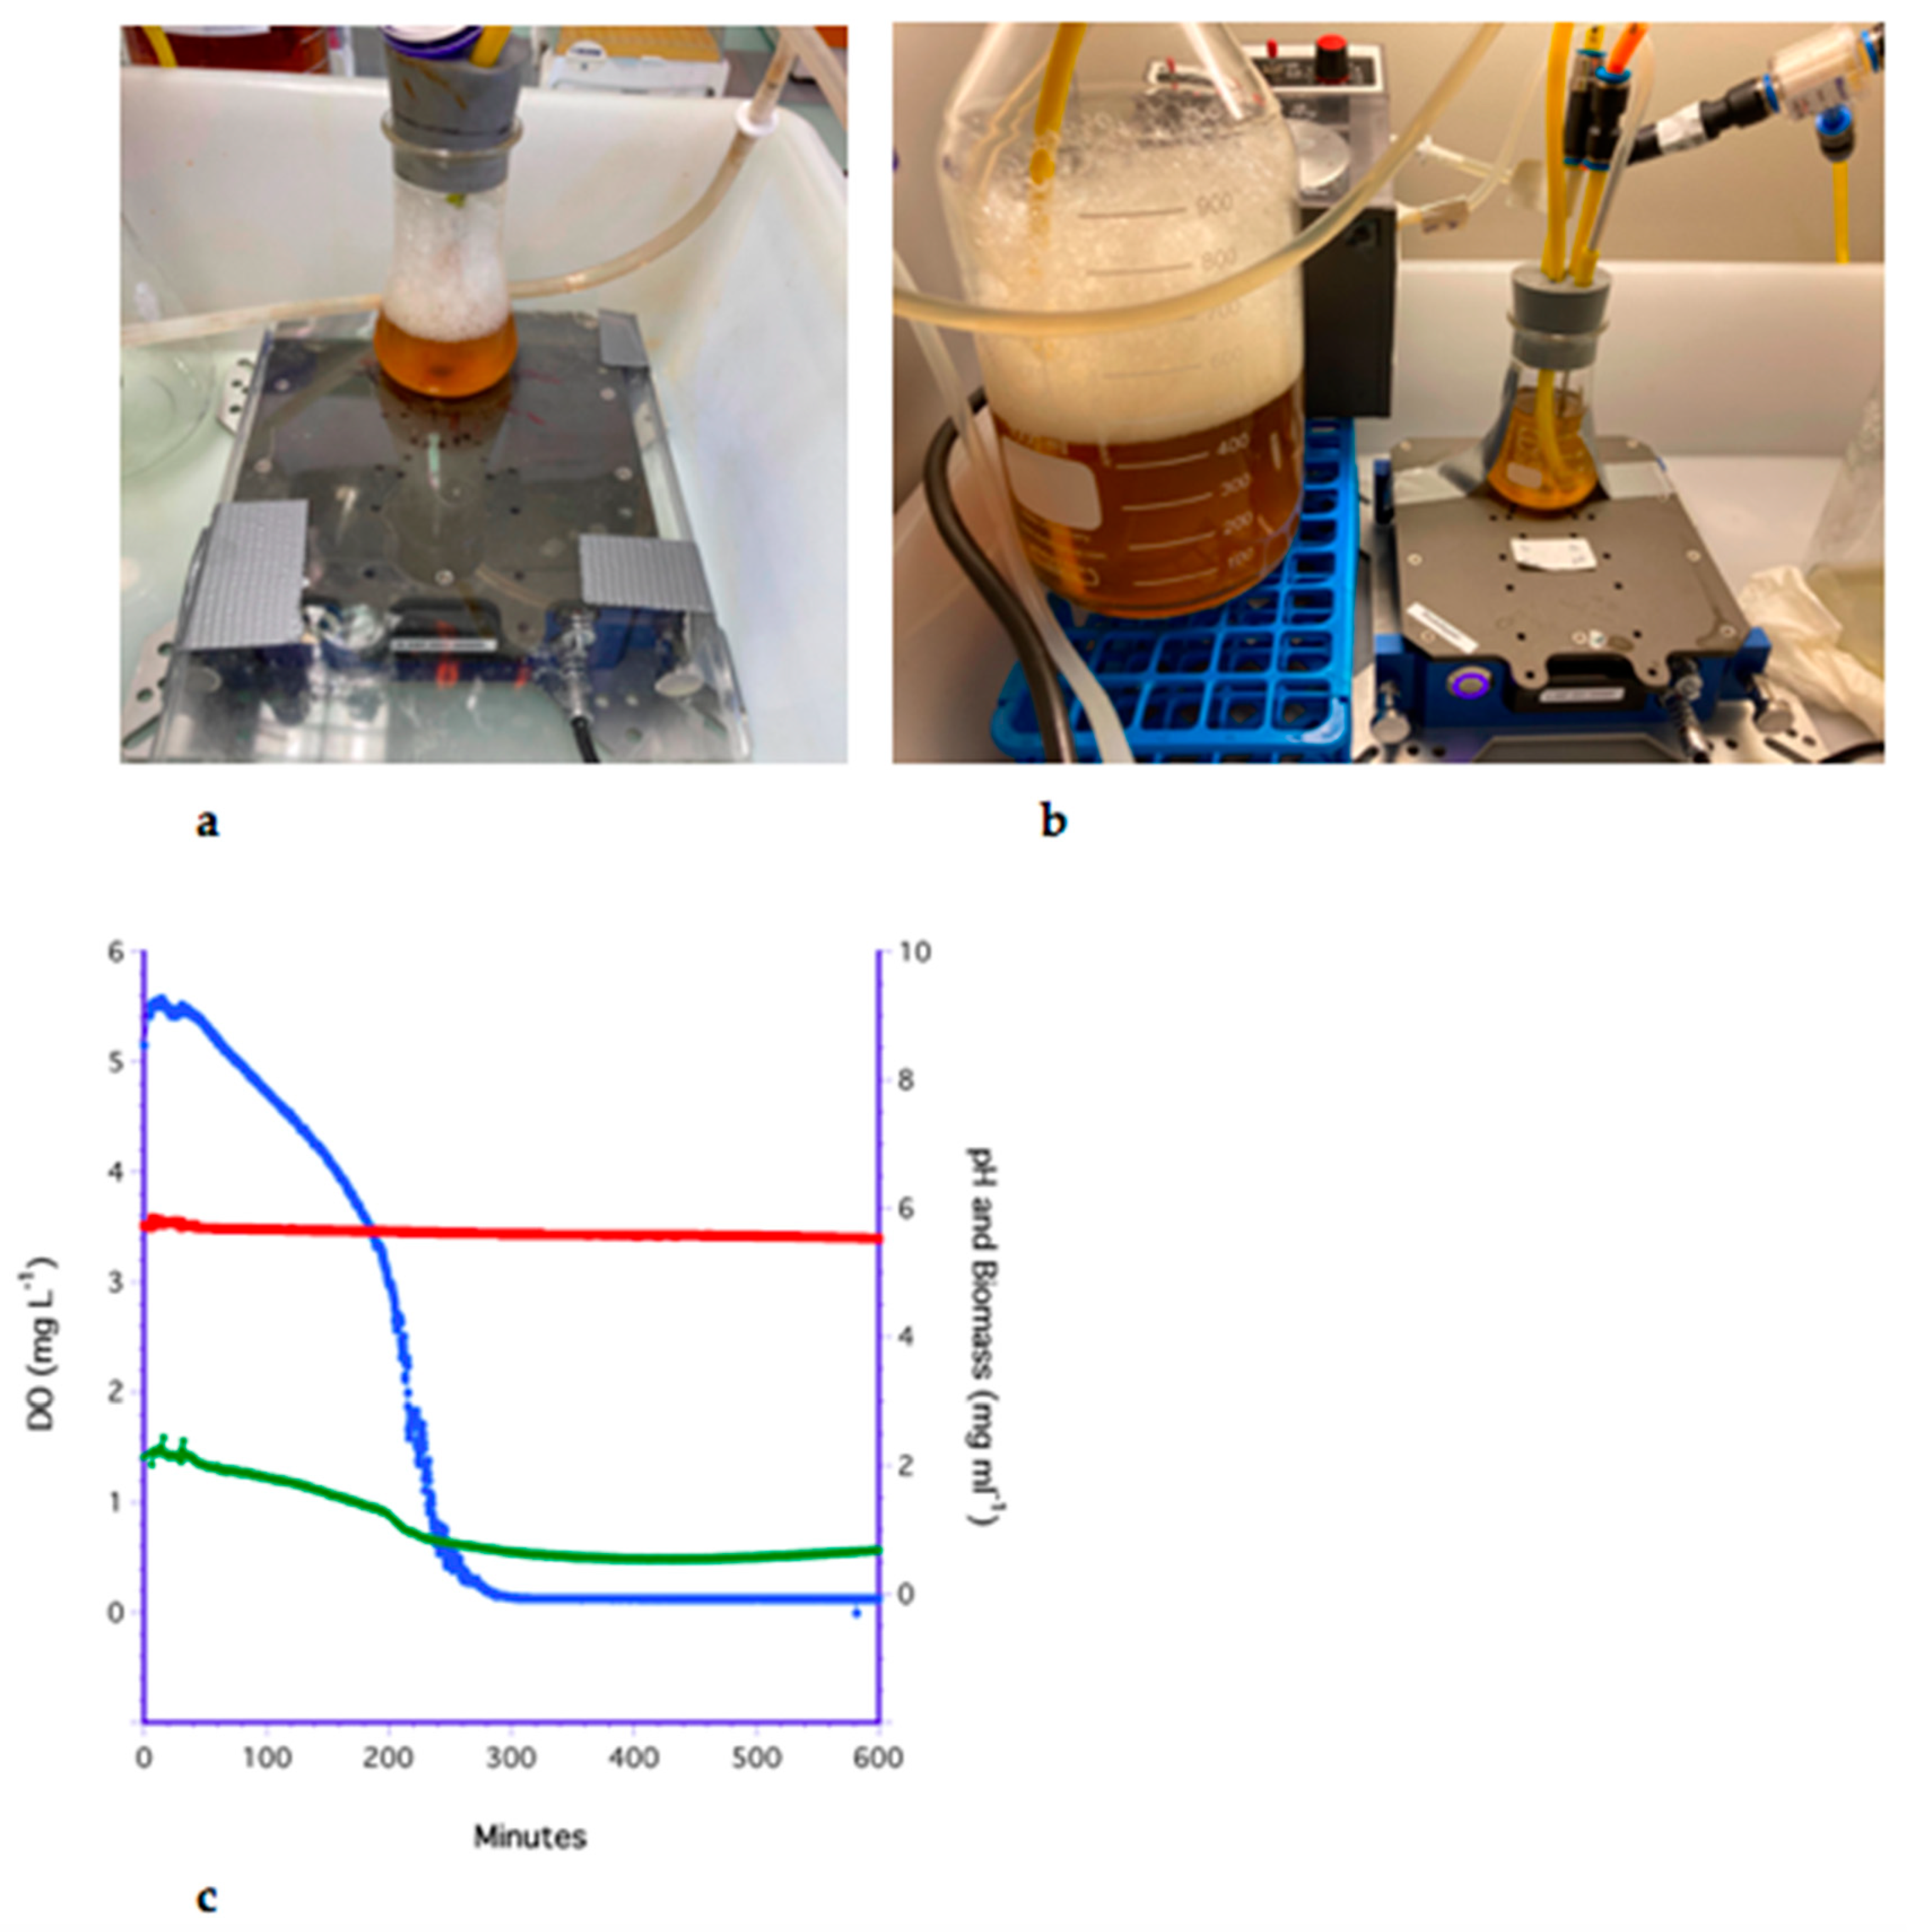
3.1. The Bubbling Method

Filtered air was bubbled in the YPD medium of the culture chamber using an air stone (i.e., sparge) connected to an air pump (Figure 3a). However, bubbles adhered to the DO and pH spots interfering with the optical measurements (Figure 3a).
As an alternative, filtered air was bubbled into the medium reservoir (Figure 3b) and pumped into the growth chamber at the dilution rate of 0.2 hr−1 (Q = 10 mL hr−1). The average rate of decrease in dissolved oxygen was −0.23 ± 0.03 mg L−1 min−1. The decrease in DO indicated that oxygen was consumed by the yeast (i.e., respired) at a greater rate than the medium could replenish it. This is illustrated in Figure 3c.

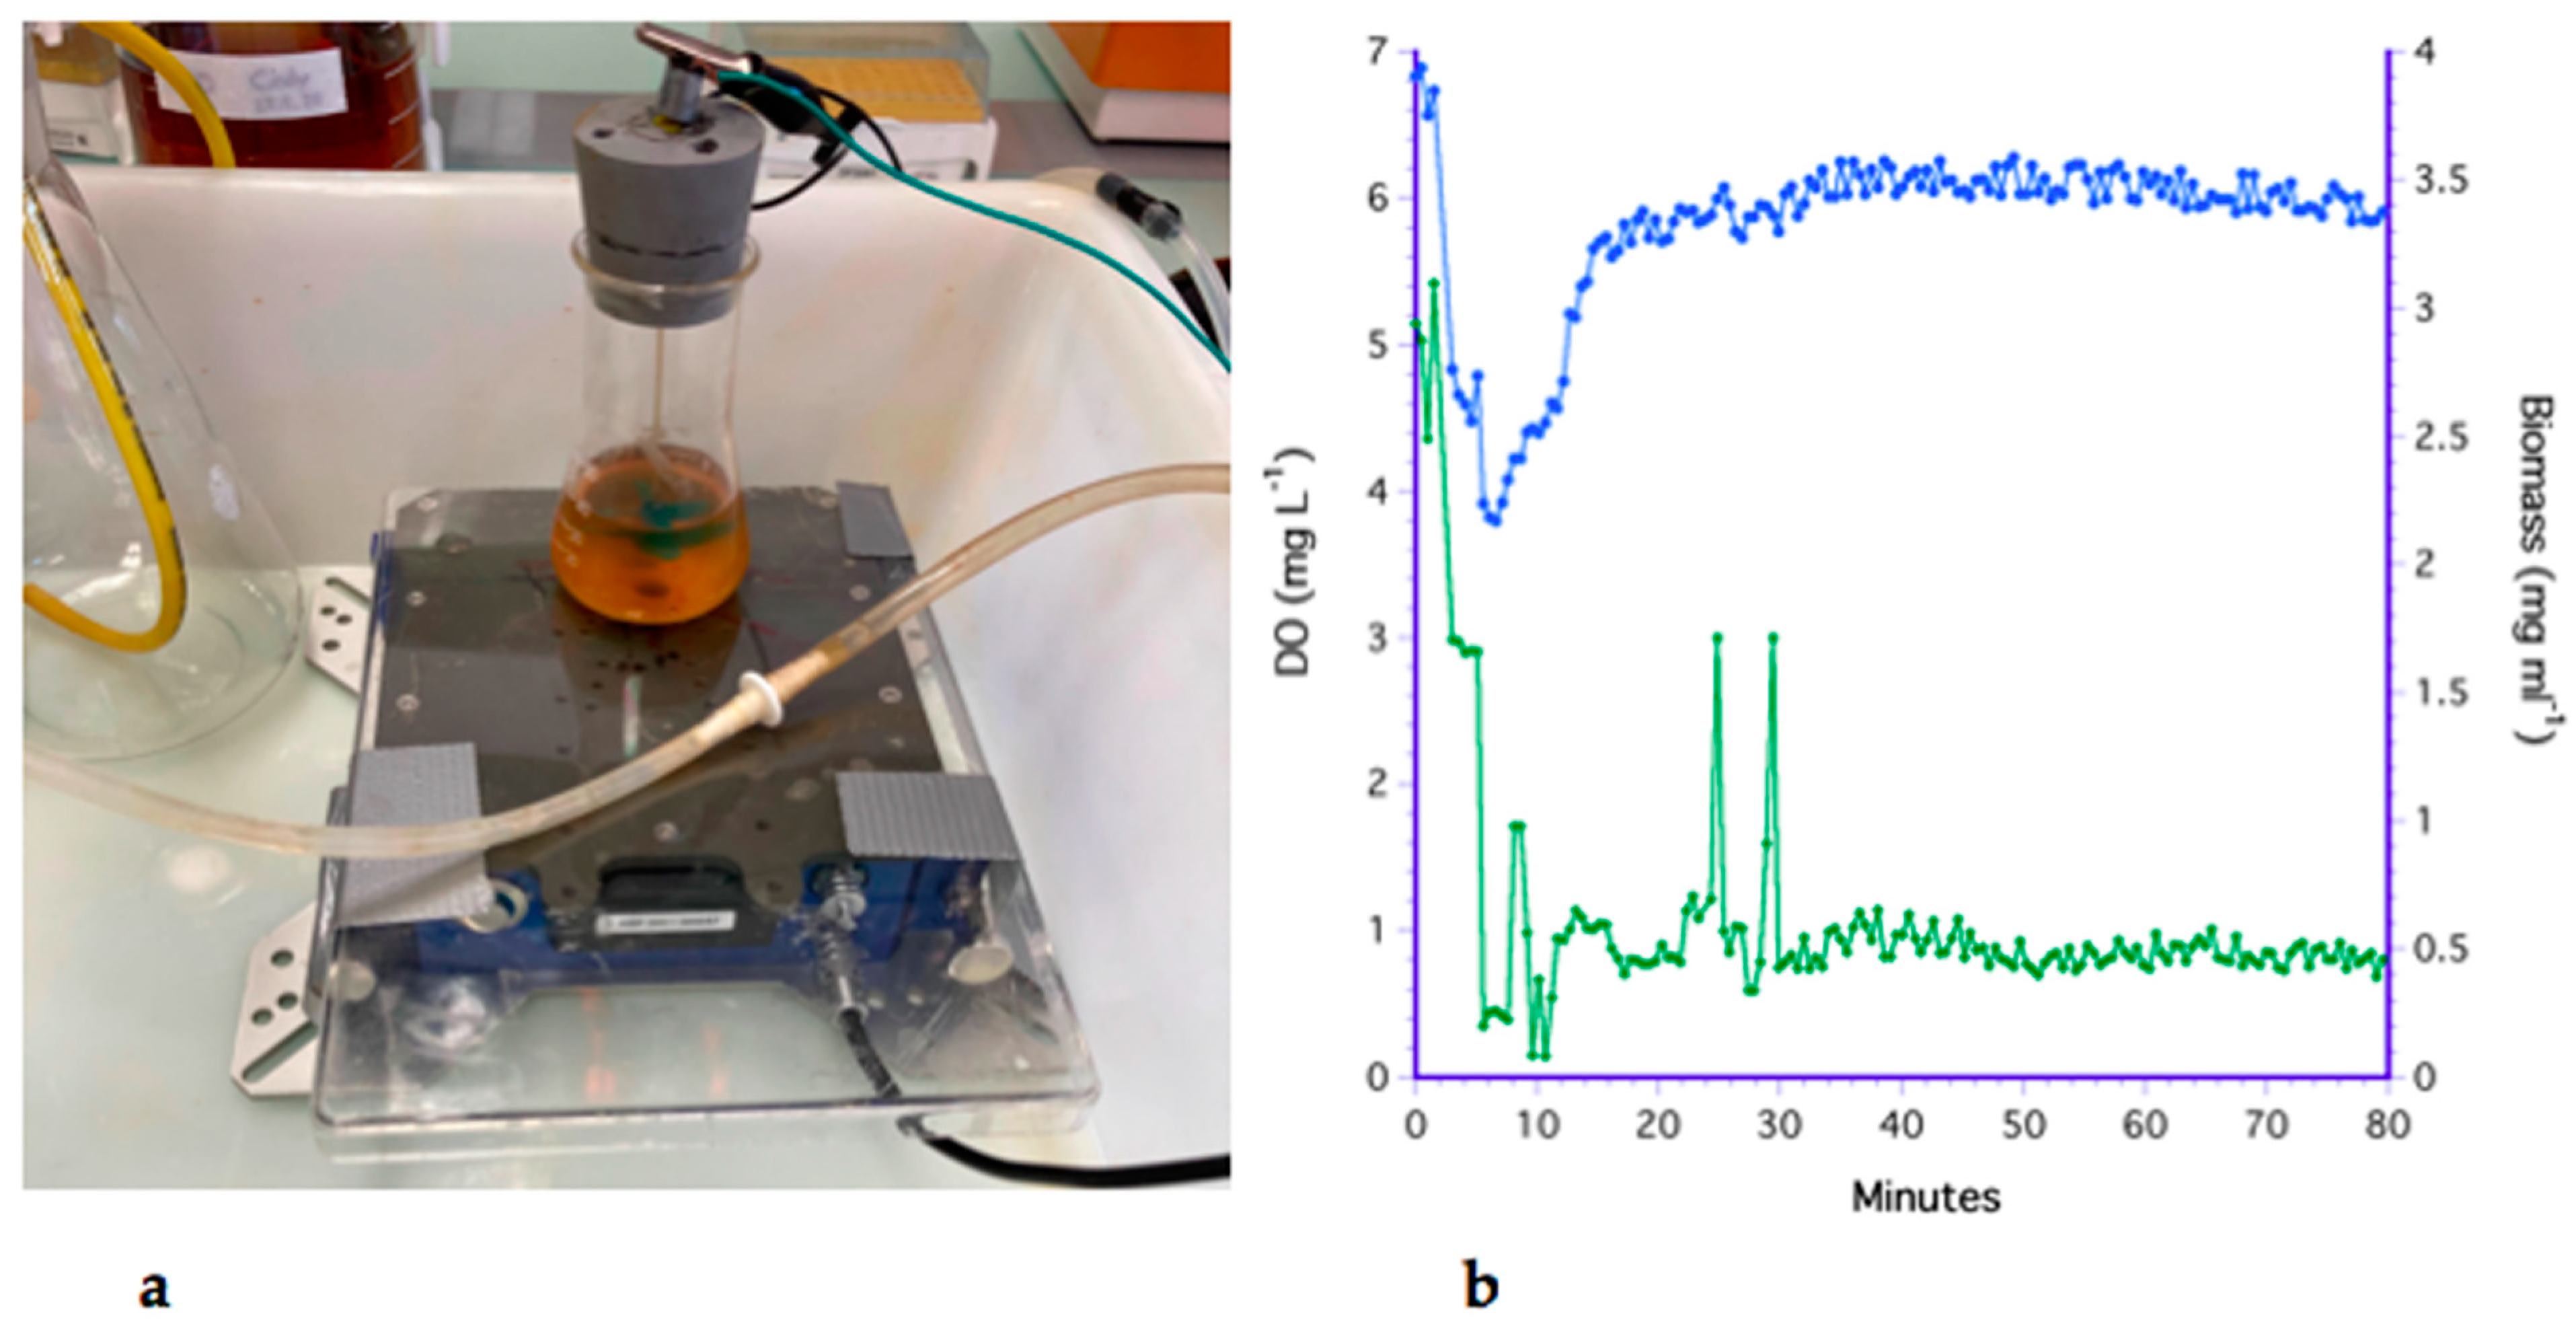
3.2. The Impeller Method

The impeller method (Figure 4a) was very effective for transferring oxygen over the air-medium interface. The average rate of aeration was 0.15 ± 0.16 mg L−1 min −1 and DO remained high for all replicated experiments. A typical time series is shown in Figure 4b, where DO in the YPD culture was initially 6.8 mg L−1 and biomass was 2.8 mg mL−1 (the pH sensor failed). After diluting the culture with low DO medium (0.5 mg mL−1 oxygen), DO was reduced from 6.8 to 3.8 mg L−1, however, mixing rapidly increased DO to 5.7 mg L−1 within 10 min, and equilibrated at approximately 6 mg L−1.

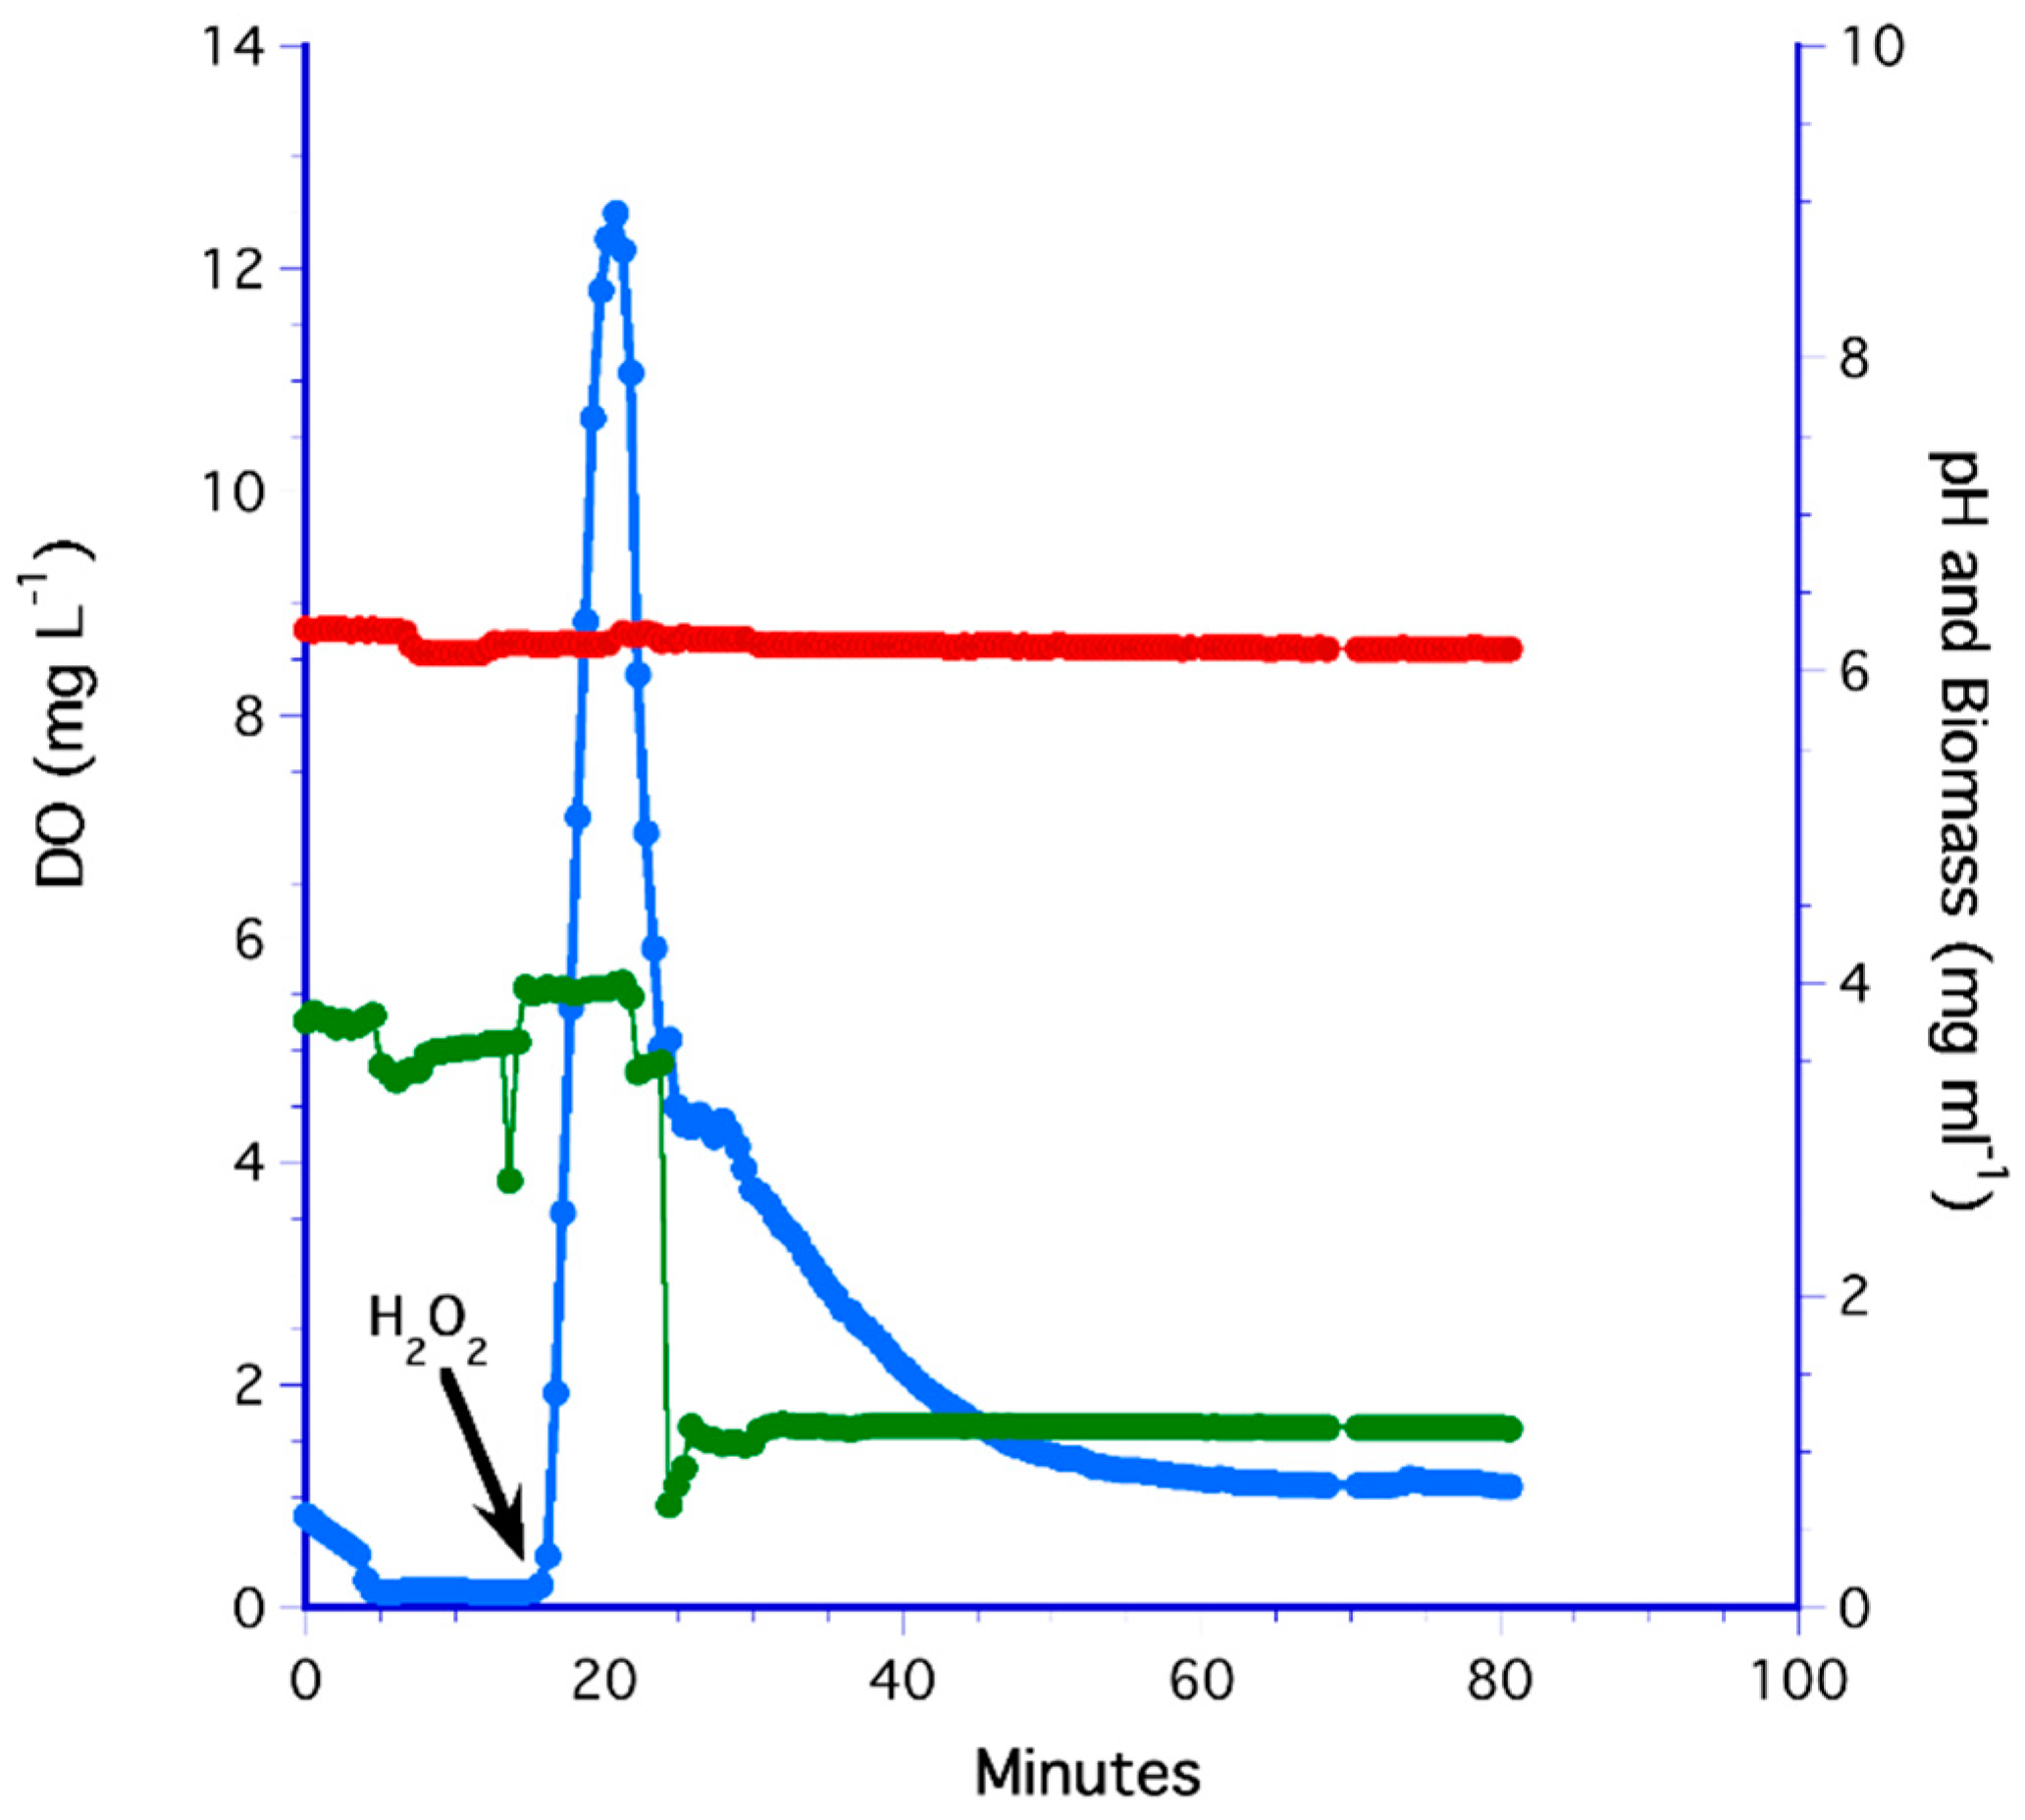
3.3. The H2O2 Method

YPD medium was chemically oxygenated by adding hydrogen peroxide, which gave a mean aeration rate of 0.40 ± 0.15 mg L−1 min−1. However, for all replicated experiments, dissolved oxygen decreased over time to anoxic levels. This is illustrated by the time series in Figure 5 where the anoxic medium increased from DO < 0.5 mg L−1 to 12 mg L−1 within 5 min but was reduced to 1.1 mg L−1 in less than 30 min. Coincident with the addition of H2O2, biomass deceased from 4 mg mL−1 to a steady-state value of 1.2 mg L−1, which may have been a response of cells to the strong oxidizing potential of peroxide (O22−), which is toxic for the yeast.

3.4. Flat Membrane Filter Method

For the flat plate filter, low DO medium was inoculated with yeast and circulated over the membrane using the recirculating pump. The average aeration rate was −0.21 ± 0.35 mg L−1 min−1, indicating that the membrane could aerate the cultures. Figure 6 shows that DO was unable to increase in concentration and remained low even when the biomass was diluted from 8.9 to 2.3 mg mL−1 with low DO medium. After shaking the flask (at t = 77 min) to mechanically aerate the bioreactor, the DO increased slightly to 2 mg L−1 but rapidly decreased again.

3.5. The LiquiCel Hollow-Fiber Filter (HFF) Method

The Liqui-Cel HFF had a negative aeration rate with an average of −0.26 ± 0.13 mg L−1 min−1. A typical run is shown in Figure 7.
The DO decreased from 4.1 mg L−1 to a nearly constant level of 0.18 mg L−1 as a result of yeast respiration being higher than the aeration rate. The pH was fairly constant between and 5.5 and 5.3. The biomass initially increased from 2.1 to 2.8 mg mL−1 as a result of initial cell mixing, but thereafter remained constant.

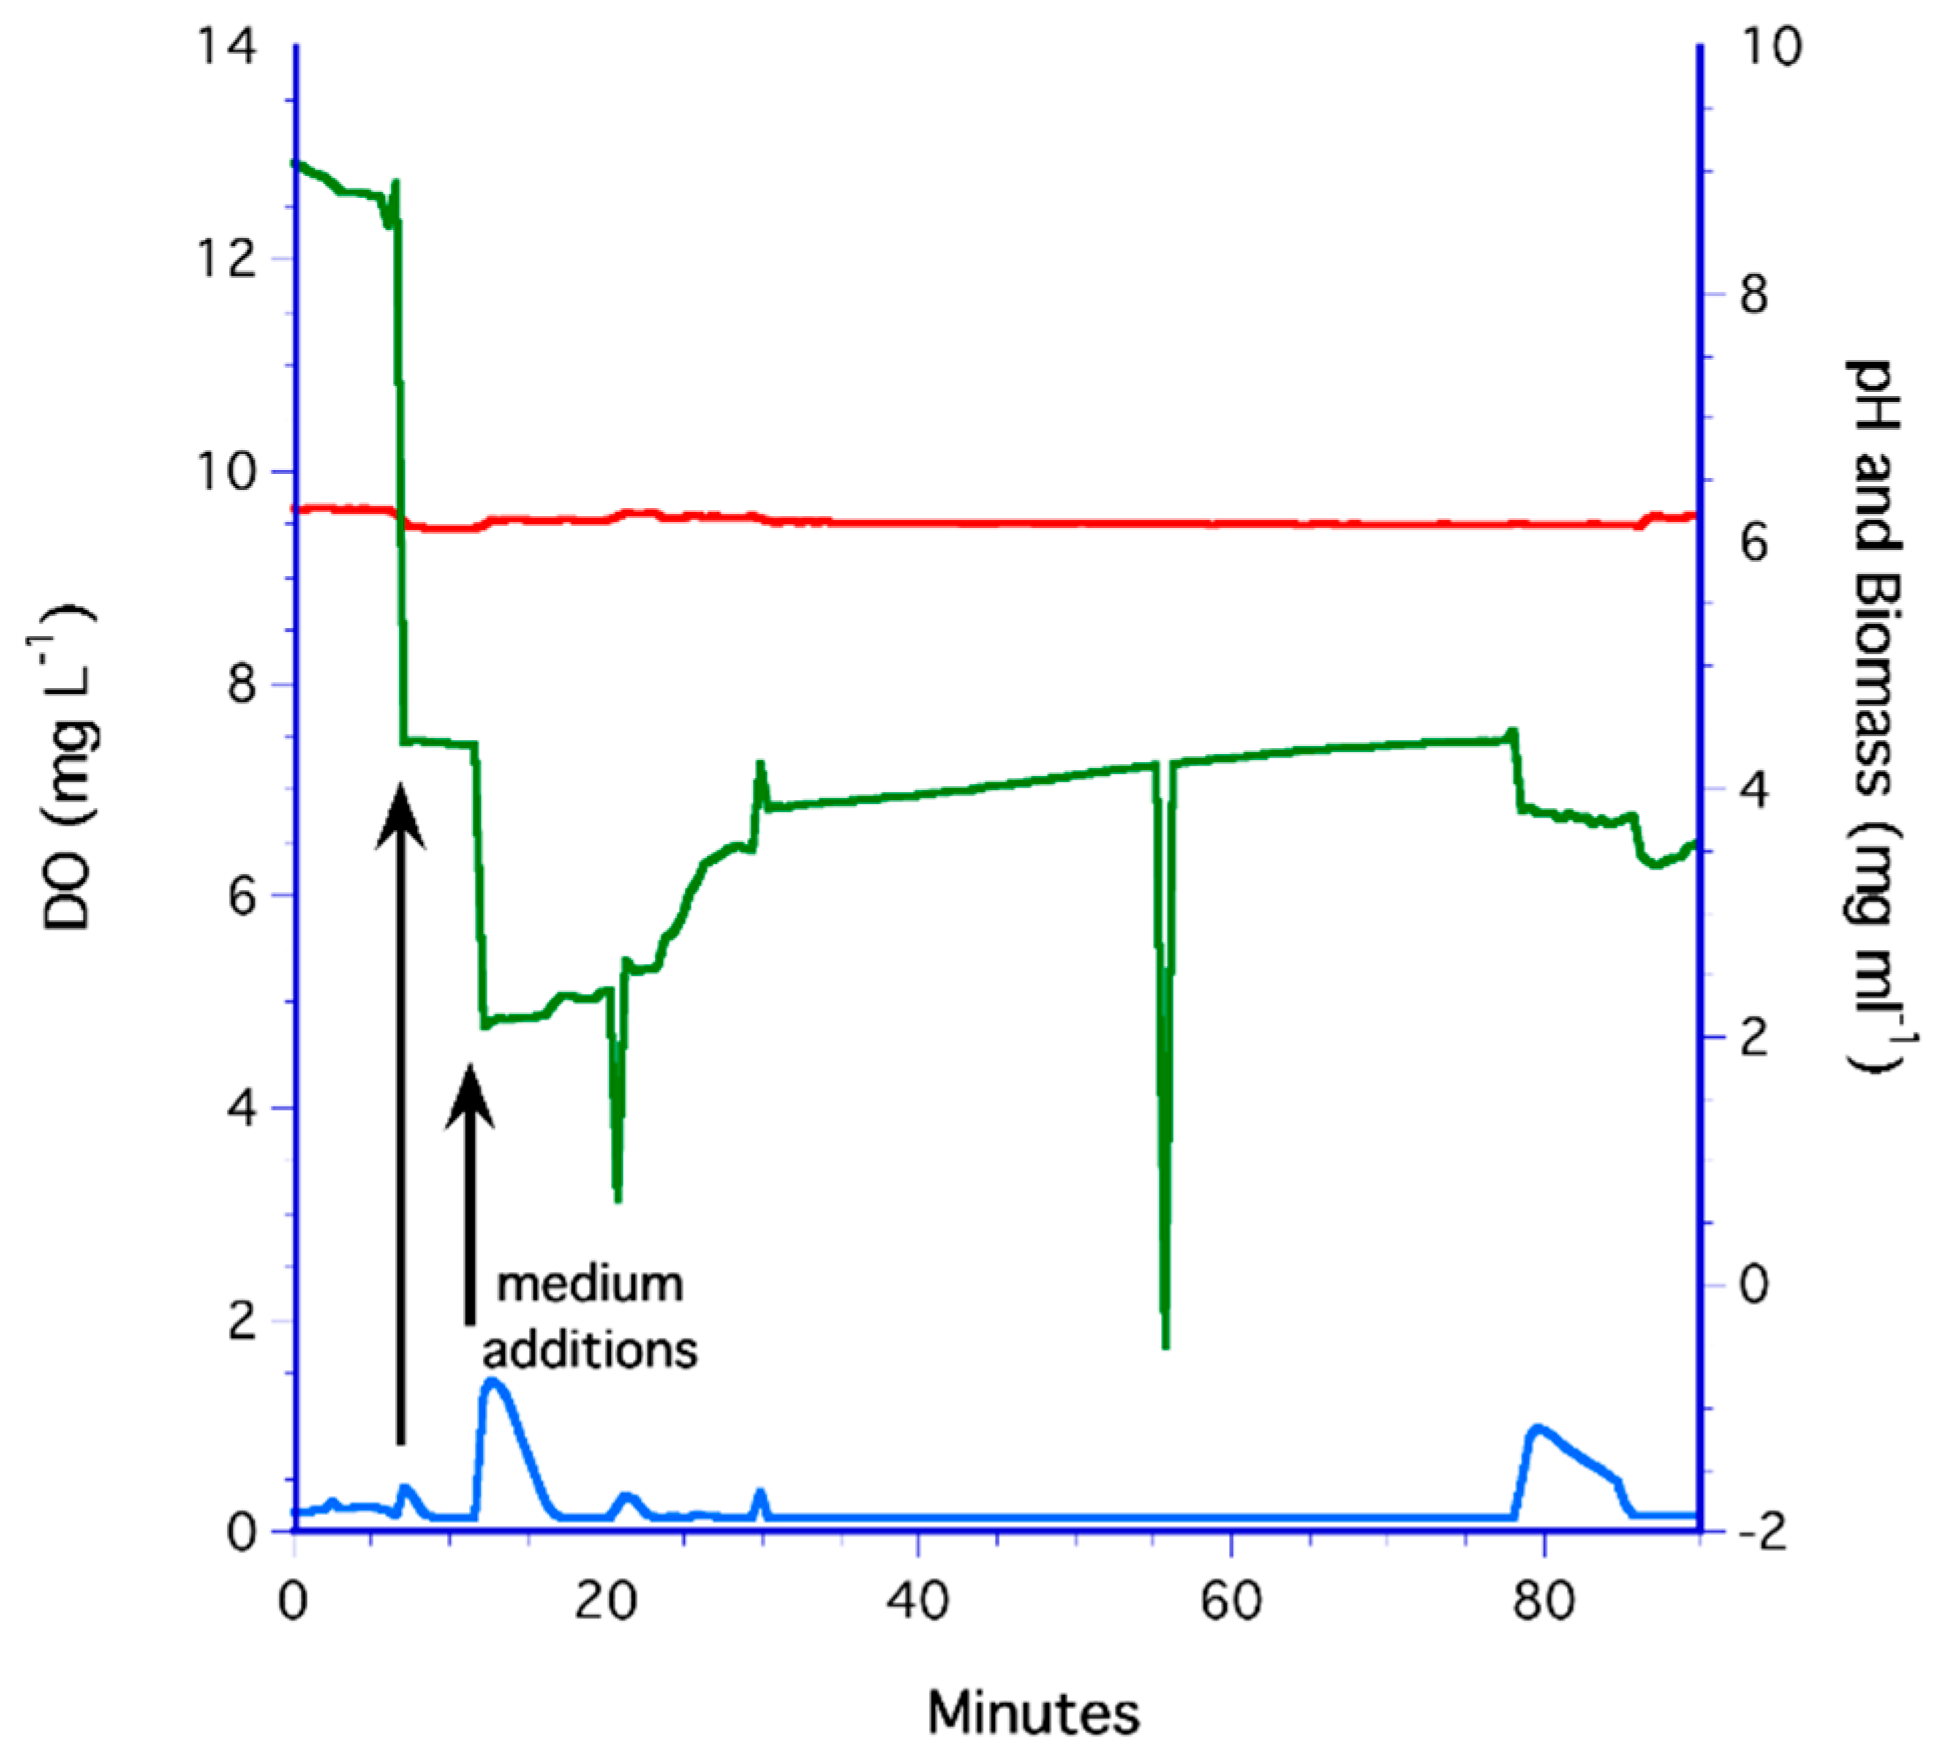
3.6. The PDMS Hollow-Fiber Filter (HFF) Method

Aeration of yeast cultures with the PDMS filter and YPD was not effective over the long term. Overall, DO declined at an average rate of −0.14 ± 0.29 mg L−1 min−1. For example, in Figure 8a DO was initially high at 6.8 mg L−1 but within 240 min, DO decreased to a low of 0.18 mg L−1 as a result of yeast respiration.
Biomass was initially steady at 1 mg mL−1 when DO was high, but as oxygen was depleted, biomass fell to a minimum of 0.35 mg mL−1 over a 10 h period. Biomass increased again during anoxic conditions to a high of 2.1 mg mL−1. The pH decreased linearly from 7.4 to 5.8 as respired CO2 increased. Thereafter, pH was nearly constant at 5.8.
The experiment was repeated after cleaning the PDMS by flushing the 100 mL of 70% ethanol, rinsing with 100 mL of filtered de-ionized water (FDIW), and re-inoculating the YPD. However, even after cleaning the filter, the DO in the culture progressively decreased Figure 8b).
Using the same PDMS filter (after cleaning), the experiment was repeated using the SC medium. In all runs with SC medium, the PDMS filter kept the yeast cultures aerated at an average rate of 0.26 ± 0.13 mg L−1 min−1. The final time series in Figure 9a illustrates how DO recovered each time Na2SO3 was added. Initially, DO was high and steady at 7.6 mg L−1. After the first addition of Na2SO3, at t = 16 min, the DO in the bioreactor was reduced to 0.33 mg L−1 within 14 min, at a rate of −0.24 mg L−1 min−1. After a 2-fold dilution of Na2SO3 solution, the DO rose to 1.2 mg L−1 before the next addition at t = 116 min as Na2SO3. Despite the data dropouts in the time series between minutes 229 and 334, there was an increase in the DO concentration to 4.2 mg L−1 over this time period. This increase in DO was not an artifact as demonstrated by: (1) the rapid increase in DO from 3.4 to 6.6 mg L−1 after the addition of a small volume of Na2SO3 at 366 min; and (2) a longer time series (2.1 days) where both DO and pH increased slightly and biomass remained constant (Figure 9b). For this longer time series, DO was near 4.1 mg L−1, which was sufficient to maintain aerobic cell respiration.

3.7. Analysis of Methods

Of the seven aeration methods, four could not effectively aerate cultures. Negative trends in aeration (i.e., DO over time = dDO/dt) occurred in the YPD medium for bubbling, flat membrane, Liqui-Cel, and PDMS methods, indicating that these methods could not replenish DO at rates equal to or greater than respiration rates of the yeast cultures.
The three methods that did provide sufficient aeration for cultures were the PDMS filter using SC medium and the impeller, and H2O2, both using YPD medium. While the H2O2 trend was only transient, both the impeller/YPD and the PDMS/SC methods did reach a steady state, however, DO trends were not statistically different (N = 3, |t| = 2.01, p = 0.098).
To determine the effectiveness of the PDMS filter to oxygenate the two media, several time series were collected using only the YPD and SC media without yeast. In an anoxic YPD medium, DO never recovered (for example in Figure 10a where DO remained low and constant below 0.22 mg L−1). Even after cleaning the filter and repeating the experiment with oxygenated YPD the maximum DO of 5 mg L−1 progressively decreased despite continued aeration through the PDMS filter (Figure 10b). This negative aeration rate represents a negligible oxygen transfer rate, KLa.
To determine the KLa for the SC medium, Na2SO3 was added periodically and the increase in DO was monitored. The result was an average aeration rate of 0.34 ± 0.13 mg L−1 min−1. As a control, FDIW was substituted for SC resulting in an average aeration rate of 0.37 ± 0.12 mg L−1 min−1. Both these processes are illustrated in Figure 11. DO of the SC medium was initially high and constant at 7.6 mg L−1 which decreased to 7.1 mg L−1 after the first addition of Na2SO3 (Figure 11a). A second addition reduced DO to 1.2 mg L−1 at a rate of −0.05 mg L−1 min−1, but the medium rapidly reached a DO of 7.6 mg L−1 at a rate of 0.69 mg L−1 min−1. The same trend occurred using FDIW, where the DO was initially high and constant at approximately 8 mg L−1 (Figure 11b). After Na2SO3 was added to the FDIW, DO decreased to <1 mg L−1 but was soon re-aerated by the filter.
To determine if the mean KLa values for the PDMS filter with SC and FDIW (i.e., no yeast) are representative of other bioreactors, they were compared to literature values of other aeration methods (Table 3). An ANOVA of the KLa data indicate the methods were not statistically different (df = 33, F = 0.525, p = 0.597). Additionally, when YPD was used with the PDMS filter, the aeration rate was near zero, and YPD without glucose gave the same result (Table 3).
Few papers report the oxygen uptake rate (OUR) of yeast in continuous cultures and those that do seldom provide KLa values for their aeration method. However, some values for S. cerevisiae are shown in Table 4 along with our experimental results. Statistically, there is a difference in the mean OUR values (df = 24, F = 4.93, p = 0.006), where PDMS/SC was greater than literature values, most of which were for sparged-impellers.
To resolve if this difference was a result of different biomass concentrations, qO2 means were calculated by standardizing OUR by biomass for those data sets where both OUR and biomass were available. Interestingly, none of the qO2 means were statistically different (df = 24, F = 0.714, p = 0.558), indicating that biomass could not account for the high oxygen uptake rates of the PDMS/SC method.

4. Discussion

The KLa values for the steady-state impeller/YPD and the PDMS SC methods were in the same range as most bioreactor aeration processes using yeast media and de-ionizer water. The most surprising result was the negligible KLa coefficients for PDMS/YPD method. Some studies have suggested that the viscosity of the broth plays the dominant role in reducing gas transfer to cultures as a result of substances in the solution, for example, sugars, especially in high concentrations [4,19]. Yet glucose concentrations were the same in the YPD and SC media (7.5 g L−1) for all the experiments. However, additional experiments using the PDMS filter and YPD with and without glucose confirmed that the YPD medium, and not the glucose, inhibited oxygen transfer in the hollow-fiber filter. The main differences of the YPD recipe from SC were the concentrations of the yeast nitrogen base and various amino acids (Table 1). Thus, one possibility is that amino acids in the medium could have clogged filter surfaces. For example, arginine, isoleucine, and phenylalanine were determined to be “sticky” in comparison to lysine and glutamic acid [35]. While it is conceivable that amino acid concentrations may have accounted for the difference in KLa values between the two media, it is also possible that other constituents in the exacts contributed to this effect.
It is known that KLa can be enhanced with higher mixing rates [5,12] as demonstrated by the impeller experiment. However, increased mixing increases shear stress on cells and can potentially damage them [36]. The highest KLa for a bioreactor, which was nearly 10 times higher than the average values in Table 3, was achieved with a PDMS filter at a high flow rate. However, increased flow through these filters also equates to increased shear stress on cells. The low flow rate (i.e., recirculation rate) in our PDMS/SC experiments not only achieved adequate aeration rates but kept cells growing at a constant specific growth rate of 0.2 h−1.
The measurement of DO also affects the calculation of KLa. Aroniada et al. [5] caution that the use of membrane DO probes have slow response times at high DO levels which increase when DO tends to zero. The use of the optical array to measure DO eliminated this variability, as evidenced by the immediate response of the DO spot to the addition of Na2SO3 to the media and FDIW. However, air bubbling in the bioreactor chamber is not compatible with this non-invasive sensor array since bubbles often adhered to the optical spots.
The oxygen utilization rate (OUR) using the PDMS filter differed depending on the medium in the bioreactor, which was also found for other filters [7]. For the continuous cultures, the lowest oxygen uptake rate (OUR) was in the YPD medium coincident with the lowest biomass. OUR progressively increased as biomass increased (not shown). The fact qO2 levels were not different indicates that biomass cannot account for the higher OUR values of the PDMS/SC method, signifying that the PDMS/SC method is superior to sparged-impeller aeration in maintaining highly oxygenated cultures.

5. Conclusions

Overall, the PDMS hollow-fiber filter in combination with the SC medium maintained near saturating DO levels for most cultures. This was essential since at low dilution rates the volume of the aerated medium being fed to the bioreactor was inadequate to supply cells with sufficient oxygen. Overall, the PDMS/SC method is easy to use, provides sufficient aeration of the yeast culture at lower mixing and dilution rates for moderate biomass concentrations. Combined with the novel PreSens sensor array, the system provides non-invasive, continuous sampling of aerobic yeast respiration in small sample volumes and thus may be suitable for space applications.

Author Contributions

Conceptualization, T.G., C.F. and B.R.; methodology, T.G. and C.F., formal analysis, T.G.; B.R.; data curation, C.F. and B.R.; writing—original draft preparation, T.G.; writing—review and editing, T.G., C.F., C.B. and B.R.; supervision, T.G. and B.R.; project administration, T.G.; funding acquisition, B.R. All authors have read and agreed to the published version of the manuscript.

Funding

This research was funded by the European Space Agency’s PRODEX program under the guidance of Martin Haag.

Institutional Review Board Statement

Not applicable.

Informed Consent Statement

Not applicable.

Data Availability Statement

Data are available from the PRODEX program via the corresponding author.

Acknowledgments

We thank Marcel Egli, for securing the original project for the yeast bioreactor. Finally, our thanks to the three reviews whose critical comments and suggestions helped to better this paper.

Conflicts of Interest

The authors declare no conflict of interest. It should be noted that the authors have collaborated on yeast production with Ronnie Willaert.

References

  1. Montes, F.J.; Catalán, J.; Galán, M.A. Prediction of kLa in yeast broths. Process. Biochem. 1999, 34, 549–555. [Google Scholar] [CrossRef]
  2. Emery, A.N.; Jan, D.C.-H.; Al-Rubeai, M. Oxygenation of intensive cell-culture. Appl. Microbiol. Biotechnol. 1995, 43, 1028–1033. [Google Scholar] [CrossRef] [PubMed]
  3. Walther, I. Space bioreactors and their applications. Adv. Space Biol. Med. 2002, 8, 197–213. [Google Scholar] [CrossRef]
  4. Garcia-Ochoa, F.; Gomez, E. Bioreactor scale-up and oxygen transfer rate in microbial processes: An overview. Biotechnol. Adv. 2009, 27, 153–176. [Google Scholar] [CrossRef]
  5. Aroniada, M.; Maina, S.; Koutinas, A.; Kookos, I.K. Estimation of volumetric mass transfer coefficient (kLa)—Review of classical approaches and contribution of a novel methodology. Biochem. Eng. J. 2020, 155, 107458. [Google Scholar] [CrossRef]
  6. I Betts, J.; Baganz, F. Miniature bioreactors: Current practices and future opportunities. Microb. Cell Factories 2006, 5, 21. [Google Scholar] [CrossRef] [Green Version]
  7. Cruz, A.J.G.; Silva, A.S.; Araujo, M.L.G.C.; Giordano, R.C.; Hokka, C.O. Estimation of the volumetric oxygen transfer coefficient (KLa) from the gas balance and using a neural network technique. Braz. J. Chem. Eng. 1999, 16, 179–183. [Google Scholar] [CrossRef]
  8. Badino, A.; Facciotti, M.; Schmidell, W. Volumetric oxygen transfer coefficients (kLa) in batch cultivations involving non-Newtonian broths. Biochem. Eng. J. 2001, 8, 111–119. [Google Scholar] [CrossRef]
  9. Marrot, B.; Barrios-Martinez, A.; Moulin, P.; Roche, N. Experimental Study of Mass Transfer Phenomena in a Cross Flow Membrane Bioreactor: Aeration and Membrane Separation. Eng. Life Sci. 2005, 5, 409–414. [Google Scholar] [CrossRef]
  10. Orgill, J.J.; Atiyeh, H.; Devarapalli, M.; Phillips, J.R.; Lewis, R.S.; Huhnke, R. A comparison of mass transfer coefficients between trickle-bed, hollow fiber membrane and stirred tank reactors. Bioresour. Technol. 2013, 133, 340–346. [Google Scholar] [CrossRef]
  11. Martínez-Force, E.; Benítez, T. Effects of varying media, temperature, and growth rates on the intracellular concentrations of yeast amino acids. Biotechnol. Prog. 2005, 11, 386–392. [Google Scholar] [CrossRef]
  12. García-Ochoa, F.; Santos, V.E.; Casas, J.A.; Gomez, E. Xanthan gum: Production, recovery, and properties. Biotechnol. Adv. 2000, 18, 549–579. [Google Scholar] [CrossRef]
  13. Russell, A.B.; Thomas, C.R.; Lilly, M.D. Oxygen transfer measurements during yeast fermentations in a pilot scale airlift fermenter. Bioprocess Eng. 1995, 12, 71–79. [Google Scholar] [CrossRef]
  14. Zedníková, M.; Orvalho, S.; Fialová, M.; Ruzicka, M.C. Measurement of Volumetric Mass Transfer Coefficient in Bubble Columns. ChemEngineering 2018, 2, 19. [Google Scholar] [CrossRef] [Green Version]
  15. Kim, H.J.; Jong, H.K.; Hyuck, J.O.; Chul, S.S. Morphological control of Monascus cells and scale-up of pigment fermentation. Process Biochem. 2002, 38, 649–655. [Google Scholar] [CrossRef]
  16. Schwippel, J.; Votruba, J. Oxygen and/or glucose limitation in a chemostat culture of Candida utilis mathematical model identification. Bioprocess Eng. 1995, 13, 133–140. [Google Scholar] [CrossRef]
  17. Rieger, M.; Käppeli, O.; Fiechter, A. The Role of Limited Respiration In The Incomplete Oxidation Of Glucose By Saccharomyces Cerevisiae. J. Gen. Microbiol. 1983, 129, 653–661. [Google Scholar] [CrossRef] [Green Version]
  18. Banti, D.C.; Tsali, A.; Mitrakas, M.; Samaras, P. The Dissolved Oxygen Effect on the Controlled Growth of Filamentous Microorganisms in Membrane Bioreactors. Environ. Sci. Proc. 2020, 2, 39. [Google Scholar] [CrossRef]
  19. Al-Mayah, A.M.R.; Muallah, S.K.; Al-Jabbar, A.A. Prediction of Oxygen Mass Transfer Coefficients in Stirred Bioreactor with Rushton Turbine Impeller for Simulated (Non-Microbial) Medias. Al-Khwarizmi Eng. J. 2014, 10, 1–14. [Google Scholar]
  20. Raghavendran, V.; Webb, J.P.; Cartron, M.L.; Springthorpe, V.; Larson, T.R.; Hines, M.; Mohammed, H.; Zimmerman, W.; Poole, R.K.; Green, J. A microbubble-sparged yeast propagation–fermentation process for bioethanol production. Biotechnol. Biofuels 2020, 13, 104. [Google Scholar] [CrossRef]
  21. Terasaka, K.; Shibata, H. Oxygen transfer in viscous non-Newtonian liquids having yield stress in bubble columns. Chem. Eng. Sci. 2003, 58, 5331–5337. [Google Scholar] [CrossRef]
  22. Caşcaval, D.; Galaction, A.-I.; Turnea, M. Comparative analysis of oxygen transfer rate distribution in stirred bioreactor for simulated and real fermentation broths. J. Ind. Microbiol. Biotechnol. 2011, 38, 1449–1466. [Google Scholar] [CrossRef] [PubMed]
  23. Chisti, Y.; Jauregui-Haza, U.J. Oxygen transfer and mixing in mechanically agitated airlift bioreactors. Biochem. Eng. J. 2002, 10, 143–153. [Google Scholar] [CrossRef] [Green Version]
  24. Galaction, A.-I.; Cascaval, D.; Oniscu, C.; Turnea, M. Prediction of oxygen mass transfer coefficients in stirred bioreactors for bacteria, yeasts and fungus broths. Biochem. Eng. J. 2004, 20, 85–94. [Google Scholar] [CrossRef]
  25. Klein, T.; Schneider, K.; Heinzle, E. A system of miniaturized stirred bioreactors for parallel continuous cultivation of yeast with online measurement of dissolved oxygen and off-gas. Biotechnol. Bioeng. 2013, 110, 535–542. [Google Scholar] [CrossRef]
  26. Jouhten, P.; Rintala, E.; Huuskonen, A.; Tamminen, A.; Toivari, M.; Wiebe, M.; Ruohonen, L.; Penttilä, M.; Maaheimo, H. Oxygen dependence of metabolic fluxes and energy generation of Saccharomyces cerevisiae CEN.PK113-1A. BMC Syst. Biol. 2008, 2, 60. [Google Scholar] [CrossRef] [Green Version]
  27. Lee, J.H.; Lim, Y.B.; Park, K.M.; Lee, S.W.; Baig, S.Y.; Shin, H.T. Factors Affecting Oxygen Uptake by Yeast Issatchenkia orientalis as Microbial Feed Additive for Ruminants. Asian Australas. J. Anim. Sci. 2003, 16, 1011–1014. [Google Scholar] [CrossRef]
  28. Özbek, B.; Gayik, S. The studies on the oxygen mass transfer coefficient in a bioreactor. Process. Biochem. 2001, 36, 729–741. [Google Scholar] [CrossRef]
  29. Peddie, F.L.; Simpson, W.J.; Kara, B.V.; Robertson, S.C.; Hammond, J.R.M. Measurement of Endogenous Oxygen Uptake Rates of Brewers’ Yeasts. J. Inst. Brew. 1991, 97, 21–25. [Google Scholar] [CrossRef]
  30. Ju, L.-K.; Sundararajan, A. The effects of cells on oxygen transfer in bioreactors. Bioprocess Eng. 1995, 13, 271–278. [Google Scholar] [CrossRef]
  31. Yildiz, E.; Keskinler, B.; Pekdemir, T.; Akay, G.; Nuhoglu, A. High strength wastewater treatment in a jet loop membrane bioreactor: Kinetics and performance evaluation. Chem. Eng. Sci. 2005, 60, 1103–1116. [Google Scholar] [CrossRef]
  32. Millward, H.; Bellhouse, B.; Sobey, I. The vortex wave membrane bioreactor: Hydrodynamics and mass transfer. Chem. Eng. J. 1996, 62, 175–181. [Google Scholar] [CrossRef]
  33. Ahmed, T.; Semmens, M.J.; Voss, M.A. Oxygen transfer characteristics of hollow-fiber, composite membranes. Adv. Environ. Res. 2004, 8, 637–646. [Google Scholar] [CrossRef]
  34. Kuriyama, H.; Kobayashi, H. Effects of oxygen supply on yeast growth and metabolism in continuous fermentation. J. Ferment. Bioeng. 1993, 75, 364–367. [Google Scholar] [CrossRef]
  35. Levy, E.D.; De, S.; Teichmann, S. Cellular crowding imposes global constraints on the chemistry and evolution of proteomes. Proc. Natl. Acad. Sci. USA 2012, 109, 20461–20466. [Google Scholar] [CrossRef] [Green Version]
  36. Stafford, R.A. Yeast Physical (Shear) Stress: The Engineering Perspective. In Brewing Yeast Fermentation Performance, 2nd ed.; Smart, K., Ed.; Wiley: New York, NY, USA, 2003. [Google Scholar]
Figure 1. (a) the optical window of the sensor array showing the detectors for dissolved oxygen (blue rectangle, top left), pH (red rectangle, top right), and optical density (green rectangle, bottom); (b) the optical sensor array with the arrow pointing to the optical window; and (c) the complete bioreactor system with the bioreactor flask atop the optical array.
Fermentation 07 00282 g001
Figure 2. Three filter technologies. (a) From left to right: the PDMSXA-100 cm2 (PDMS) filter, the Evenflow flat membrane filter, and Liqui-Cel filter; (b) schematic of the bioreactor system showing the filter location (in blue) downstream of the recirculating pump.
Fermentation 07 00282 g002
Figure 3. Bubbled YPD medium in: (a) the culture chamber; (b) the medium reservoir to the left of the culture chamber; and (c) time series of aerated medium delivered at D = 0.2 h−1. Colors are blue for DO, red for pH, and green for biomass.
Fermentation 07 00282 g003
Figure 4. (a) Set-up of stirred bioreactor; and (b) a time series of the bioreactor mixed with an impeller and YPD medium. Colors are blue for DO and green for biomass.
Fermentation 07 00282 g004
Figure 5. Hydrogen peroxide addition to YPD medium in the bioreactor (arrow). Colors are blue for DO, red for pH, and green for biomass.
Fermentation 07 00282 g005
Figure 6. Oxygenation of the bioreactor with the flat membrane and YPD medium. Colors are blue for DO, red for pH, and green for biomass.
Fermentation 07 00282 g006
Figure 7. Liqui-Cel HFF and YPD medium. Colors are blue for DO, red for pH, and green for biomass.
Fermentation 07 00282 g007
Figure 8. PDMS hollow-fiber filter with YPD medium for: (a) longer term experiment and (b) after cleaning the PDMS filter. Colors are blue for DO, red for pH, and green for biomass.
Fermentation 07 00282 g008
Figure 9. (a) PDMS hollow-fiber filter using SC medium with additions of Na2SO3; (b) longer term, time series of the steady-state culture using the PDMS bioreactor with SC but no Na2SO3 additions. Colors are blue for DO, red for pH, and green for biomass.
Fermentation 07 00282 g009
Figure 10. (a) YPD aeration with the PDMS hollow-fiber filter; (b) PDMS washed with 100 mL of FDIW to remove YPD.
Fermentation 07 00282 g010
Figure 11. Oxygenation using the PDMS hollow-fiber filter with (a) SC medium without yeast and (b) filtered de-ionized water.
Fermentation 07 00282 g011
Table 1. Formula for the SC medium and an example of the composition of YPD.
Composition 1YPD 2
(mg L−1)
SC
(mg L−1)
Composition 1YPD 2
(mg L−1)
SC
(mg L−1)
(NH4)2SO405000Lysine18376
YNB17,0006700Methionine6176
Amino acids26111216Phenylalanine19276
Alanine25776Proline
Arginine29276Pyrrolysine 2
Aspartic acid Serine12276
Asparagine10276Selenocysteine
Cysteine 76Threonine95.176
Glutamine39776Tryptophan
Glutamic acid Tyrosine10276
Glycine12076Valine17076
Histidine42.576Nucleic acids
Isoleucine AdenineND 318
Leucine212176UracilND 376
1 Twenty amino acids from nine essential, six conditionally essential, and five non-essential amino acids. 2 Non-essential amino acids normally not in either medium. The YPD composition from [11]. 3 ND—No Data.
Table 2. Operating conditions during the different experiments.
ExperimentRepeatedMediumTemperature
(°C)
Pressure
(mbars)
DOS1
(mg L−1)
1 Bubbling4YPD26.4 ± 1.1973.8 ± 0.317.74
2 Impeller3YPD26.4 ± 1.1973.8 ± 0.317.74
3 H2O23YPD26.8 ± 0.18973.8 ± 0.507.69
4 Flat Membrane2 2YPD26.6 ± 0.10965.0 ± 2.47.65
5 Liqui-Cel HFF3YPD26.6 ± 0.10965.0 ± 2.47.65
6 PDMS HFF8YPD26.3 ± 0.65957.2 ± 0.117.62
7 PDMS HFF5SC26.8 ± 0.23949.1 ± 0.357.54
1 Dissolved oxygen in the bioreactor (DOBR) and the saturated DO (DOs) were taken at the end of the experiments. Values were compensated for temperature and pressure. 2 Repeated three times but one file was corrupted.
Table 3. KLa from experiments and the literature.
Aeration ProcessMediumKLa (min−1)N 1References
BubbledBroth0.30−2.44[12,13]
BubbledDIW1.5−3.42[14]
Impeller (CSTR)Broth0.09−1.74[2,15]
Impeller-SpargedBroth0.30−2.415[16,17,18,19,20,21,22,23,24,25,26,27,28,29,30]
Impeller-SpargedDIW0.24−5.58[5,12,23,28]
MembranesWW 2, Broth0.13−8.13[9,31,32]
Various HFFDIW0.03−2.78[9,10,33]
PDMS 2500DIW0.33−7.82[10]
PDMS 100 1FDIW1.3−1.75This study
PDMS 100 1SC1.1−1.54This study
PDMS 100 1YPD≤−0.094This study
PDMS 100 1YPD (no glucose)≤−0.023This study
1 N—sample size. 2 WW—wastewater.
Table 4. Oxygen uptake rates of yeast 1.
MethodBiomass
(mg mL−1)
KLa
(min−1)
OUR2
(mg O2 L−1 min−1)
qO2 (mg O2 gDwt−1 min−1)N 3
H2O2/YPD2.3−3.52.3 ± 1.22.3 ± 0.293.7 ± 5.73
Impeller/YPD0.3−2.670.87 ± 0.026.0 ± 3.12.3 ± 1.23
PDMS/YPD0.6–1.2negligible−0.18 ± 0.320.06 ± 0.094
PDMS/ SC1.4–381.3 ± 0.175.6 ± 4.33.0 ± 4.14
Sparged-Impeller [20,23,24,25,26,27,29,30,34]1.4−501.3 ± 0.170.88 ± 1.04.8 ± 5.713
1 All yeast are S. cevevisiae except for one, Schizosaccharomyces pomb [25]. 2 For negligible KLa, OUR was calculated based on dDO/dt. OUR is reported as positive uptake. 3 N is the sample size.
Publisher’s Note: MDPI stays neutral with regard to jurisdictional claims in published maps and institutional affiliations.

