Article

Impact of Genotype, Environment, and Malting Conditions on the Antioxidant Activity and Phenolic Content in US Malting Barley

1
Department of Applied Engineering, Zhejiang Economic and Trade Polytechnic, Hangzhou 310018, China
2
Department of Plant Sciences, North Dakota State University. P.O. 5051, Fargo, ND 58105, USA
3
Malteurop North America., Milwaukee, WI 53215, USA
*
Author to whom correspondence should be addressed.
Fermentation 2020, 6(2), 48; https://doi.org/10.3390/fermentation6020048
Submission received: 4 April 2020 / Revised: 22 April 2020 / Accepted: 27 April 2020 / Published: 29 April 2020
(This article belongs to the Special Issue Fermentation and Bioactive Metabolites 2.0)

Abstract

:
The phenolic content and antioxidant potential of malting barley are important in brewing. The objective of our study was to investigate the effects of barley genotype, growing environment, and malting conditions on the total phenolic content and antioxidant activities of malting barley grown in North America. Eight barley cultivars grown at three locations over three years were used. For the malting study, a single barley cultivar, separated into different kernel size fractions, was germinated for various periods of time and then processed by kilning or freeze-drying. Total phenolic content (TPC) and some of the antioxidant activities, including DPPH, ABTS, and superoxide anion radical scavenging activities, reducing power, and iron (II) chelating activity, were significantly impacted by the barley genotype, growth environment, and their interactions. The TPC and most antioxidant activities were also influenced by malting conditions and were generally higher in the malted barleys of the thin kernel size fraction, four-day germination, and in samples processed by kilning, when compared to the plumper kernel size fractions, one and two days of germination, and freeze-dried samples, respectively. There were interactions between malting parameters, and stepwise regression analysis was used to suggest the contribution of each parameter to the TPC and antioxidant activities.

1. Introduction

It has been well-documented that phenolic compounds present in cereal grains, such as dietary antioxidants, may be associated with potential health benefits, including the reduced risk of coronary heart disease [1,2], ischemic stroke [3], type II diabetes [4,5], and certain types of cancer [6,7,8]. However in terms of barley (Hordeum vulgare L.), total food use accounts for less than 6% of the world total crop [9], and is likely even lower in western countries. Livestock feed is the major use (> 70%), with the value-added process of malting accounting for about 20% of the crop. The major use of barley malt is in the brewing and distilling industries, with a lesser amount utilized in food products. Nevertheless, phenolics also have important functions in brewing, which have been reported to contribute to beer color, aroma, flavor and flavor stability, and colloidal stability [10,11]. They act as potential anti- or pro-oxidants, and as interaction partners with other beer constituents, such as protein. Beer phenolics are derived from both the malt and hops (Humulus lupulus L.).
Phenolic compounds in barley include phenolic acids, flavonoids, proanthocyanidins, and tannins, which will exhibit various antioxidant properties depending on the methods of processing [12,13]. The phenolic substances in barley were recently covered as part of a review on phenolics in beer by Wannenmacher et al. [10]. Free phenolic acids and bound are the most abundant, followed by flavanols. Ferulic- and p-courmaric acids are the predominant phenolic acids. While found in all tissues, phenolics acids are found at a higher concentration in the outer tissues of the grain husk, pericarp, and aleurone, and a large proportion are bound to cell wall polysaccharides.
A number of studies have examined the total phenolic content and antioxidant activities of several types of barley, including malting [13,14,15], hulless [16,17], highland [18], and colored [19]. Most studies utilized in vitro screening methods for antioxidant activity, such as ABTS and DPHH radical scavenging activities, and also evaluated total phenolic content (TPC). However, individual phenolic acids were determined in several cases [14,18,19]. Yang et al. [18] and Zhao et al. [15] reported that there were significant differences in the antioxidant activities and the TPC of the barley varieties evaluated. These studies suggested that the choice of barley variety will be of great interest and importance for human consumption of phtyochemicals [19,20] and potentially for the purpose of brewing beers with high antioxidant activity [20,21].
The change in TPC and individual phenolic compounds during malting has been extensively investigated and was recently reviewed by Wannenmacher et al. [10]. In addition, a number of studies have examined changes in antioxidant activity during the malting of barley and other grains [17,22,23,24,25]. Koren et al. [24] reported that antioxidant activities were always higher in malts, when compared to barley, and that the largest changes occurred in steeping.
The content of phenolics in barley might be influenced by genetic differences, maturity stage, environment/climate, and growing conditions, thereby influencing the corresponding antioxidant properties. It is well known that the effects of genotype (G), growing environment (E), and G × E on crop traits can only be measured and analyzed when genotypes are replicated over several locations [26]. Growing environment includes agronomic conditions that contribute to the growth and development of plants and further influence crop phenotypic traits. The contributions of G, E, and G × E on the antioxidant activity and TPC in wheat have been investigated. For hard winter wheat, three individual studies were carried out to investigate the antioxidant properties of wheat bran in from several wheat varieties grown at multiple locations in Colorado [27,28,29]. For hard spring wheat, Mpofu et al. [30] examined the TPC, antioxidant activities, and phenolic acid compositions in six hard spring wheat varieties grown at four locations in Canada, and found that G × E interaction was small for all traits in comparison with G and E effects. With the exception of the study by Narwal et al. [25], there have been few studies reporting the effects of G, E, and G × E on the total phenolic content and antioxidant properties in barley, although many different genotypes have been evaluated in other studies. Narwal et al. [25] demonstrated that genotype, year to year environmental differences, and location all had a significant impact on the antioxidant activity and TPC of Indian barley. Cai et al. [14], however, reported that the increases observed in individual phenolic acids following malting were genotype-independent.
The primary objective of this study was to investigate the impact of genotype and growing environment on the antioxidant activity and total phenolic content of North American types of malting barleys, as they represent a relatively narrow germplasm base. A secondary objective was to evaluate the influence of malt germination time on the same parameters.. Germination time is important, as while brewer’s malts are generally germinated for at least three days, the times for sprouted grains used in the food industry can vary considerably.

2. Materials and Methods

2.1. Chemicals

2,2-diphenyl-1-picrylhydrazyl (DPPH), 2,2’-azinobis (3-ethylbenzothiazoline-6-sulfonic acid) diammonium salt (ABTS), 6-hydroxy-2,5,7,8-tetramethylchroman carboxylic acid (Trolox), 3-(2-Pyridyl)-5,6-diphenyl-1,2,4-triazine-4’,4’’-disulfonic acid monosodium salt (ferrozine), xanthine oxidase (XOD), nitrotetrazolium blue chloride (NBT), and hypoxanthine (HPX) were purchased from Sigma-Aldrich (St.Louis, MO, USA). Folin–Ciocalteu’s phenol reagent was purchased from MP Biomedicals, Inc. (Lot No. 1047J, Solon, OH, USA). All other solvents were purchased from VWR International (West Chester, PA, USA) and were of ACS grade.

2.2. Barley Samples

Eight barley genotypes were utilized, for the study of genotypic and environmental effects, which were grown at three locations in North Dakota over three crop years. Five genotypes were six-rowed barley types (6R) and three were two-rowed (2R). As the intent of this research was only to identify genotype and environment impacts, specific genotypes are subsequently identified by the alpha-numeric code: Morex-A(6R), Robust-B(6R), Drummond-C(6R), ND16301-D(6R), Tradition- E(6R), Conlon F(2R), Harrington- G(2R), and Merit- H(2R). Morex and Robust are from the University of Minnesota barley breeding program, while Drummond, ND16301, and Conlon are from North Dakota State University (Fargo, ND, USA). Tradition and Merit were released by the breeding program of Busch Agricultutal Resources LLC (Fort Collins, CO, USA), and Harrington is from the Crop Science Department at the University of Saskatchewan (Saskatoon, Saskatchewan, CA, USA).
The North Dakota growing environments were also coded: Langdon-LI, Minot-LII, and Williston-LIII. Langdon is located in the northeast, Minot is north central, and Williston is in the north western region of the state. In terms of annual rainfall, the locations become drier from east to west [31]. The soil at Landgon is a fine, montmorillonitic Udic Natriboroll soil, that at Minot is a Williams loam, a fine-loamy, mixed Typic [32], while that at Williston is a Williams-Bowbells loam complex (fine-loamy, mixed, superactive, frigid, Pachic Argiustoll).
As the thinnest kernels are not used in malting, thin grains (passing through a 2.0 × 19 mm sieve opening) were removed for the study on genotype and environment. These were removed by using a Eureka-Niagara Sample Barley grader (S. Howes Co. Inc., Silver Creek, NY, USA). When averaged over locations and years, the kernel plumpness and protein content of the samples ranged from 10.8–12.8%, and 83.1–93.5%, respectively. Both are within the acceptable range for North American adjunct brewers.
A single genotype (Tradition) was selected for the study of malting conditions, as it was the most widely grown malting genotype in the region at the time. This was grown in Sydney, MT, USA and was from the commercial (irrigated) crop. This sample was divided into three fractions based upon kernel size: kernels retained on sieves with 2.8, 2.4, and 2.0 × 19 mm openings. The unsized original barley sample represented a fourth fraction.

2.3. Micro-Malting

Micro-malting was conducted according to our standard laboratory procedure [33,34]. Steep times to reach 43.7% moisture were determined by pilot steeping of 10 g (dry basis, db) samples. Eighty grams (db) of each sample were then steeped to moisture at 16 °C. A 1-h air-rest was included for each 12 h of steeping, and the steep water was aerated with compressed air for 6 min/hr. Barley samples were germinated for 1, 2, or 4 days according to the experimental design, and kilned using a 24 h schedule in which the temperature was sequentially ramped from 49 to 85 °C. Green malts were removed from the germination cabinet following 1, 2, or 4 days of germination. These samples were frozen and then freeze-dried.

2.4. Preparation of Extracts from Barley and Malt

Samples were ground to pass a 0.5 mm screen grind with an Udy mill (Udy, Corp., Fort Collins, CO, USA) fitted with a 0.5 mm screen. Ground samples (1 g) were extracted with 20 mL of 80% acetone (v/v) under nitrogen on a reciprocating shaker for 1 h. After centrifugation (4000× g, 10 min), the supernatant was collected. To avoid oxidation, extracts were stored in the dark at −20 °C, and analyses were performed within 24 h.

2.5. Radical Scavenging Activities

The radical scavenging activity of barley extracts was evaluated by in vitro assays with three common radicals, DPPH, ABTS+, and superoxide (O2). The experimental procedures were conducted according to the methods described by Yu. [35] with minor exceptions. For DPPH assay, each barley extract (0.1 mL) was added to 2.9 mL of 6 × 10⁻⁵ mol/L methanolic solution of DPPH and vortexed thoroughly. The absorbance of the remaining DPPH was measured at 517 nm against a blank of pure methanol after the solution was incubated in the dark for 60 min. For the ABTS assay, an aliquot of each barley extract (0.1 mL) was mixed with 2.9 mL of diluted ABTS radical cation solution. After reaction at 30 °C for 20 min, the absorbance at 734 nm was measured against a blank of pure ethanol. The final ABTS+ and DPPH scavenging activities were calculated as Trolox equivalents (TE) per gram of dry barley (μmol TE/g, db). For the superoxide scavenging experiment, each barley extract (0.1 mL) was added to the reaction solution containing 0.1 mL of 30 mmol/L EDTA, 0.1 mL of 3 mmol/L HPX, and 0.2 mL of 1.42 mmol/L NBT. After standing at room temperature for 3 min, 0.1 mL of 0.75 unit/mL XOD was added to the mixture, and the volume was brought up to 3 mL with 0.05 mol/L phosphate buffer (pH 7.4). Then, the solution was incubated at room temperature for 40 min, and the absorbance was measured at 560 nm. The O2 scavenging activity was calculated as the percentage of O2 scavenged by antioxidants (%).

2.6. Iron (II) Chelating Activity

Iron (II) Chelating Activity was detected as described by Xu et al. [36]. The barley extract (0.5 mL) was mixed thoroughly with 0.05 mL of FeCl2 (2 mmol/L). After standing for 5 min, the reaction was initiated by the addition of 5 mmol/L ferrozine (0.1 mL), and the total volume was adjusted to 3 mL with solvent. Then, the mixture was shaken vigorously and incubated at room temperature for 10 min. The absorbance of the solution was measured at 562 nm. The final results were expressed as micromoles of EDTA equivalents (EDTAE) per gram of dry barley (µmol EDTAE/g, db).

2.7. Reducing Power

The reducing power of barley extract was measured following the method of Oktay et al. [36]. The assay mixture contained 0.5 ml of barley extract with 3 mL of phosphate buffer (0.2 mol/L, pH 6.6) and 2.5 mL of potassium ferricyanide (1%, w/v). After incubated at 50 °C for 20 min, 2.5 mL of trichloroacetic acid solution (10%, w/v) was added to the mixture followed by centrifugation at 4000 × g for 10 min. The upper layer of solution (2.5 mL) was mixed with deionized water (2.5 mL) and FeCl3 (0.5 mL, 0.1%, w/v), and the absorbance was measured at 700 nm. A standard curve was prepared using various concentrations of ascorbic acid (AA), and the reducing power was expressed as micromoles of ascorbic acid equivalents (AAE) per gram of dry barley (µmol AAE/g, db).

2.8. Total Phenolic Content (TPC)

TPC was determined according to the method described by Xu et al. [36] with modification. Briefly, 0.1 mL of barley extract was mixed with 2.5 mL of 10-fold diluted Folin–Ciocalteu’s phenol reagent and allowed to stand for 5 min. The mixture was added into 2 mL of saturated sodium carbonate solution (7.5%, w/v), and the final volume was made up to 10 mL with deionized water. After 1 h of reaction at room temperature, the absorbance at 760 nm was determined and used to calculate the total phenolic content in barley extract. The measurement was compared to a standard curve of prepared gallic acid (GA) solution, and the total phenolic content was expressed as milligrams of gallic acid equivalents (GAE) per gram of dry barley (mg GAE/g, db).

2.9. Statistical Analysis

Triplicate samples of each barley sample were tested for the portion of the study on genotype and environment, while duplicate samples were malted for each combination of parameters in the malting study. Statistical analyses were conducted by using procedures of the Statistical Analysis System (version 9.1, SAS Institute, Cary, NC, USA). Data were analyzed by an analysis of variance (ANOVA) procedure using the general linear model. F-tests were considered significant at p ≤ 0.05. Means were separated using least significant differences (LSDs) to determine the significant differences.
The general linear model (GLM) was used to perform a forward stepwise regression with alpha-to-enter=0.15 and alpha-to-remove=0.15. Stepwise regression was used to determine how much variability could be explained by each independent variable (such as kernel size fraction, germination time, and malt drying type) for the dependent variables. Regression was performed on the means averaged across the replicates.

3. Results

3.1. Effect of Genotype and Environment on the Total Phenolic Content and Antioxidant Activities

In this study, five model systems were used to evaluate the antioxidant activity in barley, as each mechanism has limitations. As such, researchers have often recommended that at least two different methods are used in any evaluation of the antioxidant activity [35,36]. Limitations of in vitro antioxidant assays were recently addressed by Granato et al. [37]. Table 1 shows the results of the effects of barley cultivar and growth environment on the antioxidant activity and TPC. When averaged across locations and years, the highest DPPH scavenging activity was found in D(6R) (13.02 µmol TE/g) and C(6R) (12.76 µmol TE/g). Both were six-rowed genotypes. The two-rowed genotype, F(2R), showed the lowest DPPH scavenging activity (10.27 µmol TE/g), and also the lowest TPC (2.20 mg GAE/g). As for ABTS+ scavenging activity, there were no significant differences between A(6R), B(6R), C(6R), D(6R), G(2R), and H(2R), while E(6R) and F(2R) had relatively lower values. D(6R) and F(2R), again, showed the highest and lowest antioxidant activity of reducing power when averaged across growth environments. H(2R) exhibited the highest iron (II) chelating activity (2.18 µmol EDTA/g, db), and the lowest iron (II) chelating activity was observed in the E(6R) and B(6R) cultivars. Overall, the highest TPC was found in D(6R), which also had the highest antioxidant activities in all the five assays. The range of TPC in all the 72 barley samples in the current study was from 1.83 to 3.14 mg GAE/g.
When data was averaged over genotypes and years, location only had a significant effect on iron (II) chelating activity and TPC (Table 1). However, as can be seen in the table, there was a considerable range in most values at each location. As an alternative, the rankings of each genotype at each growth location for DPPH scavenging activity and total TPC are shown in Table 2. In terms of DPPH scavenging activity, C(6R), D(6R), and F(2R) were consistent with their rankings across the three locations. However, several genotypes changed rank across locations, suggesting that genotypes may not respond uniformly across locations.

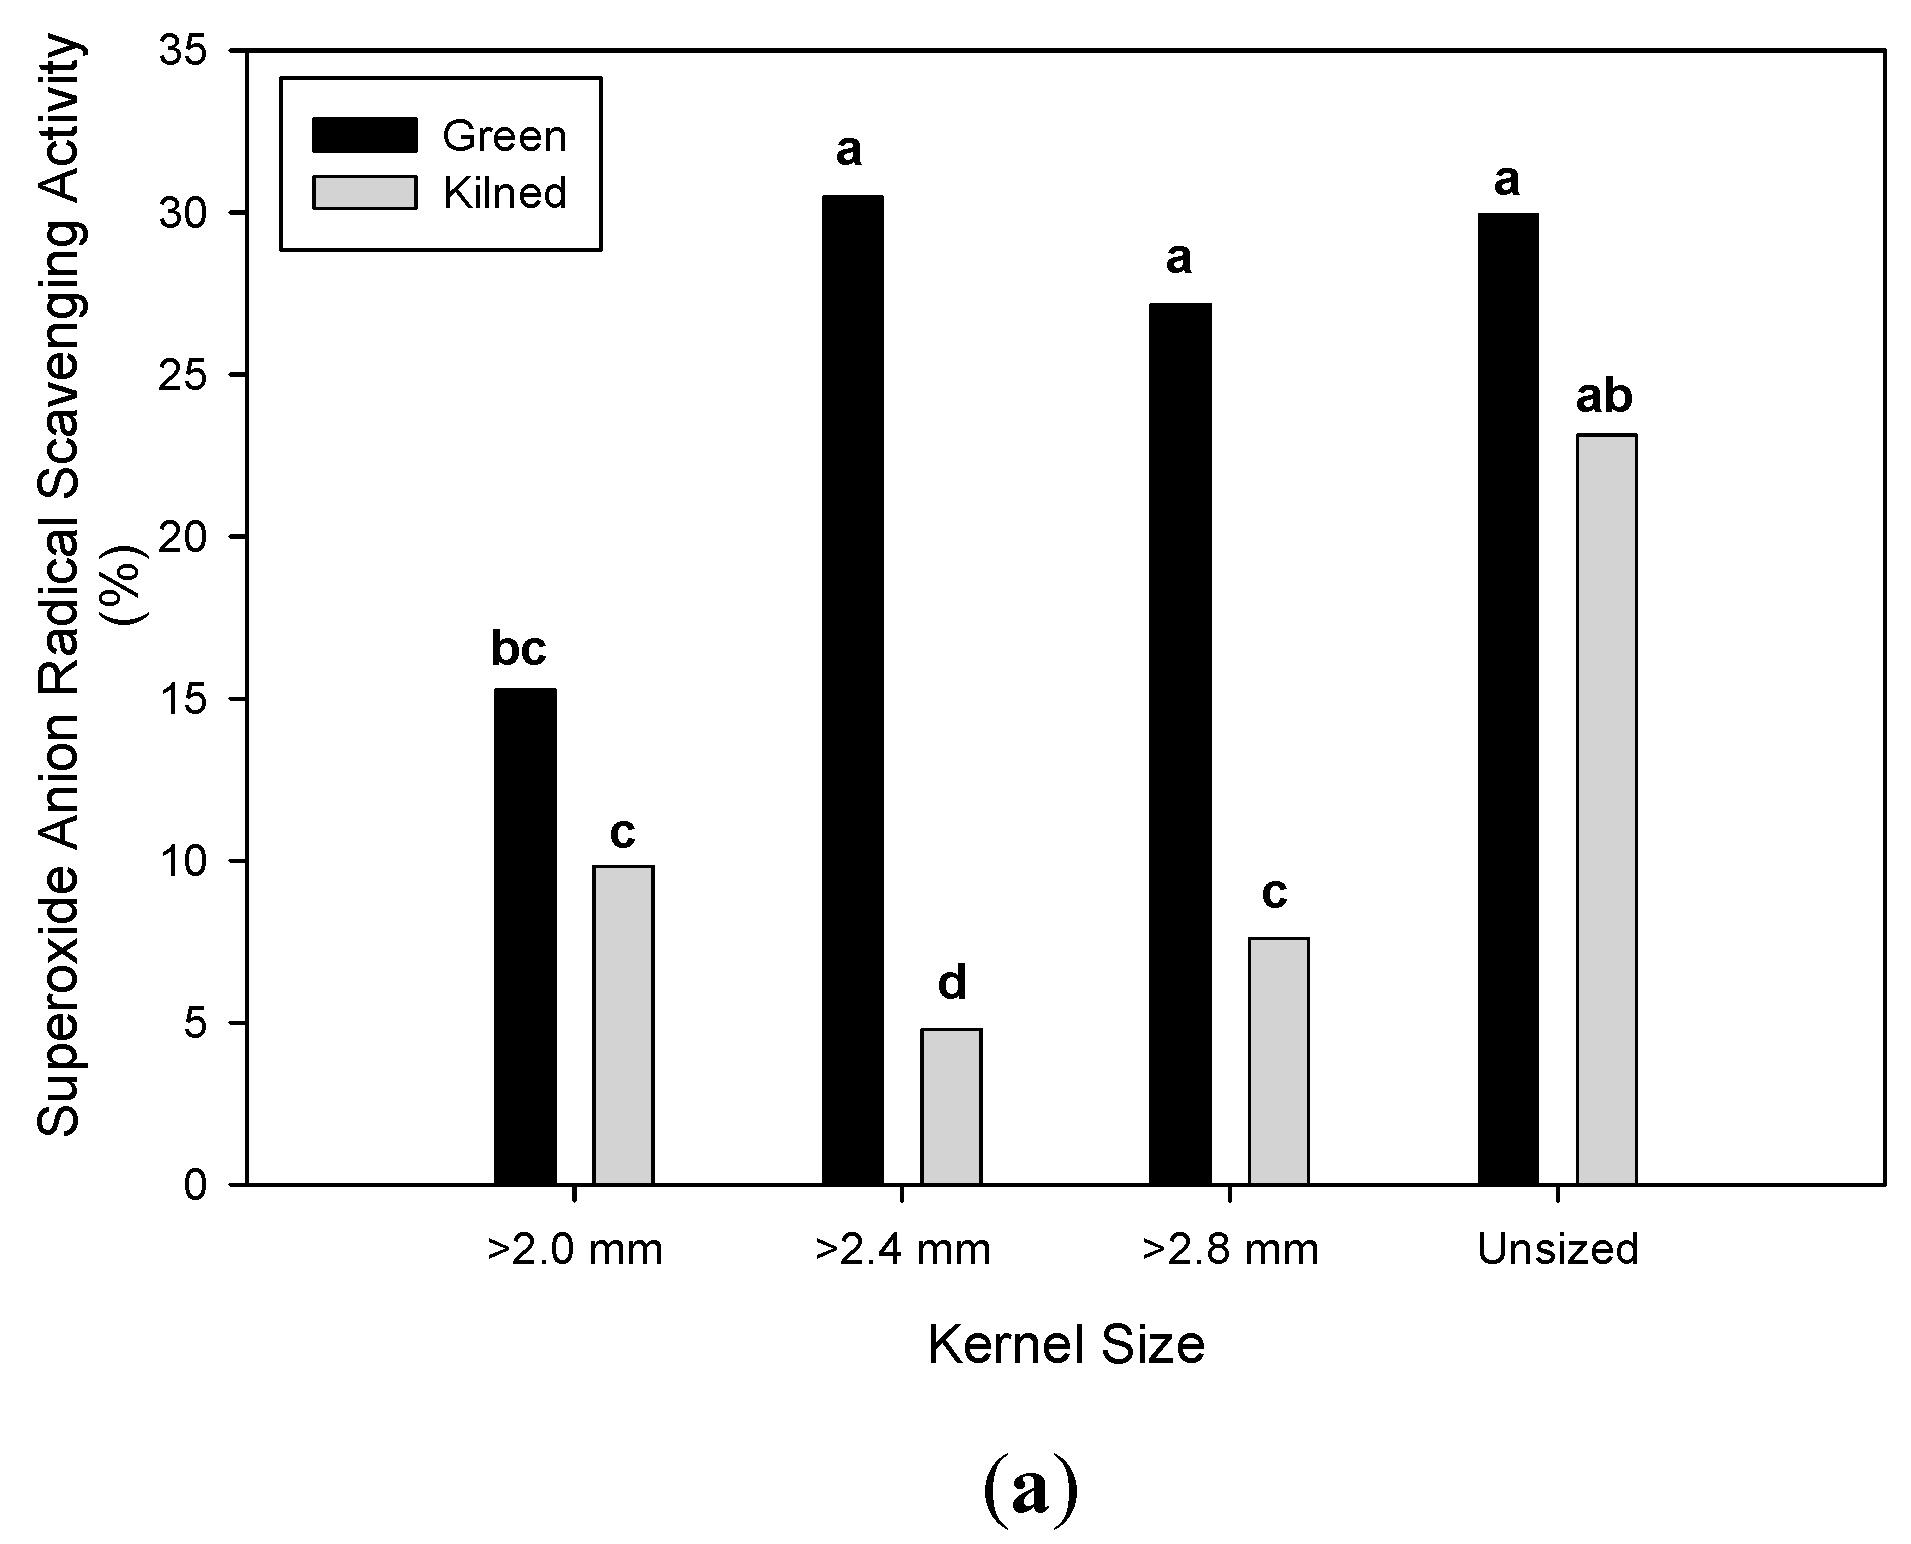
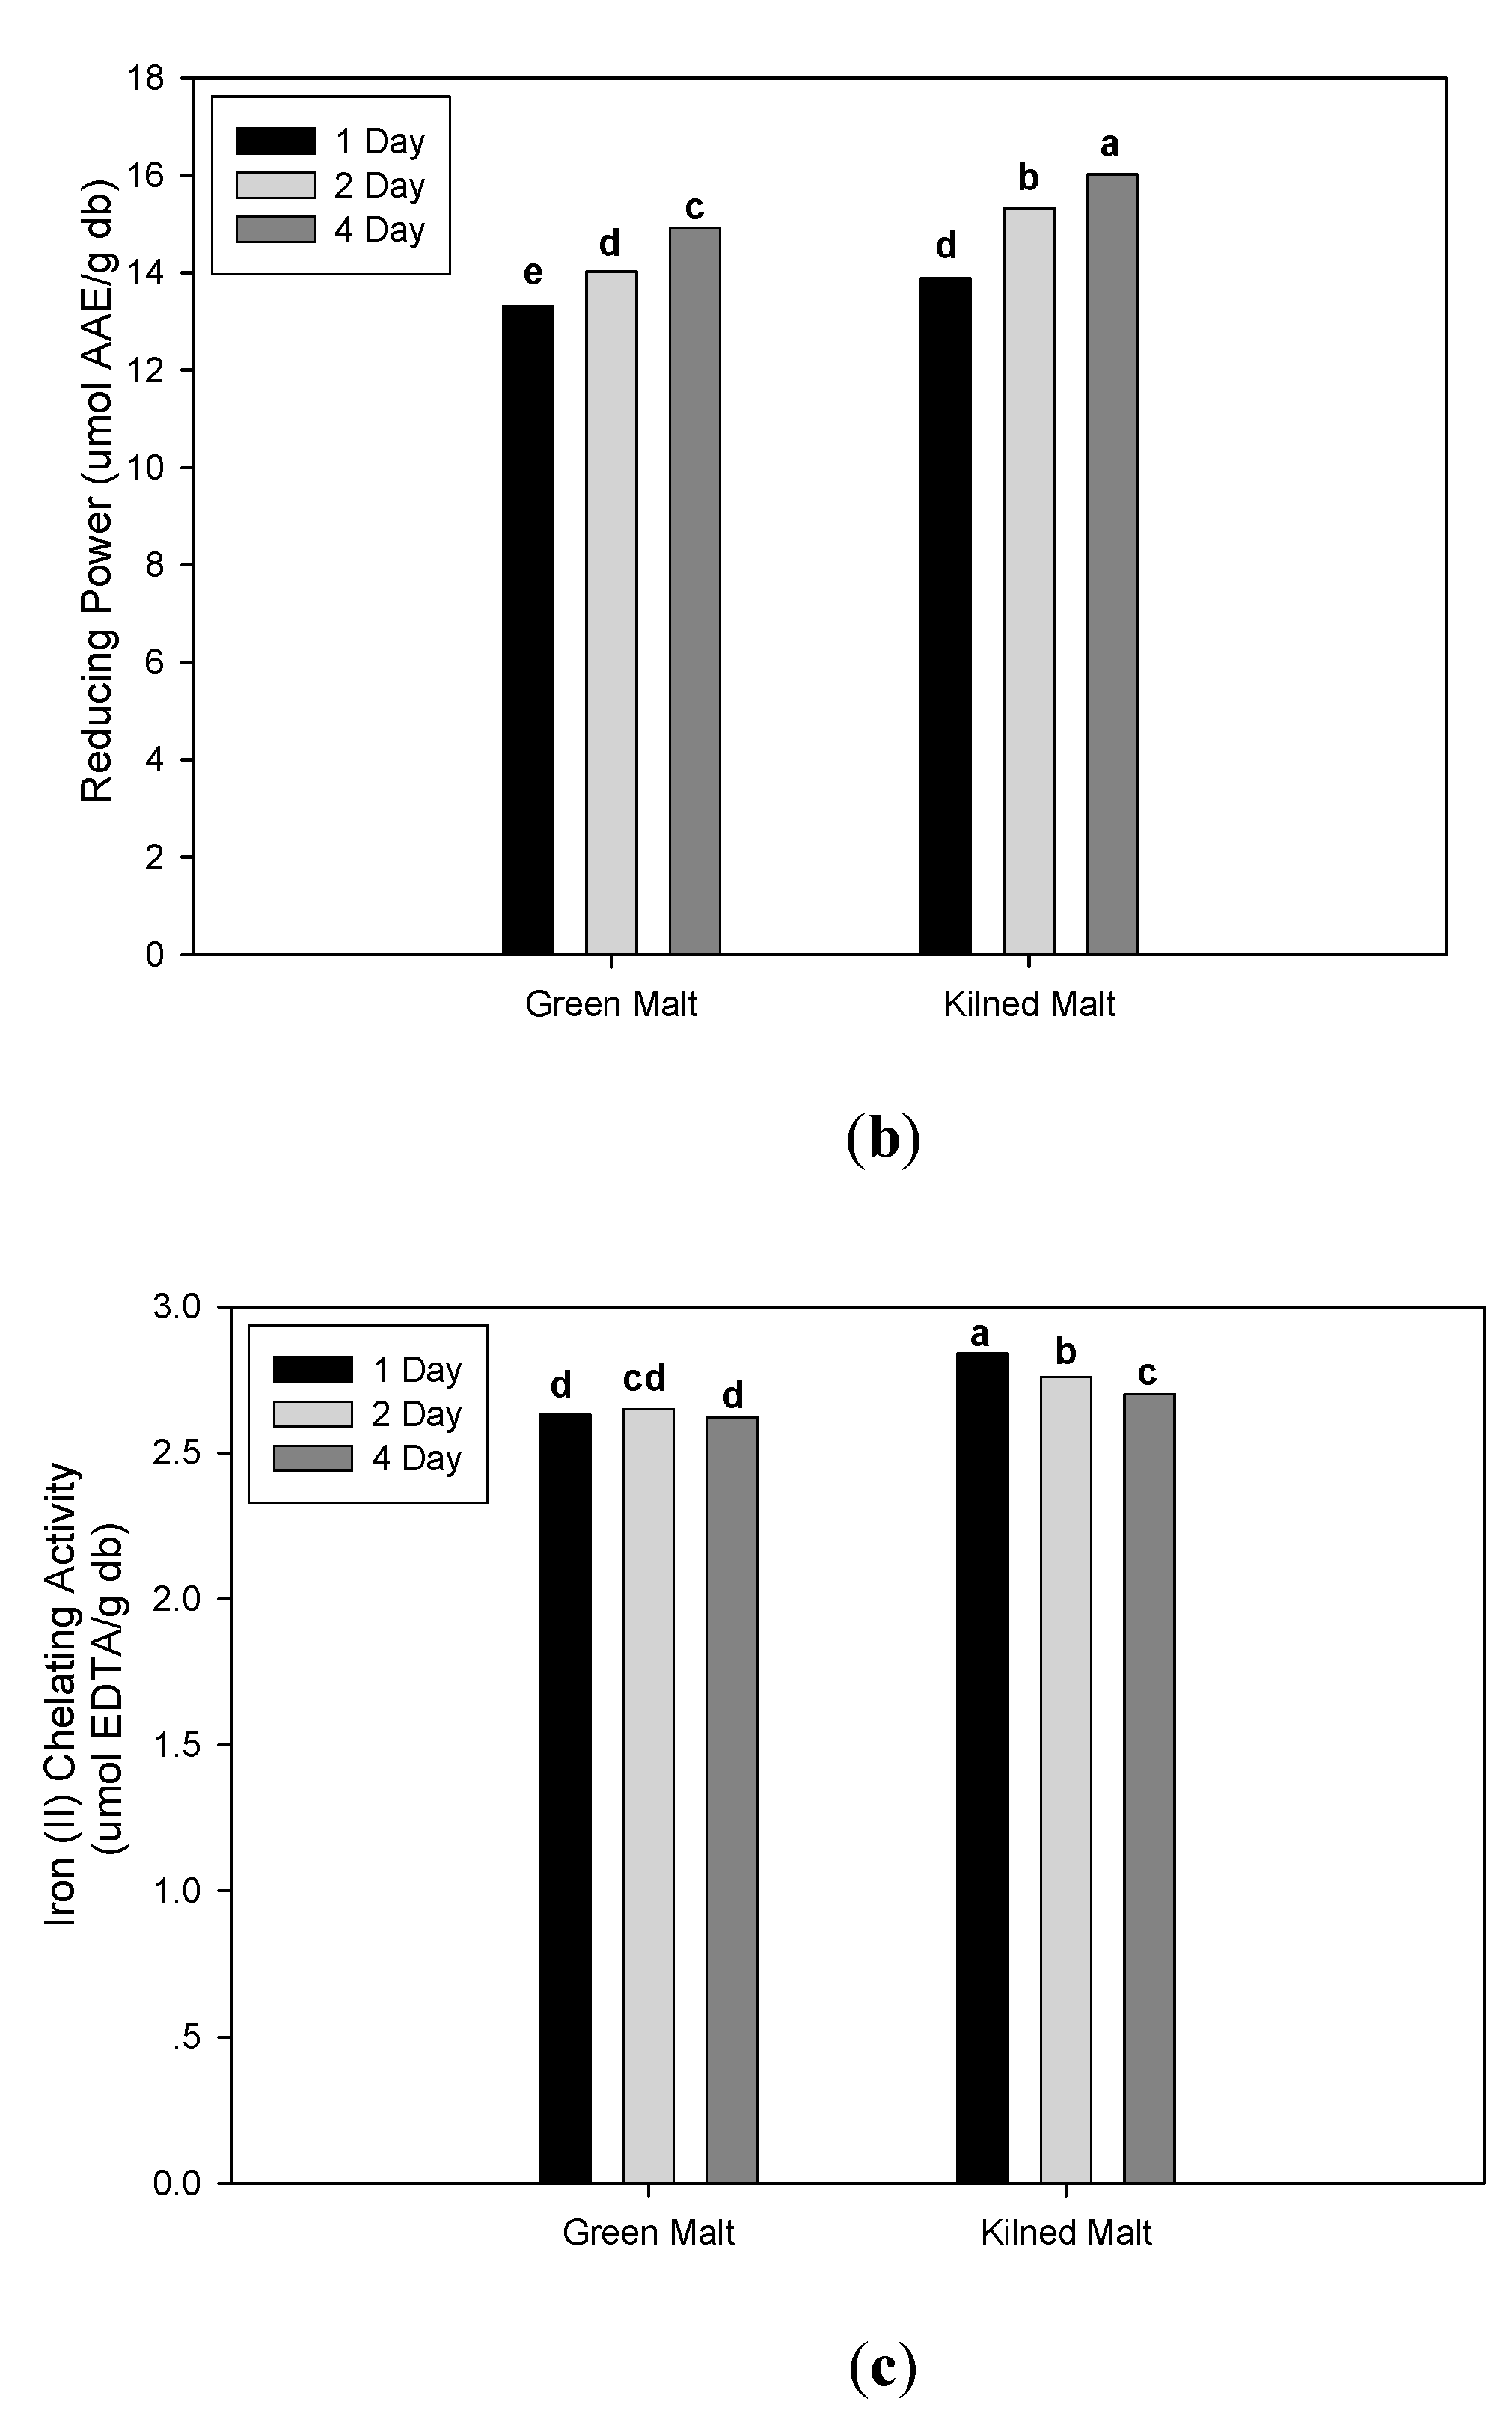
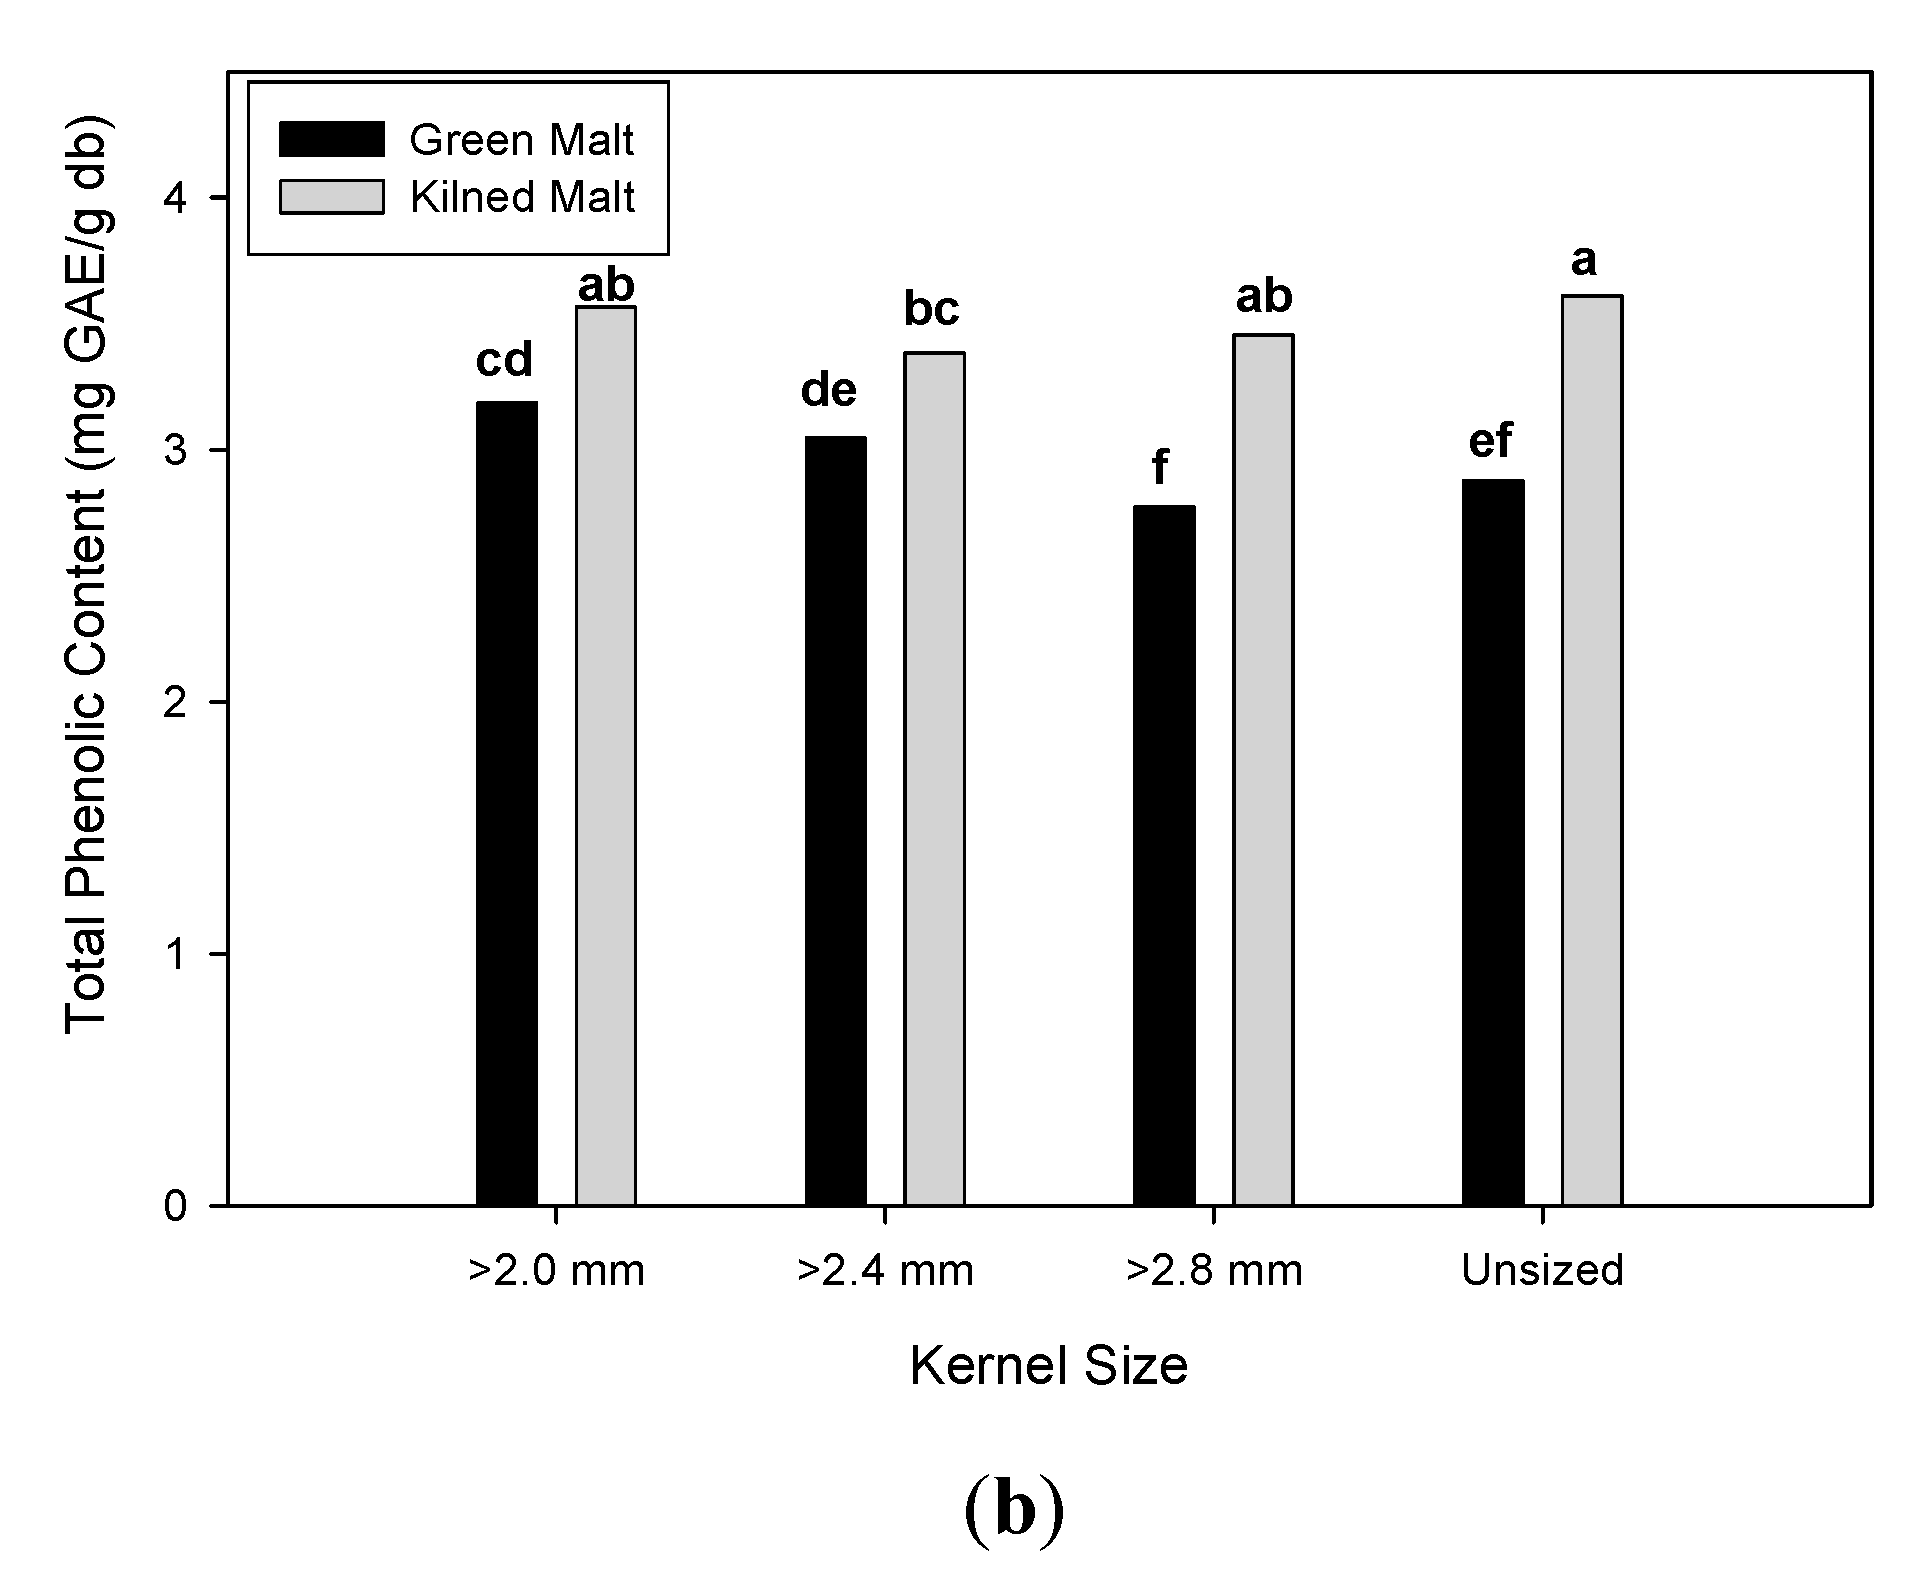
3.2. Effect of Malting Conditions on the Total Phenolic Content and Antioxidant Activities

In this portion of the study, a single genotype (E6R) was divided into several kernel size fractions, germinated for three different time periods, and then processed by conventional kilning or freeze-drying. Malting drying type was included in this study, basically because the freeze-dried green malt will omit the antioxidant activities from the Maillard reaction products that are formed during the kilning process.
The TPC and antioxidant activities are shown in Table 3. When averaged across germination time and malt drying type, the thinnest kernel size fraction (2.0 mm) showed slightly higher TPC than the plumper (2.4 or 2.8) or unsized fractions. With the exception of O2 scavenging activity and reducing power, all antioxidant activities were also highest in the thin kernel fraction. When averaged over kernel size fractions and malt drying types, the TPC increased from 2.85 mg GAE/g db at one day of germination to 3.69 mg GAE/g db at four days. The same was true for all antioxidant activities, with the exception of iron (II) chelating activity, which actually decreased slightly with germination time.
Kilned malts had a higher TPC (0.53 mg GAE/g difference) than the freeze-dried green malt when data was averaged over the other parameters. With one exception, all antioxidant activities were slightly higher in the kilned malts as well. The exception was superoxide anion radical scavenging activity, which was considerably higher in the green malt. In short, all parameters evaluated (time, drying and kernel size) had a statistically significant impact upon TPC and most antioxidant activities. However, in most cases, the differences were realtively small.
Stepwise regression was used to assess the relative importance of each parameter and data are presented in Table 4. Partial and cummulative R2 values are shown for each test. The number in parenthesis under cummulative R2 indicates the order in which parameters were added to the model. Over 75% of the observed variation for TPC, DPPH scavenging activity, and reducing power could be accounted for by the inclusion of the three parameters. For TPC and reducing power, germination time alone was able to explain over 50% of the observed variation, with malt drying type being the second most important factor. For DPPH, scavenging activity, kernel size, germination time, and drying type all appeared to equally contribute to the observed variability. Malt drying type was most important for ABTS+ scavenging activity, O2 scavenging activity, and iron (II) chelating activity, but alone could only explain about one fourth to one third of the observed variation.
Finally, it should be mentioned that in some cases, significant interactions were observed for antioxidant activities (Figure 1) and TPC (Figure 2) when considered across multiple parameters. Figure 1a shows the interaction of the malt drying type and kernel size fraction on the superoxide anion scavenging activity. While freeze-dried malts always had higher activity than kilned malts, the figure clearly shows that the response for malt types was not uniform across kernel size fractions. The interaction of germination time and malt drying type on reducing power was due to differences in magnitude of response of the malt types across germination time, with differences becoming more pronounced as modification progressed (Figure 1b). Examination of the interaction between germination time and malt drying type clearly shows that the iron (II) chelating activity in green malt and kilned malt did not respond uniformly across germination times, albeit with very small differences (Figure 1c). The interaction of kernel size fraction and germination time for TPC was due to a change in rank between different kernel size fractions over germination times (Figure 2a). While freeze-dried malts always had lower TPC content than kilned malts, Figure 2b clearly shows that the magnitude of TPC response of the green and kilned malts was not the same across kernel size fractions.

4. Discussion

In terms of brewing, the presence of antioxidants plays a significant role because they protect against the oxidation of wort and yeast, extend the beer shelf life, and potentially benefit the drinkers’ health. Malting barley-derived substances, including polyphenols, phenolic acids, Maillard reaction products, and redox enzymes, contribute considerably to the endogenous antioxidants in brewing [10]. The measurement of antioxidant activities are available by a group of assays generally related to their scavenging capacities against specific types of radical species, and some of them might be irrelevant or paralleled [38]. For example, the assay of oxygen radical absorbance capacity, such as the O2 scavenging activity, is based on the hydrogen atom transfer (HAT) reaction, while the mechanisms of DPPH and ABTS+ scavenging activity assays associate with the principle of electron transfer (ET) reaction. The TPC assayed by the Folin–Ciocalteu reagent is also based on ET, but it has been widely used to evaluate the antioxidant capacity of phenolic extracts. The iron (II) chelation capacity is determined by measuring the chelating effect of antioxidants for ferrous ion. This explained the order in which each parameter added to the stepwise regression model was not uniform between the TPC and every antioxidant activity (Table 4). However, the combination of these assays provides a general evaluation of the antioxidant activities intrinsic in biological samples, with limited environmental interferences.
Recent research showed that barley genotype, growth environment, processing, and their interactions significantly impact the phenolic content and antioxidant activities [10,25]. This was confirmed by results in the current study on the North American types of malting barley. While there was no previous report comparing six-row (6R) and two-row (2R) barleys, this study found that the TPC and some antioxidant activities of 6R barley samples were generally higher than those in two-row barley across the different grown locations and years (Table 1). For the two-row barley sample, H (2R) had higher iron (II) chelating activity, whereas the 6R barley sample (D(6R)) was observed to have the highest TPC, DPPH, and ABTS+ scavenging activities, and reducing power, followed by (C(6R)). The higher ET-related antioxidant activities in some 6R barley samples might be caused by a relatively lower plump when compared with 2R barley, as phenolics exist in higher concentration in the husk, pericarp, and aleurone layer tissues. When growth locations were compared (Table 2), the changes in rank of several genotypes across locations strongly suggested genotype by environmental interactions for these factors. However, the influence of the environment in the current study was considered minor, as only limited variation was observed between a barley sample grown at the different locations. This was not completely surprising, as while the three locations display some variation in soil type and annual rainfall, they were from a small geographic region. In addition, any large environmental variations that might have been seen in kernel plumness were partially reduced by the removal of thin kernels (< 2.0 mm) prior to analyses. Similarly, Narwal et al. [25] reported that the antioxidant activity and the content of free phenolics were more influenced by the genotype, whereas the bound and the total phenolics were most influenced by the environment.
Previous research found that the phenolic content and antioxidant capacity of malt extracts were generally higher than that of the corresponding barley, and the germinated cereal grains have been investigated as a source of antioxidant compounds [10,39]. Therefore, the current study mainly focused on the effect of malting parameters, including kernel size, germination time, and kilning on the total content of extractable phenols and antioxidant activities. Except for the HAT-based O2 scavenging activity, other antioxidant activities and TPC were significantly higher in the thinner kernel size fractions (Table 3), which might be caused by their relatively larger proportion of husk, as the prescence of phenols is in the outer tissues [10]. With the extension of germination time, the DPPH, ABTS+, and O2 scavenging activities, reducing power, and TPC increased probably due to the secretion of esterases and release of phenolics from polysaccharides [40]. TPC and antioxidant activities, with the exception of O2 scavenging activity, were enhanced by the kilning process, which could be attributed to the Maillard reaction products and possibily better extraction of phenolic compounds [10,41]. However, the impacts of each malting parameter on the TPC and antioxidant activities of malted barley were different from variety to variety (Table 3). Koren et al. [24] also found that the impact of kilning on antioxidant activities varied between different barley varieties, even though the changes of the antioxidant potential had similar trends during the steeping and germination process of spring and winter barley cultivars.

5. Conclusions

In this study, the genotype of malting barley was found to have significant, albeit small, impacts on the TPC and antioxidant activities, including DPPH, ABTS+, and O2 scavenging activities, reducing power, and iron (II) chelating activity, but not on O2 scavenging activity. However, growth environment had a minor influence, as differences in the DPPH, ABTS+, and O2 scavenging activities and reducing power between environments were not significant. Small differences were observed between the locations for the iron (II) chelating activity. The TPC and most antioxidant activities tended to be higher in some six-row barleys, than two-row barleys when grown at the same locations. Nevertheless, the observed difference was generally not large. This result was not unexpected, as North American six-row barley represents a narrow germplasm base [42]. Malting parameters, including kernel size, germination time, and drying type, had significant impacts on the TPC and most antioxidant activities. With the exception of O2 scavenging activity, TPC and the other antioxidant activities, including DPPH, and ABTS+ scavenging activities, reducing power, and iron (II) chelating activity, increased significantly with germination time extension and kilning. Smaller kernels generally had higher antioxidant activity and TPC, but in practical terms, maltsters and brewers want plumper kernels because of the increased malt extract. As such, malting represents the most practical means of increasing TPC and antioxidant activity of the malt. Variety selection might be a factor; however, this limited study of North American genotypes suggests the variation is small.

Author Contributions

Investigation and statistical analysis, Y.L.; writing—review and editing, B.Z.; writing—review and formating, Z.J.; supervision and editing, P.S. All authors have read and agreed to the published version of the manuscript.

Funding

This research was partially funded by North Dakota Barley Council and American Malting Barley Association.

Conflicts of Interest

The authors declare no conflict of interest. The funders had no role in the design of the study; in the collection, analyses, or interpretation of data; in the writing of the manuscript, or in the decision to publish the results.

References

  1. Crozier, A.; Jaganath, I.B.; Clifford, M.N. Dietary phenolics: Chemistry, bioavailability and effects on health. Nat. Prod. Rep. 2009, 26, 1001–1043. [Google Scholar] [CrossRef] [PubMed]
  2. Liu, S.; Stampfer, M.J.; Hu, F.B.; Giovannucci, E.; Rimm, E.; Manson, J.E.; Hennekens, C.H.; Willett, W.C. Whole-grain consumption and risk of coronary heart disease: Results from the Nurses’ Health Study. Am. J. Clin. Nutr. 1999, 70, 412–419. [Google Scholar] [CrossRef] [PubMed] [Green Version]
  3. Liu, S.; Manson, J.E.; Stampfer, M.J.; Rexrode, K.M.; Hu, F.B.; Rimm, E.B.; Willett, W.C. Whole grain consumption and risk of ischemic stroke in women: A prospective study. JAMA 2000, 284, 1534–1540. [Google Scholar] [CrossRef] [PubMed] [Green Version]
  4. De Munter, J.S.L.; Hu, F.B.; Spiegelman, D.; Franz, M.; van Dam, R.M. Whole grain, bran, and germ intake and risk of type 2 diabetes: A prospective cohort study and systematic review. PLoS Med. 2007, 4, e40261. [Google Scholar] [CrossRef] [PubMed]
  5. Priebe, M.; van Binsbergen, J.; de Vos, R.; Vonk, R.J. Whole grain foods for the prevention of type 2 diabetes mellitus. Cochrane Database Syst. Rev. 2008. [Google Scholar] [CrossRef] [PubMed] [Green Version]
  6. Liu, R.H. Whole grain phytochemicals and health. J. Cereal Sci. 2007, 46, 207–219. [Google Scholar] [CrossRef]
  7. Jacobs, D.R., Jr.; Marquart, L.; Slavin, J.; Kushi, L.H. Whole-grain intake and cancer: An expanded review and meta-analysis. Nutr. Cancer 1998, 30, 85–96. [Google Scholar] [CrossRef]
  8. Egeberg, R.; Olsen, A.; Loft, S.; Christensen, J.; Johnsen, N.F.; Overvad, K.; Tjønneland, A. Intake of whole grain products and risk of breast cancer by hormone receptor status and histology among postmenopausal women. Int. J. Cancer 2009, 124, 745–750. [Google Scholar] [CrossRef]
  9. Tricase, C.; Amicarelli, V.; Lamonaca, E.; Rana, R.L. Economic analysis of the barley market and related uses. In Grasses as Food and Feed; IntechOpen: London, UK, 2018. [Google Scholar]
  10. Wannenmacher, J.; Gastl, M.; Becker, T. Phenolic substances in beer: Structural diversity, reactive potential and relevance for brewing process and beer quality. Compr. Rev. Food Sci. Food Saf. 2018, 17, 953–988. [Google Scholar] [CrossRef] [Green Version]
  11. Lentz, M. The impact of simple phenolic compounds on beer aroma and flavor. Fermentation 2018, 4, 20. [Google Scholar] [CrossRef] [Green Version]
  12. Hernanz, D.; Nuñez, V.; Sancho, A.I.; Faulds, C.B.; Williamson, G.; Bartolomé, B.; Gómez-Cordovés, C. Hydroxycinnamic acids and ferulic acid dehydrodimers in barley and processed barley. J. Agric. Food Chem. 2001, 49, 4884–4888. [Google Scholar] [CrossRef] [PubMed]
  13. Holtekjølen, A.K.; Kinitz, C.; Knutsen, S.H. Flavanol and bound phenolic acid contents in different barley varieties. J. Agric. Food Chem. 2006, 54, 2253–2260. [Google Scholar] [CrossRef] [PubMed]
  14. Cai, S.; Han, Z.; Huang, Y.; Chen, Z.-H.; Zhang, G.; Dai, F. Genetic diversity of individual phenolic acids in barley and their correlation with barley malt quality. J. Agric. Food Chem. 2015, 63, 7051–7057. [Google Scholar] [CrossRef]
  15. Zhao, H.; Fan, W.; Dong, J.; Lu, J.; Chen, J.; Shan, L.; Lin, Y.; Kong, W. Evaluation of antioxidant activities and total phenolic contents of typical malting barley varieties. Food Chem. 2008, 107, 296–304. [Google Scholar] [CrossRef]
  16. Li, Q.; Yang, S.; Li, Y.; Huang, Y.; Zhang, J. Antioxidant activity of free and hydrolyzed phenolic compounds in soluble and insoluble dietary fibres derived from hulless barley. LWT 2019, 111, 534–540. [Google Scholar] [CrossRef]
  17. Šimić, G.; Horvat, D.; Dvojković, K.; Abičić, I.; Vuletić, M.V.; Tucak, M.; Lalić, A. Evaluation of total phenolic content and antioxidant activity of malting and hulless barley grain and malt extracts. Czech J. Food Sci. 2017, 35, 73–78. [Google Scholar]
  18. Yang, X.-J.; Dang, B.; Fan, M.-T. Free and bound phenolic compound content and antioxidant activity of different cultivated blue highland barley varieties from the Qinghai-Tibet plateau. Molecules 2018, 23, 879. [Google Scholar] [CrossRef] [Green Version]
  19. Suriano, S.; Iannucci, A.; Codianni, P.; Fares, C.; Russo, M.; Pecchioni, N.; Marciello, U.; Savino, M. Phenolic acids profile, nutritional and phytochemical compounds, antioxidant properties in colored barley grown in southern Italy. Food Res. Int. 2018, 113, 221–233. [Google Scholar] [CrossRef]
  20. Madhujith, T.; Shahidi, F. Antioxidative and antiproliferative properties of selected barley (Hordeum vulgarae L.) cultivars and their potential for inhibition of low-density lipoprotein (LDL) cholesterol oxidation. J. Agric. Food Chem. 2007, 55, 5018–5024. [Google Scholar] [CrossRef]
  21. Lugasi, A. Polyphenol content and antioxidant properties of beer. Acta Aliment. 2003, 32, 181–192. [Google Scholar] [CrossRef]
  22. Fogarasi, A.-L.; Kun, S.; Tankó, G.; Stefanovits-Bányai, É.; Hegyesné-Vecseri, B. A comparative assessment of antioxidant properties, total phenolic content of einkorn, wheat, barley and their malts. Food Chem. 2015, 167, 1–6. [Google Scholar] [CrossRef] [PubMed]
  23. Pejin, J.; Grujić, O.; Čanadanović-Brunet, J.; Vujić, Đ.; Tumbas, V. Investigation of phenolic acids content and antioxidant activity in malt production. J. Am. Soc. Brew. Chem. 2009, 67, 81–88. [Google Scholar] [CrossRef]
  24. Koren, D.; Kun, S.; Vecseri, B.H.; Kun-Farkas, G. Study of antioxidant activity during the malting and brewing process. J. Food Sci. Technol. 2019, 56, 3801–3809. [Google Scholar] [CrossRef] [PubMed] [Green Version]
  25. Narwal, S.; Kumar, D.; Verma, R.P.S. Effect of Genotype, Environment and Malting on the Antioxidant Activity and Phenolic Content of Indian Barley. J. Food Biochem. 2016, 40, 91–99. [Google Scholar] [CrossRef]
  26. O’Brien, L. Genotype and environment effects on feed grain quality. Aust. J. Agric. Res. 1999, 50, 703–720. [Google Scholar] [CrossRef] [Green Version]
  27. Zhou, K.; Yu, L. Antioxidant properties of bran extracts from Trego wheat grown at different locations. J. Agric. Food Chem. 2004, 52, 1112–1117. [Google Scholar] [CrossRef]
  28. Yu, L.; Perret, J.; Harris, M.; Wilson, J.; Haley, S. Antioxidant properties of bran extracts from “Akron” wheat grown at different locations. J. Agric. Food Chem. 2003, 51, 1566–1570. [Google Scholar] [CrossRef]
  29. Yu, L.; Zhou, K. Antioxidant properties of bran extracts from “Platte” wheat grown at different locations. Food Chem. 2005, 90, 311–316. [Google Scholar] [CrossRef]
  30. Mpofu, A.; Sapirstein, H.D.; Beta, T. Genotype and environmental variation in phenolic content, phenolic acid composition, and antioxidant activity of hard spring wheat. J. Agric. Food Chem. 2006, 54, 1265–1270. [Google Scholar] [CrossRef]
  31. Yearly Weather Data. Available online: https://ndawn.ndsu.nodak.edu/weather-data-yearly.html (accessed on 14 April 2020).
  32. Horsley, R.D.; Schwarz, P.B.; Foster, A.E. Effects of gene ant13 on agronomic and malt quality traits of barley. Crop Sci. 1991, 31, 593–598. [Google Scholar] [CrossRef]
  33. Karababa, E.; Schwarz, P.B.; Horsley, R.D. Effect of kiln schedule on micromalt quality parameters. J. Am. Soc. Brew. Chem. 1993, 51, 163–167. [Google Scholar] [CrossRef]
  34. Jin, Z.; Zhou, B.; Gillespie, J.; Gross, T.; Barr, J.; Simsek, S.; Brueggeman, R.; Schwarz, P.B. Production of deoxynivalenol (DON) and DON-3-glucoside during the malting of Fusarium infected hard red spring wheat. Food Control 2018, 85, 6–10. [Google Scholar] [CrossRef]
  35. Yu, L. Wheat Antioxidants; John Wiley & Sons Inc: Hoboken, NJ, USA, 2008. [Google Scholar]
  36. Xu, M.; Jin, Z.; Peckrul, A.; Chen, B. Pulse seed germination improves antioxidative activity of phenolic compounds in stripped soybean oil-in-water emulsions. Food Chem. 2018, 250, 140–147. [Google Scholar] [CrossRef] [PubMed]
  37. Granato, D.; Shahidi, F.; Wrolstad, R.; Kilmartin, P.; Melton, L.D.; Hidalgo, F.J.; Miyashita, K.; van Camp, J.; Alasalvar, C.; Ismail, A.B.; et al. Antioxidant activity, total phenolics and flavonoids contents: Should we ban in vitro screening methods? Food Chem. 2018, 264, 471–475. [Google Scholar] [CrossRef]
  38. Shahidi, F.; Zhong, Y. Measurement of antioxidant activity. J. Funct. Foods 2015, 18, 757–781. [Google Scholar] [CrossRef]
  39. Donkor, O.N.; Stojanovska, L.; Ginn, P.; Ashton, J.; Vasiljevic, T. Germinated grains--Sources of bioactive compounds. Food Chem. 2012, 135, 950–959. [Google Scholar] [CrossRef]
  40. Vanbeneden, N.; Gils, F.; Delvaux, F.; Delvaux, F. Variability in the Release of Free and Bound Hydroxycinnamic Acids from Diverse Malted Barley (Hordeum vulgare L.) Cultivars during Wort Production. J. Agric. Food Chem. 2007, 55, 11002–11010. [Google Scholar] [CrossRef]
  41. Maillard, M.-N.; Berset, C. Evolution of antioxidant activity during kilning: Role of insoluble bound phenolic acids of barley and malt. J. Agric. Food Chem. 1995, 43, 1789–1793. [Google Scholar] [CrossRef]
  42. Schwarz, P.B.; Horsley, R.D. Malt quality improvement in North American six-rowed barley cultivars since 1910. J. Am. Soc. Brew. Chem. 1995, 53, 14–18. [Google Scholar] [CrossRef]
Figure 1. Interaction of malting parameters on antioxidant activities. (a) Interaction of malt drying type and kernel size fraction on the superoxide anion radical scavenging activity; (b) interaction of germination time and malt drying type on the reducing power; (c) interaction of germination time and malt drying type on the iron (II) chelating activity. Note: bars with the same letter are not significantly different at p ≤ 0.05.
Fermentation 06 00048 g001aFermentation 06 00048 g001b
Figure 2. Interaction of malting parameters on the total phenolic content. (a) Interaction of germination time and kernel size on the total phenolic content; (b) interaction of drying type and kernel size on the total phenolic content. Note: bars with the same letter are not significantly different at p ≤ 0.05.
Fermentation 06 00048 g002aFermentation 06 00048 g002b
Table 1. Mean and Range of Antioxidant Activities and Total Phenolic Content as Affected by Barley Cultivar and Location.
DPPH a
(µmol TE/g, db)
ABTS
(µmol TE/g, db)
SARSA (%)RP
(µmol AAE/g, db)
ICA
(µmol EDTAE/g, db)
TPC
(mg GAE/g, db)
ParameterMean bSTD cMean STDMean STDMean STDMean STDMean STD
Genotype (row- type)
A(6R)12.19 c± 0.4021.63 ab± 2.8313.51 a± 4.8514.84 bc± 0.791.90 ab± 0.682.52 ab±0.21
B(6R)12.43 bc± 0.5721.66 ab± 2.0915.31 a± 4.1715.29 ab± 0.521.65 b± 0.542.61 ab±0.21
C(6R)12.76 ab± 0.3621.75 a± 2.3016.72 a± 8.1915.22 ab± 0.861.71 ab± 0.582.58 ab±0.19
D(6R)13.02 a± 0.4122.01 a± 1.8818.20 a± 8.7615.64 a± 0.741.70 ab± 0.502.66 a±0.19
E(6R)11.29 d± 0.3819.75 bc± 1.6015.08 a± 9.4414.33 c± 0.581.58 b± 0.642.31 dc±0.10
F(2R)10.27 e± 0.5118.09 c± 1.2816.81 a± 10.3813.31 d± 0.841.72 ab± 0.772.20 d±0.19
G(2R)12.01 c± 0.5221.01 ab± 1.8612.56 a± 11.1014.73 bc± 0.381.96 ab± 0.532.43 bc±0.17
H(2R)12.11 c± 0.4921.08 ab± 2.3013.42 a± 8.8114.82 bc± 0.722.18 a± 0.452.43 bc±0.19
Location
EI11.99 a± 1.0020.87 a± 2.5816.82 a± 8.5414.79 a± 0.891.31 b± 0.502.46 ab±0.22
EII12.09 a± 0.9720.69 a± 2.1515.72 a± 7.8314.63 a± 0.991.56 b± 0.642.38 b±0.23
EIII11.95 a± 0.9921.06 a± 1.8313.06 a± 8.2614.91 a± 0.892.54 a± 0.342.56 a±0.27
a DPPH: DPPH radical scavenging activity; ABTS: ABTS radical cation scavenging activity; SARSA: superoxide anion radical scavenging activity; RP: reducing power; ICA: iron (II) chelating activity; TPC: total phenolic content. b Means with a column for a parameter followed by the same letter are not significantly different (p ≤ 0.05). c STD: standard deviation.
Table 2. Ranking of Genotype in Different Locations for DPPH Radical Scavenging Activity and Total Phenolic Content Significantly influenced by G × E interaction.
GenotypeLocation (E)
EIEIIEIII
DPPH radical scavenging activity (µmol TE/g, db)
A(6R)11.74 cd11.81 d13.05 a
B(6R)11.99 bcd12.76abc12.55 a
C(6R)12.99 a12.89 ab12.40 a
D(6R)12.92 a13.08 a13.05 a
E(6R)11.22 d11.66 d10.97 bc
F(2R)10.18 e10.12 e10.51 c
G(2R)12.20 abc12.34 bcd11.48 b
H(2R)12.70 ab12.09 cd11.55 b
Total phenolic content (mg GAE/g, db)
A(6R)2.39 ab2.37 ab2.79 ab
B(6R)2.59 a2.54 a2.69 abc
C(6R)2.58 a2.49 a2.81 a
D(6R)2.61 a2.56 a2.67 abc
E(6R)2.30 ab2.29 ab2.35 c
F(2R)2.15 b2.11 b2.35 c
G(2R)2.50 a2.38 ab2.39 bc
H(2R)2.53 a2.34 ab2.43 abc
Means with a column for a parameter followed by the same letter are not significantly different (p ≤ 0.05).
Table 3. Mean and Range of Antioxidant Activities and Total Phenolic Content in Malt as Affected by Kernel Size Fractions, Germination Time, and Malt Drying a.
DPPH
(µmol TE/g, db)
ABTS
(µmol TE/g, db)
SARSA (%)RP
(µmol AAE/g, db)
ICA
(µmol EDTAE/g, db)
TPC
(mg GAE/g, db)
ParameterMean bSTD cMeanSTDMeanSTDMeanSTDMeanSTDMeanSTD
Kernel size fraction
Unsized12.81 b± 0.8618.78 b± 2.2826.51 a± 18.5114.43 b± 0.902.69 c± 0.113.25 b± 0.56
≥ 2.8 mm12.39 c± 0.9017.09 c± 1.6717.37 b± 15.5614.19 b± 1.132.61 d± 0.183.11 c± 0.55
≥ 2.4 mm13.05 b± 0.7418.62 b± 1.3917.63 b± 16.0314.76 a± 1.242.73 b± 0.083.22 b± 0.40
≥ 2.0 mm14.07 a± 0.6919.90 a± 1.3712.55 b± 8.7314.94 a± 0.912.79 a± 0.073.37 a± 0.39
Germination time
1 day12.51 c± 0.9417.84 b± 1.5412.18 b± 11.3413.60 c± 0.512.74 a± 0.122.85 c± 0.31
2 day13.04 b± 0.9818.42 b± 1.6220.62 a± 17.2814.67 b± 0.962.70 b± 0.173.18 b± 0.34
4 day13.71 a± 0.7119.54 a± 2.2922.75 a± 16.1415.47 a± 0.692.66 c± 0.093.69 a± 0.32
Malt drying type
Green12.59 b± 0.9817.57 b± 1.3025.70 a± 12.4714.09 b± 0.792.64 b± 0.142.97 b± 0.40
Kilned13.57 a± 0.7519.63 a± 1.9611.32 b± 15.1215.08 a± 1.082.77 a± 0.083.50 a± 0.39
a DPPH: DPPH radical scavenging activity; ABTS: ABTS radical cation scavenging activity; SARSA: superoxide anion radical scavenging activity; RP: reducing power; ICA: iron (II) chelating activity; TPC: total phenolic content. b Means with a column for a parameter followed by the same letter are not significantly different (p ≤ 0.05). c STD: standard deviation.
Table 4. Partial and Cumulative R2 values from the Stepwise Regression Analysis across Experimental Parameters on Antioxidant Activities and Total Phenolic Content a.
ParameterDPPHABTSSARSARPICATPC
Partial R2Cumulative R2Partial R2Cumulative R2Partial R2Cumulative R2Partial R2Cumulative R2Partial R2Cumulative R2Partial R2Cumulative R2
Kernel size fraction27%27% (1)b10%60% (3)11%37% (2)5%81% (3)14%41% (2)1%89% (3)
Germination time26%80% (3)16%50% (2)8%45% (3)52%52% (1)6%47% (3)55%55% (1)
Malt drying type27%54% (2)34%34% (1)26%26% (1)24%76% (2)27%27% (1)33%88% (2)
a DPPH: DPPH radical scavenging activity; ABTS: ABTS radical cation scavenging activity; SARSA: superoxide anion radical scavenging activity; RP: reducing power; ICA: iron (II) chelating activity; TPC: total phenolic content. b Means with a column for a parameter followed by the same letter are not significantly different (p ≤ 0.05). Number in parenthesis (1) indicates the order in which a parameter was added to the model.

