Abstract
A few yeast species have been tested frequently to improve the tastes, flavors, and other important quality parameters of coffee. However, continuing evaluations of different yeast species for fermenting green coffee beans will have a significant positive contribution to the coffee industry. This experiment was conducted to evaluate the antioxidant properties, total phenol content (TPC), total flavonoid content (TFC), total tannin content (TTC), and the consumer acceptability of fermented green coffee beans with Wickerhamomyces anomalu. The coffee beans were roasted at different roasting conditions (light, medium, and dark). There was no significant (p > 0.05) difference between the yeast-fermented and non-fermented coffee with regard to the oxygen radical absorbance capacity (ORAC) values in medium and dark roasted coffee. Similarly, the superoxide dismutase-like (SOD)-like activity did not significantly differ in all roasting conditions. However, the SOD-like activity was significantly different (p < 0.05), particularly within light roasted and medium roasted, and between light roasted and dark roasted in both the control and fermented coffee extracts. The 2, 2-diphenyl-1-picrylhydrazyl (DPPH) radical scavenging assay and ferric reducing antioxidant power (FRAP) were improved in fermented coffee beans. There was a significant (p ≤ 0.05) difference between the yeast-fermented and non-fermented coffee with respect to the TPC and TFC in all roasting types and the TTC in the light and dark roasting conditions. The fermentation of green coffee beans with W. anomalus increased the TPC and TFC. However, the TTC was lower in the fermented coffee beans compared to the non-fermented coffee beans in medium and dark roasted coffee. In general, fermentation of green coffee beans with W. anomalus has the potential to improve the functionality of coffee beans.
1. Introduction
Fermentation has the potential to improve the functionality of foods. Fermentation is primarily relied upon during the wet processing of coffee to remove mucilage. However, it is also improves coffee’s sensory quality attributes [1]. Fermentation has been extensively applied in the food, chemical, and pharmaceutical industries to aid in the manufacturing, extraction, and modification of bioactive compounds [2,3]. Microbial fermentation is an interesting biotechnological processing system that can improve the total phenolic content of foods and herbs by liberating their insolubly bound phenolics and hence boost their nutritional value [4,5]. Numerous research papers provide a comparison of the antioxidant properties of popular drinks such as coffee, tea, and cocoa [6,7,8]. Phenolic compounds are found in a broad range of regularly consumed plant foods, such as vegetables, fruits, legumes, and cereals, and in beverages of plant origin, such as coffee, tea, and wine [9,10]. Flavonoids naturally exist in plants with a variable phenolic structure. Functional hydroxyl groups in flavonoids mediate their antioxidant effects by chelating metal ions and scavenging free radicals [11,12]. Flavonoids in food are commonly responsible for the color, the taste, the prevention of fat oxidation, and the protection of enzymes and vitamins [13].
Wickerhamomyces anomalus (formerly Pichia anomala) is an ascomycetous heterothallic yeast of the family Wickerhamomycetaceae that propagates sexually through the development of hat-shaped ascospores and asexually by budding [14]. W. anomalus strains are found in several environments and have been isolated from cereal grains, fruits, maize silage, wine, and high-sugar food products [14]. W. anomalus is categorized as a biosafety level-one organism; it is deemed harmless for healthy individuals and can grow under severe environmental stress conditions, such as high and low pH, high osmotic pressure, anaerobic conditions, and low water activity [15]. As mentioned by Comitini et al. [16], W. anomalus toxins have been examined as antimicrobial agents against some spoilage yeasts such as Dekkera/Brettanomyces. Some researchers have reported that the wild species of W. anomalus strains have the potential to use maltose and grow better than other commercial brewing yeasts [17]. However, other studies have referred to its clear inability to metabolize maltose [18]. Considering these findings, W. anomalus is preferred as a good starter culture in sequence or inoculated together with other yeasts in winemaking [19]. p. anomala-mixed starters have been evaluated to improve the final quality of cider [18]. Due to its positive effect on sensory quality, a mixed starter of W. anomalus and Saccharomyces cerevisiae has been proposed for making Chinese baijiu [20].
Recently, studies have been conducted to improve the functionality of coffee through green bean fermentation with selected microorganisms. In these studies, the Saccharomyces species [21,22], Saccharomycopsis fibuligera [22], Rhizopus oligosporus [23], and Yarrowia lipolytica [24], have been used to ferment green coffee beans. The fermentation of green coffee beans with R. oligosporus significantly enhanced the compositions of aroma precursors [23]. As reported by Kwak et al. [21] and Mesfin and Kang [22], the fermentation of green coffee beans improves antioxidant activity, total phenol content (TPC), and total flavonoid content (TFC), and it reduces the total tannin content (TTC), which is mostly responsible for coffee’s astringency. W. anomalus strain KNU18Y3 has the ability to produce a pectinase enzyme, it was selected as a starter culture for coffee fermentation in the wet processing method [25]. Since this yeast has not been tested previously to ferment green coffee beans, this study was conducted to evaluate the antioxidant activities of fermented coffee beans with W. anomalus (strain KNU18Y3).
2. Materials and Methods
2.1. Chemicals
Disodium phosphate (Na2HPO4), aluminium chloride (AlCl3⋅6H2O), monosodium phosphate (NaH2PO4), sodium carbonate (Na2CO3), D-glucose, and sodium nitrite (NaNO2) were supplied by Dae-Jung Chemicals & Metals Co., Ltd., (Jeongwang-dong, Shiheung-city, Gyeonggi-do, Republic of Korea). Pyrogallol, 2,2’-azobis (2-amidinopropane) dihydrochloride (AAPH), and fluorescein sodium were purchased from Santa Cruz Biotechnology, Inc. (Dallas, Texas, USA). NaCl, ethylenediaminetetraacetic acid, yeast peptone dextrose, gallic acid, Folin-Ciocalteu’s phenol reagent, quercetin, Trolox, 2,2-diphenyl-1-picrylhydrazyl, potassium ferricyanide(C6N6FeK3), trichloroacetic acid (C2HCl3O2), and ferric chloride (FeCl3) were purchased from Sigma Aldrich LLC (St. Louis, MO, USA). Methanol was supplied by Merck KGaA (Darmstadt, Germany), and HCl was purchased from Junsei Chemical Co., Ltd. (4-4-16 Nihonbashi-honcho, Chuo-ku, Tokyo, Japan).
2.2. Fermentation of Green Coffee Beans
A freeze-dried W. anomalus (strain KNU18Y3) yeast cells were cultivated in a sterile yeast peptone dextrose broth (0.5% w/v yeast extract, 2 % w/v dextrose and 1% w/v casein peptone) for 48 h at 30 °C. The pH of the media was calibrated to 5.0 with 1 M HCl. Then, the yeast cells were collected via centrifugation at 8000× g. Finally, the collected yeast cells were washed twice using the deionized distilled water (ddH2O) and mixed in a similar volume of 100 mM phosphate-buffered saline solution.
The green coffee beans (Coffea arabica L.) that imported from Kenya were used for this study. The coffee beans (600 g) saturated in ddH2O at 4 °C for 24 h and then steamed at 80 °C for 40 min to kill native yeasts that exist on the coffee beans. Next, the steamed coffee beans then allowed to cool at 20–23 °C. The heat-treated green coffee beans were divided into two lots: fermented through inoculation (1.0 × 10⁴ colony-forming unit (CFU)/g of coffee beans) and non-inoculated (control). Then, each lot was divided into three parts and underwent a different roasting treatment. Fermentation of green coffee beans and roasting were done in three replications. The fermentation was carried out for 24 h at 30 °C. After that, the coffee beans were washed thoroughly using a ddH2O. The fermented coffee beans were dried using oven at 45 °C until the moisture content reached between 10% and 12%.
The pH of the fermented solution (the water that used to ferment the coffee beans) was recorded using a pH meter at 0 h and 24 h. A sample solution was taken after 24 h fermentation and serially diluted and plated onto yeast peptone dextrose agar (YPDA) plates. The plates were incubated for 24 h at 30 °C to estimate the growth of yeast cells. The pH measurements and microbial counts were made in five replications.
2.3. Coffee Roasting, Grinding, Extraction
The green coffee beans were roasted at 245 °C for 11.5 (light roast), 13.5 (medium roast) and 16 (dark roast) min using a coffee roaster (GeneCafe CR-100 coffee roaster, Genesis, Ansan, Korea) to ensure uniform roasting conditions. Each roasting was done in triplicate. After roasting, the beans were allowed to cool for 30 min and then ground by adjusting in a medium level on a coffee grinder (Latina 600N electric grinder). Hot brew extraction made using a coffee maker (HD7450, Philips, Nanjing, China) by mixing 36 g of coffee powder with 500 mL of water. A filter paper was used during brewing. After each brewing, the coffee machine was cleaned prior to brewing the next sample. The extraction was made in three replications. The analysis of antioxidant activities, TPC, TFC, and TTC were measured from this extract.
2.4. Color Parameters
Chroma Meter (CR-400 Chroma Meter, Tokyo, Japan) was used to estimate the color of the roasted coffee powder. A small coffee powder (5 g) was kept into a Petri dish for reading, and a* (redness), b* (yellowness) and L* (lightness) were assessed. The color reading was made in triplicate.
2.5. Antioxidant Activity
2.5.1. Oxygen Radical Absorbance Capacity
The oxygen radical absorbance capacity (ORAC) was estimated with some modifications using the protocol described by Ou et al. [26]. Fluorescein powder was dissolved using a phosphate buffer (NaH2PO4-Na2HPO4, 10 mM, pH 7.0). The coffee extract (50 µL) was mixed with 25 mM of the fluorescein solution (150 µL) and incubated in a dark environment for about 10 min. Then, 25 µL of 120 mM AAPH solution was mixed to the coffee extract and fluorescein mixture. Meanwhile, 10 mM phosphate buffer was substituted instead of coffee extract and used as a control. The absorbance was measured using a UV/visible spectrophotometer (U-2900, Hitachi High-Tech Corporation, Tokyo, Japan). The readings were recorded at one minute interval for 30 min (excitation wavelength: 485 nm; emission wavelength: 535 nm). The absorbance readings for ORAC estimation were made in triplicate and expressed as a µM Trolox equivalent/mL of coffee (µM TE/mL). The ORAC estimated using the formula stated below;
ORAC (µM TE/g) = (CTrolox × (AUCSample − AUCBlank) × k)/AUCTrolox − AUCBlank
2.5.2. Superoxide Dismutase-Like Activity
The protocol suggested by Marklund and Marklund [27] used with some modifications to estimate the SOD-like activity. Coffee extract (400 µL), Tris-HCl buffer (600 µL, 50 mM tris (hydroxymethyl) aminomethane and 10 mM ethylenediaminetetraacetic acid, pH 8.0), and 7.2 mM pyrogallol (40 µL) were mixed together and kept at 25 °C for 10 min. The reaction was terminated by mixing 0.1N HCl (20 µL). Absorbance readings were done at 420 nm using a UV/visible spectrophotometer (U-2900, Hitachi High-Tech Corporation, Tokyo, Japan). The absorbance readings for the estimation of the SOD-like activity were performed in triplicate. SOD-like activity was computed with the formula presented below:
where A indicates the sample absorbance and B indicates the absorbance of the blank (control).
SOD-like activity (%) = (1 − A/B) × 100
2.5.3. 2.,2-diphenyl-1-picrylhydrazyl (DPPH) Radical Scavenging Assay
The DPPH activity was measured using the protocol described by Pataro et al. [28], with some modifications. DPPH was dissolved in methanol (0.1 mM) and 3.9 mL of it transferred into a cuvette, then immediately the absorbance was measured at 515 nm (used as a control). The coffee extracts (800 µL) from each sample were mixed with 3.2 mL of methanol-DPPH solution and placed in a dark condition for 30 min. Then the absorbance was recorded. Methanol was used as a blank. The DPPH assay was done in three replications. The DPPH inhibition percentage was calculated using the following formula;
DPPH inhibition (%) = (Acontrol − Asample)/ Acontrol × 100
2.5.4. Ferric Reducing Antioxidant Power (FRAP)
FRAP of the coffee extract was assessed using the method described by Oyaizu [29]. A 2.5 mL of coffee extract was mixed with 2.5 mL of 200 mM sodium phosphate buffer (pH 6.6) 2.5 mL of 1% potassium ferricyanide. The mixture was incubated for 20 min at 50 °C following 2.5 mL of 10% trichloroacetic acid was added. Then, this mixture was centrifuged (2000× g for 10 min) and 5 mL of the supernatant was taken and mixed with 5 mL of water and finally added 1 mL of 0.1% ferric chloride. The absorbance was measured at 700 nm using a spectrophotometer (U-2900, Hitachi High-Tech Corporation, Tokyo, Japan) and the FRAP was subsequently determined using ascorbic acid as standard. The FRAP analysis was done in three replications.
2.6. Total Phenol Content, Flavonoid Content, and Tannin Content
The total phenol content of the coffee extract was measured using a protocol described by Singleton’s method [30], with some adjustments. The coffee extract (20 µL) was diluted with 1580 µL ddH2O. Diluted coffee extract (160 µL) and Ciocalteu’s phenol reagent (10 µL) were mixed and kept for 8 min. Then, 30 µL of 20% Na2CO3 solution was mixed and incubated in a dark environment for 2 h. The coffee extract was substituted with distilled water and used as a blank. The absorbance readings were determined at 765 nm using a UV/visible spectrophotometer (U-2900, Hitachi High-Tech Corporation, Tokyo, Japan). Gallic acid solutions (0–1 mg/mL) were used to generate a standard curve (r2 = 0.997). The estimation of the TPC was done in triplicate. Results were expressed as mg gallic acid equivalent/mL (mg GAE/mL) of coffee extract.
A protocol stated by Dewanto [31], applied with some modification to estimate the total flavonoid content of the coffee extract. The mixture was prepared using 250 µL coffee extract, 1 mL of distilled water and 75 µL of 5% NaNO2. The 5 min later, 10% AlCl3 6H2O solution (150 µL) was mixed and incubated for 6 min. Finally, 1N NaOH (500 µL) was added and incubated for 11 min. The ddH2O used as a blank sample. The absorbance was measured at 510 nm using a UV/visible spectrophotometer (U-2900, Hitachi High-Tech Corporation, Tokyo, Japan). The standard solution was prepared using a quercetin solution (0–1 mg/mL) to make a standard curve (r2 = 0.999). The estimation of the TFC was done in triplicate. The total flavonoids in the coffee were expressed as mg quercetin equivalent/mL of coffee extract.
The total tannin content (TTC) was measured using the Folin-Ciocalteu method, with some modifications [32]. About 100 µL of the coffee extract was added to a tube (10 mL) containing 7500 µL of distilled water, 500 µL of Folin-Ciocalteu phenol reagent, and 1000 µL of 35% sodium carbonate solution and was then diluted to 10,000 µL with distilled water. The mixture was well-mixed and placed at room temperature for 30 min. A set of standard solutions of tannic acid (20, 40, 60, 80, 100 µg/mL) were made as a reference. Absorbance for the test and standard solutions was measured with a UV/Visible spectrophotometer (U-2900, Hitachi High-Tech Corporation, Tokyo, Japan) against the blank (distilled water) at 700 nm. The estimation of the TTC was done in triplicate. The tannin content was expressed in mg/mL of tannic acid in the coffee extracts.
2.7. Sensory Evaluation
The consumer responses of the coffee made from fermented and non-fermented coffee beans were evaluated with 50 people (students and staff members of the horticulture department) at Kangwon National University, Republic of Korea. The medium roasted coffee beans were selected for testing the consumer acceptability since the Korean people widely used the medium roasted coffee. The coffee was brewed using a coffee maker (HD7450, Philips, Nanjing, China) using 36 g of coffee powder with 500 mL of water. The prepared coffee was poured into a thermos to maintain the temperature. Each consumer was provided with coffee sample (20 mL, 60 ± 2 °C) in a paper cup (150 mL) and a glass of water (24 ± 2 °C) for cleansing palate after each taste. The scale was 1 to 7 and labeled as 1 = dislike very much, 2 = dislike moderately, 3 = dislike slightly, 4= neither like nor dislike, 5 = like slightly, 6 = like moderately, 7 = like very much.
2.8. Statistical Analysis
The results were compiled using Microsoft Excel 2013. Analysis of variance (ANOVA) was performed using SAS 9.4 software (SAS Institute, 100 Campus Drive, Cary, Raleigh, North Carolina, USA), to classify significant variations among samples.
3. Results and Discussion
3.1. pH and Colony Count (log CFU/mL)
The pH of the solution (the water that was used to ferment the coffee beans) was measured right after the inoculation of the yeast (0 h) and after 24 h of fermentation. A pH reduction was observed in both the yeast-inoculated and non-yeast-inoculated (control) treatments. However, the pH reduction rate was higher in the yeast-inoculated sample. The pH in the control treatment was 6.02 at 0 h and 5.78 after 24 h (Figure 1A). In the fermented treatment, the pH was reduced from 6.05 to 5.46 within 24 h of fermentation (Figure 1A). The pH of the yeast-inoculated solution showed a higher reduction compared to the non-yeast-inoculated solution. The alkalinity and acidity of the solution are expressed based on the pH values. The pH continues to decrease while fermentation takes place for various reasons. Fermentation is responsible for the production of organic acids and the absorption of basic amino acids, which substantially reduces the pH [33]. However, a small pH reduction was found in the non-yeast-inoculated treatment. This reduction was expected because the water-soluble organic acids leaked from the coffee beans into the water [21,34] and/or because of bacteria that naturally exist on the coffee beans [21]. The yeast populations were measured; initially, they were 7.66 log CFU/mL, and after 24 h, they reached 9.62 log CFU/mL (Figure 1B).
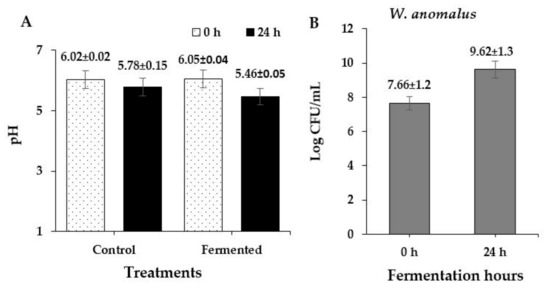
Figure 1.
The pH in yeast inoculated and non-inoculated treatments (A) and yeast population (B).
3.2. Colorimeter Data
The fermented and non-fermented ground coffee after roasting is shown in Figure 2. A significant (p < 0.05) differences were observed between the yeast-fermented and non-fermented treatments of ground roasted (light roasting level) coffee with respect to the colorimetric parameter (L* and a*) (Figure 3A,B). The L* and a* of ground roasted coffee did not significantly differ between the fermented and control treatment in both medium and dark roasting condition. However, we observed that the L* value increased and the a* value decreased as the roasting time increased. The b* value was significantly higher in the fermented treatment at the light, medium and dark roasting level (Figure 3C). Supporting reports showed that fermentation of green coffee beans with S. cerevisiae strains [21,22], and S. fibuligera [22] resulted in high L*, a*, and b* values compared to non-fermented coffee beans. During cocoa fermentation, gradually, a color change was observed as a result of a high amount of phenolic compounds and flavonoids, which act as a substrate of polyphenol oxidase in the presence of oxygen [35].
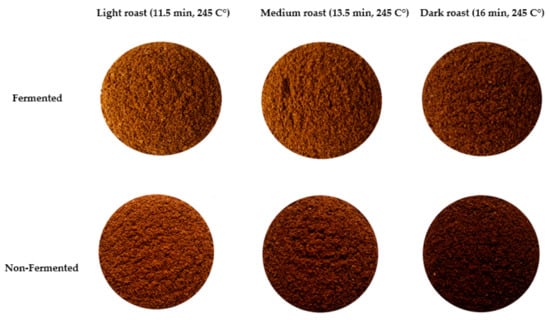
Figure 2.
The fermented and non-fermented ground coffee that roasted at a different level.
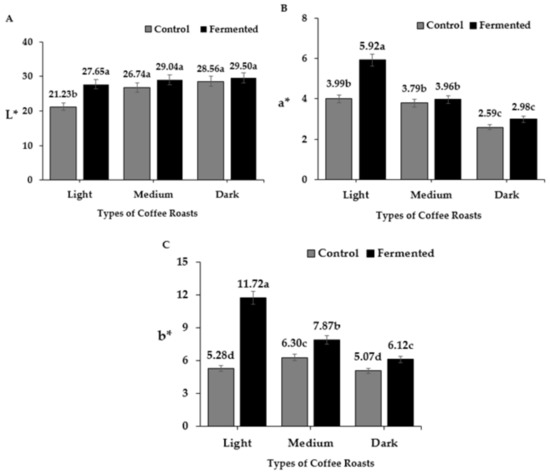
Figure 3.
Colorimeter (L*, a* and b*) values of fermented roasted and ground coffee (A–C). Bars with different letters indicate a significant difference (p < 0.5) among treatments.
3.3. Antioxidant Activity
3.3.1. SOD-Like and ORAC
The antioxidants of fermented and non-fermented coffee extract were evaluated in terms of the oxygen radical absorbance capacity (ORAC) and superoxide dismutase (SOD)-like activity. The peroxyl radical scavenging potentials of aqueous soluble components present in the coffee could be estimated more accurately with a modified ORAC assay [36,37]. There was no significant (p > 0.05) difference between the yeast-fermented and non-fermented coffee extracts with respect to the ORAC value in medium (Figure 4A) and dark roasted coffee. The SOD-like activity was not significantly differed between fermented and non-fermented coffee in all roasting conditions (Figure 4B). However, both ORAC and SOD-like activity were significantly lower in both treatments in the light roasting condition. The means of ORAC value for the yeast-fermented coffee extracts was 28.33, 46.08, and 47.82 µ MTE/mL in the light, medium and dark roasted coffee, respectively (Figure 4A). The means of the SOD-like activity of yeast-fermented coffee extracts was 59.56, 87.31, and 89.05% at the light, medium and dark roasting levels, respectively (Figure 4B). The ORAC value was higher by 3.96 µ MTE/mL in fermented coffee compared to non-fermented coffee in the light roasting condition (Figure 4A). We found a significant improvement in the ORAC value and SOD-like activity in the medium and dark conditions compared to the light roasted coffee regardless of the fermentation. The medium and dark roasting conditions improved the ORAC by 21.93 and 23.94 µ MTE/mL in the control treatment. However, it was increased by 17.75 and 19.49 µ MTE/mL in the fermented coffee extracts compared to light roasted coffee, respectively. This is in agreement with previous reports on the influence of roasting on antioxidant activity. Nicoli et al. [38] reported higher antioxidant activity for medium and dark roast brews. Similarly, the elevated antioxidant activity for higher degrees of roasting has been confirmed in studies [39,40,41]. As the roasting temperature increased the antioxidant activities of the kernel, cashew nut and testa extracts increased [42]. Several publications have described variations in coffee antioxidant contents as a cause of roasting conditions [43,44]. Del Castillo et al. [43] noticed a higher antioxidant activity in the medium roasted coffee brew. However, Perrone et al. [45] found a greater antioxidant activity for light roast brews. The results from various investigations regarding the antioxidant activity of coffee have been considerably diverse. The causes of such variable research results can be associated with the development of melanoidin compounds, which increase the antioxidant capacity despite the reductions in the polyphenol content. Nevertheless, other studies have not detected any significant effects of roasting on antioxidant activity [46], nor any indications that roasting for a longer duration at high temperature reduce antioxidant activity [44,47,48] when polyphenol degradation is not compensated by melanoidin formation [49,50]. However, amongst other coffees, this phenomenon was noticed for dark roasted Robusta coffee [40].
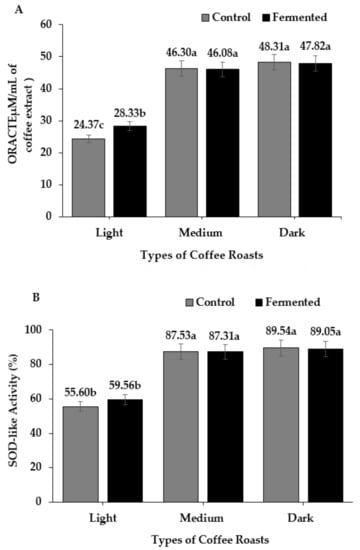
Figure 4.
The oxygen radical absorbance capacity (ORAC) and superoxide dismutase-like (SOD)-like activity of fermented coffee at different degrees of roast (A and B, respectively). Bars with different letters indicate a significant difference (p < 0.5) among treatments.
3.3.2. DPPH and FRAP
DPPH and FRAP are among the various methods of evaluating the antioxidant properties of foods and drinks. The percentage of DPPH inhibition was higher in the fermented coffee than the non-fermented coffee in all roasting conditions (Figure 5A). Like the DPPH, the FRAP was improved in the fermented coffee in the light, medium, and dark roast types (Figure 5B). The maximum DPPH inhibition resulted from the fermented treatment in the light roasting condition (46.31%). The highest FRAP was found in the fermented coffee in the dark roasting condition (176.11 AAE µg/mL of coffee extract). In general, fermentation of green coffee beans using W. anomalus improved the DPPH and FRAP. Adetuyi and Ibrahim [51] reported that fermentation enhanced the DPPH radical-scavenging ability and FRAP of okra seeds. The increase in DPPH capacity after the fermentation process shows that fermentation likely has great potential in generating some metabolites with superior radical scavenging activity [52]. The percentage of DPPH inhibition dropped as the roasting time increased (from the light to dark roasting condition). The result is in agreement with Jung et al. [53], who reported that lightly roasted coffee extract has the highest antioxidant activity with a low roasting temperature and that the DPPH decreases in the dark roasted extract. However, the FRAP improved as the roasting time increased. A supporting result published by Song et al. [54] showed that as the roasting time increased from 11 to 13 min (medium-light to medium-dark) the FRAP increased as well.
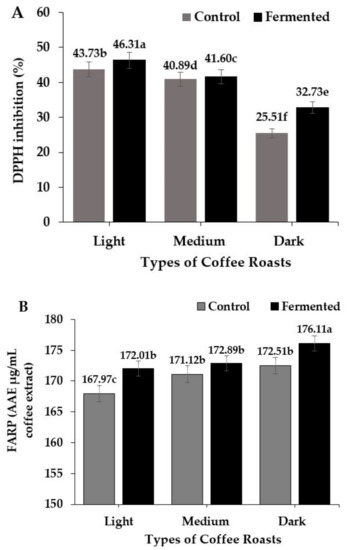
Figure 5.
The DPPH inhibition (%) and Ferric reducing antioxidant power (AAE µg/mL of coffee extract) of fermented coffee. (A and B, respectively). Bars with different letters indicate a significant difference (p < 0.5) among treatments.
3.4. Total Phenol, Flavonoid and Tannin Content
The TPC of yeast-fermented coffee extracts had significant differences (p < 0.05) compared to the non-fermented coffee in all roasting types (Figure 6). During the medium roasting condition, the highest TPC difference was observed between the fermented and non-fermented coffee. The TPC in the control treatment showed a decreasing trend as the roasting time increased (light to medium to dark). The TPC in the fermented treatment was 0.98, 1.29 and 0.91 GAEmg/mL of coffee extract in the light, medium and dark roasting condition, respectively (Figure 6). The fermentation of green coffee beans with W. anomalus increased the TPC of the coffee extract by 0.09, 0.46, and 0.21 GAE mg/mL of coffee extract compared to non-fermented coffee at each degree of roasting (light, medium and dark roast, respectively) (Figure 6). Generally, fermentation improved the TPC compared to non-fermented coffee. These results are in agreement with several reports on fermented seeds, where fermentation induced an improvement in the phenolic content of seeds, such as legumes [55,56,57,58,59], okra seeds [51], soybeans [60], and coffee [21,22]. Similarly, fermentation elevated the phenolic and flavonoid contents and improved the antioxidant properties of the following plant seeds: chestnut, adlay, walnut, and lotus seed [61]. This might be associated with, proteolytic enzymes from the starter organism that hydrolyze the complexes of phenolics into simple, soluble-free phenols and biologically more active forms during fermentation, which are readily absorbed by organisms [56,62]. However, other researchers’ findings indicate the proteolytic activities alone did not show a significant TPC increase; rather, when it was combined with a pectinase enzyme, the olive oil polyphenol content showed a significantly high increment [63]. These findings lead us to conclude W. anomalus’s ability to produce pectinase enzymes linked with the increased TPC content in this experiment. In our experiment, the TPC was decreased as the roasting time increased, except the fermented coffee in the medium roast condition which significantly increased the TPC, regardless of the fermentation. A supporting result was published by Odžaković, B., et al. [64], the TPC decreased as the roasting temperature increased. During coffee roasting the degradation of polyphenols [36,44,45,46], which are sensitive to heat, are affected by roasting temperature. The reduction in the polyphenol content which is linked to the extended roasting is due to the heat-sensitive nature of such compounds and the lengthened roasting duration, as well as the high processing temperature. Phenol reductions or losses during the processing steps are undesirable because of their profound effects on human health.
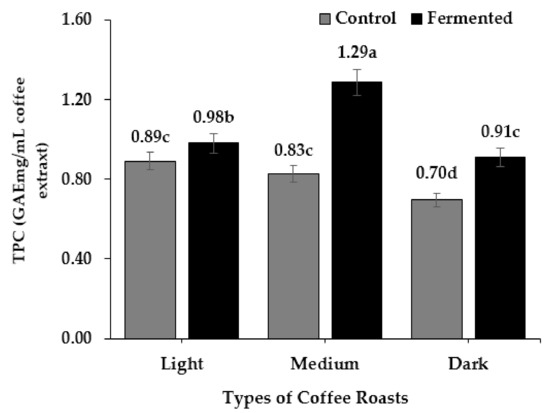
Figure 6.
Total phenol contents (GAE mg/mL of coffee extract) of fermented coffee. Bars with different letters indicate a significant difference (p < 0.5) among treatments.
Fermentation of green coffee beans with W. anomalous significantly (p < 0.05) increased the TFC compared to non-fermented coffee in all roasting conditions (light, medium and dark) (Figure 7). TFC was approximately consistent in the control treatment in all roasting conditions. However, in the fermented coffee, the TFC was significantly higher in the light roasting compared to medium and dark roasting conditions. As shown in Figure 7, the TFC in the control treatment was 0.64, 0.67, and 0.64. The TFC in the fermented coffee at different roasting levels was 0.86 (light), 0.74 (medium), and 0.72 (dark) QE mg/mL of coffee extract. Fermentation improves the TFC content by 0.22, 0.07, and 0.08 QE mg/mL of coffee extract in the light, medium, and dark roasting conditions, respectively (Figure 7). These findings agree with several published papers on different fermented seeds, where fermentation significantly enhanced the TFC compared to the TFC in unfermented seeds, such as in soybeans [60], legumes [45,55,56], coffee beans [21,22], and okra seeds [51]. The increase in the flavonoid content might be linked to the rise in acidic values during fermentation, which releases bound flavonoid components and makes them more bioavailable [51].
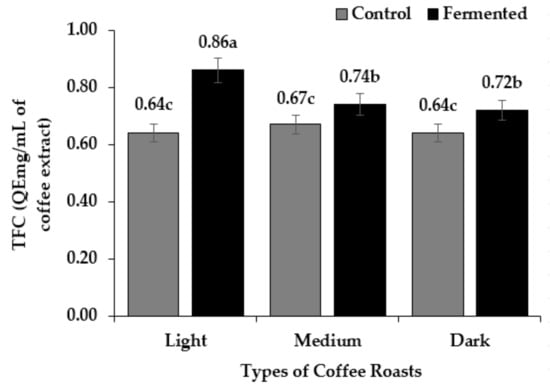
Figure 7.
Total flavonoid contents (QE mg/mL of coffee extract) of fermented coffee. Bars with different letters indicate a significant difference (p < 0.5) among treatments.
Regardless of the fermentation, the average TFC from both treatments at each roasting condition was 0.75 ± 0.11, 0.71 ± 0.03, and 0.68 ± 0.04 QE mg/mL of coffee extract at the light, medium, and dark roasting levels, respectively. The average TFC value showed a decreasing trend as the roasting time increased, regardless of the fermentation. The result in our study coincides with Tiwari, B. K., et al. [65], who found that the TFC was reduced significantly as the roasting temperature increased from 80 °C to 120 °C and roasting duration proceeded from 20 min to 40 min. The cause for the reduction in the TFC at a higher temperature might be associated with the degradation of flavonoids. The preparation and processing of food may reduce the flavonoid contents depending on the techniques used [66].
The yeast-fermented coffee extracts had a significant difference (p < 0.05) compared to non-fermented coffee with regard to TTC in the light and dark roasting conditions (Figure 8). The TTC of non-fermented coffee was 0.53, 0.33, and 0.21 mg tannic acid/mL of coffee extract in light, medium and dark roasting conditions, respectively. In the fermented coffee, the TTC was 0.73, 0.28, and 0.15 mg tannic acid/mL coffee extract in the light, medium, and dark roasting conditions, respectively. In the light roasting condition, the tannin content was higher in fermented coffee than the control and it was lower than the control in the medium and dark roasting conditions (Figure 8). It has been reported that fermentation significantly decreased the tannin content of fermented sorghum cultivars [67], and in fermentation of Xuan mugua fruit with lactic acid bacteria, where it caused a significant decrease in the tannin content [68]. We have also found a supporting result in our previous experiment that indicates the fermentation of green coffee beans with S. cerevisiae and S. fibuligera strains reduced the TTC compared to non-fermented coffee [22]. Regardless of the fermentation, the TTC was reduced as the roasting time increased. The average TTC in each roasting condition was 0.63, 0.31 and 0.19 mg tannic acid mg/mL coffee extract in the light, medium, and dark roasting condition (Figure 8). Likewise, the tannin content was decreased in soya bean flour (0.01–0.30 g/100 g dry weight) [69], and 22% in maize [70]; because of soaking in water for 48 h and roasting. Tannin content has an astringent characteristic that contributes to the bitterness of coffee, so the reduction in tannins can be viewed as a positive aspect.
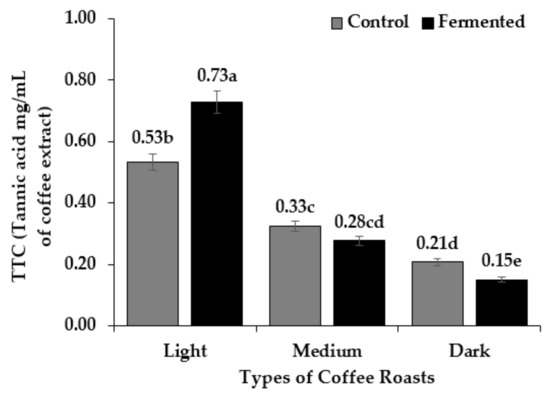
Figure 8.
Total tannin contents (tannic acid mg/mL of coffee extract) of fermented coffee. Bars with different letters indicate a significant difference (p < 0.5) among treatments.
3.5. Sensory Evaluation
Based on the results of consumer acceptance ratings, the non-fermented coffee received a higher score than the fermented coffee in terms of its color, sourness, mouthfeel, acidity, and overall quality. However, the fermented coffee received the highest rating with respect to aroma, bitterness, and astringency. The average score for the overall quality of the coffee was 5.22 and 4.51 for non-fermented and fermented coffee, respectively (Figure 9). The average score for acidity was 3.75 for the fermented coffee and 4.15 for the non-fermented coffee. Kwak et al. [21] have evaluated the consumer acceptability of fermented green coffee beans with different yeasts, noting that one of their fermented coffee treatment acceptability ratings was lower but insignificant when compared to the control treatment. In addition, they mentioned that all the fermented coffee received lower ratings when compared to the control. Fermentation has both positive and negative influences on the flavor and aroma characteristics of coffee. Based on the overall quality rating, we have categorized the consumer responses into two groups: people who preferred the non-fermented coffee over the fermented coffee (55.48%) and people who preferred the fermented coffee over the non-fermented coffee (44.52%). A supporting result was published by Kwak et al. [21], who found that 39.4% of consumers preferred fermented coffee while 60.6% preferred non-fermented coffee by disliking the control (non-fermented) treatments based on the overall quality ratings. However, consumer acceptance evaluations are very subjective to the individual.
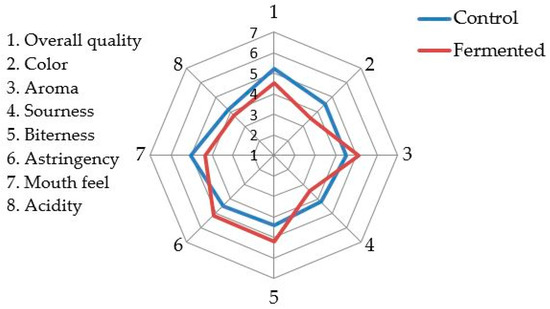
Figure 9.
The consumer acceptability ratings of fermented and non-fermented coffee.
4. Conclusions
This study showed the responses of the coffee beans fermented with W. anomalus strain KNU18Y3. The fermentation of green coffee beans with W. anomalus for 24 h increased the DPPH, FRAP, TPC, and TFC when compared to non-fermented coffee, whereas the SOD-like and ORAC did not significantly differ between the fermented and non-fermented coffee beans. We have also found that the fermentation of coffee beans for 24 h is enough to modify the functionality of coffee beans. The extent of roasting had both negative and positive effects on the overall antioxidants, TPC, TFC, and TTC. The degradation of the TPC, TFC, and TTC was observed as the roasting time increased from 11.5 to 16 min, regardless of the fermentation. The fermented coffee received better ratings in terms of its aroma, bitterness, and astringency parameters. Moreover, 44.52% of participants chose the fermented coffee over the non-fermented one based on the overall quality ratings. This result shows that fermented coffee is also preferred by consumers. Since the consumer evaluation experiment was conducted blind (the participants were not informed of the coffee types), the increased antioxidants and phenolic and flavonoid compounds will probably attract more consumers when they are informed of these positive aspects of fermented coffee. While the W. anomalus yeast has the potential to be used for green coffee bean fermentation, further selection and evaluation of microorganisms should be continued to maximize the functionality of the coffee bean and its health benefits.
Author Contributions
Conceptualization, W.H.K., M.H.; methodology, M.H.; Data curation, M.H.; validation, W.H.K.; formal analysis, M.H.; software, M.H.; investigation, W.H.K.; resources, W.H.K.; funding acquisition, W.H.K.; writing—original draft preparation, M.H.; writing—review and editing, W.H.K., M.H.; supervision, W.H.K.; project administration, W.H.K. All authors have read and agreed to the published version of the manuscript.
Conflicts of Interest
The authors declare no conflict of interest.
References
- Mesfin, H.; Kang, W.H. The role of microbes in coffee fermentation and their impact on coffee quality. J. Food Qual. 2019. [Google Scholar] [CrossRef]
- Martins, S.; Mussatto, S.I.; Martínez-Avila, G.; Montañez-Saenz, J.; Aguilar, C.N.; Teixeira, J.A. Bioactive Phenolic Compounds: Production and Extraction by Solid-State Fermentation. A Review. Biotechnol. Adv. 2011, 29, 365–373. [Google Scholar] [CrossRef] [PubMed]
- Torino, M.I.; Limón, R.I.; Martínez-Villaluenga, C.; Mäkinen, S.; Pihlanto, A.; Vidal-Valverde, C.; Frias, J. Antioxidant and Antihypertensive Properties of Liquid and Solid State Fermented Lentils. Food Chem. 2013, 136, 1030–1037. [Google Scholar] [CrossRef] [PubMed]
- Dulf, F.V.; Vodnar, D.C.; Socaciu, C. Effects of solid-state fermentation with two filamentous fungi on the total phenolic contents, flavonoids, antioxidant activities and lipid fractions of plum fruit (Prunus domestica L.) by-products. Food Chem. 2016, 209, 27–36. [Google Scholar] [CrossRef]
- Zhang, X.Y.; Chen, J.; Li, X.L.; Yi, K.; Ye, Y.; Liu, G.; Wang, Z.G. Dynamic changes in antioxidant activity and biochemical composition of tartary buckwheat leaves during Aspergillus niger fermentation. J. Funct. Foods 2017, 32, 375–381. [Google Scholar] [CrossRef]
- Belitz, H.D.; Grosh, W.; Schieberle, P. Coffee, Tea, Cocoa. In Food Chemistry; Springer-Verlag: Heidelberg/Berlin, Germany; New York, NY, USA, 2009. [Google Scholar]
- Rawel, H.M.; Kulling, S.E. Nutritional contribution of coffee, cacao and tea phenolics to human health. J. Verbraucherschutz Lebensmittelsicherheit 2007, 2, 399–406. [Google Scholar] [CrossRef]
- Richelle, M.; Tavazzi, I.; Offord, E. Comparison of the antioxidant activity of commonly consumed polyphenolic beverages (coffee, cocoa, and tea) prepared per cup serving. J Agric. Food Chem. 2001, 49, 3438–3442. [Google Scholar] [CrossRef]
- Cheynier, V. Polyphenols in foods are more complex than often thought. Am. J. Clin. Nutr. 2005, 81, 223S–229S. [Google Scholar] [CrossRef]
- Manach, C.; Scalbert, A.; Morand, C.; Rémésy, C.; Jimenez, L. Polyphenols: Food sources and bioavailability. Am. J. Clin. Nutr. 2004, 79, 727–747. [Google Scholar] [CrossRef]
- Kumar, S.; Mishra, A.; Pandey, A.K. Antioxidant mediated protective effect of Parthenium hysterophorus against oxidative damage using in vitro models. BMC Complement Altern. Med. 2013, 13, 120. [Google Scholar] [CrossRef]
- Kumar, S.; Pandey, A.K. Phenolic content, reducing power and membrane protective activities of Solanum xanthocarpum root extracts. Vegetos 2013, 26, 301–307. [Google Scholar]
- Yao, L.H.; Jiang, Y.M.; Shi, J.; Tomás-Barberán, F.A.; Datta, N.; Singanusong, R.; Chen, S.S. Flavonoids in food and their health benefits. Plant Foods Hum. Nutr. 2004, 59, 113–122. [Google Scholar] [CrossRef] [PubMed]
- Kurtzman, C.P.; Fell, J.W. The Yeast, a Taxonomical Study, 4th ed.; Elsevier Science: Amsterdam, The Netherlands, 1988; p. 1055. [Google Scholar]
- De Hoog, G.S. Risk assessment of fungi reported from humans and animals. Mycoses 1996, 39, 407–417. [Google Scholar] [CrossRef]
- Comitini, F.; De Ingenis, J.; Pepe, L.; Mannazu, I.; Ciani, M. Pichia anomala and Kluyveromyces wikerhamii killer toxins as new tool against Dekkera/Brettanomyces spoilage yeasts. FEMS Microbiol. Lett. 2004, 238, 235–240. [Google Scholar] [CrossRef] [PubMed]
- Lee, Y.J.; Choi, Y.R.; Lee, S.Y.; Park, J.T.; Shim, J.H.; Park, K.H.; Kim, J.W. Screening wild yeast strains for alcohol fermentation from various fruits. Mycobiology 2011, 39, 33–39. [Google Scholar] [CrossRef] [PubMed]
- Ye, M.; Yue, T.; Yuan, Y. Effects of sequential mixed cultures of Wickerhamomyces anomalus and Saccharomyces cerevisiae on apple cider fermentation. FEMS Yeast Res. 2014, 14, 873–882. [Google Scholar] [CrossRef] [PubMed]
- Madrigal, T.; Maicas, S.; Tolosa, J.J.M. Glucose and ethanol tolerant enzymes produced by Pichia (Wickerhamomyces) isolates from enological ecosystems. Am. J. Enol. Vitic. 2013, 64, 126–133. [Google Scholar] [CrossRef]
- Zha, M.; Sun, B.; Wu, Y.; Yin, S.; Wang, C. Improving flavor metabolism of Saccharomyces cerevisiae by mixed culture with Wickerhamomyces anomalus for Chinese Baijiu making. J. Biosci. Bioeng. 2018, 126, 189–195. [Google Scholar] [CrossRef]
- Kwak, H.S.; Jeong, Y.; Kim, M. Effect of Yeast Fermentation of Green Coffee Beans on Antioxidant Activity and Consumer Acceptability. J. Food Qual. 2018. [Google Scholar] [CrossRef]
- Mesfin, H.; Kang, W.H. Antioxidant Activity, Total Polyphenol, Flavonoid and Tannin Contents of Fermented Green Coffee Beans with Selected Yeasts. Fermentation 2019, 5, 29. [Google Scholar]
- Lee, L.W.; Cheong, M.W.; Curran, P.; Yu, B.; Liu, S.Q. Modulation of coffee aroma via the fermentation of green coffee beans with Rhizopus oligosporus: I. Green Coffee. Food Chem. 2016, 211, 916–924. [Google Scholar] [CrossRef] [PubMed]
- Lee, L.W.; Tay, G.Y.; Cheong, M.W.; Curran, P.; Yu, B.; Liu, S.Q. Modulation of the volatile and non-volatile profiles of coffee fermented with Yarrowia lipolytica: I. Green coffee. LWT- Food Sci. Technol. 2017, 77, 225–232. [Google Scholar] [CrossRef]
- Mesfin, H.; Kang, W.H. Isolation, Identification, and Characterization of Pectinolytic Yeasts for Starter Culture in Coffee Fermentation. Microorganisms 2019, 7, 401. [Google Scholar]
- Ou, B.; Hampsch-Woodill, M.; Prior, R.L. Development and validation of an improved oxygen radical absorbance capacity assay using fluorescein as the fluorescent probe. J. Agric. Food Chem. 2001, 49, 4619–4626. [Google Scholar] [CrossRef] [PubMed]
- Marklund, S.; Marklund, G. Involvement of the superoxide anion radical in the autoxidation of pyrogallol and a convenient assay for superoxide dismutase. Eur. J. Biochem. 1974, 47, 469–474. [Google Scholar] [CrossRef]
- Pataro, G.; Sinik, M.; Capitoli, M.M.; Donsì, G.; Ferrari, G. The influence of post-harvest UV-C and pulsed light treatments on quality and antioxidant properties of tomato fruits during storage. Innov. Food Sci. Emerg. Technol. 2015, 30, 103–111. [Google Scholar] [CrossRef]
- Oyaizu, M. Studies on products of browning reaction. Jpn. J. Nutr. Diet. 1986, 44, 307–315. [Google Scholar] [CrossRef]
- Singleton, V.L.; Orthofer, R.; Lamuela-Raventós, R.M. Analysis of total phenols and other oxidation substrates and antioxidants by means of Folin-ciocalteu reagent. Methods Enzymol. 1999, 299, 152–178. [Google Scholar]
- Dewanto, V.; Wu, X.; Liu, R.H. Processed sweet corn has higher antioxidant activity. J. Agric. Food Chem. 2002, 50, 4959–4964. [Google Scholar] [CrossRef]
- CI, K.C.; Indira, G. Quantitative estimation of total phenolic, flavonoids, tannin and chlorophyll content of leaves of Strobilanthes Kunthiana (Neelakurinji). J. Med. Plants 2016, 4, 282–286. [Google Scholar]
- Coote, N.; Kirsop, B.H. Factors responsible for the decrease in pH during beer fermentations. J. Inst. Brew. 1976, 82, 149–153. [Google Scholar] [CrossRef]
- Rodrigues, C.I.; Marta, L.; Maia, R.; Miranda, M.; Ribeirinho, M.; Máguas, C. Application of solid-phase extraction to brewed coffee caffeine and organic acid determination by UV/HPLC. J. Food Compos. Anal. 2007, 20, 440–448. [Google Scholar] [CrossRef]
- Afoakwa, E.O.; Paterson, A.; Fowler, M.; Ryan, A. Flavor formation and character in cocoa and chocolate: A critical review. Food Sci. Nutr. 2008, 48, 840–857. [Google Scholar] [CrossRef] [PubMed]
- Kwon, D.Y.; Choi, K.H.; Kim, S.J.; Choi, D.W.; Kim, Y.S.; Kim, Y.C. Peroxyl radical-scavenging activity of coffee brews. Eur. Food Res. Technol. 2005, 221, 471–477. [Google Scholar]
- Gómez-Ruiz, J.Á.; Leake, D.S.; Ames, J.M. In Vitro Antioxidant Activity of Coffee Compounds and Their Metabolites. J. Agric. Food Chem. 2007, 55, 6962–6969. [Google Scholar] [CrossRef] [PubMed]
- Nicoli, M.C.; Anese, M.; Manzocco, L.; Lerici, C.R. Antioxidant properties of coffee brews in relation to the roasting degree. Lebensm. Wiss. Technol. 1997, 30, 292–297. [Google Scholar] [CrossRef]
- Liu, Y.; Kitts, D.D. Confirmation that the Maillard reaction is the principle contributor to the antioxidant capacity of coffee brews. Food Res. Int. 2011, 44, 2418–2424. [Google Scholar] [CrossRef]
- Vignoli, J.A.; Viegas, M.C.; Bassoli, D.G.; Benassi, M.T. Roasting process affects differently the bioactive compounds and the antioxidant activity of arabica and robusta coffees. Food Res. Int. 2014, 61, 279–285. [Google Scholar] [CrossRef]
- Sánchez-González, I.; Jiménez-Escrig, A.; Saura-Calixto, F. In vitro antioxidant activity of coffees brewed using different procedures (Italian, espresso and filter). Food Chem. 2005, 90, 113–139. [Google Scholar] [CrossRef]
- Chandrasekara, N.; Shahidi, F. Effect of roasting on phenolic content and antioxidant activities of whole cashew nuts, kernels, and testa. J. Agric. Food Chem. 2011, 59, 5006–5014. [Google Scholar] [CrossRef]
- Del Castillo, M.D.; Ames, J.M.; Gordon, M.H. Effect of roasting on the antioxidant activity of coffee brews. J. Agric. Food Chem. 2002, 50, 3698–3703. [Google Scholar] [CrossRef] [PubMed]
- Cämmerer, B.; Kroh, L.W. Antioxidant activity of coffee brews. Eur. Food Res. Technol. 2006, 223, 469–474. [Google Scholar] [CrossRef]
- Perrone, D.; Farah, A.; Donangelo, C.M. Influence of coffee roasting on the incorporation of phenolic compounds into melanoidins and their relationship with antioxidant activity of the brew. J. Agric. Food Chem. 2012, 60, 4265–4275. [Google Scholar] [CrossRef] [PubMed]
- Szymanowska, K.; Wołosiak, R. The effect of coffee roasting on selected parameters of its quality. Res. Teach. Appar. 2014, 19, 77–83. [Google Scholar]
- Duarte, S.M.S.; Abreu, C.M.P.; Menezes, H.C.; Santos, M.H.; Gouvêa, C.M.C.P. Effect of processing and roasting on the antioxidant activity of coffee brews. Ciênc. Tecnol. Aliment. 2005, 25, 387–393. [Google Scholar] [CrossRef]
- Hecimovic, I.; Belscak-Cvitanovic, A.; Horzic, D.; Komes, D. Comparative study of polyphenols and caffeine in different coffee varieties affected by the degree of roasting. Food Chem. 2011, 129, 991–1000. [Google Scholar] [CrossRef]
- Sacchetti, G.; Mattia, C.D.; Pittia, P.; Mastrocola, D. Effect of roasting degree, equivalent thermal effect and coffee type on the radical scavenging activity of coffee brews and their phenolic fraction. J. Food Eng. 2009, 90, 74–80. [Google Scholar] [CrossRef]
- Summa, C.A.; Calle, B.; Brohee, M.; Stadler, R.H.; Anklama, E. Impact of the roasting degree of coffee on the in vitro radical scavenging capacity and content of acrylamide. LWT- Food Sci. Technol. 2007, 40, 1849–1854. [Google Scholar] [CrossRef]
- Adetuyi, F.O.; Ibrahim, T.A. Effect of fermentation time on the phenolic, flavonoid and vitamin C contents and antioxidant activities of okra (Abelmoschus esculentus) seeds. Niger. Food J. 2014, 32, 128–137. [Google Scholar] [CrossRef]
- Abu, F.; Taib, M.; Norma, C.; Moklas, M.; Aris, M.; Mohd Akhir, S. Antioxidant Properties of Crude Extract, Partition Extract, and Fermented Medium of Dendrobium sabin Flower. J. Evid.-Based Complement. Altern. Med. 2017. [Google Scholar] [CrossRef]
- Jung, S.; Kim, M.H.; Park, J.H.; Jeong, Y.; Ko, K.S. Cellular antioxidant and anti-inflammatory effects of coffee extracts with different roasting levels. J. Med. Food. 2017, 20, 626–635. [Google Scholar] [CrossRef] [PubMed]
- Song, J.L.; Asare, T.S.; Kang, M.Y.; Lee, S.C. Changes in Bioactive Compounds and Antioxidant Capacity of Coffee under Different Roasting Conditions. Korean J. Plant Resour. 2018, 31, 704–713. [Google Scholar]
- Moktan, B.; Saha, J.; Sarkar, P.K. Antioxidant activities of soybean as affected by Bacillus-fermentation to kinema. Food Res. Int. 2008, 41, 586–593. [Google Scholar] [CrossRef]
- Ademiluyi, A.O.; Oboh, G. Antioxidant properties of condiment produced from fermented bambara groundnut (Vigna subterranea L. Verdc). J. Food Biochem. 2011, 35, 1145–1160. [Google Scholar] [CrossRef]
- Dajanta, K.; Janpum, P.; Leksing, W. Antioxidant capacities, total phenolics and flavonoids in black and yellow soybeans fermented by Bacillus subtilis: A comparative study of Thai fermented soybeans (thua nao). Int. Food Res. J. 2013, 20, 3125. [Google Scholar]
- Guzmán-Uriarte, M.L.; Sánchez-Magaña, L.M.; Angulo-Meza, G.Y.; Cuevas-Rodríguez, E.O.; Gutiérrez-Dorado, R.; Mora-Rochín, S.; Reyes-Moreno, C. Solid state bioconversion for producing common bean (Phaseolus vulgaris L.) functional flour with high antioxidant activity and antihypertensive potential. Food Nutr. Sci. 2013, 4, 480. [Google Scholar]
- Plaitho, Y.; Kangsadalampai, K.; Sukprasansap, M. The protective effect of Thai fermented pigmented rice on urethane induced somatic mutation and recombination in Drosophila melanogaster. J. Med. Plant Resour. 2013, 7, 91–98. [Google Scholar]
- Amadou, I.; Yong-Hui, S.; Sun, J.; Guo-Wei, L. Fermented soybean products: Some methods, antioxidants compound extraction and their scavenging activity. Asian J. Biochem. 2009, 4, 68–76. [Google Scholar]
- Wang, C.Y.; Sz-Jie, W.; Shyu, Y.T. Antioxidant Properties of Certain Cereals as Affected by Food-Grade Bacteria Fermentation. J. Biosci. Bioeng. 2014, 117, 449–456. [Google Scholar] [CrossRef]
- Shrestha, A.K.; Dahal, N.R.; Ndungutse, V. Bacillus fermentation of soybean: A review. J. Food Sci. Technol. 2010, 6, 1–9. [Google Scholar] [CrossRef]
- Moustakime, Y.; Hazzoumi, Z.; Joutei, K.A. Effect of proteolytic activities in combination with the pectolytic activities on extractability of the fat and phenolic compounds from olives. Springer Plus 2016, 5, 739. [Google Scholar] [CrossRef] [PubMed][Green Version]
- Odžaković, B.; Džinić, N.; Kukrić, Z.; Grujić, S. Effect of roasting degree on the antioxidant activity of different Arabica coffee quality classes. Acta Sci. Pol. Technol. Aliment. 2016, 15, 409–417. [Google Scholar] [CrossRef] [PubMed]
- Tiwari, B.K.; Brunton, N.P.; Brennan, C. Handbook of plant food phytochemicals: Sources, stability and extraction. John Wiley and Sons: Hoboken, NJ, USA, 2013. [Google Scholar]
- Kumar, S.; Pandey, A.K. Antioxidant, lipo-protective and antibacterial activities of phytoconstituents present in Solanum xanthocarpum root. Int. Rev. Biophys. Chem. 2012, 3, 42–47. [Google Scholar]
- Hassan, I.A.; El Tinay, A.H. Effect of fermentation on tannin content and in-vitro protein and starch digestibilities of two sorghum cultivars. Food Chem. 1995, 53, 149–151. [Google Scholar] [CrossRef]
- Shang, Y.F.; Cao, H.; Ma, Y.L.; Zhang, C.; Ma, F.; Wang, C.X.; Wei, Z.J. Effect of lactic acid bacteria fermentation on tannins removal in Xuan Mugua fruits. Food Chem. 2019, 274, 118–122. [Google Scholar] [CrossRef]
- Agume, A.; Njintang, N.; Mbofung, C. Effect of soaking and roasting on the physicochemical and pasting properties of soybean flour. Foods 2017, 6, 12. [Google Scholar] [CrossRef]
- Oboh, G.; Ademiluyi, O.A.; Akindahunsi, A.A. The effect of roasting on the nutritional and antioxidant properties of yellow and white maize varieties. Int. J. Food Sci. Technol. 2010, 45, 1236–1242. [Google Scholar] [CrossRef]


© 2020 by the authors. Licensee MDPI, Basel, Switzerland. This article is an open access article distributed under the terms and conditions of the Creative Commons Attribution (CC BY) license (http://creativecommons.org/licenses/by/4.0/).