Article

Augmentation of Granular Anaerobic Sludge with Algalytic Bacteria Enhances Methane Production from Microalgal Biomass

1
Department of Biological Engineering, Utah State University, Old Main Hill 4105, Logan, UT 84322-4105, USA
2
Department of Mathematics and Statistics, Utah State University, Old Main Hill 3900, Logan, UT 84322-3900, USA
*
Author to whom correspondence should be addressed.
Current address: Department of Biological Science, Florida State University, 319 Stadium Drive, Tallahassee, FL 32306-4295, USA.
Fermentation 2019, 5(4), 88; https://doi.org/10.3390/fermentation5040088
Submission received: 19 July 2019 / Revised: 25 September 2019 / Accepted: 29 September 2019 / Published: 30 September 2019
(This article belongs to the Special Issue Fermentation Process in Biorefinery)

Abstract

:
The efficiency of anaerobic digestion relies upon activity of the inoculum converting organic substrate into biogas. Often, metabolic capacity of the inoculum needs to be augmented with new capabilities to accommodate changes in the substrate feed composition. However, bioaugmentation is not a widely used strategy possibly due to the lack of studies demonstrating successful applications. This study describes the bioaugmentation of granular anaerobic sludge digesting mixed algal biomass in batch-scale reactors. The addition of an algalytic bacterial mixture to the granular consortium increased methane yield by 11%. This study also investigated changes in the microbial 16SrRNA composition of the augmented and non-augmented granular inoculum, which demonstrates a significant change in the hydrolytic microbial community. Overall, the studies’ results aim to provide a feasible checklist to assess the success rates of bioaugmentation of anaerobic digestion applications.

1. Introduction

Bioaugmentation of anaerobic digestion (AD) is gaining popularity as a way to enhance methane production from a substrate of choice. For successful bioaugmentation, a microbial consortium with distinct metabolic features is introduced into the anaerobic system, which typically comprises 1% to 15% of the total microbial inoculum dry weight [1,2]. However, successful augmentation can only take place if the metabolic feature of interest is not already present in the indigenous microbial community. In this case, precautions need to be made to ensure there is a distinct ecological niche that can be occupied by the augmenting consortia [3]. For example, ensuring there is a unique need for an electron acceptor/electron donor pair or that a metabolic feature to be augmented will complement the already existing chain of biochemical conversions [4].
An important factor for successful bioaugmentation is the amount of additional inoculum that will be introduced into the anaerobic system. A good start is when 5% of the total inoculum is substituted with the bacterial mix with new capabilities [5]. Studies have reported an enhanced methane/biogas production by up to 70% when a proper amount of new inoculum was introduced. However, it is more common to see an increase of 5% to 25% [6]. Sometimes, repeating bioaugmentation can further enhance methane production [7].
Algal biomass is of high interest as a substrate for anaerobic digestion due to its abundance and high energy content [8]. However, anaerobic digestion of algal biomass is considered of low efficiency, due to the time it takes to digest cellulose-containing compounds in the algal cell walls. Thus, various pretreatments are common to speed-up the decomposition of this biomass [9]. The most common pre-treatments are thermo-chemical or physical influences on the biomass, such as autoclaving, treating with cellulolytic enzymes, and sonication [10]. Either thermal, enzymatic, or mechanical pre-treatment of algal biomass can increase methane recovery by 50% to 90%. However, all of these pre-treatments are costly and there is a need for an economic solution. A potential solution lies in the bioaugmentation of a well-established anaerobic granular consortium with bacteria possessing algalytic activity.
The current study investigates the effect of augmenting granulated anaerobic sludge with an algalytic bacteria mix, using mixed algal biomass as a substrate for anaerobic digestion. By providing algal biomass as a sole carbon source for the anaerobic digestion, a unique metabolic niche is created to allow for a successful incorporation of the augmentation bacterial mixture. An increase in the methane production indicates a measure for a successful bioaugmentation procedure.

2. Materials and Methods

2.1. Isolation of Algalytic Bacteria

Bacterial enrichments to isolate potential algalytic bacteria to be used in bioaugmentation were performed on anaerobic sludge from up flow anaerobic sludge blanket (UASB) reactors seeded with anaerobic sediments from the Logan City Wastewater Lagoons (LCWL), Utah [11,12]. Microalgal biomass collected from the surface of the LCWL was supplied to the reactor as a substrate for microbial growth and biogas production. The fed biomass was a mixed culture, comprised primarily of Chlorella, Chlorococcum, Chlamydomonas, Scenedesmus, Synedra, Navicula, Schroderia, Euglena, Coelastrum, and members of nonheterocystous cyanobacteria. Samples from the reactor sludge bed were collected on the 20th day after the start of anaerobic digestion, which is the time predicted when AD would be in the hydrolytic phase [11].
Algalytic enrichments were performed using a modified double-layer-agar (DLA) method [13], with a model microalgae Chlorella vulgaris as the substrate, representative of the LCWL microalgal community. Petri dishes with two layers of agar were prepared: the bottom layer contained 1.5% agar in distilled water and the upper layer contained 0.8% agar in a microalgal suspension (carbon source layer). The surface of the DLA plate was covered with the anaerobic sludge to allow the initial screening of the algalytic microorganisms (Figure 1).
Potential algalytic bacteria from the UASB sludge formed lysis zones on the surface of the DLA plate and subsequent enrichments were performed from those lysis zones. Isolated bacteria were expected to have a general fermentative behavior and, thus, two types of microbiological media were chosen for isolation of pure cultures: general medium for fermentative microorganisms, such as Tryptic Soy Broth (TSB), and a Grant and Holt (GH) media specific to the most abundant type of bacterium identified for the hydrolysis stage (Pseudomonas spp. [11,14]). A series of both liquid and agar media were used to isolate pure strains of potentially algalytic bacteria.
Individual isolates were Sanger-sequenced with universal bacterial primers targeting 16SrRNA gene, 338F, and 785R [15]. The sequences were deposited in the GenBank under submission number SUB4433715. Isolates belonging to the Citrobacter freundii spp. were additionally characterized based on the phylogenetic relationship of the conserved Citrobacter-specific cfa gene sequence, which encodes a cyclopropane fatty acids synthase [16]. Phylogenetic trees were constructed in MEGA X [17] with Maximum likelihood statistical method. The Bootstrap test of phylogeny follows the Tamura-Nei model [18].

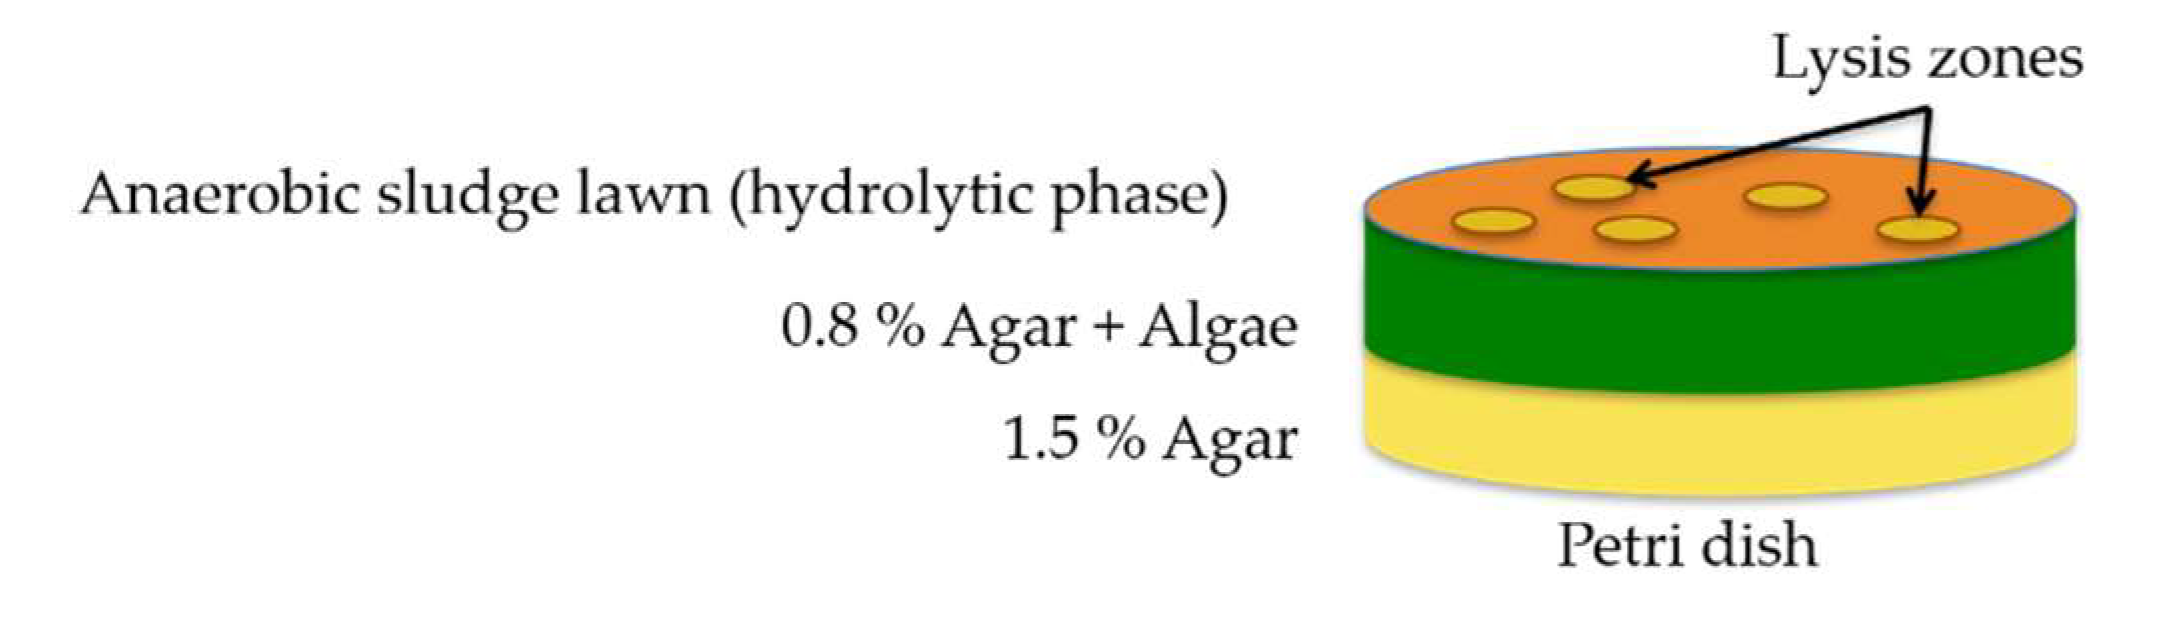
2.2. Qualitative and Quantitative Assessments of Algalytic Activity

Pure cultures of the UASB sludge isolates were tested on DLA plates and in liquid media with Chlorella vulgaris as a substrate. Liquid media cultures were micro-aerophilic and incubated at 35 ± 2 °C in the dark. These conditions were used to mimic the environment inside the anaerobic digester. Cultures of Chlorella vulgaris were grown at 25 °C in the Bolds Basal Media [19] in a growth chamber under continuous light (innova®42 incubator shaker series, New Brunswick Scientific, Edison, NJ, USA) at 120 RPM. Bacterial isolates were maintained in the TSB media at 35 ± 2 °C. Algalytic tests of bacteria in microalgal suspensions were conducted in 100 mL shaker flasks containing 50 mL of bacterial-algal cultures. Bacterial cultures were grown in TSB to the mid exponential phase, harvested by centrifugation, and washed with Bolds Basal Media (BBM) to ensure no transfer of nutrients. Re-suspended bacterial pellets in the BBM media were inoculated into the mid-exponential phase grown algae in BBM media. Final concentrations of bacteria (CFU/mL) and microalgae (whole cells/mL) were 7.5 × 10⁷ and 3 × 10⁶ respectively, in accordance with similar algalytic studies [20,21]. Microalgal cell counts were performed using a microscope and Neubauer counting chamber. Cultures of E.coli K12 strain were used as negative controls in the tests for algalytic activities. Microalgae-bacteria suspensions were incubated in the dark at 35 ± 2 °C and 120 rpm. Measurements of the optical density (OD) were taken every two to three days.
Quantitative analysis of the algalytic activity was conducted based on changes in the optical density of the bacteria-algae mix, measured at 600 and 750 nm, using a calibration method to distinguish between the algal and bacterial cells. The calibration method used to distinguish between algal and bacterial cells was based on the Beer-Lambert Law of Absorbance [22] and is provided in Appendix A.

2.3. Source of Inoculum and Substrate for Bioaugmetation

Algal biomass, collected from the surface of the trickling filter in the Central Valley Wastewater Treatment Facility (SLC, UT, USA), was used as a sole substrate for anaerobic digestion. The volatile solids (VS) of the biomass was 46 mg/g. The algal biofilm comprised of Stigeoclonium, Klebsormidium, Gloeotilopsis, and Nitzschia species. Anaerobic granulated sludge from the Upflow Anaerobic Sludge blanket reactor (UASB) treating paper mill wastewater (Eerbeek, The Netherlands) was used as a source of microbial inoculum. The granular inoculum had VS of 138 mg/g. Inoculum was anaerobically stored at +4 °C for a year prior to inoculations.
An algalytic mixture comprised of novel isolated Citrobacter spp., Alcaligenes spp., and Pseudomonas spp. in equal amounts and was added at 0.146 g/L (by volatile suspended solids) to the granular sludge.

2.4. Specific Methanogenic Activity (SMA) Test

SMA tests were used to determine the effect of bioaugmentation on the methane generation potential of the algal biomass [23,24]. Inoculum and substrate were mixed in 60 mL of anaerobic media in 120 mL serum vials in a N2:CO2 (4:1) atmosphere and placed into a shaking incubator (100 rpm) for the duration of the experiment (74 days) at 35 ± 2 °C. The anaerobic medium was prepared as previously described [25], except there was no carbon source added. The final pH of the medium was 7–7.5. Substrate (mixed algal biomass) loading was 9.6 gVSS/L and inoculum (granular mix) was 19 gVSS/L. Thus, the substrate to inoculum ratio was kept at 1:2. All combinations of granular sludge, algal biomass, and augmentation mixtures were prepared in triplicates. Gas production was measured with the syringe displacement method. The gas composition (with methane and carbon dioxide as the main components) was monitored once every week using an Agilent 7890B gas chromatograph (GC) with a thermal conductivity detector (TCD), a packed column (Gas Pro, Agilent, Santa Clara, CA, USA ) 60 m × 320 μm at 25 °C oven temperature, and helium as a carrier gas (constant pressure 20 psi).

2.5. Polymerase Chain Reaction (PCR) Analysis

At the end of the study (after 74 days), samples containing granular sludge were centrifuged to collect the granular sludge and were washed in phosphate buffered saline. The washing step was necessary to ensure subsequent analysis of only the granule-associated DNA, without DNA from an easily detached surface layer of microorganisms. Such an approach allowed for the investigation of the presence of newly incorporated augmenting bacteria associated with the granular consortia. Bacterial DNA from the washed granules was extracted with a PowerSoil® DNA Isolation Kit (MO BIO Laboratories, Inc., Carlsbad, CA, USA) and stored at −80 °C prior to PCR and sequencing analysis. PCR analysis for the presence of augmented bacteria associated with the granular sludge was conducted using a specific primer set for the Citrobacter freundii cfa gene [16], using the following protocol: initial denaturation for 1 min at 94 °C followed by 40 cycles comprising of (1) denaturation for 30 s at 94 °C, (2) annealing for 1 min at 59 °C, (3) extension for 1 min at 72 °C, and final extension for 1 min at 72 °C. The number of cycles was reduced to 30 if quantification was the purpose of PCR. Amplicons were purified using GeneJET Gel Extraction Kit (Thermo Fisher Scientific, Waltham, MA, USA) and quantified using spectrophotometer (Eppendorf, Hauppauge, NY, USA). For the quantitative purposes, the starting DNA template for PCR with the bacteria-specific primer set was diluted to the same concentration. DNA from a pure culture of the C.freundii sp. isolate 13 strain was used as a positive control for PCR and quantification purposes.

2.6. 16SrRNA Gene Sequencing and Analysis

Total DNA isolated from all the test vials was subjected to the 16SrDNA sequencing on MiSeq Illumina platform (Illumina, San Diego, CA, USA) by Macrogen (Seoul, Korea). Universal bacterial primers 519F-806R [26,27] were used to amplify the V3 and V4 16SrDNA region of the total DNA for sequencing library preparation, using the Herculase II Fusion DNA Plymerase Nextera XT Index Kit. The final purified product was then quantified using qPCR, according to the qPCR Quantification Protocol Guide (KAPA Library Quantificatoin kits for Illumina Sequecing platforms) and qualified using the LabChip GX HT DNA High Sensitivity Kit (PerkinElmer, Waltham, MA, USA). The paired-end (2 × 300 bp) sequencing was then performed.
Raw data from sequencing was initially processed through Scythe and Sickle [28,29] to remove adapter sequences. The data was then imported to and analyzed with QIIME 2 (2018.6 release), according to the tutorials provided by the QIIME developers [30,31]. The DADA2 pipeline [32] was used to filter low quality regions and identify/remove chimeras in the reads. Taxonomic analysis of the resulting reads was performed in the following steps: generate a multiple sequence alignment and remove highly variable positions, generate a phylogenetic tree of the sequences, and use a pre-trained Naive Bayes classifier on the SILVA-132-99 16S rRNA database [33] to obtain taxonomical placement of the operational taxonomic units (OTUs) (97% similarity).
Raw reads were subsequently deposited into the National Center for Biotechnology Information (NCBI) Sequence Read Archive (SRA) database under the SRA accession SUB4409767.

2.7. Statistical and Diversity Analysis

All algalytic activity tests were carried out in triplicate and error bars represent standard deviations. Statistical analyses for algalytic activity and biogas/methane generation data were conducted in the Statistical Analysis Software (SAS 9.04, SAS Institute Inc., Cary, NC, USA). Analysis of variance in PROC GLM (general linear models procedure) with residual diagnostics and post hoc mean comparisons was used to compare effects of the bacterial treatments on the microalgal population (confidence level of 95%). Pairwise comparisons of single treatments were conducted with a one-way ANOVA test in SAS. Analysis of the diversity (Shannon index) was conducted using a PAST (PAleontological STatistics) software package [34].

3. Results

3.1. Isolation, Identification, and Characterization of Algalytic Bacteria

3.1.1. Isolation and Identification

Anaerobic sludge that was used as a source of the enrichment culture formed colonies in the shape of craters on the double-layer-agar (DLA) plates with microalgae as a carbon source. The bacterial colonies grew into the depth of the soft upper layer of agar, which contained the microalgal biomass. Colonies, which were picked from the DLA plates, were transferred into the TSB or GH selective media and pure cultures were isolated by subsequent streaking on DLA plates. Pure cultures were microscopically inspected for purity and 16S rRNA genes were sequenced to allow precise classification. Identified isolates belonging to species of Pseudomonas, Alcaligenes, and Citrobater. The algalytic behavior of the isolated bacteria was then assessed qualitatively and quantitatively in BBM media with microalgal suspensions. Qualitative analysis was based on the color change of the microalgal suspension (from green to dark brown) and the most promising isolates were picked based on the most profound changes in the color of the microalgal suspension over two weeks.
The most promising potential algalytic behavior was demonstrated by the C.freundii sp. 13 isolate. This isolate was followed in activity by Pseudomonas spp., and Alcaligenes app. isolates. An in-depth analysis of C.freundii sp. 13 isolate was performed, as the most prolific algalytic bacterium identified in this experiment. C.freundii sp. 13 isolate was classified as a novel strain of Citrobacter freundii spp. based on the phylogeny of the conserved Citrobacter-specific cfa gene sequence [16]. The analysis showed a 96% similarity to the available sequences of the cyclopropane fatty acids synthase (cfa gene). Phylogenetic trees for the 16S rRNA gene fragment and cfa sequences are provided in Figure 2.

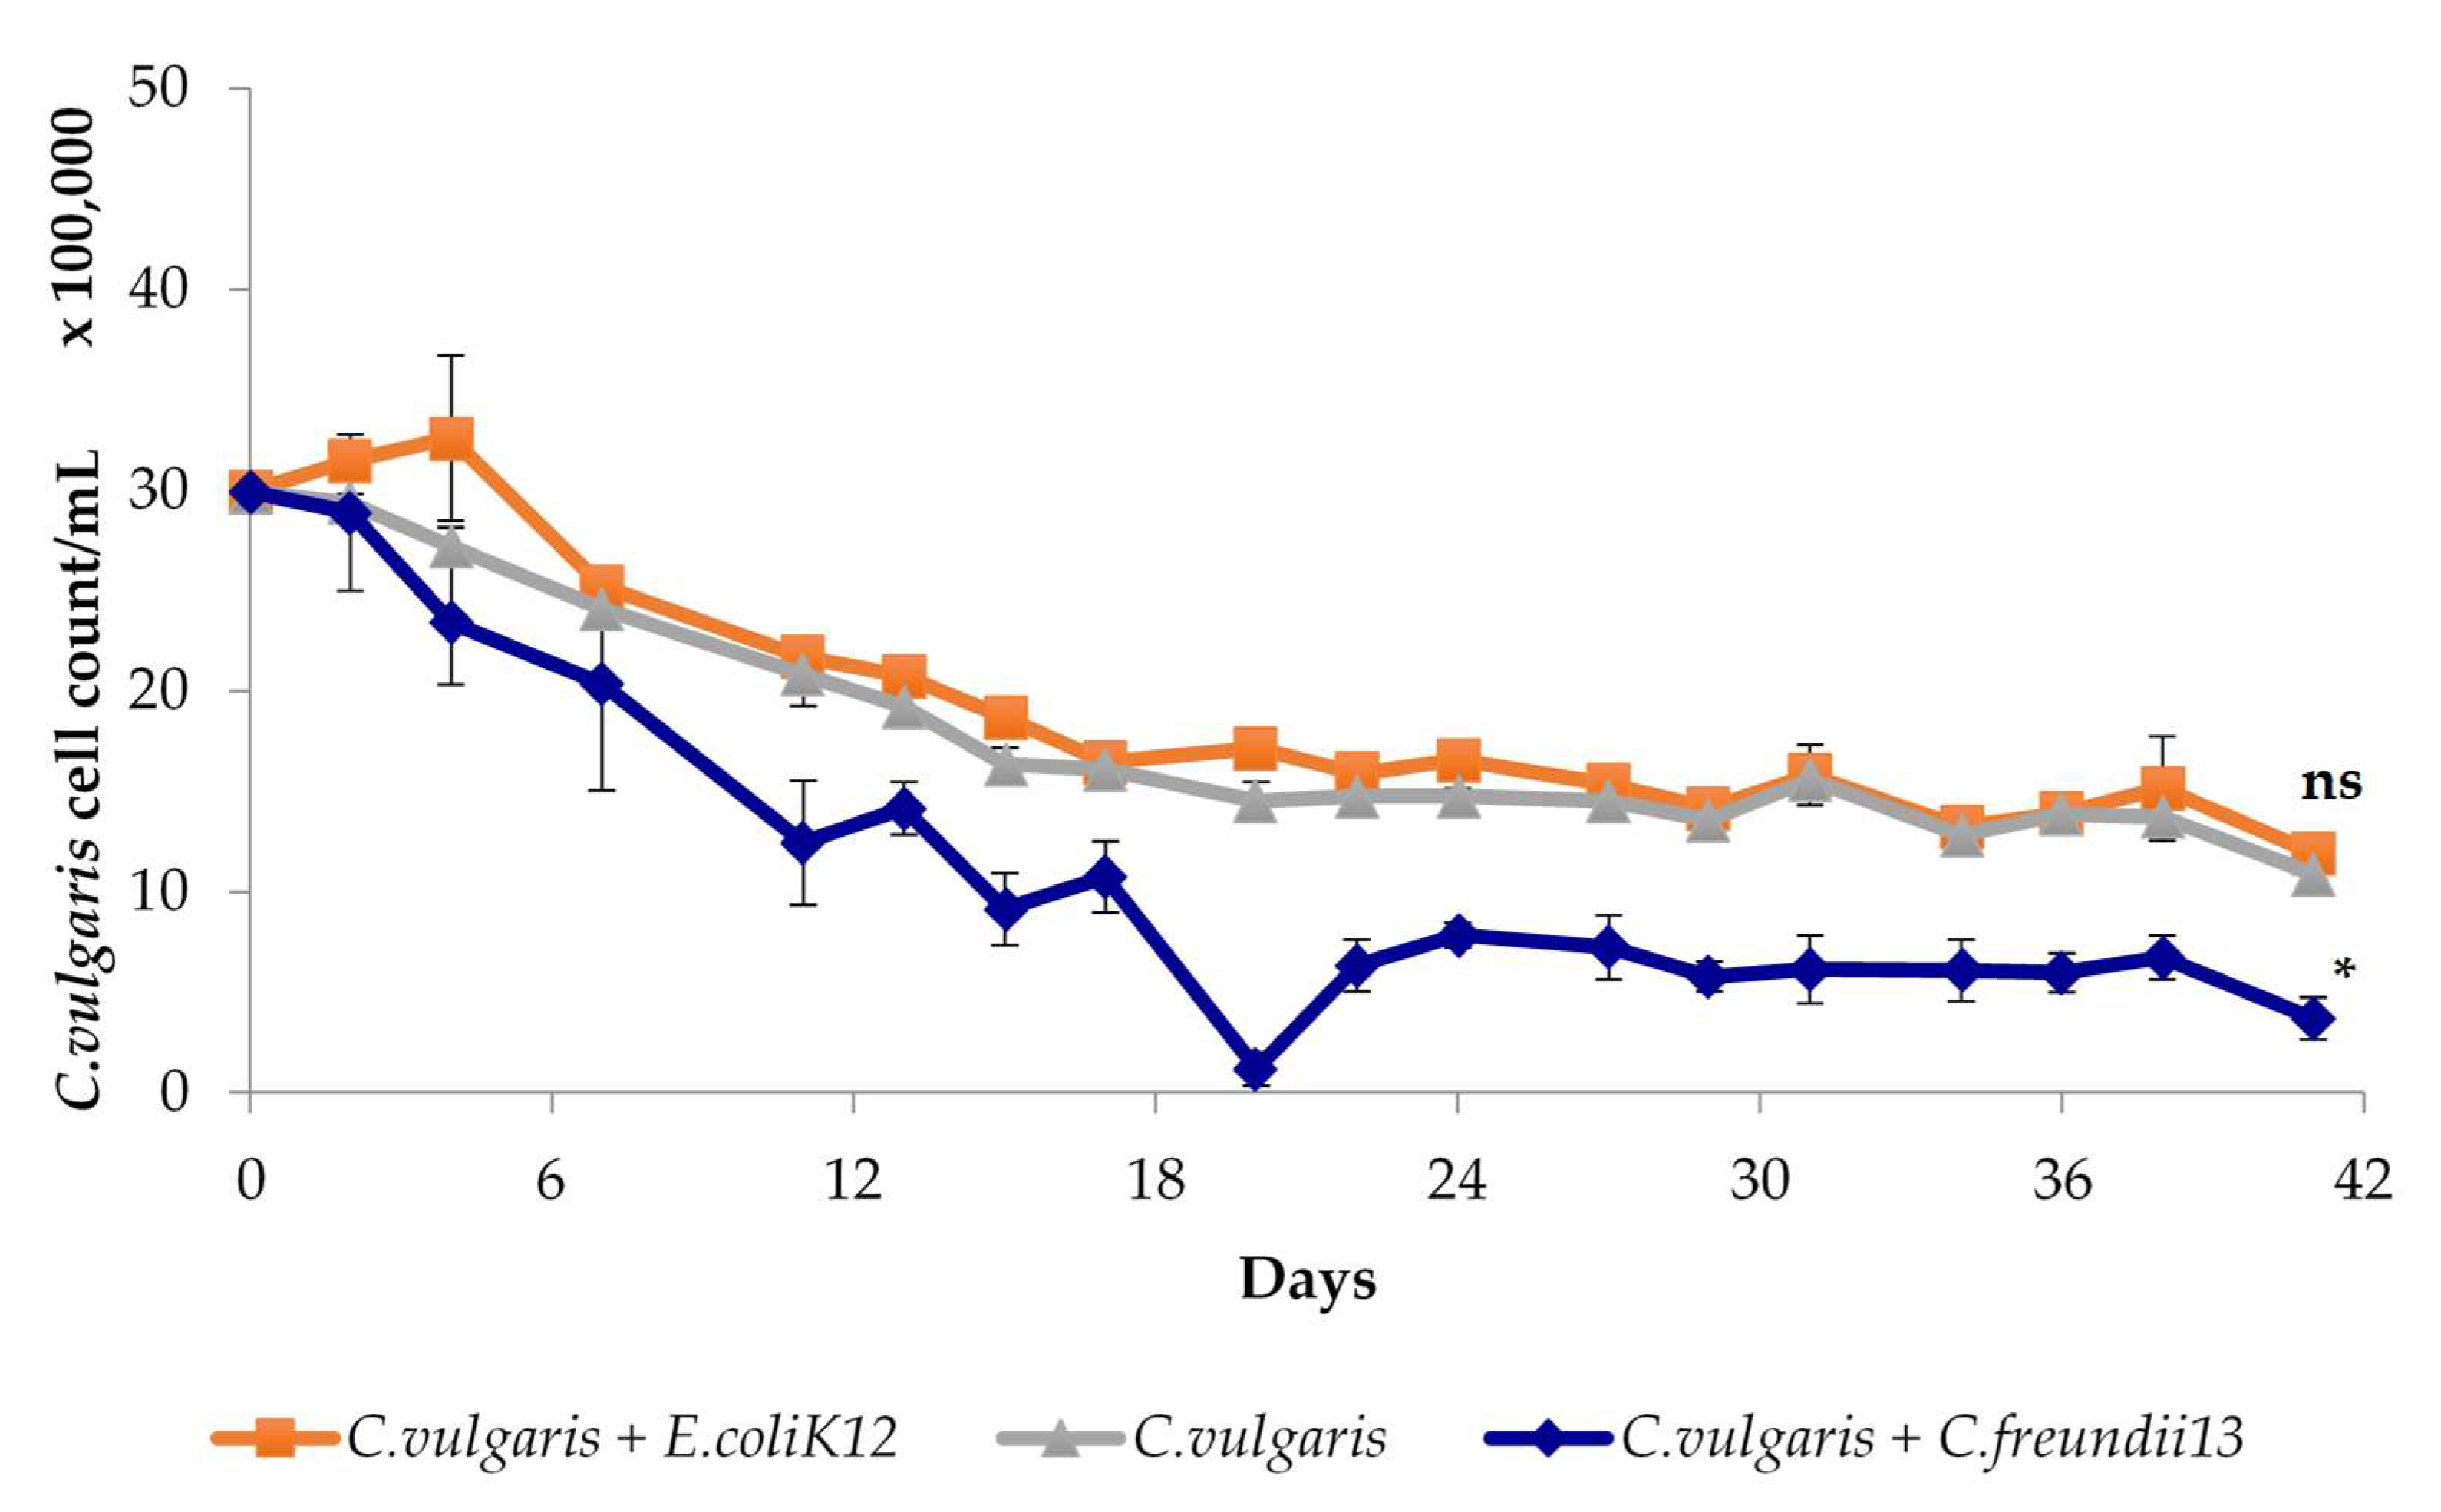
3.1.2. Characterization of Algalytic Activity

A wild type strain of E.coli K12 was chosen as a negative control in the quantitative assessment of the algalytic behavior. The results of the comparative influence of E.coli K12 and C.freundii sp. isolate 13 on the Chlorella vulgaris cell counts are depicted in Figure 3. Dynamic changes in both bacterial and microalgal cell counts during each bacteria incubation in the microalgal suspension are provided in Figure S1. Statistical analysis of the differences among microalgal cell counts under two bacterial influences showed a significant difference for the microalgae under the influence of the C.freundii sp. isolate 13 (p = 0.001).

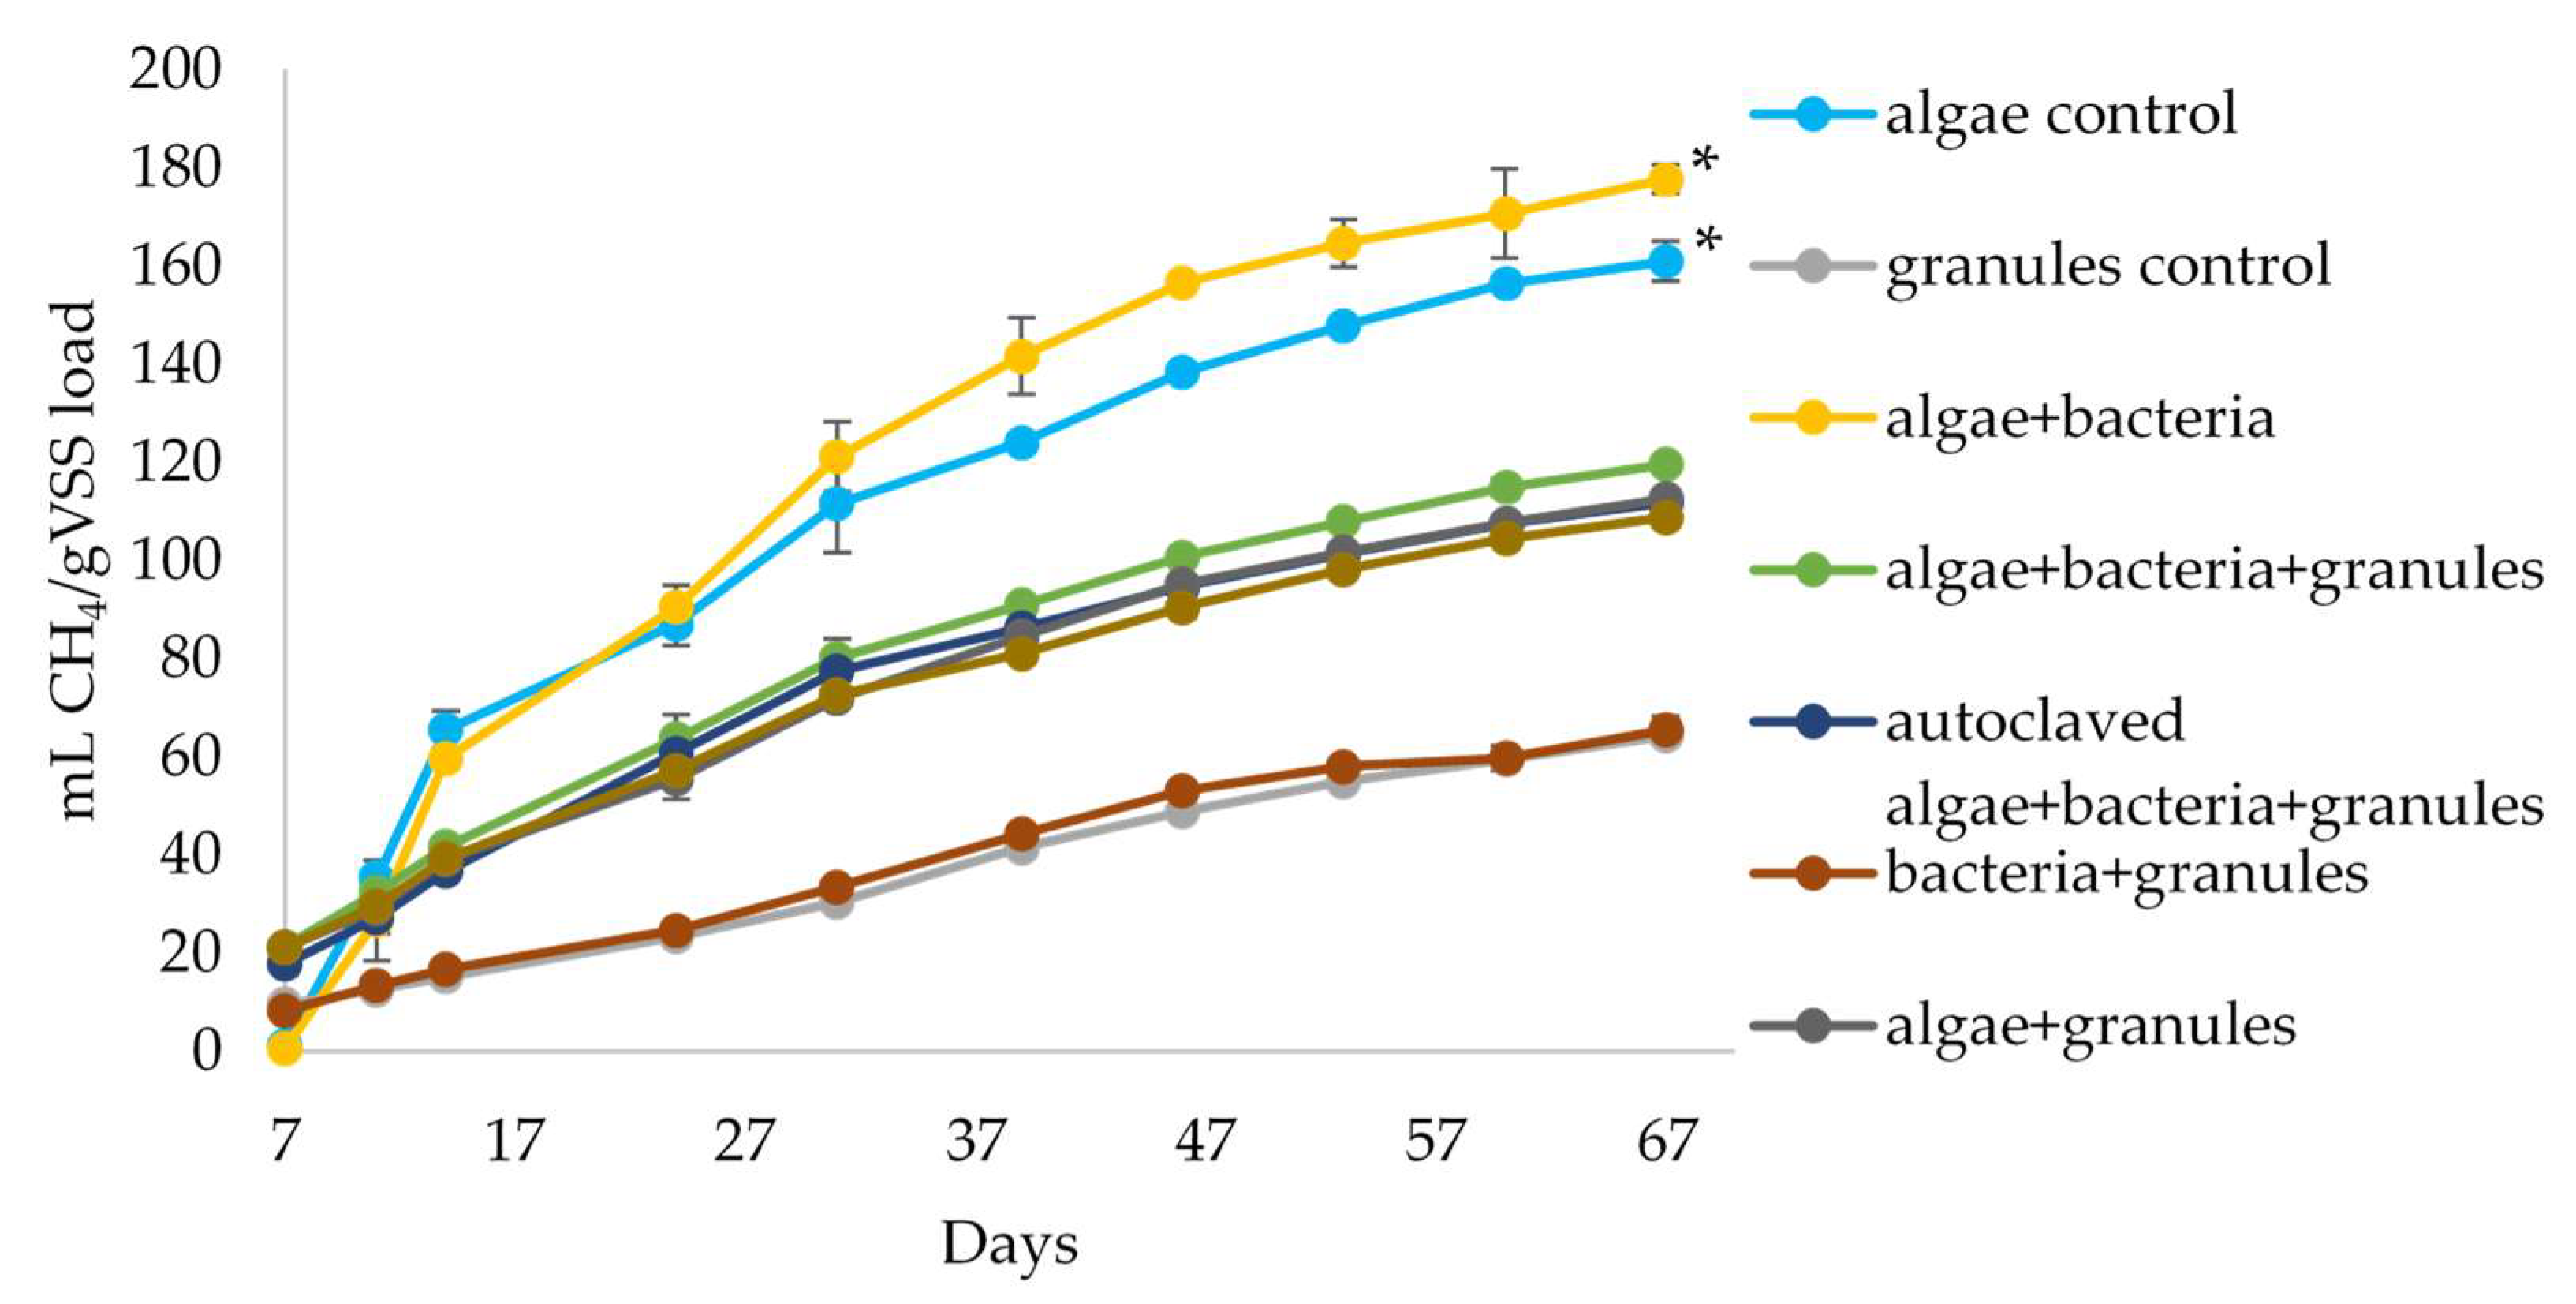
3.2. Anaerobic Digestion of Algal Biomass by Intact and Bioaugmeted Granular Sludge

Batch fermentations of a mixed algal biomass were successfully augmented with an algalytic bacterial mixture. Due to the potential presence of a mixed and methane-producing population of bacteria in the algal biofilm (substrate), an additional set of controls was tested, involving autoclaved algal biomass and its combination with granular sludge and the algalytic augmentation mixture. Specific methanogenic activity (SMA) of bioaugmented and non-augmented anaerobic granular sludge digesting algal biomass was assessed in this study. Figure 4 contains the SMA results (in mL CH4/g VSS load) over 74 days of anaerobic digestion in batch reactors.
Overall, augmentation of granular sludge (based on the VSS load) lead to an 11% increase in methane production on the algal biomass (when compared to the self-digestion of an algal-bacterial native mix) and a 6% increase in the digestion of algae with granular sludge.

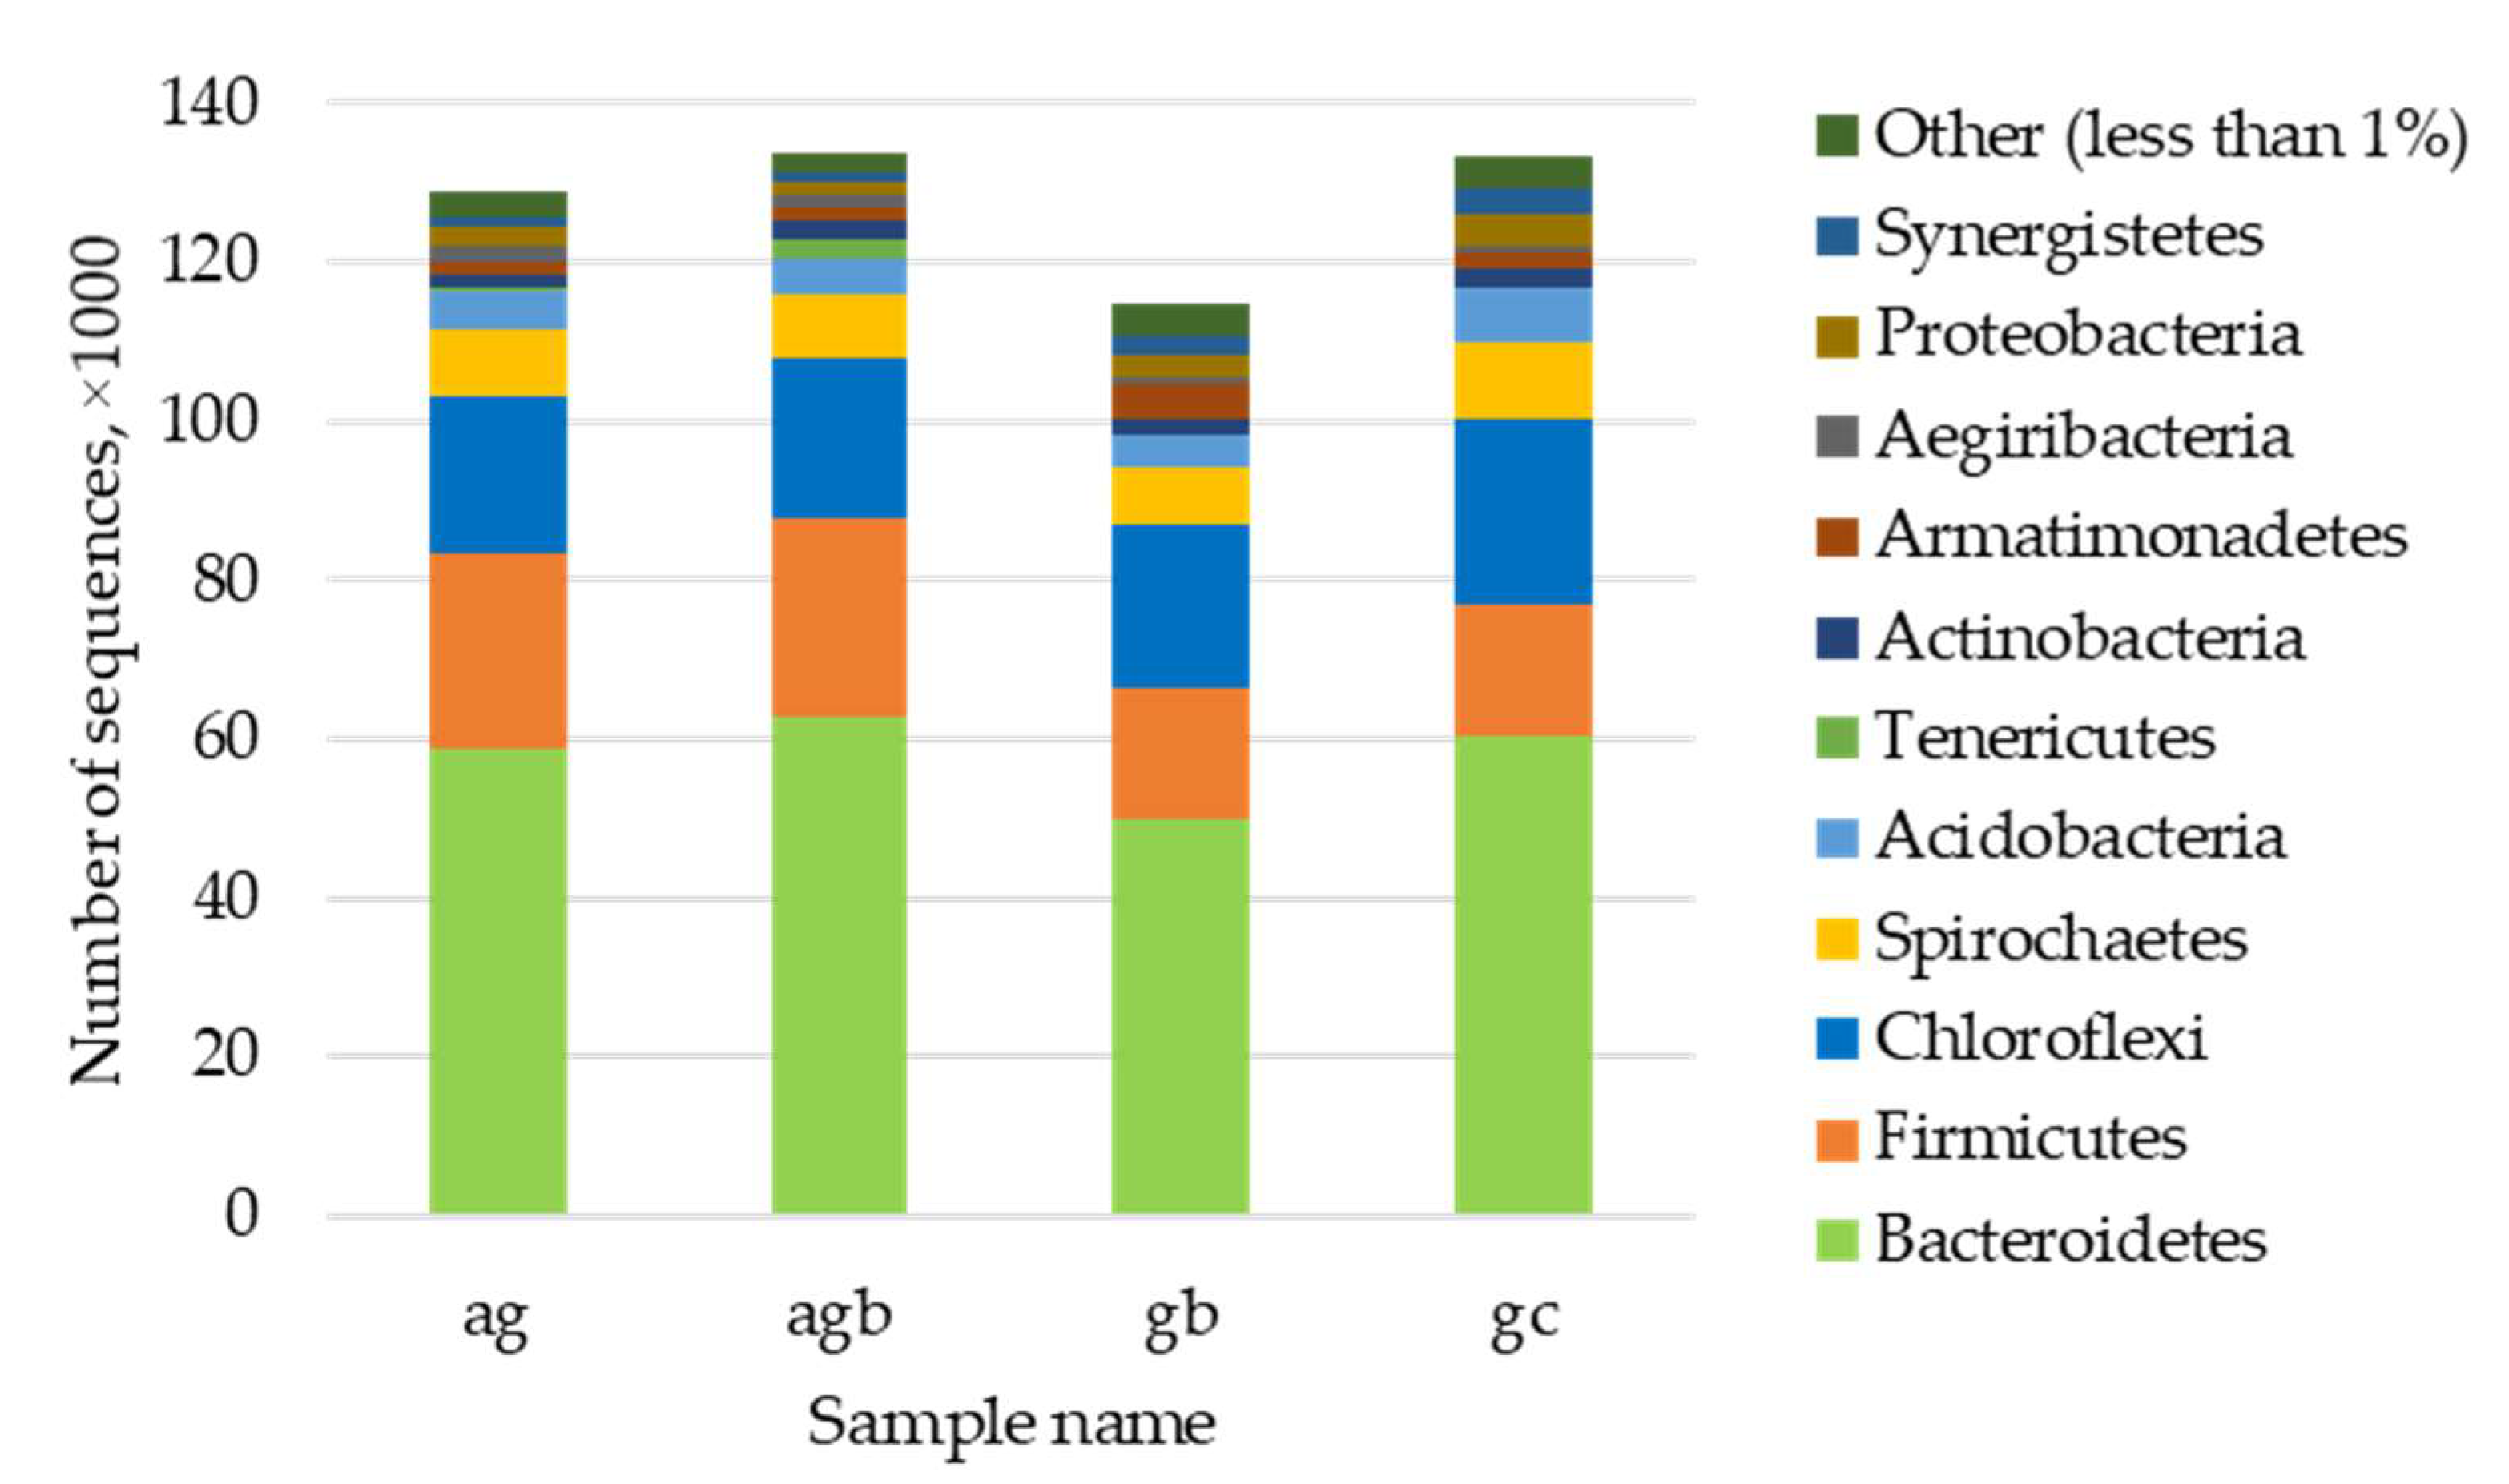
3.3. Assessment of the Presence and Influence of Algalytic Bacteria on the Anaerobic Digestion

Total extracted DNA at the end of the study was subject to PCR with cfa gene-specific primers to check for the incorporation of the most prolific member of the augmentation bacterial mixture, Citrobacter spp. The analysis shows a presence of algalytic bacterium (amplification of cfa gene) in all of the four sample combinations, at the end of the 74 days of anaerobic digestion (Figure 4). Quantification of the cfa-gene product after 30 cycles of PCR demonstrates an increased amount of Citrobacter spp. DNA in response to algal addition or augmentation, when compared to the initial native presence of Citrobacter spp. in the inoculum.
To understand if there were any changes on the microbial level due to the augmentation, DNA from samples “Granules control,” “Granules + Bacteria,” “Algae control,” and “Algae + Granules + Bacteria” were subjected to sequencing at the end of the study. Results of operational taxonomic units (OTUs) assignments and changes in the numbers of OTUs called for each sample are depicted in Figure 5.
The major distinguishing feature among sequenced 16SrRNA profiles is the reduction in the total number of OTUs in the “Granules + Bacteria” sample, when compared to the “Granules control” as well as an increase in the number of OTUs in the triple combo “Algae + Granules + Bacteria” when compared to “Algae + Granules.” However, an increase/decrease in the numbers of OTUs do not correlate with the increase/decrease in the diversity of the microbial community. The diversity values, calculated via the Shannon index, have a reverse relationship to the total number of the identified OTUs in the four distinct communities. Sample “Algae + Granules + Bacteria” has the lowest diversity among all of the samples (1.85), and “Granules control” (the starting source of inoculum) has the highest diversity (2.0).
The calculated Bray-Curtis index, as a quantitative measure of community dissimilarity, demonstrated significant differences in the taxonomic composition of samples with/without algae (Algae + Granules, Algae + Bacteria + Granules VS Granules, Control, and Granules + Bacteria) (Figure 6). The presence of the augmenting mixture of bacteria was a second differentiating factor (11% difference between algae-present and non-present groups) (Figure 6).
A distinct difference in the OTU composition lies in the increased number of Firmicutes in the algae-containing samples and decreased numbers of Proteobacteria and Synergistetes. OTUs assigned to Aegiribacteria are twice more abundant in the algae-containing samples. The biggest difference is a presence of Tenericutes-assigned OTUs in the sample, “Algae + Granules + Bacteria.” This taxonomic group is almost completely absent in the other three samples.

4. Discussion

4.1. Bioaugmentation of Granular Sludge Does not Require a UASB-Like System

The aim of this study was to isolate novel potential algalytic bacteria and investigate the possibility of augmenting anaerobic granular sludge with an algalytic bacteria mixture in batch conditions of fermenting algal biomass. An isolated bacterial mixture from local LCWL was analyzed both qualitatively and quantitatively for algalytic activity. An in-depth characterization of the C.freundii sp. isolate 13 revealed a significant negative effect of the novel isolate on the model algae, Chlorella vulgaris. A potential explanation for such behavior is bacteria inhibiting microalgal growth or lysing the microalgal cells. A mix of C.freundii sp. isolate 13 and two other promising LCWL algalytic isolates, Pseudomonas spp. and Alcaligenes spp., was further tested for its ability to enhance the methane-producing ability of granulated anaerobic sludge during anaerobic digestion of a mixed algal biomass.
Over the course of 74 days of anaerobic digestion, biogas production and composition were analyzed from small batch reactors, seeded with granular sludge, and augmented in an algalytic bacterial mixture and algal biomass as a source of carbon. The overall increase of 6%–11% in methane production was detected for the augmented mixtures. When comparing the augmentation approach to pre-treatment with other literature-reported methods (physical, chemical, and enzymatic), the resulting increase in methane production is most similar to the one obtained due to the ultrasound and mechanical pre-treatments (6%–30%) [10,35]. Potential explanation can be in the milder cell disruption caused by ultrasound and mechanical pre-treatments, when compared to more aggressive methods, such as thermal and enzymatic pre-treatments. Nevertheless, an observed increase in methane production (6%–11%) due to the augmentation supports the viability of the bioaugmentation approach for batch fermentations with granulated sludge as a source of inoculum. The results also support the incorporation of new microbial groups into an established granular consortium without need for an up flow supply of the feed (presence of the PCR product and amount in Figure S2). Previous studies suggested that augmentation of granular consortia is only possible if there is pressure from the up flow velocity of the feed coming into the Up Flow Anaerobic Sludge Blanket (UASB) reactor [3,36]. A UASB-like environment is essential for the initial formation of the granular structures, but subsequent modifications of the microbial consortia inside the granules can take place without up flow velocity of the feed supply. However, the UASB environment may enhance incorporation into granules. A possible explanation of the current study’s success attributed to incorporating hydrolytic bacteria. Algalytic bacteria initiate anaerobic digestion by potentially disrupting the cell walls of algal biomass or facilitate the lysis by the indigenous microbial community. Thus, algalytic bacteria should be incorporated into the outer layers of the granular sludge structures in order to have constant access to the algal substrate [37]. To address this assumption, it is beneficial to dissect the augmented granules and fluorescently label the trophic groups in order to investigate their location inside the granules [38].

4.2. Bioaugmenting Granular Sludge Community Leads to Its Specialization toward Algae Digestion

The results of the 16S rRNA sequencing and diversity analysis in Figure 5 demonstrate some significant changes in the microbial composition of an augmented granular sludge digesting algal biomass: first, a decreased diversity in “Algae + Granules + Bacteria” sample (Shannon index), potentially due to the specialization of metabolic activity toward digesting the algal substrate (Figure 6). Second, an increased number of microbial groups that play a role in polysaccharide, cellulose, and protein digestion. Those microbial groups are mostly representatives of Bacteroidetes (as are the bacteria from augmenting mix: Citrobacter spp., Alcaligenes spp., and Pseudomans spp.) and various members of Calditrichaeota and Actinobacteria phyla (Cellulomonas and Cellulosimicrobium). These bacteria have been shown to secrete cellulases, peptidases, and fibrolytic enzymes [39,40,41]. The number of Clostridiales representatives was significantly decreased in the augmented sample and were substituted by a number of other, less common cellulolytic bacteria. This may be due to the ability of the augmenting bacteria mixture to facilitate disruption of the algal cell walls by other hydrolytic bacteria with specialized enzymes, not commonly expressed in the populations dominated by Clostridia. However, some genera of Clostridiales, like Lutispora and Hydrogenispora, were more numerous in augmented samples. Representatives of these genera do not possess cellulolytic enzymatic machineries, but are good at utilizing diverse amino acids [42] and sugars [43]. Very good sources of amino acids in the current algae-digesting system are cellular proteins, available after the initial break-down of the algal biomass. Members of Calditrichaeota and Actinobacteria phyla can also be acting as secondary fermenters, after the initial lysis of the algal biomass was already performed by the augmenting bacterial mixture. A follow-up study will be to repeat the experiment but have granules withdrawn from the reactors at different time points throughout the digestion, to compare the microbial population at different stages of anaerobic digestion (hydrolysis, acidogenesis, and methanogenesis) [11].
The sample “Algae + Granules + Bacteria” had decreased amounts of Caldicoprobacter and Desulfovibrio, while “Granules + Bacteria” sample has increased numbers, compared to the “Granules control” (gc). Members of Caldicoprobacter can utilize various sugars and produce lactate, acetate, CO2, and H2 as the end products, while Desulfovibrio are perfect partners, consuming lactate and acetate [44,45]. An increase in these partners’ numbers in the “gb” sample can be due to the increased number of secondary metabolites in the system due to the addition of fermenting organisms in an augmenting mixture. Consequently, a decrease in the amounts of Caldicoprobacter and Desulfovibrio in the “Algae + Granules + Bacteria” sample can be attributed to the outcompeting numbers of the similarly functioning microbes, that are more efficient in the environment of increased amounts of secondary metabolites from algal biomass. For example, Lutispora and Syntrophobacter can perform similar metabolic functions as Caldicoprobacter and Desulfovibrio pair.
The most prominent change in the microbial community of the “Algae + Granules + Bacteria” sample was the presence in very high numbers of Tenericutes (1 OTU versus 2000 OTUs), when compared to the remaining samples. Specifically, members of the Mollicutes class, with the majority belonging to Haloplasmatales orders. Members of this order are reported to be common for the digestive tracts of mollusks feeding off algae [46] and various green algae phycospheres [47]. Thus, a possible explanation could be that DNA comes from the bacteria that were previously associated or parasitizing off the substrate algal biomass, or they contribute to the lysis of the algal cells, or both.
Overall, the results of the microbial community analysis strongly point out that augmenting bacteria leads to a re-routing of the carbon flow in algae digestion, when compared to the non-augmented digestion of the same substrate. For each group of anaerobic fermenters in the “Algae + Granules” sample, there is an alternative in the “Algae + Granules + Bacteria” sample including different exopeptidases producing bacteria, different sugar/amino acid degrading bacteria, and alternative consumers of volatile fatty acids.
In summary, this research demonstrated a successful augmentation of anaerobic digestion of microalgal biomass leading to the 11% increase in the methane recovery and a considerable shift in the microbial community inside the bioreactors. The augmentation approach of this study can be applied to enhance resource recovery from other recalcitrant bio-degradable feedstocks (ex. lignin-containing biomass). Additional microbiome manipulations can lead to further increases in the recovered methane and overall anaerobic digestion rates.

Supplementary Materials

The following are available online at https://www.mdpi.com/2311-5637/5/4/88/s1. Figure S1: Changes in the bacterial and microalgal cell counts over time, during incubation at 35 ± 2 °C in the dark. Figure S2: Gel electrophoresis of PCR-amplified cfa gene fragment of Citrobacter spp. in all the tested anaerobic digestion samples.

Author Contributions

Conceptualization, A.D. Methodology, A.D. and Y.P. Software, A.D. and M.H.C. Validation, A.D. and M.H.C. Formal analysis, A.D. and M.H.C. Investigation, A.D. and Y.P. Resources, R.C.S. and C.D.M. Data curation, A.D. Writing—original draft preparation, A.D. Writing—review and editing, C.D.M. and R.C.S. Visualization, A.D. Supervision, C.D.M. and R.C.S. Project administration, A.D. Funding acquisition, R.C.S. and C.D.M.

Funding

This research was supported by The US EPA (#SU839298), USU Department of Biological Engineering, the Huntsman Environmental Research Center, the Sustainable Waste-to-Bioproducts Center and the Utah Science Technology and Research Initiative, and the Industry University Partnership program supported this research.

Conflicts of Interest

The authors declare no conflict of interest.

Appendix A

Below is a derivation of calibration method used to distinguish between algal and bacterial cells. The method is based on the Beer-Lambert Law of Absorbance [22].
A = A 0 × l × C ,
where A 0 is the specific absorptivity coefficient, which depends on the light wavelength, l is the length of light path, which is a characteristic of the cuvette, and C is the concentration of an analyte.
Assuming light absorbance by bacteria and algae are independent, total absorbance of two wavelengths of light by a mixed community of algal and bacterial cells is modeled by the equations below.
{ O D 600 = A B λ 600 × x B + A A λ 600 × x A O D 750 = A B λ 750 × x B + A A λ 750 × x A ,
where O D 600 is the value of absorbance at the 600 nm setting, O D 750 is the value of absorbance at the 750 nm setting, AB600) is the specific optical density of bacteria at λ600 in BBM, AB750) is the specific optical density of bacteria at λ750 in BBM, AA600) is the specific optical density of algae at λ600 in BBM, AA750) is the specific optical density of algae at λ750 in BBM, x A is the cell number of algae, and x B is the cell number of bacteria.
To get the highest precision, two separate calibrations were performed for pure bacterial cultures in the ranges 106–109 CFU/mL and 109–1011 CFU/mL. Pure algal cultures were calibrated in the range 104–107 cells/mL.

References

  1. Hajji, K.T.; Lepine, F.; Bisaillon, J.G.; Beaudet, R.; Hawari, J.; Guiot, S.R. Effects of bioaugmentation strategies in UASB reactors with a methanogenic consortium for removal of phenolic compounds. Biotechnol. Bioeng. 2000, 67, 417–423. [Google Scholar] [CrossRef]
  2. Cater, M.; Fanedl, L.; Malovrh, S.; Logar, R.M. Biogas production from brewery spent grain enhanced by bioaugmentation with hydrolytic anaerobic bacteria. Bioresour. Technol. 2015, 186, 261–269. [Google Scholar] [CrossRef] [PubMed]
  3. Horber, C.; Christiansen, N.; Arvin, E.; Ahring, B.K. Improved dechlorinating performance of upflow anaerobic sludge blanket reactors by incorporation of Dehalospirillum multivorans into granular sludge. Appl. Environ. Microbol. 1998, 64, 1860–1863. [Google Scholar]
  4. Fotidis, I.A.; Karakashev, D.; Angelidaki, I. Bioaugmentation with an acetate-oxidising consortium as a tool to tackle ammonia inhibition of anaerobic digestion. Bioresour. Technol. 2013, 146, 57–62. [Google Scholar] [CrossRef] [PubMed] [Green Version]
  5. Bagi, Z.; Acs, N.; Balint, B.; Horvath, L.; Dobo, K.; Perei, K.R.; Rakhely, G.; Kovacs, K.L. Biotechnological intensification of biogas production. Appl. Microbiol. Biotechnol. 2007, 76, 473–482. [Google Scholar] [CrossRef]
  6. Wei, S.Z. The application of biotechnology on the enhancing of biogas production from lignocellulosic waste. Appl. Microbiol. Biotechnol. 2016, 100, 9821–9836. [Google Scholar] [CrossRef]
  7. Yang, Z.M.; Guo, R.B.; Xu, X.H.; Wang, L.; Dai, M. Enhanced methane production via repeated batch bioaugmentation pattern of enriched microbial consortia. Bioresour. Technol. 2016, 216, 471–477. [Google Scholar] [CrossRef]
  8. Debowski, M.; Zielinski, M.; Grala, A.; Dudek, M. Algae biomass as an alternative substrate in biogas production technologies—Review. Renew. Sustain. Energy Rev. 2013, 27, 596–604. [Google Scholar] [CrossRef]
  9. Ramos-Suarez, J.L.; Carreras, N. Use of microalgae residues for biogas production. Chem. Eng. J. 2014, 242, 86–95. [Google Scholar] [CrossRef]
  10. Montingelli, M.E.; Tedesco, S.; Olabi, A.G. Biogas production from algal biomass: A review. Renew. Sustain. Energy Rev. 2015, 43, 961–972. [Google Scholar] [CrossRef] [Green Version]
  11. Doloman, A.; Soboh, Y.; Walters, A.J.; Sims, R.C.; Miller, C.D. Qualitative Analysis of Microbial Dynamics during Anaerobic Digestion of Microalgal Biomass in a UASB Reactor. Int. J. Microbiol. 2017, 2017, 5291283. [Google Scholar] [CrossRef] [PubMed]
  12. Soboh, Y.M.; Sorensen, D.L.; Sims, R.C. Upflow Anaerobic Sludge Blanket Reactor Codigestion of Algae and Acetate to Produce Methane. Water Environ. Res. 2016, 88, 2094–2103. [Google Scholar] [CrossRef] [PubMed]
  13. Sakata, T.; Yasumoto, H. Colony Formation by Algicidal Saprospira Sp on Marine Agar Plates. Nippon Suisan Gakk 1991, 57, 2139–2143. [Google Scholar] [CrossRef]
  14. Krueger, C.L.; Sheikh, W. A New Selective Medium for Isolating Pseudomonas Spp from Water. Appl. Environ. Microbol. 1987, 53, 895–897. [Google Scholar]
  15. De Lipthay, J.R.; Johnsen, K.; Albrechtsen, H.-J.; Rosenberg, P.; Aamand, J. Bacterial diversity and community structure of a sub-surface aquifer exposed to realistic low herbicide concentrations. FEMS Microbiol. Ecol. 2004, 49, 59–69. [Google Scholar] [CrossRef] [PubMed]
  16. Kaclikova, E.; Krascsenicsova, K.; Pangallo, D.; Kuchta, T. Detection and quantification of Citrobacter freundii and C. braakii by 5’-nuclease polymerase chain reaction. Curr. Microbiol. 2005, 51, 229–232. [Google Scholar] [CrossRef] [PubMed]
  17. Kumar, S.; Stecher, G.; Li, M.; Knyaz, C.; Tamura, K. MEGA X: Molecular Evolutionary Genetics Analysis across Computing Platforms. Mol. Biol. Evol. 2018, 35, 1547–1549. [Google Scholar] [CrossRef] [PubMed]
  18. Tamura, K.; Nei, M. Estimation of the number of nucleotide substitutions in the control region of mitochondrial DNA in humans and chimpanzees. Mol. Biol. Evol. 1993, 10, 512–526. [Google Scholar] [CrossRef] [PubMed]
  19. Van Etten, J.L.; Meints, R.H.; Kuczmarski, D.; Burbank, D.E.; Lee, K. Viruses of symbiotic Chlorella-like algae isolated from Paramecium bursaria and Hydra viridis. Proc. Natl. Acad. Sci. USA 1982, 79, 3867–3871. [Google Scholar] [CrossRef] [PubMed]
  20. Chung, D.; Cha, M.; Guss, A.M.; Westpheling, J. Direct conversion of plant biomass to ethanol by engineered Caldicellulosiruptor bescii. Proc. Natl. Acad. Sci. USA 2014, 111, 8931–8936. [Google Scholar] [CrossRef]
  21. Jung, S.W.; Kim, B.H.; Katano, T.; Kong, D.S.; Han, M.S. Pseudomonas fluorescens HYK0210-SK09 offers species-specific biological control of winter algal blooms caused by freshwater diatom Stephanodiscus hantzschii. J. Appl. Microbiol. 2008, 105, 186–195. [Google Scholar] [CrossRef] [PubMed]
  22. Upadhyay, S.K. Chemical Kinetics and Reaction Dynamics; Springer: Dordrecht, The Netherlands, 2006. [Google Scholar] [CrossRef]
  23. Nopharatana, A.; Clarke, W.P.; Pullammanappallil, P.C.; Silvey, P.; Chynoweth, D.P. Evaluation of methanogenic activities during anaerobic digestion of municipal solid waste. Bioresour. Technol. 1998, 64, 169–174. [Google Scholar] [CrossRef]
  24. Ince, O.; Ince, B.K.; Yenigun, O. Determination of potential methane production capacity of a granular sludge from a pilot-scale upflow anaerobic sludge blanket reactor using a specific methanogenic activity test. J. Chem. Technol. Biotechnol. 2001, 76, 573–578. [Google Scholar] [CrossRef]
  25. Wolfe, R.S. Techniques for cultivating methanogens. Methods Enzymol. 2011, 494, 1–22. [Google Scholar] [CrossRef]
  26. Huws, S.A.; Edwards, J.E.; Kim, E.J.; Scollan, N.D. Specificity and sensitivity of eubacterial primers utilized for molecular profiling of bacteria within complex microbial ecosystems. J. Microbiol. Methods 2007, 70, 565–569. [Google Scholar] [CrossRef] [PubMed]
  27. Baker, G.C.; Smith, J.J.; Cowan, D.A. Review and re-analysis of domain-specific 16S primers. J. Microbiol. Methods 2003, 55, 541–555. [Google Scholar] [CrossRef] [Green Version]
  28. Joshi, N.A.; Fass, J.N. Sickle: A Sliding-Window, Adaptive, Quality-Based Trimming Tool for FastQ files; Version 1.33; Software; GitHub: San Francisco, CA, USA, 2011. [Google Scholar]
  29. Buffalo, V. Scythe—A Bayesian Adapter Trimmer; Software; GitHub: San Francisco, CA, USA, 2014. [Google Scholar]
  30. Caporaso, J.G.; Kuczynski, J.; Stombaugh, J.; Bittinger, K.; Bushman, F.D.; Costello, E.K.; Fierer, N.; Pena, A.G.; Goodrich, J.K.; Gordon, J.I.; et al. QIIME allows analysis of high-throughput community sequencing data. Nat. Methods 2010, 7, 335–336. [Google Scholar] [CrossRef] [Green Version]
  31. QIIME2. Quantitative Insights into Microbial Ecology. Available online: https://qiime2.org (accessed on 1 September 2018).
  32. Callahan, B.J.; McMurdie, P.J.; Rosen, M.J.; Han, A.W.; Johnson, A.J.; Holmes, S.P. DADA2: High-resolution sample inference from Illumina amplicon data. Nat. Methods 2016, 13, 581–583. [Google Scholar] [CrossRef] [Green Version]
  33. Quast, C.; Pruesse, E.; Yilmaz, P.; Gerken, J.; Schweer, T.; Yarza, P.; Peplies, J.; Glockner, F.O. The SILVA ribosomal RNA gene database project: Improved data processing and web-based tools. Nucleic Acids Res. 2013, 41, D590–D596. [Google Scholar] [CrossRef]
  34. Hammer, Ø.; Harper, D.A.T.; Ryan, P.D. PAST: Paleontological statistics software package for education and data analysis. Palaeontol. Electron. 2001, 4, 9. [Google Scholar]
  35. Passos, F.; Uggetti, E.; Carrère, H.; Ferrer, I. Pretreatment of microalgae to improve biogas production: A review. Bioresour. Technol. 2014, 172, 403–412. [Google Scholar] [CrossRef] [PubMed]
  36. Tiwari, M.K.; Guha, S.; Harendranath, C.S.; Tripathi, S. Influence of extrinsic factors on granulation in UASB reactor. Appl. Microbiol. Biotechnol. 2006, 71, 145–154. [Google Scholar] [CrossRef] [PubMed]
  37. Tartakovsky, B.; Guiot, S.R. Modeling and analysis of layered stationary anaerobic granular biofilms. Biotechnol. Bioeng. 1997, 54, 122–130. [Google Scholar] [CrossRef]
  38. Sekiguchi, Y.; Kamagata, Y.; Nakamura, K.; Ohashi, A.; Harada, H. Fluorescence in situ hybridization using 16S rRNA-targeted oligonucleotides reveals localization of methanogens and selected uncultured bacteria in mesophilic and thermophilic sludge granules. Appl. Environ. Microbol. 1999, 65, 1280–1288. [Google Scholar]
  39. Opazo, R.; Ortuzar, F.; Navarrete, P.; Espejo, R.; Romero, J. Reduction of Soybean Meal Non-Starch Polysaccharides and alpha-Galactosides by Solid-State Fermentation Using Cellulolytic Bacteria Obtained from Different Environments. PLoS ONE 2012, 7, e0044783. [Google Scholar] [CrossRef] [PubMed]
  40. Weiss, S.; Somitsch, W.; Klymiuk, I.; Trajanoski, S.; Guebitz, G.M. Comparison of biogas sludge and raw crop material as source of hydrolytic cultures for anaerobic digestion. Bioresour. Technol. 2016, 207, 244–251. [Google Scholar] [CrossRef]
  41. Yin, L.J.; Jiang, S.T.; Pon, S.H.; Lin, H.H. Hydrolysis of Chlorella by Cellulomonas sp YJ5 Cellulases and Its Biofunctional Properties. J. Food Sci. 2010, 75, H317–H323. [Google Scholar] [CrossRef]
  42. Shiratori, H.; Ohiwa, H.; Ikeno, H.; Ayame, S.; Kataoka, N.; Miya, A.; Beppu, T.; Ueda, K. Lutispora thermophila gen. nov., sp nov., a thermophilic, spore-forming bacterium isolated from a thermophilic methanogenic bioreactor digesting municipal solid wastes. Int. J. Syst. Evol. Microbiol. 2008, 58, 964–969. [Google Scholar] [CrossRef]
  43. Liu, Y.; Qiao, J.T.; Yuan, X.Z.; Guo, R.B.; Qiu, Y.L. Hydrogenispora ethanolica gen. nov., sp nov., an anaerobic carbohydrate-fermenting bacterium from anaerobic sludge. Int. J. Syst. Evol. Microbiol. 2014, 64, 1756–1762. [Google Scholar] [CrossRef]
  44. Traore, A.S.; Hatchikian, C.E.; Le Gall, J.; Belaich, J.P. Microcalorimetric studies of the growth of sulfate-reducing bacteria: Comparison of the growth parameters of some Desulfovibrio species. J. Bacteriol. 1982, 149, 606–611. [Google Scholar]
  45. Bouanane-Darenfed, A.; Ben Hania, W.; Hacene, H.; Cayol, J.L.; Ollivier, B.; Fardeau, M.L. Caldicoprobacter guelmensis sp. nov., a thermophilic, anaerobic, xylanolytic bacterium isolated from a hot spring. Int. J. Syst. Evol. Microbiol. 2013, 63, 2049–2053. [Google Scholar] [CrossRef] [PubMed]
  46. Gobet, A.; Mest, L.; Perennou, M.; Dittami, S.M.; Caralp, C.; Coulombet, C.; Huchette, S.; Roussel, S.; Michel, G.; Leblanc, C. Seasonal and algal diet-driven patterns of the digestive microbiota of the European abalone Haliotis tuberculata, a generalist marine herbivore. Microbiome 2018, 6, 60. [Google Scholar] [CrossRef] [PubMed]
  47. Antunes, A. The Family Haloplasmataceae. In The Prokaryotes, 4th ed.; Rosenberg, E., DeLong, E.F., Lory, S., Stackebrandt, E., Thompson, F., Eds.; Springer: Berlin/Heidelberg, Germany, 2013. [Google Scholar]
Figure 1. A double-layer-agar (DLA) technique to isolate algalytic microorganisms.
Fermentation 05 00088 g001
Figure 2. Phylogenetic trees of clustering (a) 16S rRNA gene fragment (200bp) among Citrobacter spp., and (b) cfa gene sequences (100 bp) from the Citrobacter freundii strains.
Fermentation 05 00088 g002
Figure 3. Influence of E.coli K12 and C.freundii sp. isolate 13 on microalgae C. vulgaris cell counts in the BBM media after 40 days of microaerophilic incubation without light. Error bars represent standard deviation. An asterisk notation (*) indicate a statistically significant difference of the whole 40-day dataset, compared to the control algae dataset (grey), while (ns) notation point to the non-statistically significant difference between a dataset and a control algal dataset. See text for more details.
Fermentation 05 00088 g003
Figure 4. Cumulative specific methanogenic activity of augmented and non-augmented granular inoculum samples. Error bars represent standard deviations among triplicates. Datasets marked with asterisk (*) indicate statistically significant differences between the sets (p < 0.0002).
Fermentation 05 00088 g004
Figure 5. Distribution of classified OTUs from 16SrDNA sequencing. Sample notations stand for: (ag) “Algae + Granules,” (agb) “Algae + Granules + Bacteria,” (gb) “Granules + Bacteria,” (gc) and “Granules control.”
Fermentation 05 00088 g005
Figure 6. Bray-Curtis distances, calculated as a quantitative measure of community dissimilarity for the four samples. Labels represent: (ag) Algae + Granules, (gc) Granules Control, (agb) Algae + Bacteria + Granules, (gb) Granules + Bacteria.
Fermentation 05 00088 g006

