Article

Effects of the Starch Molecular Structures in Barley Malts and Rice Adjuncts on Brewing Performance

1
Joint International Research Laboratory of Agriculture and Agri-Product Safety of Ministry of Education of China, Yangzhou University, Yangzhou 225009, Jiangsu Province, China
2
Centre for Nutrition and Food Science, Queensland Alliance for Agriculture and Food Innovation, The University of Queensland, St Lucia, Queensland, 4072 Australia
3
Co-Innovation Centre for Modern Production Technology of Grain Crops, Yangzhou University, Yangzhou 225009, China
*
Author to whom correspondence should be addressed.
Fermentation 2018, 4(4), 103; https://doi.org/10.3390/fermentation4040103
Submission received: 11 November 2018 / Revised: 30 November 2018 / Accepted: 13 December 2018 / Published: 16 December 2018
(This article belongs to the Special Issue Bioprocess and Fermentation Monitoring)

Abstract

:
Background: Achieving optimal fermentation is challenging when the variation within malt starch structure and enzyme activities are not part of the standard malting specifications. This study explores how the variation of starch and starch amylolytic enzymes in both malts and rice adjuncts affect the mashing and the subsequent yeast fermentation in the laboratory-scale production of beer. Results: The addition of rice adjuncts significantly increased the maltose content whilst reducing the glucose content during mashing. The maltotriose content, released during mashing, was significantly negatively correlated with the total amylose content (r = −0.64, p < 0.05), and significantly negatively correlated with the number of amylopectin longer chains (degree of polymerization 37–100) (r = −0.75, p < 0.01). During fermentation, while the content of maltotriose significantly and positively correlated with both the rate and amount of ethanol production (r = 0.70, p < 0.05; r = 0.70, p < 0.05, respectively), the content of soluble nitrogen in the wort was significantly and positively correlated with both the rate and the amount of ethanol production (r = 0.63, p< 0.05; r = 0.62, p < 0.05, respectively). The amount of amylopectin with longer chains was; however, significantly negatively correlated with the ethanol production (r = −0.06, p < 0.05). Small variations among the ethanol concentration and the rate of ethanol production during fermentation were found with the addition of different rice varieties. Conclusions: The effects of the rice adjuncts on the performance of fermentation depends on the properties of the malt, including the protein modification and malt enzyme activities. This study provides data to improve standard malt specifications in order for brewers to acquire more efficient fermentation, and includes useful molecular structural characterisation.

1. Introduction

Fermentation for alcohol production is a natural conversion of simple carbon sources, such as sugars and amino acids, by yeast [1,2]. A consequence of yeast growing and asexual reproduction is the production of CO2 and ethanol. In the context of beer brewing, studies have reported on fermentation efficiency through the examination of free amino acids that are produced during malting and mashing [3,4], and by monitoring the utilisation of individual amino acids, by yeast, during fermentation to produce beer [5,6]. Further, several studies have shown the importance of malt diastase enzymes in producing fermentable sugars from malt, as well as malt and solid adjuncts [7,8,9,10,11,12]. However, none of the latter studies investigated the main substrate responsible for the fermentation: starch. One recent study examined the variation of starch structures between malts (and rice adjuncts), and also the starch-degrading enzymes and the resultant fermentable sugars [13]. However, no studies have considered any variations in starch quality, its role in the production of fermentable sugars and its fermentation efficiency. Except for the effects of starch structure, other factors are also involved in altering the release of fermentable sugars. For example, the protein content and the activities of amylolytic enzymes within the barley samples used can affect the release of fermentable sugars during mashing.
Starch in barley, like most cereals, is the most abundant component within the grain, but the amount and composition varies depending upon grain type, as well as variety, and the environment the crop was grown in [14,15,16,17]. Starch is a complex branched glucose polymer that is comprised of amylose, which is of moderate molecular weight and contains a relatively small number of long-chain branches, and amylopectin, which is of much higher molecular weight and has a very large number of short-chain branches.
Mashing is the first stage in brewing, whereby the malt is mixed with hot water (at approximately 65 °C), which is about the temperature at which solubilised starch undergoes significant enzyme hydrolysis, resulting in fermentable sugars [18,19]. For efficient mashing, a synergistic relationship between starch gelatinization and starch hydrolysis enzymes aids the optimal production of fermentable sugars. If the starch is quickly gelatinised, then the starch-degrading enzymes can quickly hydrolyse starch into the main fermentable sugar: maltose. However, if the gelatinisation of starch is above mashing temperature, a reduction in the enzymatic hydrolysis of starch would result and; therefore, the fermentable sugar profile will be changed (i.e., less maltose and more non-fermentable sugars). To date, some studies have explored the impact of gelatinisation on fermentable sugars [20,21], but these did not include any measurement of the starch structure of the cereals or malt used.
Not only does the amount of starch vary but also the amounts and structures of the amylose and amylopectin molecules [22,23]. The variation in starch structure includes the average molecular sizes of fully-branched amylose and amylopectin molecules [24], and the chain length distributions (CLDs) of enzymatically-debranched amylopectin and amylose molecules [25,26] You & Izydorczyk, 2002 (the CLD gives the degree of branching of starch molecules, among other things). Though barley is the common cereal used in brewing, other major cereals (e.g., wheat, maize and rice) can be used in combination with barley malt to add additional fermentable sugars and/or flavour [27].
The effects of varying the molecular weight of barley malt and solid adjuncts show differences in the number of limit-dextrins (small-branched non-fermentable oligosaccharides) remaining in the wort, and in their impacts on the beer flavour [28,29]. More recently, the amylose content of barley malt was reported to be significantly and negatively correlated with the fermentable sugar content after mashing [30]. It is; therefore, highly likely that there are starch structural effects on the gelatinisation characteristics of barley malt, thereby changing the release of fermentable sugars. In our recent study, ten samples with varied starch structural parameters and different protein contents were used [30], but, in general, the effects of starch molecular structures have usually been underestimated and/or overestimated because of the existence of other factors, such as the effect of protein on altering the starch degradation rate [2,31]. Consequently, it is useful to investigate the effects of starch structure on both mashing and fermentation performances in brewing, with only the starch structural variance being considered. In order to accomplish this, barley malts with varied starch structures as well as rice adjuncts containing different starch contents/structures have been used in this study. The aims of our study are: (1) to investigate the effects of starch structure on the production of fermentable sugars, by using three different rice varieties as adjuncts; (2) to understand how the molecular structure of starch affects yeast fermentation, through measuring the rate of, and the final amount of, ethanol production. Each malt with different rice adjunct mashes was compared to an all-malt mash as a control.
This knowledge can provide a better way for brewers to choose a suitable malt quality, with and without rice adjuncts, to meet industrial fermentation requirements.

2. Results

2.1. Chemical Compostions and Enzymatic Activities of the Malts and Rice Adjuncts

As shown in Table 1, there were minor differences in the starch content between the three malts, with Malt 3 having the highest starch content, followed by Malt 2. Malt 3 also had the highest protein content, followed by Malt 1. Malt 2 had the lowest protein content. Malt 3 had the highest activity of α-amylase, but the lowest enzyme activity of β-amylase. Malt 2 had both the highest β-amylase and limit dextrinase activity, whereas Malt 1 had the lowest enzyme activity of limit dextrinase among the three malt samples.
Of the rice samples, no significant differences in both starch and moisture contents were observed. Rice 2 had the highest protein content, followed by Rice 1 and then Rice 3.

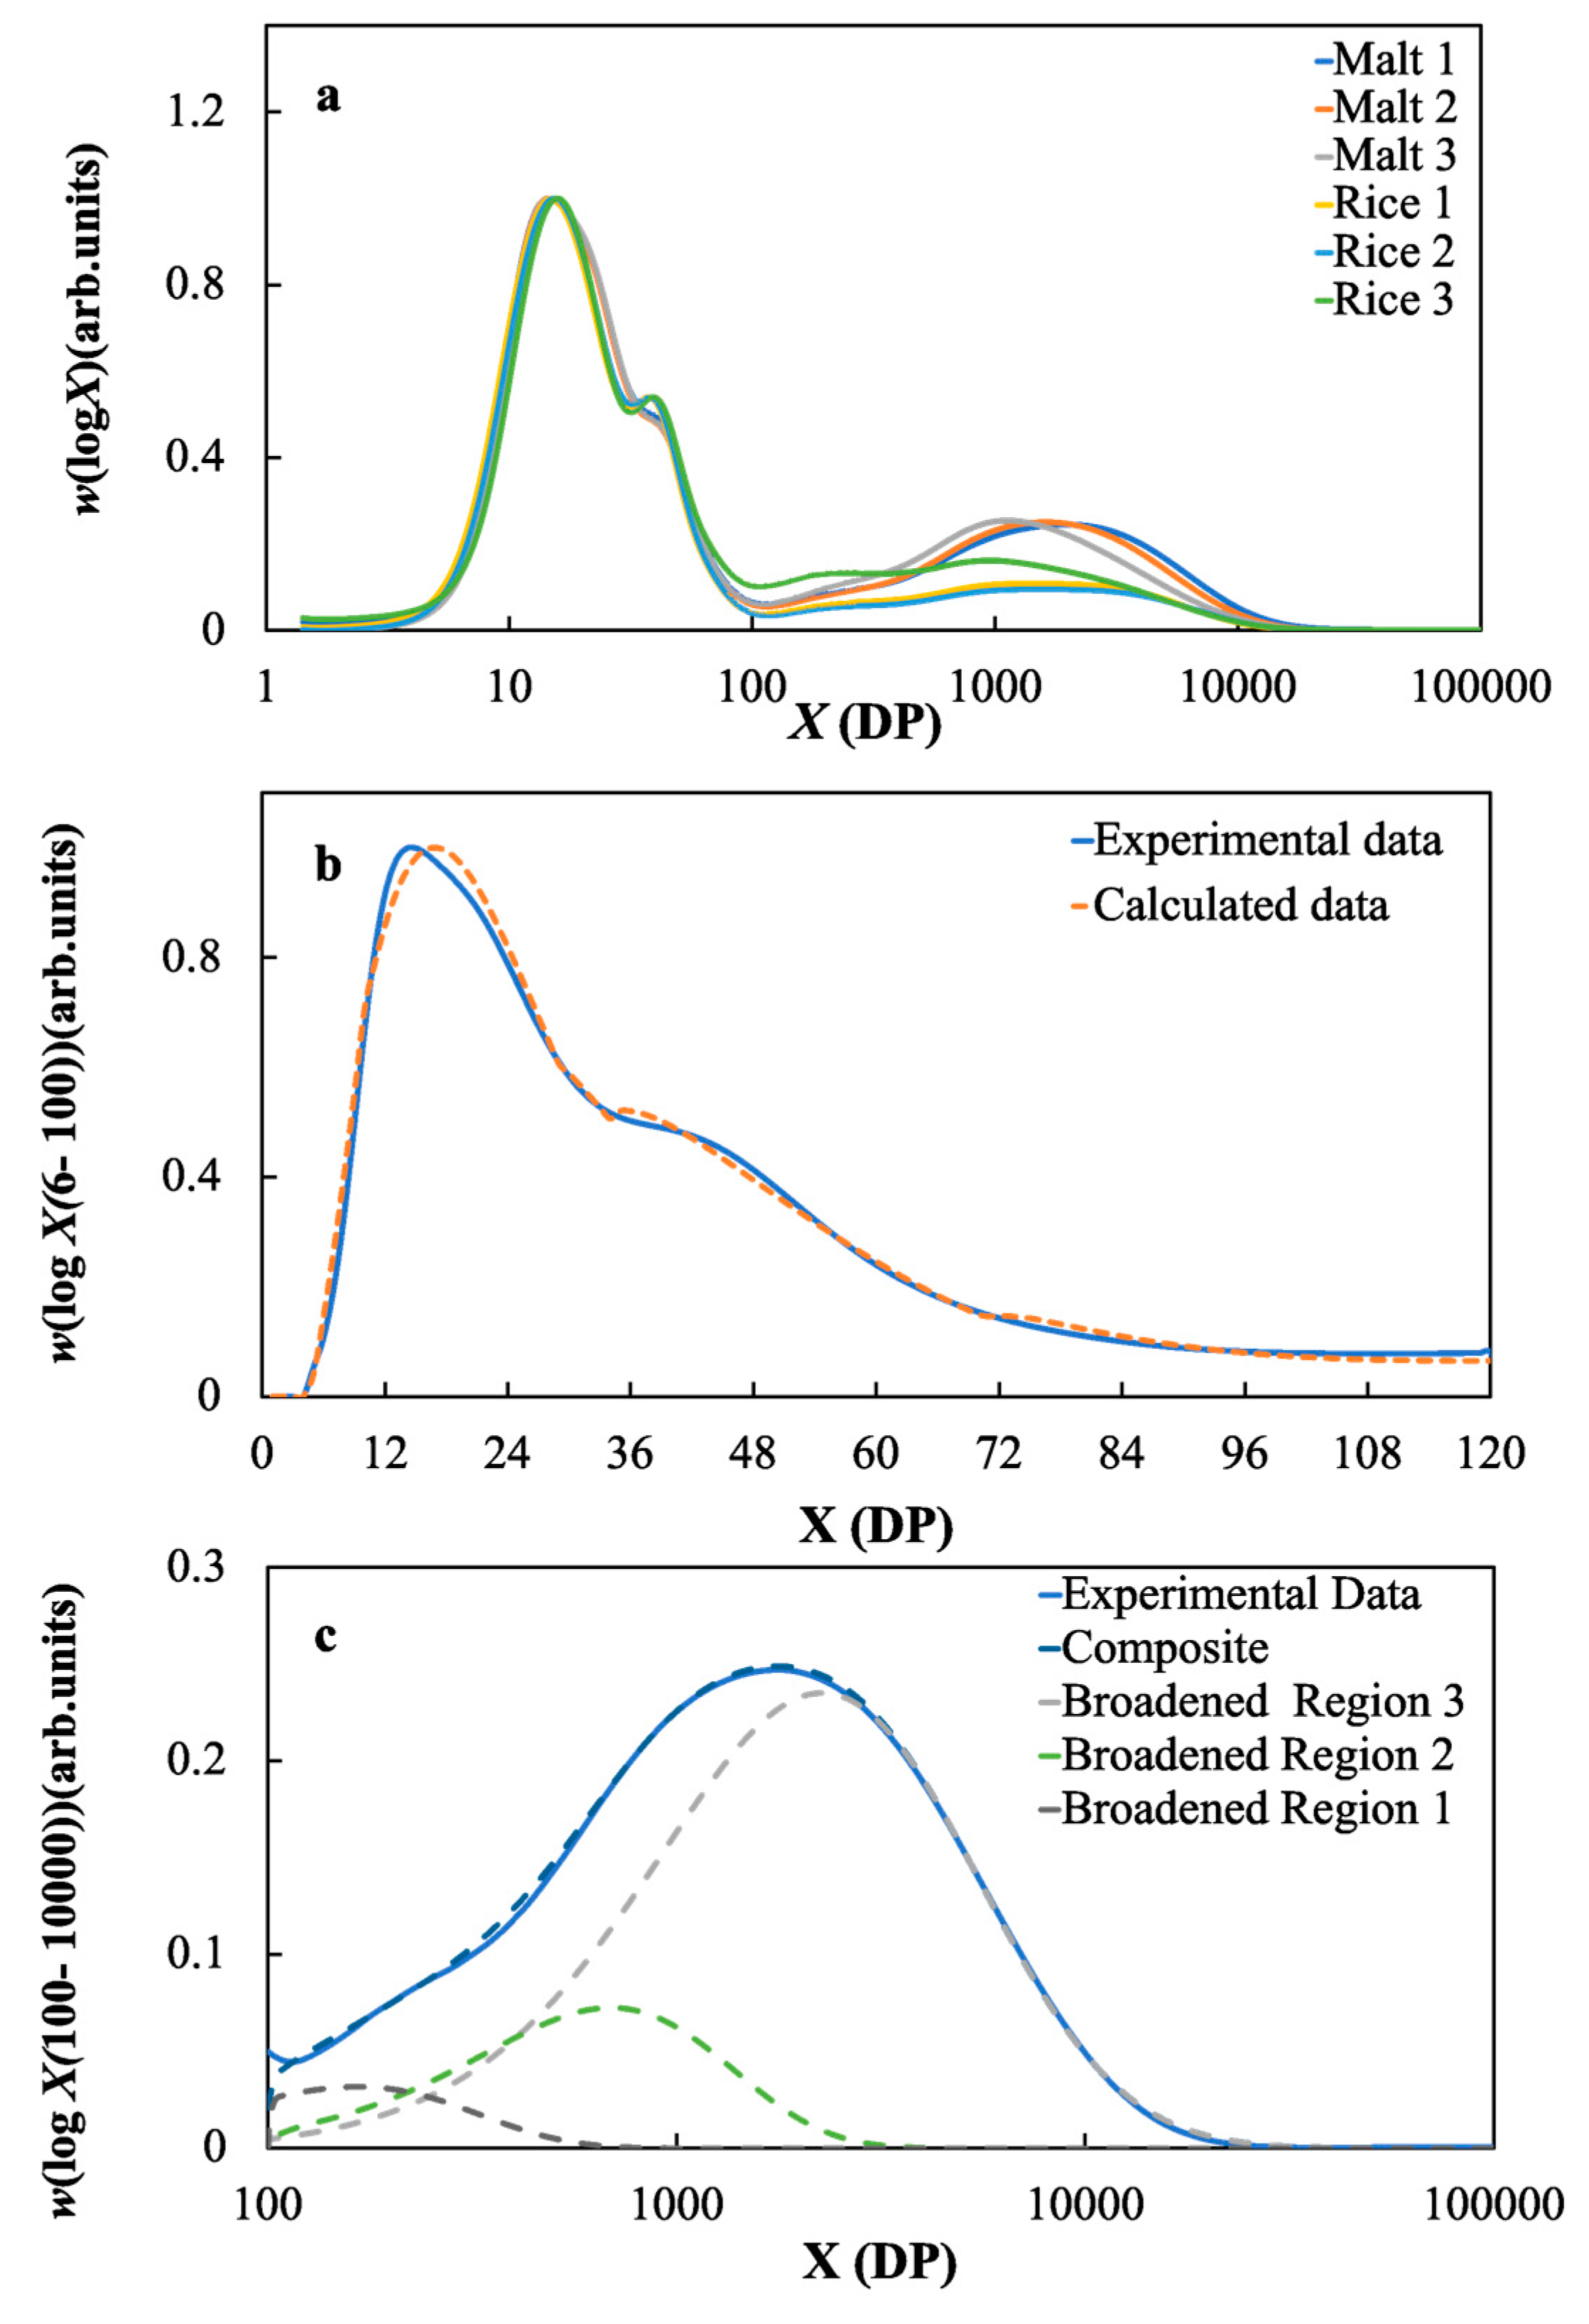
2.2. Starch Structural Parameters of the Malts and Rice Samples

Typical size- exclusion chromatography (SEC) weight distributions of the debranched barley malts and rice starches, w(log X), are shown in Figure 1; the general features were as seen in many publications. All barley varieties had similar CLD weight distributions and were different from those of rice starches (Figure 1a).
The amylose and amylopectin fitting parameters are shown in Table 1. There were no significant differences in amylose content for any malt sample. There were also no significant differences among the hAm,i: the proportions of amylose with different chain lengths were similar, quantifying what is seen in Figure 1. For amylopectin, the value of hAp, 2 for Malt 3 was significantly lower than the others: it had the lowest amount of amylopectin with medium-chain length.
For the rice samples, the amylose contents were in the order Rice 3 > Rice 1 > Rice 2. Higher hAm, 3, hAm, 2 and hAm, 1 were found with Rice 3 than for the other varieties, whereas there were no significant differences between those for the other two rice varieties. The latter quantifies what is seen qualitatively in Figure 1. The hAm, 3 of Rice 1 starch was significantly higher than that of Rice 2, indicating that compared with Rice 2, the starch extracted from Rice 1 contained a higher amount of amylose with short-chain lengths. For the amylopectin component, Malt 3 had the highest hAp, 3, hAp, 2 and hAp, 1, although Rice 3 indeed had the lowest content of amylopectin. This is because, with the application of the model, the CLDs of both amylose and amylopectin had been normalised to the part of amylopectin.

2.3. Thermal Properties of the Malts and Rice adjuncts

The thermal properties of the malts and rice adjuncts are shown in Table 1. The peak gelatinisation temperatures of the three malts were very similar, and were lower than the 65 °C mashing temperature. The onset and conclusion temperatures were also similar at around 58 °C and 70 °C, respectively. The enthalpies of the malt samples were not significantly different, with values from 6.5 ± 0.2 J/g of Malt 2 to 7.2 ± 0.9 J/g of Malt 3. The gelatinisation properties of the rice samples are irrelevant as they were gelatinised prior to addition to the mash.

2.4. Fermentable Sugars in the Wort

In our study, among all the fermentable sugars being measured, maltose was the dominant fermentable sugar, followed by maltotriose, and glucose was the lowest.
For the mashing results with the pure malts, Malt 2 produced the highest content of fermentable sugars after mashing. Although Malt 3 had the highest α-amylase activity (Table 1), it produced very similar amounts of fermentable sugars to Malt 1, which had the lowest activity of both β-amylase and limit dextrinase (Table 1). Thus, for samples used in this study, the enzyme activity of α-amylase was not a dominant factor determining the production of fermentable sugars during mashing.
Following the addition of rice adjuncts, more maltose was produced after mashing, although the resulting malts actually had lower amounts of amylolytic enzymes compared with the pure malt samples. The addition of rice adjuncts significantly decreased the amount of glucose (Table 2). For the contents of both maltotriose and sucrose, no significant changes were observed following the addition of rice adjuncts. There was; however, a significant increase in the amount of total fermentable sugars, with the proportion of glucose to maltose also decreasing.
The addition of rice adjuncts may have different effects on fermentable sugar production, depending on the rice variety. For instance, for Malt 1, the addition of Rice 1 led to a higher content of fermentable sugar content than that of the addition of Rice 2 and Rice 3, although Rice 1 and Rice 2 had similar amylose content (Table 1). For Malt 2, no matter which rice varieties were added, no significant differences of fermentable sugars were observed. For Malt 3, a slightly higher content of fermentable sugars was seen with the addition of Rice 1 and Rice 2, compared with Rice 3.

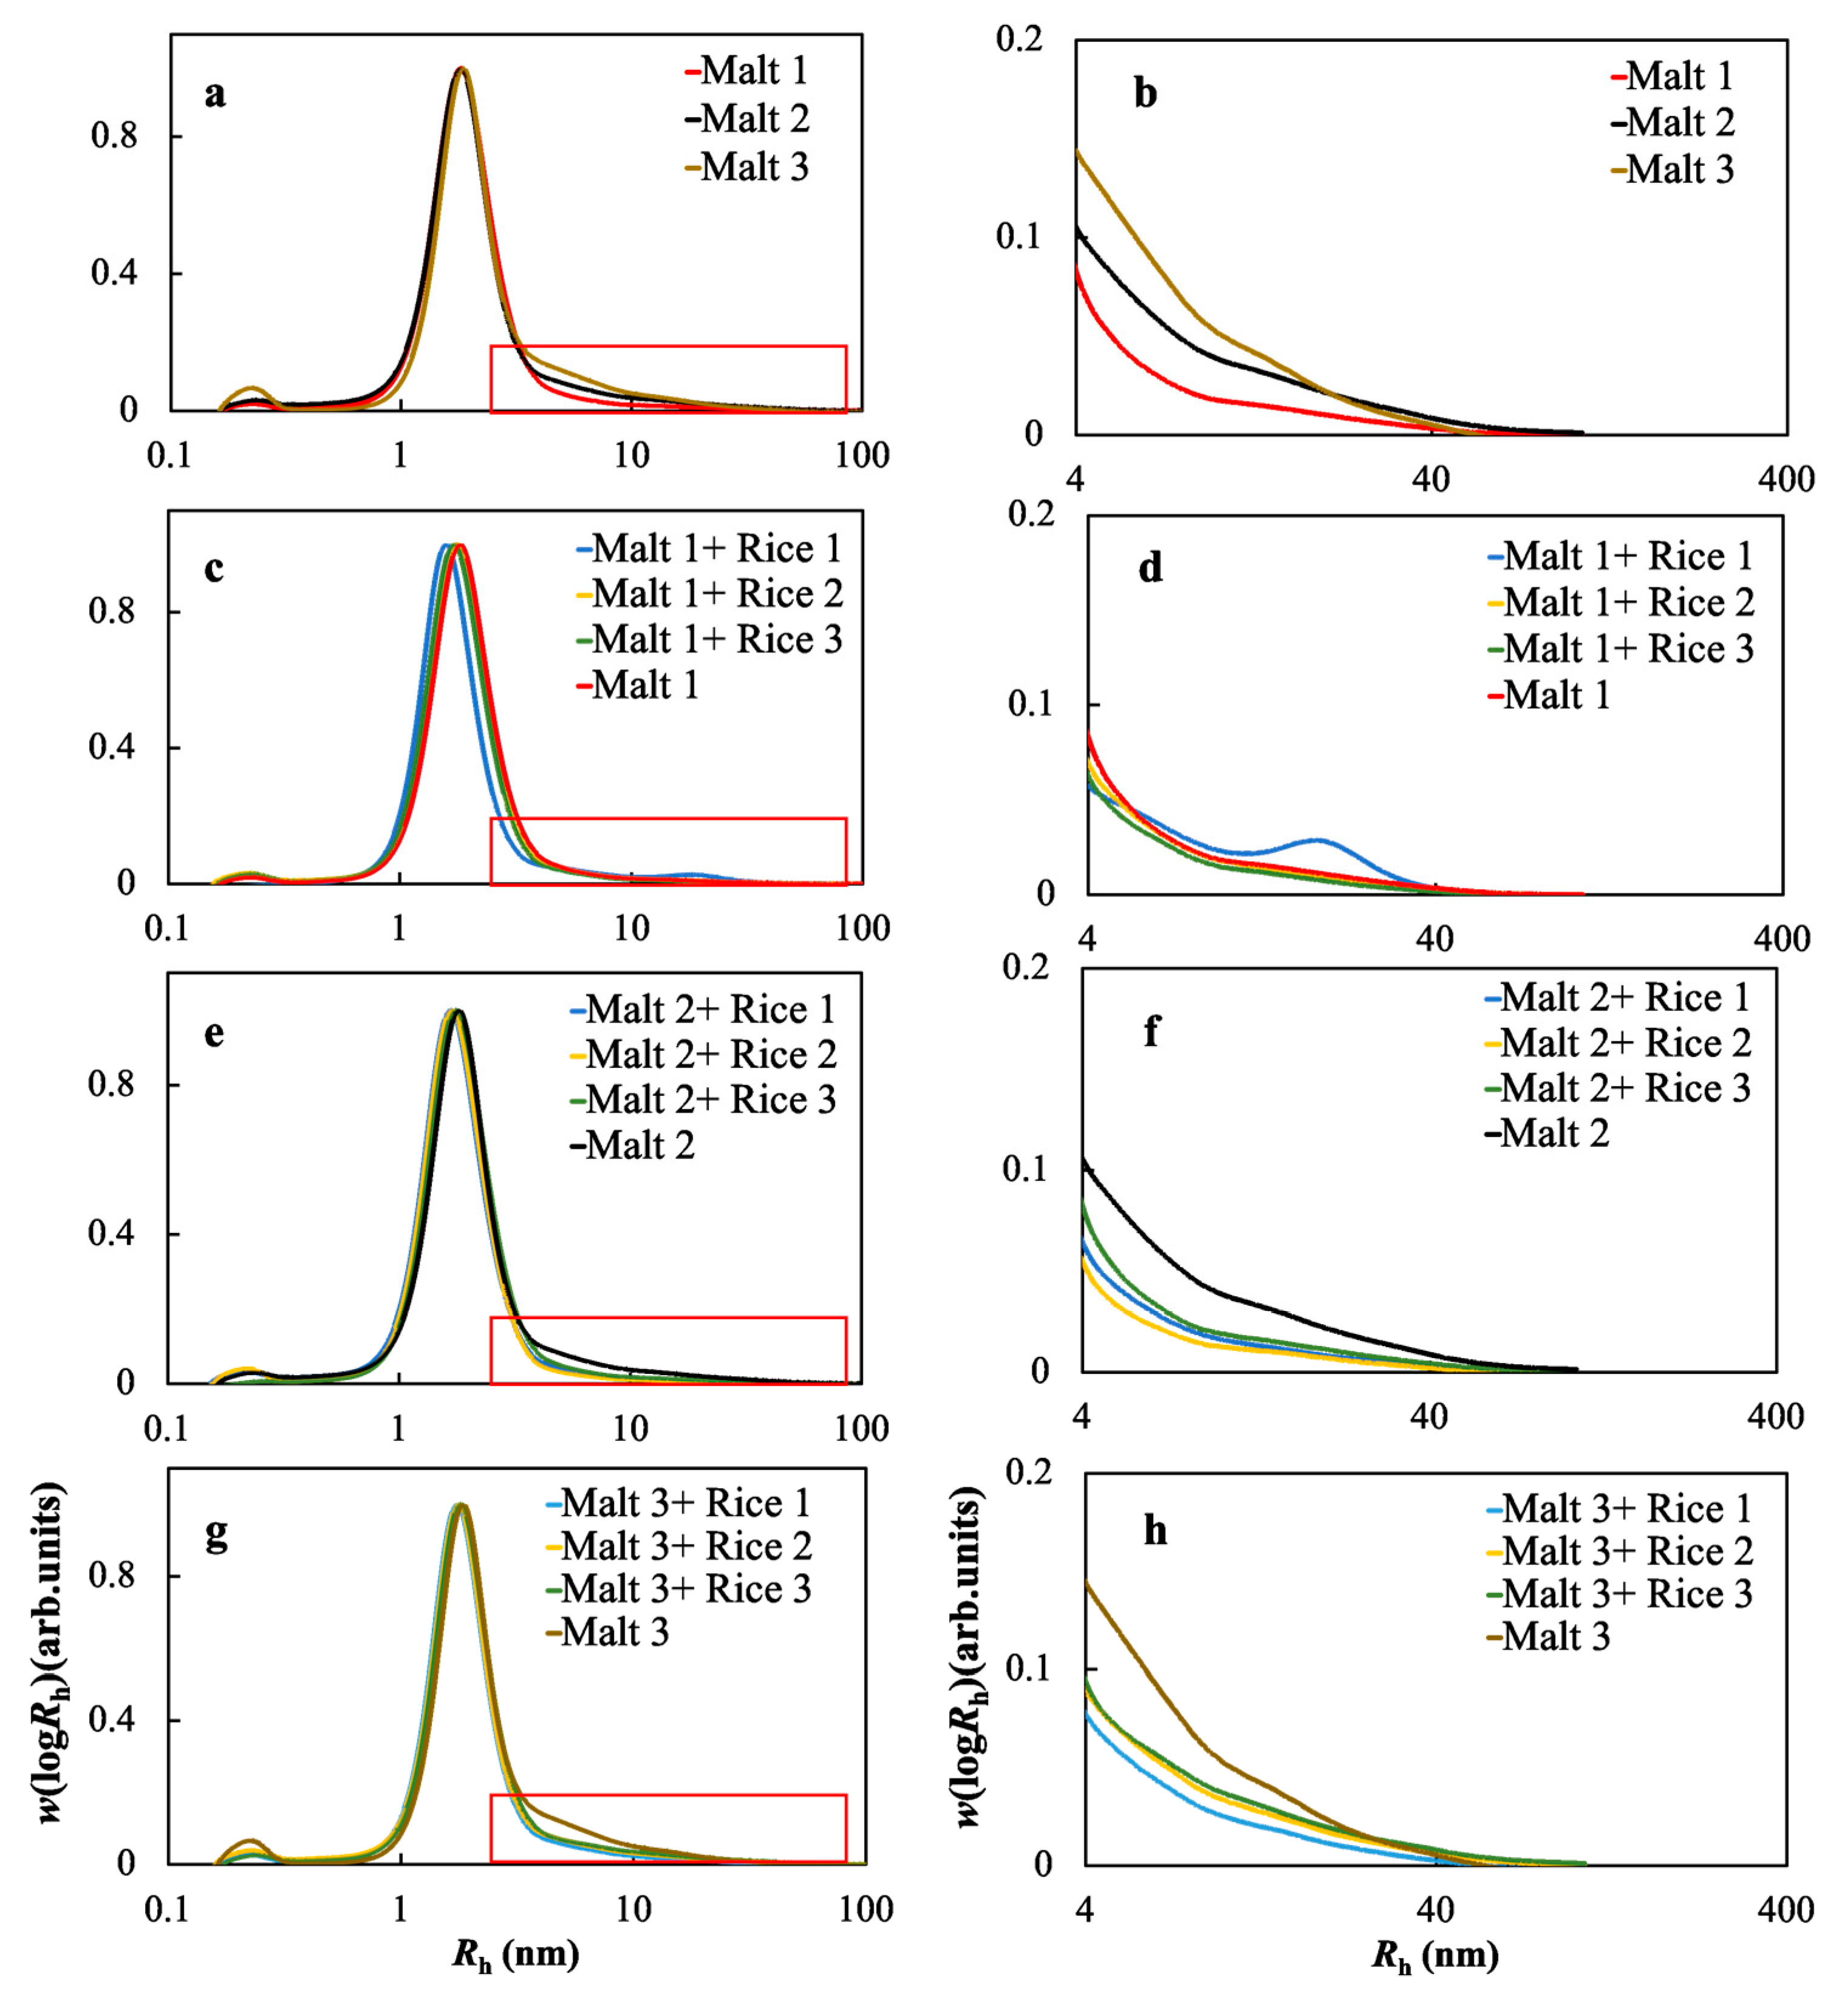
2.5. Molecular Size Distributions of the Soluble Starches in the Wort Samples

Figure 2 shows the molecular size distributions of the soluble starch molecules in the differing malt wort samples after mashing. For pure malt mashing, the Malt 3 wort contained a higher content of soluble starch polymers, with Rh between 4–100 nm (brown curve in Figure 2b), compared to Malt 1 and 2 wort samples (red and black curves, respectively). After the addition of rice adjuncts, all wort samples showed a lower proportion of soluble starch polymers, between Rh 4–100 nm, particularly for Malt 2 and Malt 3.

2.6. Contents of Soluble Starch and Nitrogen in Wort After Mashing

Table 3 shows both the contents and the average molecular sizes of the soluble starches in the wort samples, with and without the addition of rice adjuncts. Among all three malts, Malt 1 produced the highest content of soluble starch, followed by Malt 3. Malt 2 produced the lowest content of soluble starch. Compared with the wort produced from the mashing from Malt 3, the wort samples produced from Malts 1 and 2 had significantly higher contents of soluble nitrogen, even though Malt 3 had a higher content of total protein (Table 1). This indicates that during mashing, more protein was hydrolysed for both Malt 1 and Malt 2, compared with Malt 3.
After the addition of rice adjuncts, it was found that, for all malt samples, the content of soluble starch in the wort was increased, while the soluble nitrogen content was decreased. No significant differences were found among the three rice varieties, as shown in Table 3.

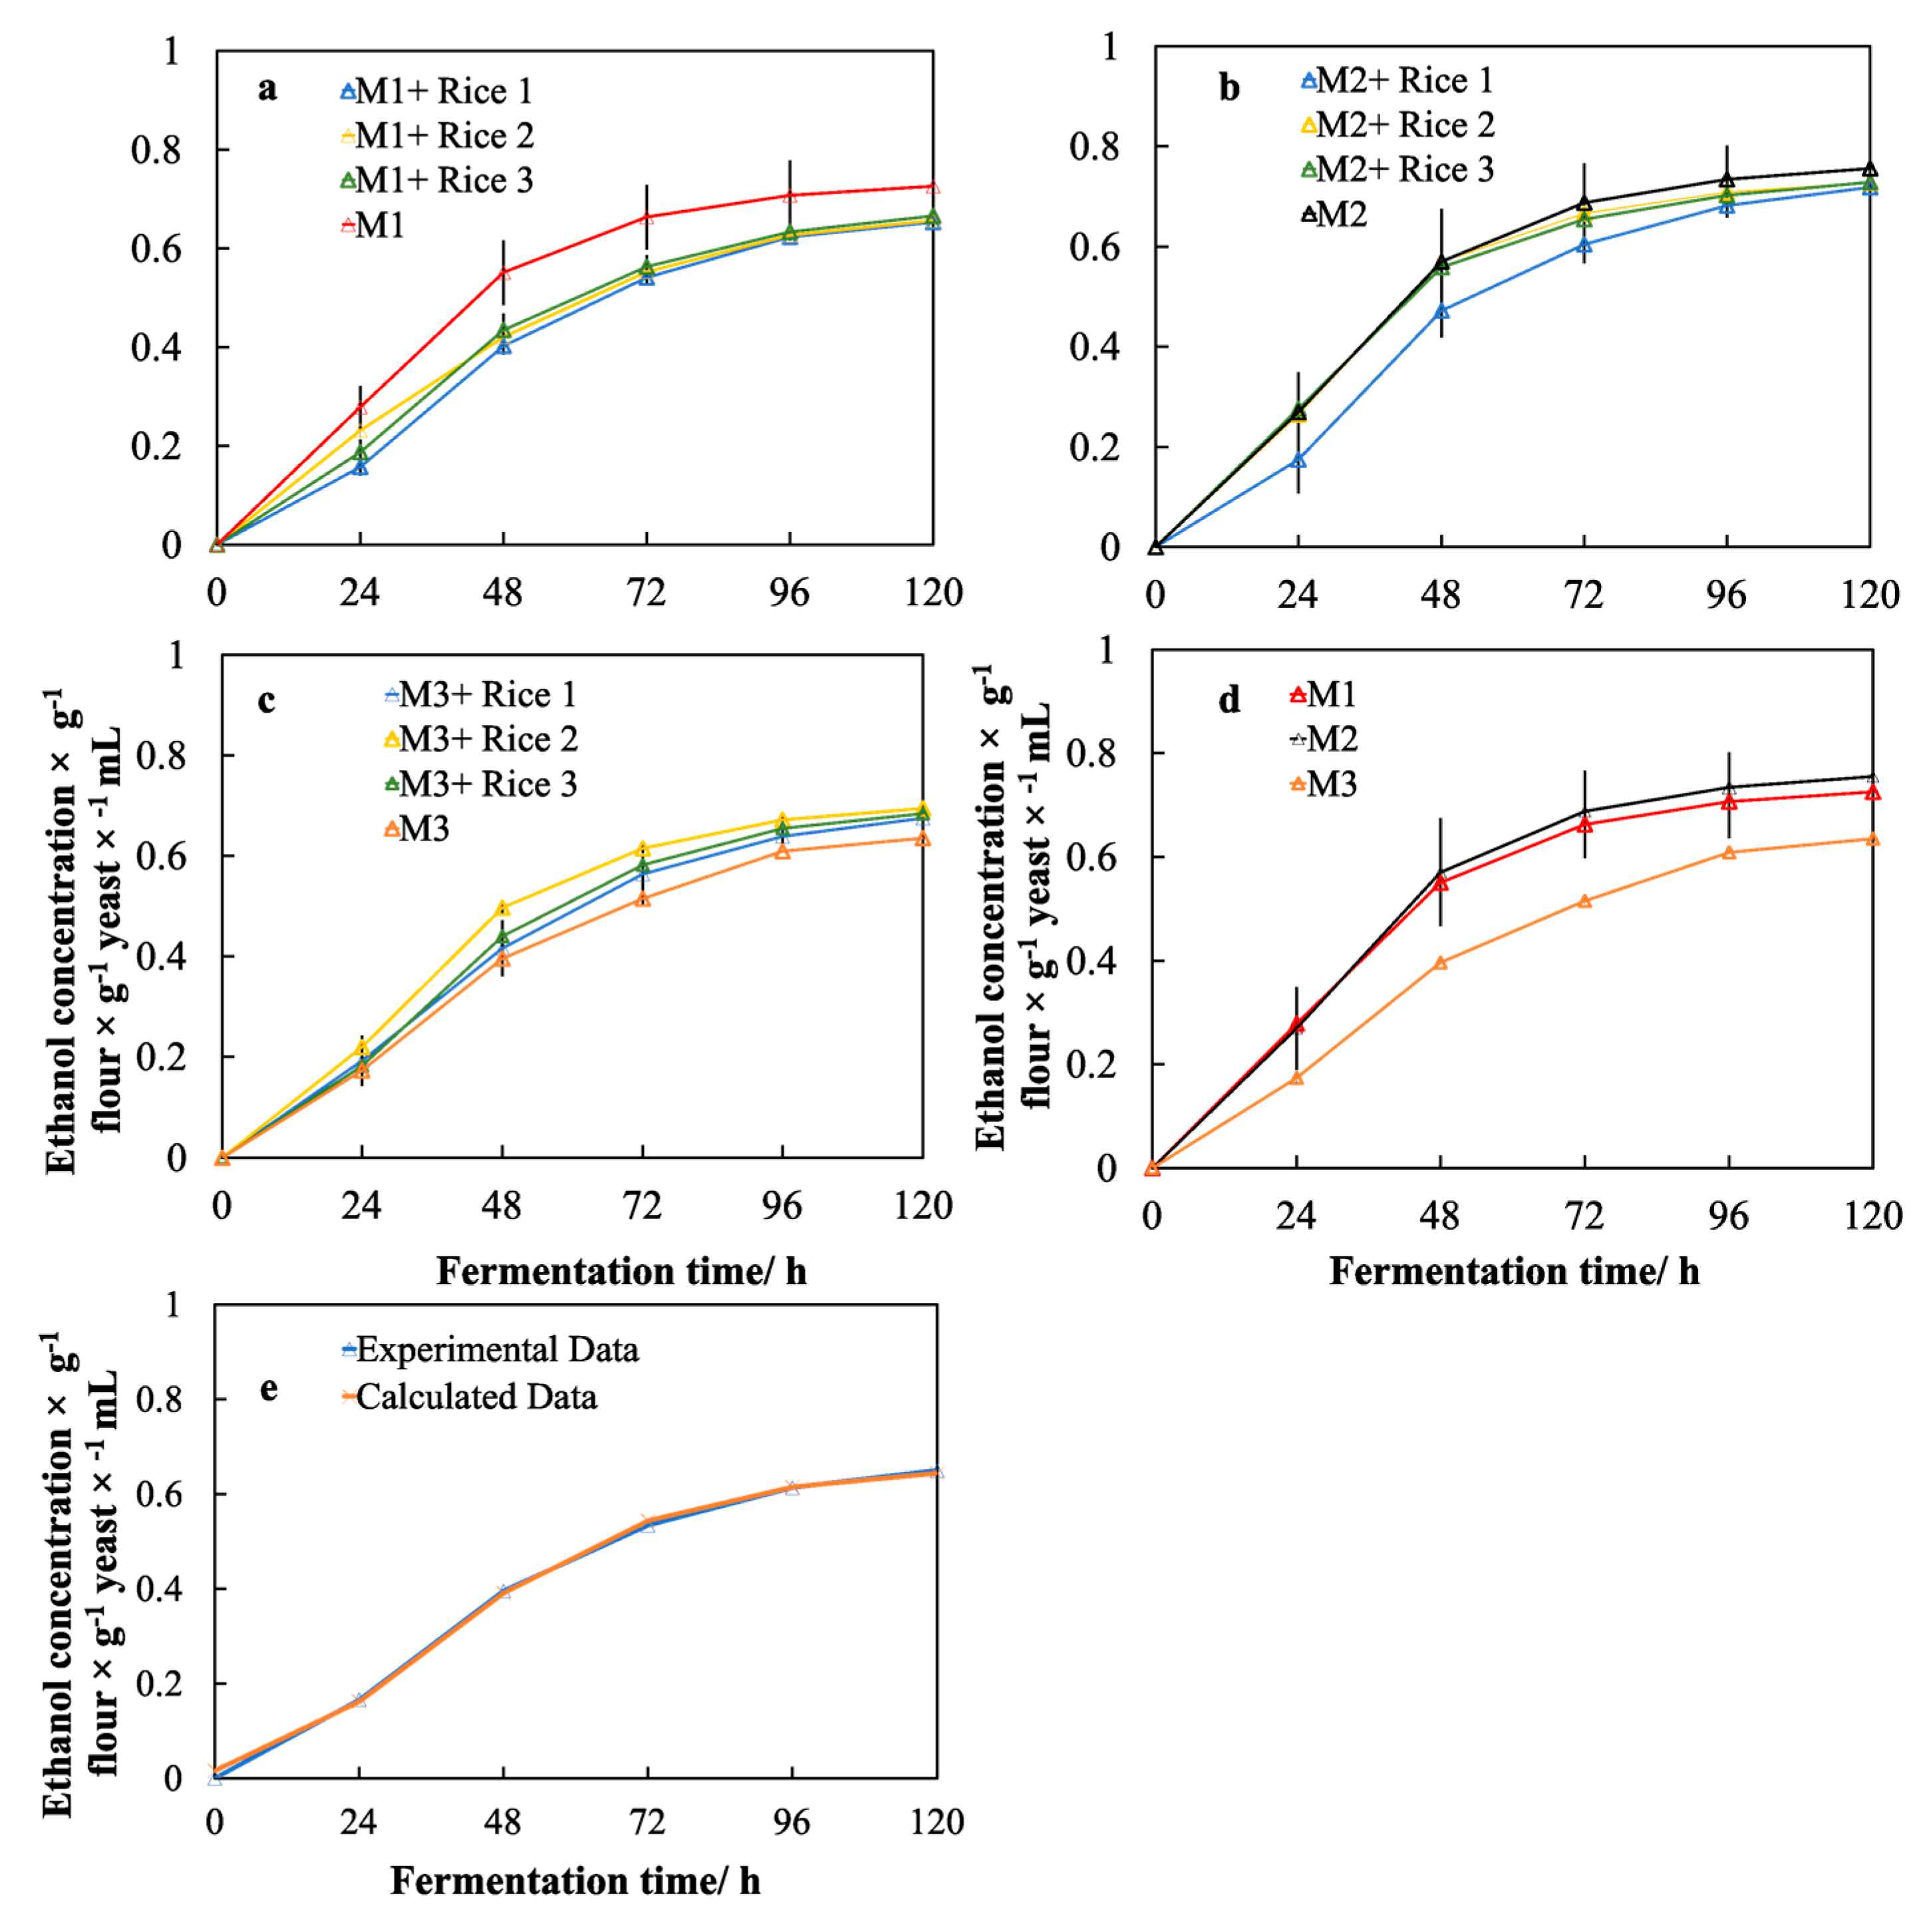
2.7. Ethanol Production and Model Fitting

The increase in ethanol concentration over the five days of fermentation is shown in Figure 3, with data being normalized to per gram of flour (dry weight). For the pure malt fermentation, Malt 3 produced the lowest ethanol; Malt 2 showed a slightly higher ethanol concentration than Malt 1.
The addition of rice adjuncts resulted in significant variations in ethanol production for different malt samples. The addition of rice adjuncts resulted in a decreasing ethanol concentration for Malt 1. For Malt 2, though the addition of Rice 1 significantly decreased the ethanol concentration during the fermentation time, the addition of both Rice 2 and Rice 3 did not change the ethanol concentration significantly. However, for Malt 3, the addition of all three rice adjuncts increased the concentration of final ethanol production after five days of fermentation.
A typical model fitting of the ethanol production using equation 2 is shown in Figure 3e; the fitting parameters are shown in Table 4. No statistically significant differences were observed among the concentration of final ethanol or the rate of ethanol production.

2.8. Correlations Among Protein Contents, Starch Structural Parameters and Fermentable Sugar Contents in Wort Samples

Correlations among fermentable sugar contents and grain component parameters of both malts and rice adjuncts (with the starch structural parameters included) and starch structural parameters are shown in Table 5.
It is seen that amylose content was significantly and negatively correlated with maltotriose content after mashing. The significant negative correlation between hAm, 3 and maltose content (Table 5) shows that the amount of amylose with longer-chain length significantly and negatively correlated with the production of maltose during mashing.
It is seen that hAp, 3 was significantly and negatively correlated with maltotriose (r = −0.75, p < 0.001) and with sucrose (r = −0.65, p < 0.05). This means that the amount of longer amylopectin chains (DP 66–92) significantly and negatively correlated with the release of maltotriose as well as sucrose during mashing.

2.9. Correlations among Fermentable Sugars, Starch Structural Parameters, Wort Components and Fermentation Parameters

Table 5 shows that the content of fermentable sugars, including glucose, sucrose and maltotriose, were all significantly and positively correlated with both Cfinal and k. This is not surprising as yeast needs to use fermentable sugars to release ethanol. No significant correlation between the maltose content and the fermentation parameters was found; a high amount of maltose does not necessarily lead to the best fermentation efficiency.
The significant negative correlation between hAp, 3 with both CExp and k indicates that a higher amount of amylopectin longer chains (DP 66–92) will lead to a slower ethanol production rate (k) and a lower content of ethanol.
The content of soluble nitrogen in the wort was significantly and positively correlated with Cfinal and k.

3. Discussion

This is the first study to describe combined data for malt starch structure, rice starch structure, starch degrading enzymes, fermentable sugars and alcohol production. While there were slight differences in malt starch parameters (total starch and amylose contents), all the malt samples were within the usual malt specification based on protein content (as provided by malt supplier). For all three commercial malts, all with very similar malt specifications, Malt 3 had the highest amount of protein and the highest amount of α-amylase, but was inferior compared to the other two malts for both mashing and fermentation performances. This poorer performance would not be expected based on standard specifications. This shows that a full understanding of the fermentation process and the targeting of a final alcohol level requires the consideration of not only the traits of malts, including starch structure and enzyme activity, but also the properties of the wort, after mashing. This particularly includes the content of the soluble nitrogen and the molecular structures of the soluble starches, as well as the soluble starch content.

3.1. Effects of Different Malts on the Fermentable Sugar Contents in Wort Samples

It was found that Malt 2 released the highest amount of fermentable sugars, whereas no significant differences were observed between Malt 1 and Malt 3. This can be explained by the fact that, compared with the other two commercial malts, Malt 2 had the highest activity of both β-amylase and limit dextrinase. During mashing, the efficiency of any one starch-degrading enzyme in a mash is influenced by the presence of other starch-degrading enzymes. Specifically, with, particularly, a high level of β-amylase (Malt 2), a higher level of limit dextrinase would lead to a substantial increase in maltose content levels [9]. The products of α-amylase hydrolysis (limit dextrins, maltotriose, maltose) would be more easily accessed by β-amylase and; therefore; will release more maltose and glucose [32]. Except for this, the lowest content of soluble starch in the wort of Malt 2 has provided further evidence that more starch has been hydrolysed during mashing (Table 3). This explains why Malt 2 released the higher amount of fermentable sugars.
Malt 3 had the highest α-amylase activity of the malt samples, though there were no significant differences in the fermentable sugar contents. This is possible because: (1) Malt 3 had the highest protein content, which was significantly negatively correlated with the release of fermentable sugars (Table 5); (2) the wort from Malt 3, after mashing, had the lowest protein content (Table 3), which indicates that, compared with the other two malts, the hydrolysis of the protein in Malt 3 during mashing was the lowest. As reported previously [2], barley protein can competitively bind with amylase, which would significantly reduce the degradation of starch (leading to a lower sugar content but a higher content of soluble starch polymer, with larger molecular sizes), as shown in Figure 2a,b. This explains why, compared with Malt 1 and Malt 2, Malt 3 had the highest α-amylase enzyme activity but did not produce more fermentable sugars.

3.2. Effects of Rice Adjuncts on Fermentable Sugar Production and Soluble Starch Content

The addition of rice adjuncts significantly increased the content of soluble starch in all of the malts (Table 3); the starch content in rice is significantly higher than in barley (Table 1). The addition of rice adjuncts will also increase the overall starch content and reduce the amount of starch hydrolytic enzymes (amylases and limit dextrinase). Accordingly, there would be more soluble starch remaining in the wort after mashing.
The addition of rice adjuncts led to different results for the release of fermentable sugars: Rice adjuncts resulted in an increased content of maltose (Table 2), but a lower content of glucose and sucrose (Table 2). The enzyme activity of both amylases and limit dextrinase were reduced as a result of the addition of rice. Possible mechanisms could be as follows.
  • The increase of maltose content by the addition of rice adjuncts: During the pre- gelatinisation of rice starch, starch molecules would have leached out from inside granules, leading to the production of more rapidly degraded materials. These have starch chains exposed to the solution and so are readily available for attack by amylase [33,34]. Based on this, during mashing, the increase of those rapidly degraded materials would be easily degraded by both α- and β-amylase, leading to an increase of maltose content following the addition of rice adjunct.
  • The decrease of glucose content by the addition of rice adjuncts: During mashing, significant β-glucanolysis will take place, and glucose would be further hydrolysed by various enzymes, to disaccharides and glucose [35]. The addition of rice adjuncts means less activity of amylase and amyloglucosidase, and β-glucanase will also release glucose by hydrolysing barley β-glucan. Accordingly, less glucose would be formed, as seen here.

3.3. Effects of Individual Rice Adjuncts on the Fermentable Sugar Contents in the Wort Samples

No significant differences were observed of the ethanol concentrations, at the end of fermentation, with the addition of any of the rice adjuncts. This is probably because, although there must be significant structural effects of starch on the release of fermentable sugars during mashing, this is by affecting the gelatinisation behaviour of barley starch during mashing. All rice varieties used here were gelatinised before adding to the malt mashing liquid, which would eliminate the effects of the rice starch structure on the production of fermentable sugar.

3.4. The Effects of the Molecular Structure of Starch on the Fermentable Sugar Content in the Wort Samples

A significantly negative correlation between amylose content and fermentable sugar content was observed in this study. It was proposed that during mashing, leaching of amylose molecules from starch granules during mashing would slow enzyme diffusion, thus reducing starch enzymatic hydrolysis. Additionally, amylose molecules may entangle and/or co-crystallize with amylopectin chains in the crystalline lamellae, thereby limiting starch swelling [36]. This would result in a lower amount of fermentable sugars released during mashing. This is consistent with the significant negative correlation seen in this study between amylose content (dry basis) and maltotriose content after mashing (Table 4).
In the present study, the addition of Rice 1 and Rice 2 increased the maltotriose content, but not Rice 3 (Table 2), which had a lower amylose content. The significant negative correlation between hAp, 3 with both maltotriose and sucrose content (Table 5) means that when there are more longer amylopectin chains (DP 66–92), less maltotriose and sucrose will be released. This is probably because more longer amylopectin chains increase the efficiency of packing within the crystalline region of starch granules, requiring less time for the hydrolysis of these chains by amylases [37].

3.5. Effects of Different Malts on Ethanol Production

There were significant positive correlations among fermentable sugars (glucose, sucrose and maltotriose, Table 5) and fermentation parameters (Cfinal and k, Table 5). Malt 2 resulted in a slightly higher ethanol concentration compared with Malt 1, and both were significantly higher than that of Malt 3. For Malt 1 and Malt 3, though they had a similar content of fermentable sugars, the fermentation efficiency of Malt 1 was significantly higher than that of Malt 3. This is probably because, compared with Malt 1, the soluble protein in the wort produced from Malt 3 was significantly lower (Table 3). The shortage of enough soluble protein could inhibit the growth of yeast during fermentation, thereby retarding ethanol production [38]. Furthermore, it is reasonable to suppose that the higher amount of soluble starch polymers with bigger molecular sizes (Figure 2, Table S1), remaining in the wort from Malt 3, would have also led to a lower ethanol content and a significantly smaller k (Table 4). However, further work should be conducted to support this hypothesis.

3.6. Effects of the Rice Adjuncts on the Performance of Yeast Fermentation

For different malt samples, the addition of rice adjuncts led to varied fermentation efficiency. For Malt 1 and Malt 2, the addition of rice adjuncts led to a slower ethanol release rate (k) and a lower final ethanol concentration (Cfinal) at the end of 5 days of fermentation (Table 4). However, for Malt 3 the result was opposite. This indicates that the effects of rice adjuncts on the performance of fermentation depend on the properties of the main substrate—malted barley. Possible mechanisms for this are as follows.
For malt samples with a good mashing performance (e.g., a malt variety containing a high amount of β-amylase and limit dextrinase (Malt 2) and/or a good protein hydrolysis during mashing (Malt 1), resulting in a higher content of soluble protein in the final wort (Malt 1 and Malt 2, Table 3), the addition of rice adjuncts was a disadvantage that reduces the rate and total amount of ethanol production. This is probably because the addition of rice adjunct increased the content of soluble starch in the wort, which may not be able to be utilised by yeast [38], and significantly decreased the content of soluble protein (See Table 3). Therefore, there would not be enough soluble protein to keep yeast alive during the fermentation process.
For a malt variety with a lower mashing and fermentation efficiency due to a higher protein content (e.g., Malt 3), the addition of rice adjuncts would accelerate yeast fermentation by increasing the content of total fermentable sugars (Table 2), and also by reducing the molecular sizes of the soluble starch polymers.

3.7. Effects of the Molecular Structure of Rice Starch on the Performance of Yeast Fermentation

There were no significant differences observed for the release of ethanol with the addition of different rice varieties (Table 4, Figure 3). However, this does not mean that the content and molecular structure of starch have no effect on the performance of yeast fermentation in brewing. The content of fermentable sugars, including glucose, sucrose and maltotriose, all showed a significant positive correlation with both the concentration and production rate of ethanol during the fermentation process (Table 5), which also significantly correlated with starch structural parameters. Furthermore, other factors, particularly the content of soluble protein, will also alter yeast fermentation efficiency [38]. To some extent this will weaken the starch structural effects on yeast fermentation. However, the significantly higher k value found when adding Rice 1 and Rice 2 (low amylose), compared to Rice 3, indicates that there are starch structural effects on fermentation for the production of beer.

4. Materials and methods

4.1. Malts

Malts were sourced from a local craft brewery supplier (Toowoomba Craft Brewer supplies). The malts were as follows: Malt 1: Pale malt (unknown cultivar); Malt 2: Amber malt (unknown cultivar); Malt 3: Ale Malt (Golden Promise), as shown in Table 1. Three samples of rice were provided by the New South Wales Department of Primary Industries, Australia, containing different starch molecular structures but very similar starch content. All rice cultivars were planted and harvested in 2017 in Mackay, Queensland, Australia, as described in Table 1.

4.2. Milling

Malts were milled using a Buhler Miag mill (Buhler, Germany) at a setting of 10 (coarse particle size). Rice samples were milled using a commercial coffee grinder and then sieved through 250 µm. Both barley and rice flours were sealed and kept at room temperature for future analysis.

4.3. Chemical Composition of the Malted Barley and Rice

Moisture content was measured by drying the samples in a vacuum oven at 110 °C overnight and recording the weight loss in triplicate. Starch content was measured using a Megazyme Total Starch kit (K-TSTA-1107, Megazyme, Ireland). Before measuring the starch content, the weighed malt flour was washed with 2 mL absolute ethanol (two times) to remove any remaining sugars that were produced in the malting process. The crude total protein contents of the malts and rice adjuncts were calculated from the nitrogen content, determined using a LECO CNS2000 auto-analyser (Leco CNS-2000 analyser on carbon, nitrogen and sulfur) (Seminole, Florida, FL, USA), with a conversion factor of 6.25.

4.4. Differential Scanning Calorimetry

Thermal properties of the barley and rice flours were evaluated using the method exactly the same as the method described previously [30].

4.5. Enzyme Activity of Amylases and Limit Dextrinase in the Malted Barley

The activities of α-amylase and β- amylase of all three malts were measured using the Malt Amylase Assay kit purchased from Deltagen Australia Pty. Ltd. (14 Pacific Place, Kilsyth Victoria, 3137, Australia). The activity of limit dextrinase was determined by using a Pullulanase/Limit-Dextrinase Assay kit (PullG6 Method, Megazyme International Ireland, Ltd.). Duplicate measurements were performed.

4.6. Pre-Gelatinisation of Rice

Milled rice flour (10 g, wet basis) was mixed with 100 mL of boiling tap water and left for 30 min to let the rice starch fully gelatinise. The solution was held at a temperature of 65 °C prior to adding to the mash liquid.

4.7. Mashing

For malts with rice adjuncts, 40 g of malt flour mixed with ~150 mL of hot water was pre-heated in the pot in the mash bath, which was set at 65 °C; the pre-gelatinised rice solution (10 mg/100 mL) was then added. In the meantime, for the pure malts, exactly 50 g of malt flour was mixed with ~150 mL of hot water, and kept in the pot in the mash bath, which was set at 65 °C. Following this, a stirrer bar was added to each pot for continuous stirring during the mashing. The required volume of water (strike temperature was 65 °C) was then added (Figure 4) until the final total volume of water that was added into the mashing pot was 300 mL. The underpot magnetic stirrers were turned on immediately after addition of the liquid adjunct. An infusion mashing method was followed, whereby the mash temperature profile was 65 °C for 45 min, with a ramp up to 72 °C for 10 min, and then a final rest at 72 °C for 10 min. After the completion of mashing, the pots were quickly equilibrated to room temperature using an ice bath, prior to filtration. For all samples used here, duplicate mashing experiments were conducted. Though enzyme and microorganism activities are inherently variable, we found adequate replicability based on duplicate measurements. The diagram of the mashing experiments is shown in Figure 4.
In this study, the percentage of the rice adjuncts added for the mashing experiments was kept at 20%. This is because, due to the higher starch content in rice, when the content of rice is lower, the amylase present in malt is still sufficient to break down the starch present in both the rice and malt. At a higher ratio, it is highly likely that amylase would act as the limiting factor, which will eliminate the effect of starch structure on the release of fermentable sugars, which is not the aim of this study [39].

4.8. Wort Filtration

At the end of mashing, the mashing pots were put into cold water and cooled to room temperature. Following this, the mashing liquid was filtered through Whatman No. 597 filter paper, with the first 100 mL of wort returned.

4.9. Sugar Analysis of Wort Samples

Wort samples were diluted 30 times prior to analysis of the fermentable sugar profile. Standard mixtures of glucose, sucrose, maltose and maltotriose were made in the range 1–27 μg/mL in water. Samples were analysed on an Agilent 1100 HPLC with ELSD detection. The HPLC solvent was 75% acetonitrile in water, at a 1 mL/min flow rate using an Alltech Carbohydrate column, 4.6 mm × 250 mm. The ELSD was set to a nitrogen flow rate of 2 mL/min (at 87 °C). Duplicate measurements were performed.

4.10. Soluble Nitrogen Content in Wort

The soluble nitrogen in the wort samples was measured using a Nitrogen Analyzer (Elementar Variomax, Frankfurt Germany), whereby 100 µL was aliquoted into the crucible before being combusted and then total nitrogen was measured.

4.11. Fermentation

Filtered wort (exactly 190 mL) was boiled for 10 min in a 500 mL Schott bottle with a slightly loose screw cap. The wort was cooled to room temperature and then followed by adding exactly 0.25 g of yeast (Lager 495, Mauri, Toowoomba, Australia). The bottles were placed on an orbital shaker in a room at 18 °C, and then a 10 mL sample was removed at each 24 h period to measure specific gravity. Alcohol was calculated based on changes between original gravity (OG) and daily gravity:
Alcohol % = ((OG − Daily gravity)/0.75) × 100

4.12. Original Gravity

For subsequent gravity and maltose analysis, 10 mL was subsampled after the completion of filtration. Original gravity, recorded as specific gravity (SG), was measured on 10 mL of wort in a DMA 5000 (Anton Paar, Germany). The specific gravity was used to calculate the original extract (degrees Plato [°P]) and also for each 24 h period during fermentation up to and including 120 h. Duplicate readings were taken for each sample.

4.13. Model to Predict Ethanol Production

The data of ethanol concentration during fermentation were fitted with the modified Gompertz model, as described by Zwietering, Jongenburger [40]
Ct = Cfinal exp[−exp(k × e1 × (Tt) + 1)]
Here t is the fermentation time, Ct is the concentration of released ethanol at fermentation time t, Cfinal is the potential maximum ethanol mass concentration; T is the lag phase time to ethanol production and k is the maximum ethanol production rate [expressed as % /(h × g)] during fermentation.

4.14. Starch Extraction

Starch extraction from the malts and rice flour was as described previously [23] with only minor modifications. In particular, for the barley starch extraction, after removing protein by protease and centrifuging at 4000× g for 10 min, 0.5 mL of the lichenase solution (100 µL enzyme mixed with 2 mL sodium phosphate buffer (20 mM, pH = 6.5; Megazyme)) was added and was kept at 40 °C for 1 h to remove β-glucan. After centrifuging, the residue was re-dissolved overnight in 1.5 mL of dimethyl sulfoxide (DMSO; Sigma-Aldrich) containing 0.5% LiBr at 80 °C.

4.15. Starch Structural Analysis

Extracted starches were analysed using a Waters SEC-MALLS system (Wyatt Technology), equipped with dual detectors: differential refractive index (DRI) and multiple-angle laser light scattering (MALLS), as shown, for example, in [41]. With SEC, differential refractive index (DRI) detection gives the distribution of the weight of polymer as a function of molecular size, w(logRh). MALLS detection gives the weight-average molecular weight, M W ¯ .
The distribution of the number of monomer units in individual chains—the chain-length distribution (CLD)—was obtained by, first, debranching the starch with a debranching enzyme, then characterising the resulting chains by SEC. For whole starch molecules, there is no relation between its molecular size and molecular weight, as whole starch molecules are highly branched. However, for linear polymers, there is a unique relationship between size and molecular weight. This yields the weight CLD as a function of the degree of polymerisation (DP) (X), w(logX). For a linear polymer, such as debranched starch, the relation between the CLD number (the number of chains of a given degree of polymerization (X) following debranching, Nde(X)), and the corresponding weight distribution is w(logX) =X2 Nde(X) [42]. The relationship between the SEC elution time, the SEC separation parameter, the hydrodynamic radius Rh and X for linear polymers is found by calibration with known standards and the Mark–Houwink equation [41].

4.16. Amylose and Amylopectin Contents

Amylose content was calculated from w(logX) as the ratio of the area under the curve for the degree of polymerization (DP) ≥100, to that of the entire weight distributions (of all amylose and amylopectin branches), as described previously [23,43,44]

4.17. Fitting Amylose and Amylopectin CLDs with Two Mathematical Models

The most effective way to find statistically meaningful correlations between structural data and functional properties is to fit the structural data with models that reproduce these data with a small number of biologically-meaningful parameters, and then use these parameters to find structure–property correlations. We do this here using models and methodologies reviewed in [45]. The fit to SEC CLDs of barley and rice starches in the amylopectin region was implemented with the model of Wu et al., using publicly available code [46,47]. The model assumes that different regions of the CLD are formed largely, but not exclusively, by enzyme sets, each set comprising one isoform of a starch synthase (SS), a starch branching enzyme (SBE) and a debranching enzyme (DBE). The model parameters are the ratios of the activity of the SBE to that of SS in enzyme set i, βAp, i, and the relative contribution of that set to the overall CLD, hAp, i (the mathematical treatment shows that the equivalent ratio for DBE is a dependent variable). The fit of amylose CLDs were implemented with a relatively new method, again with publicly available code [25,26,48]. The amylose fitting parameters, βAm, i and hAm,i, have the same meaning as those for amylopectin. Although the models are based on starch biosynthesis and are strictly applicable to unmodified native starch, the functional forms implicit in the models are sufficiently flexible that they can also be used to fit CLD data for modified starches, such as malt; however, then the parameters no longer have explicit biological interpretation.

4.18. Molecular Size Distributions of Soluble Starches in the Wort Samples

For all wort samples, with and without the addition of rice adjuncts, 1 mL of wort was firstly mixed with 4 mL of 95% ethanol solution to precipitate the soluble starch. After centrifuging for 10 min at 6000× g, another 4 mL of 95% ethanol solution was used to wash the precipitated starches and then was centrifuged. The residue was then mixed with 1 mL of lichenase solution (100 µL enzyme mixed with 2 mL sodium phosphate buffer (20 mM, pH = 6.5; Deltagen Australia Pty. Ltd. (14 Pacific Place, Kilsyth Victoria, 3137, Australia)) at 40 °C for 60 min and then was added to 8 mL of 95% ethanol solution to precipitate the soluble starch. Following centrifugation, the residue was then mixed with 1 mL of protease in tricine buffer (pH = 7.5, 250 mM) at 37 °C for 30 min and then mixed with 8 mL of 95% ethanol solution to precipitate the soluble starches. After centrifugation, the residue was dissolved with 1.5 mL of DMSO containing 0.5% LiBr for SEC analysis. For each wort, duplicate experiments were conducted.

4.19. Data Analysis

For the moisture content and DSC experiments, means and standard deviations were calculated for triplicate measurements. For other measurements, including HPLC, SEC and total starch content, means and standard deviations were calculated for duplicate measurements, as these duplicates showed good replicability. Two-tail tests were carried out to determine significant differences between two different factors, and p ≤ 0.05 and p ≤ 0.01 were used as thresholds of significance and extreme significance, respectively. Statistical significance was analysed using one-way ANOVA with Duncan adjustment at p < 0.05. The general linear model was used to analyse the overall effects of the rice adjuncts on both the mashing and fermentation processes. Data analysis was carried out using IBM SPSS Statistics version 21.

5. Conclusions

In brewing, multiple factors (enzyme activities, protein compositions and gelatinisation characteristics of starches from the barley) can affect mashing and the performance of fermentation. In our previous study, we gave the possible mechanism for barley starch structural effects on the release of fermentable sugars during mashing. In the present study, three different commercial barley malts were used, with the addition of three different rice varieties, which contained varied starch structure but very similar starch contents, used as adjuncts
The general results of this study are that the addition of rice adjuncts, with varied starch structures, will significantly increase the content of fermentable sugars during mashing. However, rice adjuncts do not necessarily increase the final ethanol concentration after yeast fermentation; rather, this is dependent on the properties of the barley malts in the brewing industry (e.g., enzyme activity and the soluble nitrogen content in the wort). However, rice adjuncts also have significant effects on the flavour of the beer and on the nutritional value of the product. This study has; thus, deepened the understanding of the importance of starch content and its structures on the performance of brewing.

Supplementary Materials

The following are available online at https://www.mdpi.com/2311-5637/4/4/103/s1.

Author Contributions

Experimental Design, W.Y. and G.F.; Experiments conduction, W.Y. and W.P.Q.; Writing—Original Draft Preparation, W.Y. and G.F.; Supervision, R.G.; Writing—Review & Editing, R.G. and C.L.; Project Administration, R.G. and G.F.

Funding

We gratefully acknowledge the support of the 2017 Jiangsu Innovation and Entrepreneurship Talents Program and of the National Science Foundation of China grant C1304013151101138. Wenwen Yu gratefully acknowledges the support of the China Scholarship Council and the University of Queensland. Cheng Li gratefully acknowledges the support of the Jiangsu Yangzhou Key Research and Development Program (No. SSF2018000008) and of the Yangzhou University Young Scientist Innovation Fund.

Conflicts of Interest

The authors declare no conflicts of interest.

References

  1. Walker, G.M.; Stewart, G.G. Saccharomyces cerevisiae in the production of fermented beverages. Beverages 2016, 2, 30. [Google Scholar] [CrossRef]
  2. Yu, W.; Zou, W.; Dhital, S.; Wu, P.; Gidley, M.J.; Fox, G.P.; Gilbert, R.G. The adsorption of α-amylase on barley proteins affects the in vitro digestion of starch in barley flour. Food Chem. 2018, 241, 493–501. [Google Scholar] [CrossRef] [PubMed]
  3. Agu, R.C. Some relationships between malted barleys of different nitrogen levels and the wort properties. J. Inst. Brew. 2003, 109, 106–109. [Google Scholar] [CrossRef]
  4. Evans, D.E.; Goldsmith, M.; Redd, K.S.; Nischwitz, R.; Lentini, A. Impact of mashing conditions on extract, its fermentability, and the levels of wort free amino nitrogen (FAN), beta-glucan, and lipids. J. Am. Soc. Brew. Chem. 2012, 70, 39–49. [Google Scholar]
  5. Gorinstein, S.; Zemser, M.; Vargas-Albores, F.; Ochoa, J.L.; Paredes-Lopez, O.; Scheler, C.; Salnikow, J.; Martin-Belloso, O.; Trakhtenberg, S. Proteins and amino acids in beers, their contents and relationships with other analytical data. Food Chem. 1999, 67, 71–78. [Google Scholar] [CrossRef]
  6. Procopio, S.; Krause, D.; Hofmann, T.; Becker, T. Significant amino acids in aroma compound profiling during yeast fermentation analyzed by PLS regression. LWT Food Sci. Technol. 2013, 51, 423–432. [Google Scholar] [CrossRef]
  7. Evans, D.E.; Dambergs, R.; Ratkowsky, D.; Li, C.; Harasymow, S.; Roumeliotis, S.; Eglinton, J.K. Refining the Prediction of Potential Malt Fermentability by Including an Assessment of Limit Dextrinase Thermostability and Additional Measures of Malt Modification, Using Two Different Methods for Multivariate Model Development. J. Inst. Brew. 2010, 116, 86–96. [Google Scholar] [CrossRef] [Green Version]
  8. Espinosa-Ramirez, J.; Perez-Carrillo, E.; Serna-Saldivar, S.O. Maltose and glucose utilization during fermentation of barley and sorghum lager beers as affected by beta-amylase or amyloglucosidase addition. J. Cereal Sci. 2014, 60, 602–609. [Google Scholar] [CrossRef]
  9. MacGregor, A.W.; Bazin, S.L.; Macri, L.J.; Babb, J.C. Modelling the contribution of alpha-amylase, beta-amylase and limit dextrinase to starch degradation during mashing. J. Cereal Sci. 1999, 29, 161–169. [Google Scholar] [CrossRef]
  10. Evans, D.E.; Collins, H.; Eglinton, J.; Wilhelmson, A. Assessing the impact of the level of diastatic power enzymes and their thermostability on the hydrolysis of starch during wort production to predict malt fermentability. J. Am. Soc. Brew. Chem. 2005, 63, 185–198. [Google Scholar] [CrossRef]
  11. Duke, S.H.; Henson, C.A. A Comparison of Barley Malt Amylolytic Enzyme Activities as Indicators of Malt Sugar Concentrations. J. Am. Soc. Brew. Chem. 2009, 67, 99–111. [Google Scholar] [CrossRef]
  12. Evans, D.E.; Fox, G.P. Comparison of Diastatic Power Enzyme Release and Persistence During Modified Institute of Brewing 65 degrees C and Congress Programmed Mashes. J. Am. Soc. Brew. Chem. 2017, 75, 302–311. [Google Scholar]
  13. Fox, G.; Yu, W.; Nischwitz, R.; Harasymow, S. Variation in maltose in sweet wort from barley malt and rice adjuncts with differences in amylose structure. J. Inst. Brew. 2018. [Google Scholar] [CrossRef]
  14. Gous, P.W.; Fox, G.P. Review: Amylopectin synthesis and hydrolysis - Understanding isoamylase and limit dextrinase and their impact on starch structure on barley (Hordeum vulgare) quality. Trends Food Sci. Technol. 2017, 62, 23–32. [Google Scholar] [CrossRef]
  15. Gous, P.W.; Warren, F.; Mo, O.W.; Gilbert, R.G.; Fox, G.P. The effects of variable nitrogen application on barley starch structure under drought stress. J. Inst. Brew. 2015, 121, 502–509. [Google Scholar] [CrossRef] [Green Version]
  16. Tester, R.F. Influence of growth conditions on barley starch properties. Int. J. Biol. Macromol. 1997, 21, 37–45. [Google Scholar] [CrossRef]
  17. Swanston, J.S.; Ellis, R.P.; Stark, J.R. Effects on grain and malting quality of genes altering barley starch composition. J. Cereal Sci. 1995, 22, 265–273. [Google Scholar] [CrossRef]
  18. Bamforth, C.W. Brewing and brewing research: Past, present and future. J. Sci. Food Agric. 2000, 80, 1371–1378. [Google Scholar] [CrossRef]
  19. Bamforth, C.W. Current perspectives on the role of enzymes in brewing. J. Cereal Sci. 2009, 50, 353–357. [Google Scholar] [CrossRef]
  20. De Rouck, G.; Jaskula, B.; De Causmaecker, B.; Malfliet, S.; Van Opstaele, F.; De Clippeleer, J.; De Brabanter, J.; De Cooman, L.; Aerts, G. The Influence of Very Thick and Fast Mashing Conditions on Wort Composition. J. Am. Soc. Brew. Chem. 2013, 71, 1–14. [Google Scholar] [CrossRef]
  21. Agu, R.C.; Palmer, G.H. alpha-Glucosidase activity of sorghum and barley malts. J. Inst. Brew. 1997, 103, 25–29. [Google Scholar] [CrossRef]
  22. You, S.G.; Izydorczyk, M.S. Molecular characteristics of barley starches with variable amylose content. Carbohydr. Polym. 2002, 49, 33–42. [Google Scholar] [CrossRef]
  23. Yu, W.; Tan, X.; Zou, W.; Hu, Z.; Fox, G.P.; Gidley, M.J.; Gilbert, R.G. Relationships between protein content, starch molecular structure and grain size in barley. Carbohydr. Polym. 2017, 155, 271–279. [Google Scholar] [CrossRef] [PubMed]
  24. Tao, K.; Li, C.; Yu, W.; Gilbert, R.G.; Li, E. How amylose molecular fine structure of rice starch affects functional properties. Carbohydr. Polym. 2009, 204, 24–31. [Google Scholar] [CrossRef] [PubMed]
  25. Yu, W.; Li, H.; Zou, W.; Tao, K.; Zhu, J.; Gilbert, R.G. Using starch molecular fine structure to understand biosynthesis-structure-property relations. Trends Food Sci. Technol. 2018. [Google Scholar] [CrossRef]
  26. Yu, W.; Tao, K.; Gilbert, R.G. Improved methodology for analyzing relations between starch digestion kinetics and molecular structure. Food Chem. 2018, 264, 284–292. [Google Scholar] [CrossRef] [PubMed]
  27. Gu, R.C. A comparison of maize, sorghum and barley as brewing adjuncts. J. Inst. Brew. 2002, 108, 19–22. [Google Scholar]
  28. Rubsam, H.; Gastl, M.; Becker, T. Influence of the range of molecular weight distribution of beer components on the intensity of palate fullness. Eur. Food Res. Technol. 2013, 236, 65–75. [Google Scholar] [CrossRef]
  29. Rubsam, H.; Gastl, M.; Becker, T. Determination of the influence of starch sources and mashing procedures on the range of the molecular weight distribution of beer using field-flow fractionation. J. Inst. Brew. 2013, 119, 139–148. [Google Scholar] [CrossRef]
  30. Yu, W.; Tao, K.; Gidley, M.J.; Fox, G.P.; Gilbert, R.G. Molecular brewing: Molecular structural effects involved in barley malting and mashing. Carbohydr. Polym. 2019, 206, 583–592. [Google Scholar]
  31. Zou, W.; Sissons, M.; Gidley, M.J.; Gilbert, R.G.; Warren, F.J. Combined techniques for characterising pasta structure reveals how the gluten network slows enzymic digestion rate. Food Chem. 2015, 188, 559–568. [Google Scholar] [CrossRef] [PubMed] [Green Version]
  32. Hall, R.S.; Manners, D.J. The action of malted-barley alpha-amylase on amylopectin. Carbohydr. Res. 1978, 66, 295–297. [Google Scholar] [CrossRef]
  33. Baldwin, A.J.; Egan, D.L.; Warren, F.J.; Barker, P.D.; Dobson, C.M.; Butterworth, P.J.; Ellis, P.R. Investigating the Mechanisms of Amylolysis of Starch Granules by Solution-State NMR. Biomacromolecules 2015, 16, 1614–1621. [Google Scholar] [CrossRef] [PubMed]
  34. Warren, F.J.; Royall, P.G.; Gaisford, S.; Butterworth, P.J.; Ellis, P.R. Binding interactions of α-amylase with starch granules: The influence of supramolecular structure and surface area. Carbohydr. Polym. 2011, 86, 1038–1047. [Google Scholar] [CrossRef]
  35. Bamforth, C.; Martin, H.L. The degradation of β-glucan during malting and mashing: The role of β-glucanase. J. Inst. Brew. 1983, 89, 303–307. [Google Scholar] [CrossRef]
  36. Tester, R.F.; Morrison, W.R. Swelling and gelatinization of cereal starches. I. Effects of amylopectin, amylose, and lipids. Cereal Chem. 1990, 67, 551–557. [Google Scholar]
  37. Noda, T.; Takahata, Y.; Sato, T.; Suda, I.; Morishita, T.; Ishiguro, K.; Yamakawa, O. Relationships between chain length distribution of amylopectin and gelatinization properties within the same botanical origin for sweet potato and buckwheat. Carbohydr. Polym. 1998, 37, 153–158. [Google Scholar] [CrossRef]
  38. O’Connor-Cox, E.S.C.; Ingledew, W.M. Wort Nitrogenous Sources—Their Use by Brewing Yeasts: A Review. J. Am. Soc. Brew. Chem. 1989, 47, 102–108. [Google Scholar] [CrossRef]
  39. Mallawarachchi, K.S.; Bandara, L.R.L.M.; Dilshan, S.K.D.H.S.; Ariyadasa, T.U.; Gunawardena, S.H.P. Optimization of mashing process in beer production using rice as an adjunct. In Proceedings of the 2016 Moratuwa Engineering Research Conference (MERCon), Moratuwa, Sri Lanka, 5–6 April 2016; pp. 289–292. [Google Scholar]
  40. Zwietering, M.; Jongenburger, I.; Rombouts, F.; Van’t Riet, K. Modeling of the bacterial growth curve. Appl. Environ. Microbiol. 1990, 56, 1875–1881. [Google Scholar]
  41. Vilaplana, F.; Gilbert, R.G. Characterization of branched polysaccharides using multiple-detection size separation techniques. J. Sep. Sci. 2010, 33, 3537–3554. [Google Scholar] [CrossRef]
  42. Castro, J.V.; Ward, R.M.; Gilbert, R.G.; Fitzgerald, M.A. Measurement of the molecular weight distribution of debranched starch. Biomacromolecules 2005, 6, 2260–2270. [Google Scholar] [CrossRef] [PubMed]
  43. Fitzgerald, M.A.; Bergman, C.J.; Resurreccion, A.P.; Möller, J.; Jimenez, R.; Reinke, R.F.; Martin, M.; Blanco, P.; Molina, F.; Chen, M.-H.; et al. Addressing the Dilemmas of Measuring Amylose in Rice. Cereal Chem. 2009, 86, 492–498. [Google Scholar] [CrossRef]
  44. Vilaplana, F.; Hasjim, J.; Gilbert, R.G. Amylose content in starches: Toward optimal definition and validating experimental methods. Carbohydr. Polym. 2012, 88, 103–111. [Google Scholar] [CrossRef]
  45. Feng, G.; Flanagan, B.M.; Williams, B.A.; Mikkelsen, D.; Yu, W.; Gidley, M.J. Extracellular depolymerisation triggers fermentation of tamarind xyloglucan and wheat arabinoxylan by a porcine faecal inoculum. Carbohydr. Polym. 2018, 201, 575–582. [Google Scholar] [CrossRef] [PubMed]
  46. Wu, A.C.; Gilbert, R.G. Molecular weight distributions of starch branches reveal genetic constraints on biosynthesis. Biomacromolecules 2010, 11, 3539–3547. [Google Scholar] [CrossRef] [PubMed]
  47. Wu, A.C.; Morell, M.K.; Gilbert, R.G. A parameterized model of amylopectin synthesis provides key insights into the synthesis of granular starch. PLoS ONE 2013, 8, e65768. [Google Scholar] [CrossRef] [PubMed]
  48. Nada, S.S.; Zou, W.; Li, C.; Gilbert, R.G. Parameterizing amylose chain-length distributions for biosynthesis-structure-property relations. Anal. Bioanal. Chem. 2017, 409, 6813–6819. [Google Scholar] [CrossRef]
Figure 1. The weight chain length distributions of debranched malts and rice starches as a function of DP (degree of polymerization) (a); a comparison of a typical fit of the model to experiment for Malt 3 with (b) amylopectin and (c) amylose. Fitting parameters shown in Table 1. All data normalised to the maximum peak of amylopectin.
Fermentation 04 00103 g001
Figure 2. The SEC weight distributions (w(logRh)) of branched soluble starch polymers (extracted from wort after mashing) as a function of size (Rh). (a) The wort from pure malt samples; (c, e and g) different malts with all three different rice adjuncts; and (b, d, f and h) are the enlarged figures of the parts in the red boxes in (a, c, e and g), respectively. All peaks have been normalised to the highest peak of the figure. SEC parameters are shown in Table S1. All data are based on duplicate measurements.
Fermentation 04 00103 g002
Figure 3. Production of ethanol during fermentation of different barley malts with different rice adjuncts: Malt 1 (a); Malt 2 (b); Malt 3 (c); pure malt (d); and model fitting (e). Data was based on both biological and technical duplicate measurements.
Fermentation 04 00103 g003
Figure 4. Design of the mashing experiments with pure malts and with malts plus rice adjuncts. Each mashing experiment was conducted in duplicate.
Fermentation 04 00103 g004
Table 1. Chemical compositions, starch structural parameters and gelatinisation characteristics of both barley malt and rice samples 1.
Sample IDIndustrial UtilisationAmylose Content (%)Moisture
Content (%)
Protein
Content 2 (%)
Starch Content 2 (%)Enzyme Activity
α-amylase 2β-amylase 2Limit Dextrinase 2
Malt 1Pale(32.5 ± 3.2)a(2.3 ± 0.5)a(8.8 ± 0.1)b(58.3 ±0.6)a(239.3 ±1.0)b(99.3 ± 2.9)a(2.0 ± 0.2)a
Malt 2Amber(32.3 ± 1.1)a(3.1 ± 0.4)a(8.4 ± 0.1)a(56.6 ±1.3)a(202.6 ±10.2)a(147.2 ± 3.8)b(9.7 ± 0.3)c
Malt 3Ale(32.0 ± 0.8)a(2.3 ± 0.3)a(9.0 ± 0.0)b(62.0 ±0.4)b(433.6 ±5.1)c(98.8 ± 1.0)a(3.2 ± 0.3)b
Rice 1Food (19.6 ± 0.0)a(11.8 ± 0.7)a(12.5 ± 0.1)b(78.2 ±2.0)aNDNDND
Rice 2Food(18.2 ±0.4)a(12.4 ± 0.3)a(13.9 ± 0.1)a(79.6 ±2.9)aNDNDND
Rice 3Food(27.6 ± 1.1)b(11.8 ± 0.4)a(11.7 ± 0.0)c(81.3 ±1.2)aNDNDND
Amylose and amylopectin fitting parameters
hAm, 3 × 10²hAm, 2 × 10²hAm, 1 × 10²βAm, 3 × 10⁴βAm, 2 × 10⁴βAm, 1 × 10³hAp, 1hAp, 2 × 10²hAp, 3 ×10⁴βAp, 1 × 10²βAp, 2 × 10²βAp, 3 × 10²
Malt 1(15.9 ± 1.9)a(10.4 ± 1.8)a(3.5 ± 2.1)a(5.8 ± 0.1)a(23.1 ± 0.4)a(12.4 ± 0.15)a(1.0 ± 0.0)b(2.4 ± 0.0)b(8.2 ± 0.1)a(10.4 ± 0.1)a(5.5 ± 0.2)a(2.7 ± 0.0)a
Malt 2(14.5 ± 0.8)a(11.9 ± 1.1)a(3.4 ± 0.4)a(6.2 ± 0.1)b(22.2 ± 0.2)a(14.0 ± 1.4)a(1.0 ± 0.0)b(2.3 ± 0.0)ab(7.1 ± 0.0)a(10.5 ± 0.1)a(5.5 ± 0.1)a(2.8 ± 0.0)a
Malt 3(12.3 ± 8.8)a(13.3 ± 10.5)a(3.7 ± 0.7)a(7.5 ± 0.6)c(26.0 ± 4.0)a(13.0 ± 1.36)a(1.1 ± 0.0)b(2.3 ± 0.0)a(6.9 ± 0.0)a(10.4 ± 0.0)a(5.4 ± 0.1)a(2.8 ± 0.2)a
Rice 1(8.1 ± 0.2)b(4.7 ± 0.10)a(3.0 ± 0.2)a(7.2 ± 0.0)a(28.7 ± 0.7)a(12.9 ± 0.5)a(0.9 ± 0.0)a(3.4 ± 0.0)c(9.4 ± 1.3)a(12.0 ± 0.1)c(6.9 ± 0.2)c(4.5 ± 0.1)d
Rice 2(7.3 ± 0.3)a(4.0 ± 0.1)a(2.6 ± 0.2)a(7.0 ± 0.1)a(29.9 ± 0.9)a(12.9 ± 0.5)a(0.9 ± 0.0)a(3.5 ± 0.0)c(8.7 ± 0.6)a(11.7 ± 0.0)b(6.6 ± 0.1)c(4.1 ± 0.0)c
Rice 3(9.1 ± 0.3)c(8.4 ± 1.4)b(7.2 ± 0.3)b(7.8 ± 0.9)a(31.5 ± 1.5)a(13.5 ± 0.6)a(1.0 ± 0.0)b(3.9 ± 0.1)d(19.1 ± 0.1)b(11.7 ± 0.0)b(6.0 ± 0.0)b(3.2 ± 0.1)b
Gelatinisation characteristics of malt and rice samples
ToTpTcEthalpy (J/g)
Malt 1(57.3 ± 0.2)a(63.3 ± 0.1)a(68.7 ± 0.0)a(6.7 ± 0.2)a
Malt 2(57.0 ± 0.3)a(63.2 ± 0.5)a(69.7 ± 0.2)b(6.5 ± 0.1)a
Malt 3(57.9 ± 0.5)a(62.9 ± 0.0)a(68.1 ± 0.3)a(7.2 ± 0.9)a
Rice 1(60.0 ± 0.1)b(67.8 ± 0.9)b(72.8 ± 0.2)b(9.8 ± 0.2)a
Rice 2(58.1 ± 0.1)a(64.9 ± 0.4)a(71.5 ± 0.7)a(9.5 ± 1.3)a
Rice 3(69.8 ± 0.2)c(74.2 ± 0.2)c(79.9 ± 0.4)c(9.9 ± 0.7)a
1 Mean and standard deviations based on duplicate measurements. 2 Data on dry basis. Values with different letters in the same column are significantly different at p < 0.05. Am: Amylose content covering DP 100–DP 10,000. ND, not detected
Table 2. The content of fermentable sugars in the wort after mashing 1,2.
Sample IDGlucose (mg/g)Sucrose (mg/g)Maltose (mg/g)Maltotriose (mg/g)Total Sugar (mg/g)
Pure Malt 1(44.4 ± 5.2)ab(32.3 ± 5.2)bc(463.8 ± 48.3)a(122.4 ± 13.7)ab(663.8 ± 72.4)a
Malt 1 + Rice 1 (42.0 ± 1.8)ab(31.1 ± 2.5)abc(541.6 ± 34.6)bc(135.9 ± 1.9)bc(750.6 ± 40.7)abc
Malt 1 + Rice 2(38.8 ± 2.7)a(28.1 ± 0.7)a(480.3 ± 16.2)ab(118.2 ± 10.7)ab(662.3 ± 30.2)a
Malt 1 + Rice 3(38.8 ± 4.1)a(27.0 ± 3.4)ab(506.1 ± 28.5)abc(131.6 ± 13.7)ab(703.5 ± 49.6)abc
Pure Malt 2(65.3 ± 5.3)f(36.4 ± 4.0)c(498.2 ± 37.0)abc(157.7± 8.0)d(757.6 ± 54.2)abc
Malt 2 + Rice 1(57.5 ± 0.6)e(31.8 ± 0.7)abc(552.6 ± 15.2)c(163.9 ± 7.1)d(805.8 ± 8.3)c
Malt 2 + Rice 2(56.3 ± 4.0)de(31.0 ± 3.4)abc(532.4 ± 44.4)abc(154.1 ± 10.1)cd(773.8 ± 61.9)bc
Malt 2 + Rice 3(57.0 ± 1.4)e(30.9 ± 4.7)abc(531.96 ± 22.0)abc(157.2 ± 7.5)d(777.0 ± 35.6)bc
Pure Malt 3(53.1 ± 3.3)cde(31.4 ± 3.9)abc(475.1 ± 21.9)ab(111.3 ± 6.0)a(670.8 ± 35.1)a
Malt 3 + Rice 1(49.2 ± 2.7)abc(28.4 ± 2.7)abc(540.6 ± 18.9)bc(119.3 ± 4.0)ab(737.5 ± 28.3)abc
Malt 3 + Rice 2(47.7 ± 0.7)bc(27.9 ± 0.6)ab(530.6 ± 5.3)abc(115.8 ± 0.8)ab(721.9 ± 4.4)abc
Malt 3 + Rice 3(44.5 ± 3.1)ab(24.9 ± 3.2)a(513.9 ± 12.3)abc(112.1 ± 8.1)a(695.4 ± 26.8)ab
1 Data has been normalised to per gram of dry flour. 2 Mean ± Standard Deviation is calculated from both biological and technical duplicates. Values with different letters in the same column are significantly different with p < 0.05.
Table 3. The soluble starch and nitrogen contents in the wort samples after mashing.
Soluble Starch Content (mg/mL) 1Soluble Nitrogen Content (mg/ mL) 1
Pure Malt 1(1.5 ± 0.1)d(182.1 ± 46.7)bc
Malt 1 + Rice 1(1.9 ± 0.0)f(147.0 ± 10.1)abc
Malt 1 + Rice 2(1.7 ± 0.0)ef(147.8 ± 0.4)abc
Malt 1 + Rice 3(1.7 ± 0.0)ef(145.6 ± 9.6)ab
Pure Malt 2(0.7 ± 0.1)a(185.6 ± 24.4)c
Malt 2 + Rice 1(1.1 ± 0.1)b(147.9 ± 6.6)abc
Malt 2 + Rice 2(1.1 ± 0.1)b(153.7 ± 3.2)abc
Malt 2 + Rice 3(1.0 ± 0.0)b(145.4 ± 1.9)ab
Pure Malt 3(1.3 + 0.1)c(147.4 ± 1.2)abc
Malt 3 + Rice 1(1.6 ± 0.0)e(142.6 ± 7.8)ab
Malt 3 + Rice 2(1.7 ± 0.0)e(146.5 ± 3.8)abc
Malt 3 + Rice 3(1.7 ± 0.1)ef(137.6 ± 5.6)a
1 Data were based on duplicate measurements. Values with different letters in the same column are significantly different at p < 0.05.
Table 4. Final ethanol concentration after fermentation and the model fitting parameters of ethanol production during fermentation 1.
Sample IDExperimental ParameterModel Fitting Parameters
CExp × 102 (%)Cfinal × 102 (%)k × 10 (% h-1)T (h)
Pure Malt 1(72.5 ± 14.5)a(72.0 ± 11.4)a(2.0 ± 0.1)abc(5.8 ± 1.1)a
M1 + Rice 1(65.3 ± 0.0)a(66.4 ± 0.3)a(1.6 ± 0.1)ab(9.5 ± 2.1)a
M1 + Rice 2(65.7 ± 0.4)a(66.4 ± 1.1)a(1.7 ± 0.1)abc(8.7 ± 3.7)a
M1 + Rice 3(66.6 ± 2.3)a66.8 ± 0.9)a(1.8 ± 0.3)abc(8.3 ± 1.4)a
Pure Malt 2(72.5 ± 12.9)a(75.3 ± 9.5)a(2.2 ± 0.5)bc(8.7 ± 2.9)a
M2 + Rice 1(71.8 ± 3.4)a(71.3 ± 2.3)a(1.9 ± 0.0)abc(11.9 ± 7.4)a
M2 + Rice 2(72.8 ± 1.2)a(72.0 ± 0.6)a(2.3 ± 0.2)c(7.9 ± 2.1)a
M2 + Rice 3(72.8 ± 1.1)a(72.0 ± 1.7)a(1.1 ± 0.2)abc(5.3 ± 0.9)a
Pure Malt 3(63.5 ± 1.8)a(64.9 ± 1.1)a(1.5 ± 0.1)a(6.7 ± 1.6)a
M3 + Rice 1(67.4 ± 1.7)a(69.0 ± 0.6)a(1.6 ± 0.3)ab(8.2 ± 4.6)a
M3 + Rice 2(69.5 ± 1.9)a(72.0 ± 4.1)a(1.7 ± 0.2)abc(7.0 ± 1.0)a
M3 + Rice 3(68.4 ± 0.5)a(69.0 ± 0.3)a(1.7 ± 0.0)abc(8.7 ± 3.4)a
1 Mean ± Standard Deviation was based on both biological and technical replicates; CExp, the experimental concentration of ethanol at the end of five day’s fermentation; Cfinal is the potential maximum ethanol mass concentration; T is the lag phase time to ethanol production; and k is the maximum ethanol production rate. Values in the same column with different letters are significantly different at p < 0.05.
Table 5. Pearson correlations among fermentable sugars, fermentation parameters and chemical compositions of the malt and rice samples (n = 12).
Experimental ParameterModel Fitting ParametersFermentable SugarsTotalProtein
CExpCfinalkTGlucoseSucroseMaltoseMaltotrioseTotalSugar
Fermentable sugarsSucrose0.59 *0.550.53−0.070.72 **
Maltose0.150.19−0.010.450.24-0.06
Maltotriose0.70 *0.58 *0.70 *0.300.67 *0.59 *0.461.00
Total sugar0.540.510.420.400.65 *0.400.84 **0.85 **1.00
Total protein−0.62 *−0.51−0.60 *0.10−0.67 *−0.84 **0.25−0.62 *−0.281.00
Total starch−0.65 *−0.52−0.75 **−0.04−0.52−0.80 **0.20−0.73 **−0.320.83 **
Soluble nitrogen content0.62 *0.60 *0.63 *−0.190.380.76 **−0.490.28−0.06−0.72 **
Soluble starch content−0.73 **−0.66 *−0.70 *0.05−0.93 **−0.71 **−0.02−0.73 **−0.530.81 **
Amylose content−0.36−0.33−0.48−0.43−0.25−0.27−0.43−0.64 *−0.59 *0.03
Amylose fitting parametershAm, 30.07−0.060.22−0.21−0.290.31−0.65 *0.03−0.41−0.49
hAm, 2−0.14−0.04−0.34−0.340.26−0.02−0.21−0.45−0.26−0.05
hAm, 1−0.28−0.29−0.37−0.35−0.30−0.45−0.16−0.42−0.360.09
Amylopectin fitting parametershAp, 3−0.60 *−0.47−0.74 **−0.16−0.36−0.65 *0.02−0.75 **−0.410.59 *
hAp, 2−0.40−0.39−0.400.10−0.55−0.87 **0.46−0.270.010.74 **
hAp, 1−0.23−0.31−0.21−0.11−0.54−0.62 *0.09−0.16−0.150.24
* Correlation is significant at the 0.05 level (two-tailed); ** Correlation is significant at the 0.01 level (two-tailed); CExp is the experimental concentration of ethanol at the end of five days of fermentation; Cfinal is the potential maximum ethanol mass concentration; T is the lag phase time to ethanol production; and k is the maximum ethanol production rate.

