
Article

Comprehensive Changes in Phytochemical and Biological Activities Through the Fermentation Periods of Mul-Kimchi with Bitter Melon (Momordica charantia L.)

1
Department of Green Bio Science (BK21 Four), Agri-Food Bio Convergence Institute, Gyeongsang National University, 138-9 Naedong-ro, Jinju 52725, Republic of Korea
2
Gyeongnam Anti-Aging Research Institute, Sancheong-gun 52215, Republic of Korea
3
Division of Food Science and Technology, Gyeongsang National University, 501 Jinju-daero, Jinju 52828, Republic of Korea
*
Author to whom correspondence should be addressed.
These authors contributed equally to this work.
Fermentation 2026, 12(7), 328; https://doi.org/10.3390/fermentation12070328
Submission received: 7 June 2026 / Revised: 5 July 2026 / Accepted: 6 July 2026 / Published: 8 July 2026
(This article belongs to the Special Issue Bioactive Compounds and Functional Properties of Fermented Foods)

Abstract

Bitter melon (BM; Momordica charantia L.) is rich in phytochemicals and has been widely studied for its pharmacological effects. However, BM is mainly consumed as a tea, and its application in fermented foods remains limited. This study investigated changes in phenolic compounds, bioactive metabolites, antioxidant and enzyme inhibitory activities, and DNA-protective effects in mul-kimchi with bitter melon (MKBM). MKBM was prepared with different BM concentrations (0%, 10%, and 20%) and fermented for 0–12 days. The phenolic profile changed according to BM concentration and fermentation periods. Epicatechin and epigallocatechin gallate were detected from day 3 only in BM-treated groups (MKBM-10 and MKBM-20). On day 12, catechin was detected only in MKBM-20, reaching 64.42 μg/mL, whereas it was not detected in MKBM-0. MKBM-20 also showed the highest total phenolic and flavonoid contents on day 12. Antioxidant and digestive enzyme inhibitory activities increased during fermentation, and DNA protection against oxidative damage was enhanced by day 9. These results suggest that mul-kimchi fermentation can improve the functional potential of BM as a fermented food ingredient.

1. Introduction

Bitter melon (BM; Momordica charantia L.), a member of the family Cucurbitaceae, is cultivated in tropical and subtropical regions and is known by various names, such as bitter cucumber and karela depending on the region [1]. Numerous studies have demonstrated that BM extract lowers blood glucose levels and prevent diabetes by inhibiting adipocyte differentiation and stimulating insulin secretion [2,3,4]. Moreover, BM extract is rich in antioxidants that scavenge reactive oxygen species (ROS) and inhibit stress-induced lipid peroxidation [5]. Notably, gallic acid, chlorogenic acid, and caffeic acid, which are abundant in BM, are major phenolic compounds that act as powerful antioxidants and play a specific role in reducing the risk of developing cardiovascular disease and diabetes [6,7]. Furthermore, flavonoids, which are prevalent in the leaves, flowers, and roots of various plants, are powerful plant-based phenolic antioxidants that exhibit activity by donating hydrogen atoms to free radicals [8]. Nevertheless, BM is mainly consumed in the form of beverages, and research and development of BM-based foods remain insufficient. Additionally, because BM compounds exist in complex forms, it is necessary to utilize bioconversion metabolites through various biological enzymes [9].
The bioconversion of these compounds can be achieved through food processing techniques such as fermentation [10]. In particular, the fermentation of kimchi, which primarily uses vegetables as its major ingredient, is driven mainly by lactic acid bacteria and exerts effects in preventing various diseases, including antiaging through antioxidant activity [11]. Kimchi is a food prepared by fermenting salted radish and cabbage with various seasonings; the flavor of kimchi is determined by the types of various metabolites produced during the fermentation process, including organic acids, essential vitamins, and potent bioactive compounds [12,13]. Among the various types of kimchi, mul-kimchi differs from traditional kimchi in that it is prepared using a large amount of brine without including additives such as red chili powder and salted seafood [14]. Due to these characteristics, mul-kimchi exerts excellent effects in boosting immunity owing to its rich content of microorganisms, various trace elements, and vitamins [15]. It also significantly affects the changes in microbial communities and the metabolites generated during fermentation [16]. Based on these effects, research on kimchi fermentation has primarily focused on analyzing changes in microbial communities and quality characteristics [11,14]. While studies have reported on the potential to enhance antioxidant and bioactive properties through the use of various ingredients, there is a lack of comprehensive functional research evaluating the physicochemical properties, antioxidant activity, and DNA-protective effects of mul-kimchi with BM over the course of fermentation [17]. Hence, there exists a need for studies on antioxidant activities that can identify ROS inhibition mechanisms using fermented extracts and for studies that can confirm the functionality of fermented extracts through DNA-protective effects that can prevent DNA chains from breaking or base deformation due to oxidative stress [18,19].
Accordingly, in this study, we aimed to develop high-value bioconverted food products based on mul-kimchi fermentation technology to improve the functional properties of BM. Based on previous research, this study investigated the functional superiority of mul-kimchi with bitter melon (MKBM) by comparatively analyzing the types and total contents of compounds that change according to the fermentation periods and the amount of BM added. Moreover, to demonstrate the efficacy of MKBM, changes in the overall nutritional components, antioxidant activity, and DNA-protective effects were examined. Ultimately, the objective of this study was to highlight the superiority of MKBM as a natural alternative food and its utility as a functional material, focusing on its physiological indicators.

2. Materials and Methods

2.1. Materials, Reagents, and Instruments

2.1.1. Plant Materials

BM was harvested in the Sudong-myeon area of Hamyang-gun, Republic of Korea, between July and August 2023. It was supplied by the Hamyang Agricultural Corporation Association (Hamyang, Republic of Korea). Other ingredients, including young summer radish (yeolmu), onions, garlic, red chili peppers, Chinese chives, ginger, pear, sugar, salt, and wheat flour, were purchased from local markets (Jinju, Republic of Korea).

2.1.2. Culture Media, Chemicals, and Instruments

Viable cell numbers were determined using de Man, Rogosa, and Sharpe (MRS) agar (Difco, Becton Dickinson Co., Sparks, MD, USA). Diethylene glycol, 2 N Folin–Ciocalteu’s phenol reagent, 2,2-diphenyl-1-picrydrazyl (DPPH), 2,4,6-azino-bis (3-ethylbenzthiazoline-6-sulphnoic acid) (ABTS), and 2,4,6-tri (2-pyridyl)-1,3,5-triazine (TPTZ), all purchased from Sigma-Aldrich Co., were used for analyzing total phenolic (TP) and total flavonoid (TF) contents and antioxidant activities. α-Glucosidase, pancreatic lipase, p-nitrophenyl-α-D-glucopyranoside (p-NPG), and p-nitrophenyl-butyrate (p-NPB), all purchased from Sigma-Aldrich Co. (St. Louis, MO, USA), were used to determine enzyme activities. Acetic acid, water, methanol, and acetonitrile used for sampling, determining physiological activity, and device analysis were purchased from J.T. Baker (Phillipsburg, NJ, USA), and other reagents were purchased for analysis or class 1 if necessary. A total of 10 standard organic acids (oxalic, tartaric, malic, ascorbic, acetic, maleic, citric, succinic, fumaric, and glutaric acids); standard phenolic acids, such as gallic, protocatechuic, chlorogenic, p-hydroxybenzoic, vanillic, p-coumaric, ferulic, veratric, benzoic, and trans-cinnamic acids; and standard flavonoids, including catechin, epigallocatechin (EGC), epicatechin (EC), epigallocatechin gallate (EGCG), rutin, catechin gallate (CG), naringenin, and formononetin, were purchased from Sigma Aldrich (St. Louis, MO, USA). Methanol, acetonitrile, and water used as chromatographic solvents were purchased from J. T. Baker (Phillipsburg, NJ, USA). Other analytical-grade reagents were of special or first grade and were also purchased from Sigma-Aldrich. TP and TF contents and antioxidant activity were determined using spectrophotometer UV-1800 240 V (Shimadzu Corp., Kyoto, Japan). Organic acids, phenolic acids, and flavonoids were analyzed by HPLC (Agilent 1260 System, Agilent Technologies Inc., Waldbronn, Germany) fitted with a quaternary pump. Separation was performed on a TSK-ODS100Z C18 column (250 mm × 4.6 mm, 5 μm, Tosoh Corp., Tokyo, Japan).

2.2. Preparation of MKBM

MKBM was prepared as described previously by Cho et al. [20] with modifications. Trimmed young summer radish was cut into 8 cm pieces. BM was sliced, with the halves cut into half-moon pieces at 3 cm intervals. Both young summer radish and BM were soaked separately in 10% brine for 4 h at 30 °C. After salting, they were washed twice with water, drained for 1 h, and the final salt concentration was adjusted to 3%. Garlic chives and red chili peppers were cut to 8 cm and 4 mm lengths, respectively. Garlic and ginger were julienned and washed with water, and onions were peeled and cut into 5 mm slices. For the porridge base, 4 L water containing 50 g of wheat flour was boiled at 100 °C for 5 min with continuous stirring and then cooled to room temperature (25 ± 2 °C). Salt and sugar (50 g each) were mixed into the cooled porridge. Salted young summer radish and BM (3%, w/v each) were added to this porridge, followed by garlic chives, red chili peppers, garlic, and onions (50 g each), with ginger and pear (25 g each). According to the proportions of young summer radish and BM, the samples were prepared in three groups as follows: MKBM-0 (1050 g radish, 0 g BM), MKBM-10 (900 g radish, 150 g BM), and MKBM-20 (750 g radish, 300 g BM). The prepared MKBM was initially fermented at 25 °C for 6 h and then stored at 8 °C. Fermentation was continued for 12 days, during which samples were collected as required. At each sampling time point, 500 mL of supernatant and 250 g of solid fraction were separated and used for analysis (Table S1).

2.3. Determination of Physicochemical Properties and Viable Cell Numbers

pH and titratable acidity were determined according to a previously described method Lee et al. [21]. Briefly, fermented samples were homogenized using a blender (38BL54, Waring Co., Stamford, CT, USA) and centrifuged (CF-10, DAIHAN Scientific Co., Ltd., Wonju, Republic of Korea). Next, a 2 mL aliquot of the supernatant was collected, and the pH was measured using a pH meter. Titratable acidity was determined by titration with 0.1 N NaOH. Specifically, 2 mL of the supernatant was neutralized with 0.1 N NaOH to an endpoint of pH 8.2 ± 0.1. Titratable acidity, expressed as lactic acid (%), was calculated using the following equation:
Acidity (%, lactic acid) = [0.09 × 0.1 × (volume of 0.1 N NaOH, mL) × 1.002/sample volume (mL)] × 100
where “1.002” is the factor for 0.1 N NaOH, “0.1” is the molarity of NaOH, and “0.09” is the lactic acid correction factor of the sample.
Salinity was measured by collecting 2 mL of the supernatant and analyzing it using a digital salinometer (PAL-03S, ATAGO, Tokyo, Japan). For reducing sugar analysis, sample extracts were prepared by homogenizing fermented samples with a blender (38BL54, Waring Co., Stamford, CT, USA), followed by centrifugation (CF-10, DAIHAN Scientific Co., Ltd., Wonju, Republic of Korea), and collecting 20 mL of the supernatant. Reducing sugar content was determined using a slightly modified dinitrosalicylic acid (DNS) method described by Li et al. [22]. Briefly, 200 μL of the sample extract was mixed with 2 mL of 3,5-dinitrosalicylic acid reagent in a test tube and heated for 20 min at 100 ± 1 °C. After color development, the absorbance was measured at 570 nm. The reducing sugar content was quantified using a glucose standard curve. Viable cell numbers were determined as described previously Hwang et al. [23] with slight modifications. Each sample was serially diluted in sterile physiological saline solution and spread onto MRS agar plates. The plates were incubated for 48 h at 30 °C, and colonies with typical lactic acid bacterial morphology were counted. Results were expressed as log CFU/mL.

2.4. Determination of Organic Acids

Changes in the composition of organic acids during MKBM fermentation were analyzed by HPLC according to a previously reported method Cho et al. [24] with minor modifications. Samples were centrifuged for 15 min, and the resulting supernatant was filtered through a 0.45 µm membrane filter (Dismic-25CS, Toyo Roshi Kaisha Ltd., Tokyo, Japan). Organic acids were separated on a TSKgel ODS-100V column (4.6 mm × 250 mm, 5 µm; Tosoh Corp., Tokyo, Japan). The mobile phase was 0.1% phosphoric acid at a flow rate of 1.0 mL/min at 40 °C, and detection was accomplished at 210 nm using a UV detector. Organic acids were quantified by comparison with calibration curves prepared from corresponding standards analyzed under the same conditions.

2.5. Determination of Phenolic Acids and Flavonoids

Changes in the contents of phenolic acids and flavonoids during MKBM fermentation were analyzed by HPLC as described previously by Jeong et al. [25] with slight modifications. HPLC was performed using an Agilent 1200 platform (Agilent Technologies Inc., Waldbronn, Germany). Briefly, a sample supernatant was first filtered through a 0.45 µm membrane filter (Dismic-25CS, Toyoroshikasha, Tokyo, Japan) and then used as a test solution. Next, an XBridge™ C18 column (4.6 mm × 250 mm, 5 µm, Dublin, Ireland) was used as the analytical column. Solvant A was water containing 0.2% glacial acetic acid, and solvent B was acetonitrile containing 0.2% glacial acetic acid. Gradient conditions were based on solvent B and were as follows: 0 min, 0%; 3 min, 3%; 5 min, 5%; 8 min, 10%; 10 min, 15%; 13 to 14 min, 3%; 15 min, 5%; 17 min, 8%; 19 min, 10%; 20 min, 15%; 22 min, 20%; 24 to 25 min, 5%; 26 min, 15%; 27 min, 20%; 28 min, 30%; 30 min, 10%; 32 min, 40%; 35 min, 50%; 36 min, 60%; 37 min, 30%; 38 min, 40%; 40 min, 50%; 45 min, 60%; 55 min, 80%; 60 min, 90%; and 65 min, 100%. Next, the sample injection volume was 20 µL, and the mobile phase flow rate was maintained at 1 mL/min at 30 °C. Detection was then performed using a diode array detector at UV 280 nm for phenolic acid and UV 270 nm for flavonoids (Agilent Technologies, Santa Clara, CA, USA).

2.6. Preparation of Extracts

A 200 mL aliquot of MKBM was accurately weighed, mixed with 400 mL of 50% ethanol, and extracted at 300 rpm for 12 h. Based on previous research results indicating that 50% ethanol was suitable for recovering phenolic compounds, flavonoids, and other antioxidant-related components from plant fermentation materials, 50% ethanol was selected Park et al. [26]. The extract was then filtered through a 90 mm filter paper (Toyo Roshi Kaisha, Ltd., Tokyo, Japan). The filtrate was further filtered through a 0.45 µm membrane filter and used for TP and TF analysis. The remaining filtrate was concentrated under reduced pressure and freeze-dried at −70 °C to obtain powdered extracts. The freeze-dried powders were dissolved in 50% ethanol to prepare sample solutions at concentrations of 0.1, 0.25, 0.5, 0.75, and 1.0 mg/mL, which were used for antioxidant assays and enzyme inhibitory activity tests.

2.7. Determination of TP and TF Contents

TP contents were measured using the Folin–Denis method as described by Lee et al. [27]. Calibration solution was prepared at concentrations of 0.02, 0.04, 0.06, 0.08 and 0.1 mg/mL, and gallic acid was used as the conventional compound. Each sample extract (1 mL) and standard solution (1 mL) was added to 0.5 mL of 2 N Folin–Ciocâlteu’s phenol reagent in a test tube, and the mixture was allowed to stand for 3 min, after which 0.5 mL of 25% Na2CO3 was added, mixed thoroughly, reacted at 30 °C for 1 h, and centrifuged at 13,000 rpm for 1 min. Then, the absorbance was measured at 750 nm using a spectrophotometer. TPs were quantified using Equation (2) procured from the gallic acid standard curve. TP content was expressed in milligrams of gallic acid equivalents (GAE) per gram of sample. A750 was absorbance of reacted sample.
TP (GAE mg/L) = (A750 + 0.0021) ÷ 51.059
The TF contents were measured according to the method described previously by Lee et al. [27]. Standard solution was prepared at concentrations of 0.02, 0.04, 0.06, 0.08 and 0.1 mg/mL, and rutin was used as the conventional compound. In a test tube, 1 mL of diethylene glycol was added to 1 mL of the extract of each sample and standard solution, followed by vortex-mixing. Then, 0.02 mL of 1 N NaOH was added to the mixture and reacted for 1 h at 37 °C. Next, the absorbance was measured at 420 nm using a spectrophotometer. TFs were quantified using Equation (3) procured from the rutin standard curve. TF content was expressed in milligrams of rutin equivalents (RE) per gram of sample. A420 was absorbance of reacted sample.
TF (RE mg/L) = (A420 + 0.0015) ÷ 15.07

2.8. Determination of Antioxidant Activity

DPPH, ABTS, and hydroxyl (∙OH) radical scavenging activity were measured as described previously Cho et al. [28]. Briefly, 1.6 mL of 1.5 × 10⁻⁴ M DPPH solution was mixed with 0.4 mL of diluted sample solution and vortexed for 10 s. The mixture was allowed to stand at room temperature for 30 min, and then the absorbance was measured at 525 nm. The extraction solvent was used as the negative control instead of the sample. ABTS radicals were generated by reacting 10 mL of 7 mM ABTS with 10 mL of 2.45 mM K2S2O8 in the dark at room temperature for 12–16 h. The ABTS solution was diluted with methanol to obtain an absorbance of 0.70 ± 0.02 at 732 nm. Sample solution (0.2 mL) was mixed with 1.8 mL of ABTS solution and incubated for 3 min, and then the absorbance was measured at 732 nm. The extraction solvent was used as the negative control instead of the sample. After dispensing 0.4 mL of 10 mM FeSO4·7H2O–EDTA and 0.4 mL of 10 mM 2-deoxyribose into a test tube, 2.8 mL of the sample solution was added and thoroughly mixed. Next, 0.4 mL of 10 mM H2O2 was added, and the mixture was incubated for 4 h at 37 °C. Then, 2 mL of 1% thiobarbituric acid and 2 mL of 2.8% trichloroacetic acid were added. The mixture was heated at 100 °C for 20 min and cooling to room temperature. The absorbance was then measured at 520 nm using a spectrophotometer. For the negative control, PBS buffer (NaCl 8.76 g; NaH2PO4 0.11 g; Na2HPO4 0.596 g; pH 7.0) was used instead of the sample solution. The hydroxyl radical scavenging activity was calculated using the designated formula and expressed as a percentage. The DPPH, ABTS, and hydroxyl radical scavenging activities (%) were calculated as follows:
Radical scavenging activity (%) = (1 − absorbance of sample/absorbance of the control) × 100
applying the same procedure described for the antioxidant activity assay.

2.9. Determination of α-Glucosidase, α-Amylase, and Pancreatic Lipase Inhibition

The inhibitory activity of the extracts against α-glucosidase and pancreatic lipase enzymes was evaluated according to the method described by Lee et al. [27] with slight modifications. Briefly, 60 μL of each extract, 140 μL of either 1 U/mL α-glucosidase or pancreatic lipase, and 100 μL of 400 mM sodium phosphate buffer (pH 6.8) were added to a test tube. This mixture was pre-reacted for 10 min at 37 °C and then added to 200 μL of 10 mM p-NPG or p-NPB, dissolved in 400 mM sodium phosphate buffer (pH 6.8), and allowed to undergo reaction at 37 °C for 10 min. Finally, after adding 1500 μL of 100 mM Na2CO3 to stop the reaction, the absorbance was measured at 420 nm. The inhibitory activity of the extracts against α-amylase was confirmed using a previously reported method by Zhang et al. [29] with slight modifications. Each sample solution (40 μL) was mixed with 100 μL of α-amylase solution (1 U/mL) and 150 μL of 200 mM sodium phosphate buffer, followed by preincubation for 10 min at 37 °C. Next, 250 μL of 1% soluble starch dissolved in sodium phosphate buffer was added, and the mixture was incubated at 37 °C for an additional 10 min to initiate the reaction. The reaction was stopped by adding 250 μL of a color reagent containing 48 mM DNS and 30% sodium potassium tartrate in 0.5 M NaOH, followed by heating for 10 min at 100 °C. After cooling to room temperature, the absorbance was measured at 570 nm. The negative control was prepared using the extraction solvent instead of the sample solution. The inhibitory activity of the extracts against α-glucosidase, α-amylase, and pancreatic lipase was calculated as a percentage (%) using the following equation:
Enzyme inhibition (%) = (1 − absorbance of sample/absorbance of the control) × 100
applying the same procedure described for the enzyme inhibitory activity assay.

2.10. Determination of Oxidative DNA Damage Protection

The DNA-protective effect of the extracts was determined as described previously by Cho et al. [29] with slight modifications. MKBM samples were concentrated under reduced pressure, freeze-dried, and redissolved in 50% ethanol. Sample solutions were prepared at 2 mg/mL. Plasmid DNA (SK+ vector) was purified and dissolved in 2 × TE buffer (20 mM Tris–HCl and 2 mM EDTA). For each reaction, 1 µL of plasmid DNA was mixed with 20 µL of the sample solution. Fenton’s reagent (200 mM H2O2, 0.2 mM acetic acid, and 3.2 mM FeCl3) was used to induce oxidative DNA damage. The reaction mixtures were prepared as follows: negative control, 4 µL DNA + 40 µL DW; positive control, 4 µL DNA + 20 µL extraction solvent + 20 µL Fenton’s reagent; and sample group, 4 µL DNA + 20 µL sample solution + 20 µL Fenton’s reagent. All reaction mixtures were incubated for 1 h at 30 °C in a water bath. Then, 20 µL of 6 × loading dye was added, and 40 µL of each mixture was loaded on a 1.2% agarose gel; 8 µL of DNA size marker was loaded as a reference. Electrophoresis was conducted at 50 V for 1 h 20 min, and DNA band patterns were visualized to determined DNA protection. DNA band intensities were analyzed using the Image Lab software version 6.1 (Bio-Rad, Hercules, Contra Costa, CA, USA), and the DNA-protective effect (%) was calculated using the following formula:
DNA band protection (%) = (SF DNA band intensity/pUC18 plasmid DNA band intensity) × 100

2.11. Statistical and Data Processing

Each data point was obtained as the mean of five independent replicates (n = 5) ± standard deviation (SD). Statistical significance was determined using analysis of variance (ANOVA) performed using the SAS software (version 9.4, SAS Institute, Cary, NC, USA). Tukey’s multiple comparison test (p < 0.05) was used to confirm differences between groups. For PCA and clustering heatmap analyses, sample groups were defined based on the combined conditions of the amount of added BM and fermentation periods. Principal component analysis (PCA) and clustering heatmap analysis were conducted using the R software (version 4.3.3; R Core Team, 2023, Vienna, Austria). PCA was performed using the “prcomp” function, and results were visualized using the “ggplot2” package (version 3.5.1). Heatmap data were normalized using the Z-score formula as follows:
Z-score = (α − β)/σ
where α represents the data value, β is the mean, and σ is the SD.
Clustering analysis was visualized based on Pearson correlation distance and performed using Ward’s method in the “pheatmap” package (version 6.0) Lee et al. (2024) [27].

3. Results and Discussion

3.1. Changes in Physicochemical and Microbiological Properties During MKBM Fermentation

The physicochemical properties of MKBM after BM addition and 12 days of fermentation are shown in Table 1. pH values exhibited a significant decreasing trend in all groups as the fermentation progressed (MKBM-0: 6.12–4.01; MKBM-10: 5.99–3.90; MKBM-20: 5.92–3.85). In contrast, titratable acidity increased approximately 7-fold in the MKBM-0 group and 5-fold in both MKBM-10 and MKBM-20 groups. Salinity and reducing sugar content increased relatively modestly with increasing fermentation periods, indicating significant changes. Table 1 also shows the changes in total viable cell numbers during MKBM fermentation. At the initial stage (day 0), the total viable cell numbers were comparable among treatments, viz., MKBM-0 (4.84 log CFU/mL), MKBM-10 (5.03 log CFU/mL), and MKBM-20 (5.17 log CFU/mL). The microbial populations then increased sharply, reaching peak levels on day 3 at 9.25, 9.36, and 8.96 log CFU/mL in MKBM-0, MKBM-10, and MKBM-20 groups, respectively. From day 6 onward, the counts gradually declined, and by day 12, they were 6.44 log CFU/mL (MKBM-0), 7.11 log CFU/mL (MKBM-10), and 6.06 log CFU/mL (MKBM-20).
We describe the results of a general kimchi fermentation study in which the pH decreases due to the metabolism of microorganisms [30]. The production of lactic acid after kimchi fermentation is due to the decrease in pH, which contributes to extending the shelf life of the product and improving the storage stability by inhibiting the growth of spoilage and pathogenic microorganisms [31]. In contrast, this result differs from the typical pattern of decreasing reducing sugar levels observed during kimchi fermentation. Based on research indicating that reducing sugar content varies depending on the auxiliary ingredients used, this phenomenon can be attributed to the accelerated release of sugars resulting from carbohydrate hydrolysis and the weakening of cell wall structures within the BM during fermentation [2,32]. As shown in Table 1, a fermentation pattern is detected in which salt and inorganic substances present in MKBM promote viable cell growth in the early stages of fermentation; however, toward the latter half, the acidity increases and the number of viable cell numbers decrease due to nutrient depletion [33].

3.2. Changes in Organic Acid Contents During MKBM Fermentation

The changes in organic acid contents during MKBM fermentation according to BM addition are illustrated in Figure 1 and Table S2. Total organic acids were identified across all treatments, with MKBM-20 exhibiting the highest total organic acid contents. Lactic acid content showed the most significant increase during fermentation, viz., >2-fold in all groups (0.82–1.82 → 2.44–3.02 mg/mL). Oxalic acid and ascorbic acid contents also increased gradually. In particular, the ascorbic acid content in the MKBM-20 group increased from 1.25–2.22 mg/mL, showing a more distinct upward trend than that in the other treatment groups. Remarkably, succinic acid and tartaric acid contents, which were not detected at the beginning of fermentation in MKBM-0 and MKBM-10 groups, gradually increased as fermentation progressed (Figure 1A). Specifically, succinic acid content increased in MKBM-0 (0.38–0.74 mg/mL), MKBM-10 (0.39–0.85 mg/mL), and MKBM-20 (0.40–0.97 mg/mL) groups.
The PCA score plot summarizes the multivariate data of organic acid composition and illustrates the differences among samples according to fermentation periods and BM content (Figure 1B). The main components PC1 and PC2 accounted for 53.22% and 16.04% of the total variance, respectively, showing a distinct separation between classes. In particular, as the addition amount of BM and the fermentation periods increased, the same tendency was shown to move in the positive direction of PC1. The heatmap visualized the normalized correlation between the sample and the organic acid composition (Figure 1C). Organic acids that were not found in the group with low fermentation periods such as tartaric acid showed a pattern of accumulation as fermentation increased, and a more pronounced visual change was found especially in the group with high addition of BM. During food fermentation, organic acids such as lactic acid, oxalic acid, and ascorbic acid are produced through biological changes such as glycolysis, which is the process of obtaining energy and sugar metabolism in the form of simple sugars [34]. These representative organic acid families are end products produced by different metabolic processes depending on microorganisms [35,36]. Furthermore, aged brine, such as pickles, maintains a stable physicochemical and microbiological composition in which pH decreases as fermentation proceeds, and the reducing sugar content increases significantly and tends to accumulate large amounts of organic acids [37]. The contents of organic acids increased through fermentation; these acids exhibit antioxidant and anti-inflammatory properties and also exert various nutritional effects, thereby supporting the nutritional value of MKBM with significantly increased organic acid content [34].

3.3. Changes in Phenolic Acid Contents During MKBM Fermentation

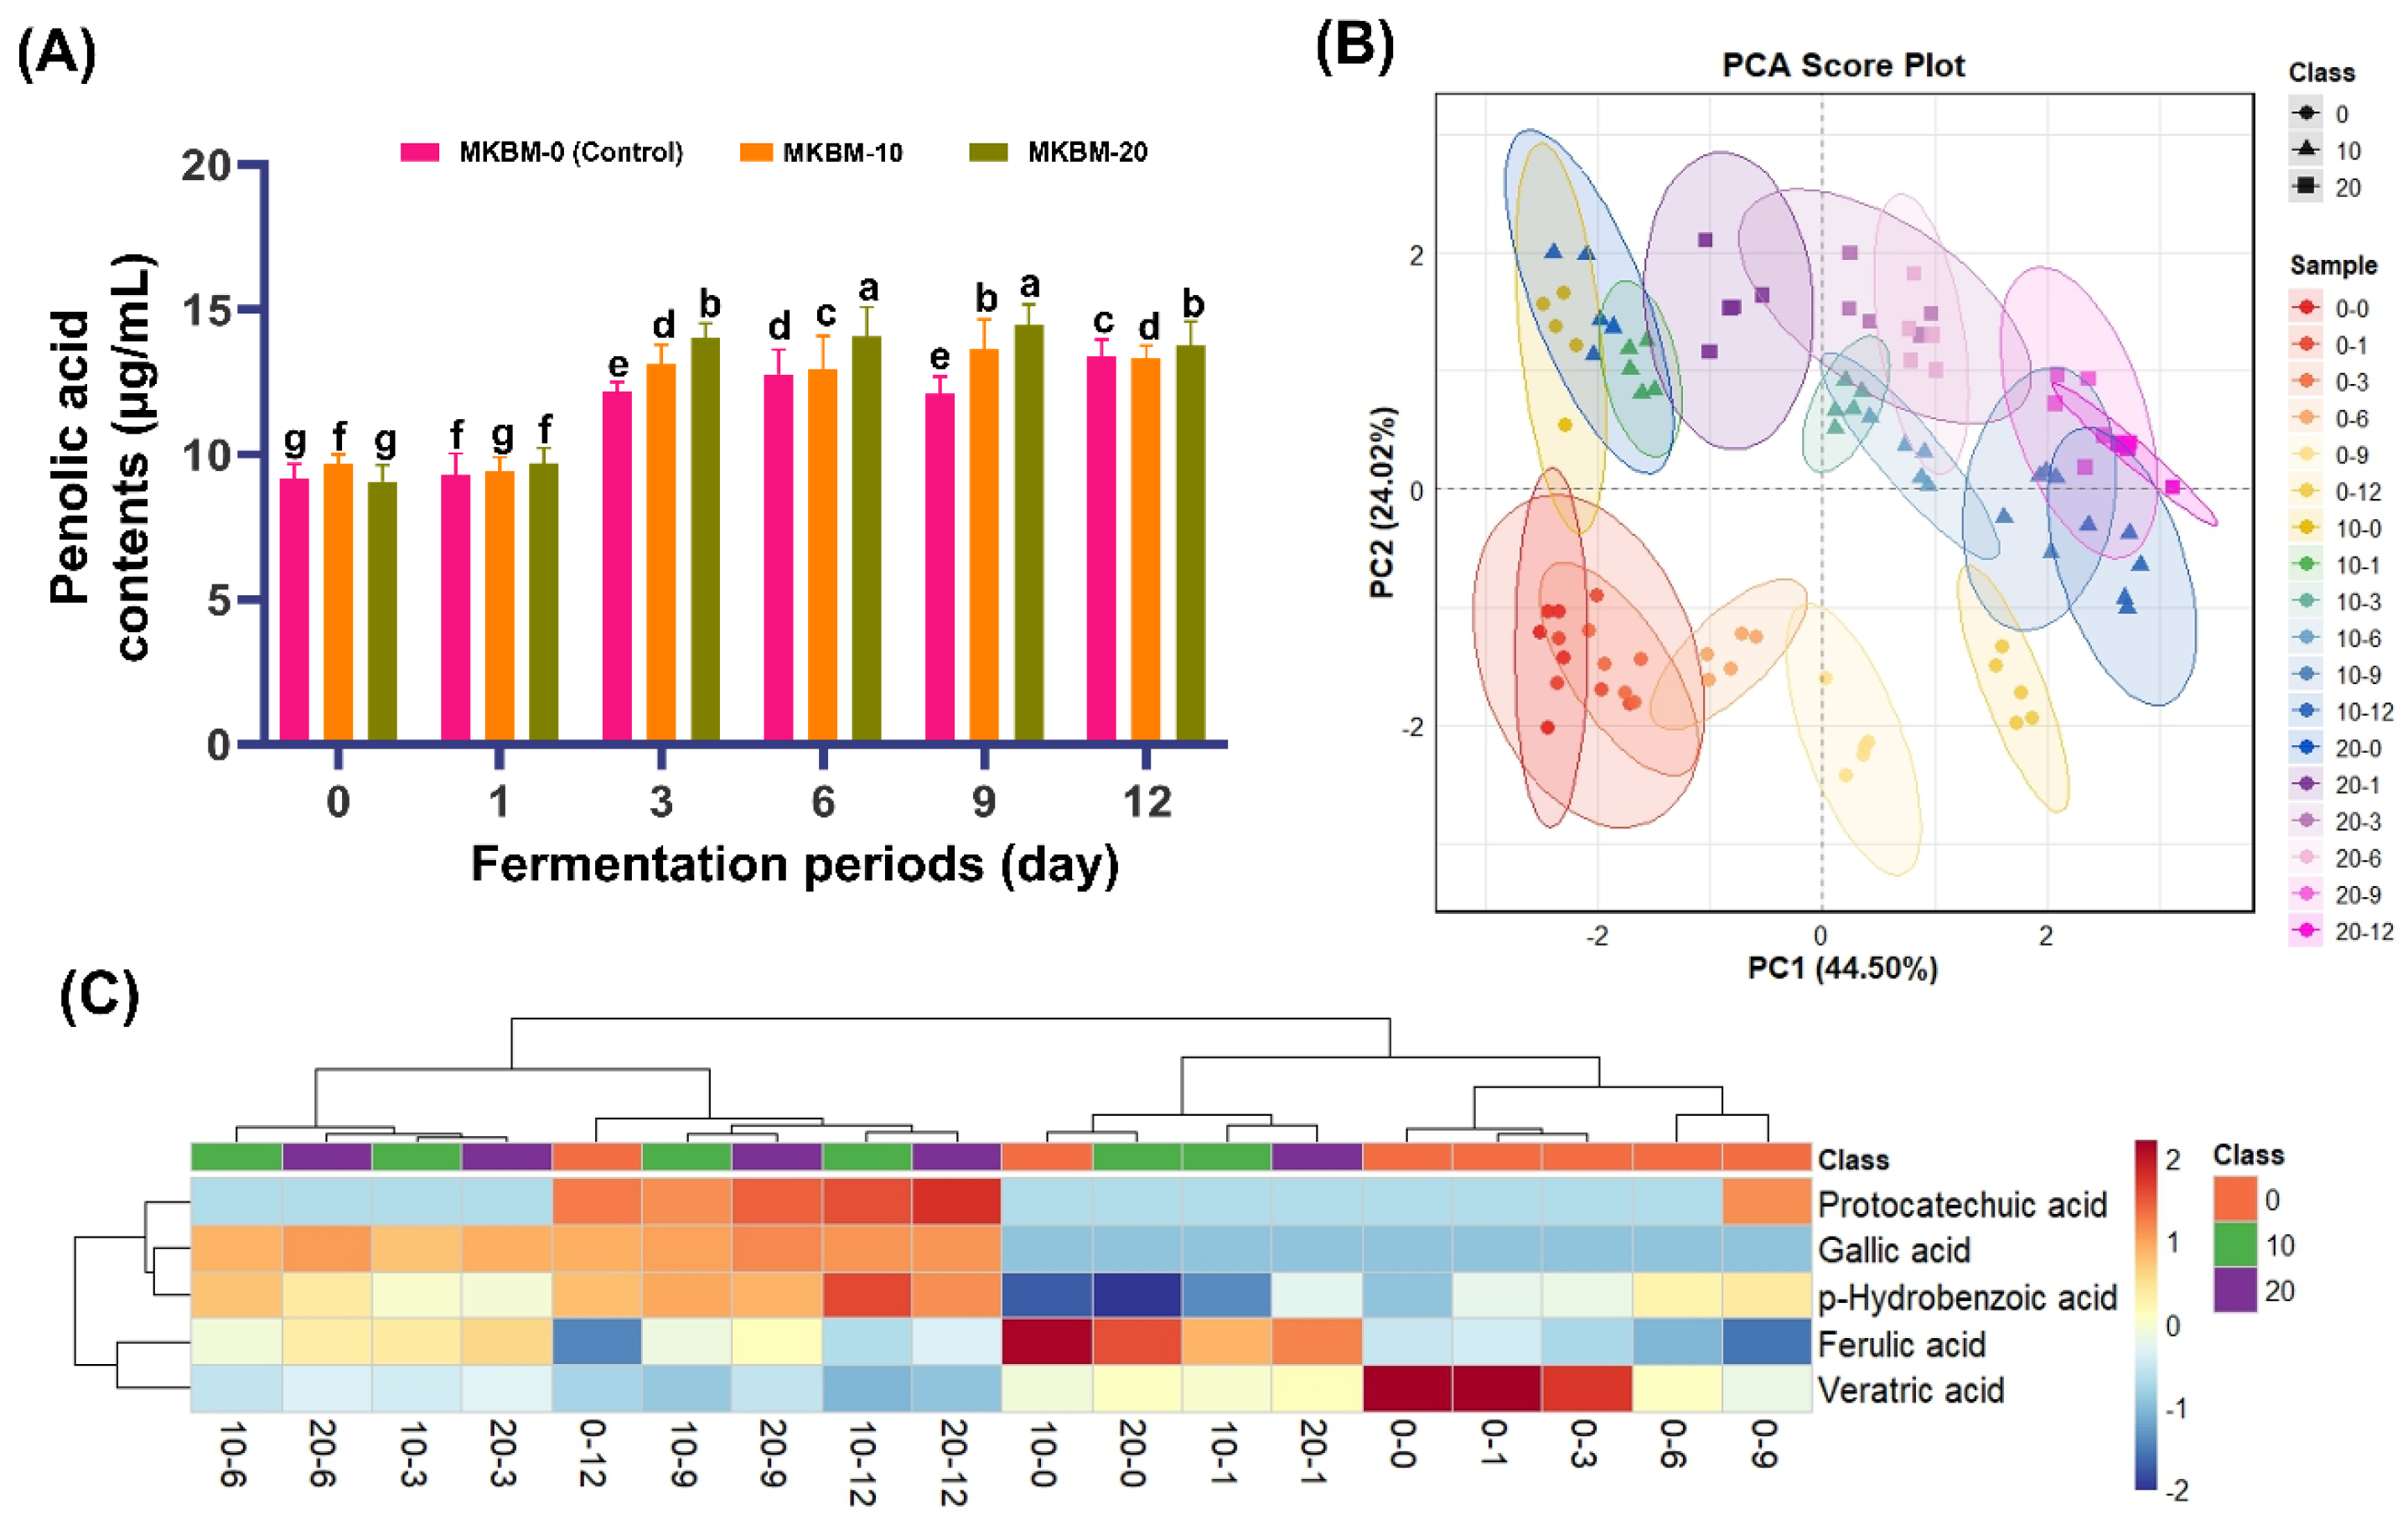
The changes in phenolic acid contents during MKBM fermentation according to BM addition are shown in Figure 2 and Table S3. Higher BM addition levels resulted in increased phenolic acid accumulation, characterized by a sharp increase on day 3 of fermentation, followed by stabilization during subsequent fermentation periods. However, ferulic acid and veratric acid contents showed a decreasing trend in all treatment groups. Ferulic acid content decreased from its initial concentration, decreasing from 5.78 to 4.54 µg/mL in the MKBM-20 group. Veratric acid content also decreased in all groups, reaching a final concentration of 1.58–1.81 µg/mL (Figure 2A and Table S3).
Conversely, among the 10 phenolic acids analyzed, p-hydroxybenzoic acid, ferulic acid, and veratric acid were detected from day 0 onward, whereas gallic acid and protocatechuic acid were newly generated and detected starting from day 3 and 9, respectively. Specifically, the content of gallic acid, which was first detected on day 3, increased significantly by day 12, exhibiting the highest accumulation in the MKBM-20 group (4.51–4.97 µg/mL). Protocatechuic acid content also displayed a similar pattern of emerging in the later stages of fermentation, reaching approximately 0.15–0.19 µg/mL across all treatment groups at the end of fermentation (Figure 2A). According to PCA results, the samples were clearly separated along the axis of PC1 (44.50%) according to BM concentration, and early and late fermentation samples grouped into separate clusters along the axis of PC2 (24.02%). This result indicates a clear difference between the samples, implying that the phenolic acid composition gradually changed with increases in the amount of BM added and the fermentation periods (Figure 2B). A similar distinct change in phenolic acid composition was detected in the heatmap analysis. Visual confirmation of gallic acid and protocatechuic acid, whose contents typically increased with increasing fermentation periods and BM addition, was demonstrated, and a strong positive correlation between the clusters was confirmed through visual demonstrations of ferulic acid and veratric acid, whose contents, conversely, tended to decrease with increasing fermentation periods (Figure 2C).
Phenolic acid, which is primarily present in the binding form, is hydrolyzed by enzymes or microorganisms and converted into free phenolic acid for absorption, with esterase and β-glucosidase being the major enzymes involved in the bioconversion pathway [38]. The major enzymes selectively decompose the ester bonds of phenolic acid derivatives present in the binding form, displaying a significant increase in the contents of free phenolic acid and gallic acid [39]. As a result of this study, the change in overall phenolic acid composition, including the high gallic acid accumulation observed in the MKBM-20 group, was interpreted as being related to the conversion of bound phenolic acids into a free form through microbial metabolism during the mul-kimchi fermentation process [31]. Conversely, ferulic acid and veratric acid contents exhibited a decreasing tendency (Figure 2A and Table S3), which demonstrates that they were consumed as precursors or substrates during the bioconversion process, had their own metabolic pathway that was decarbonized to other compounds, such as 4-vinylguaiacol or 4-vinyl catechol, or underwent phenolic acid reduction processes [6,40].

3.4. Changes in Flavonoids During MKBM Fermentation

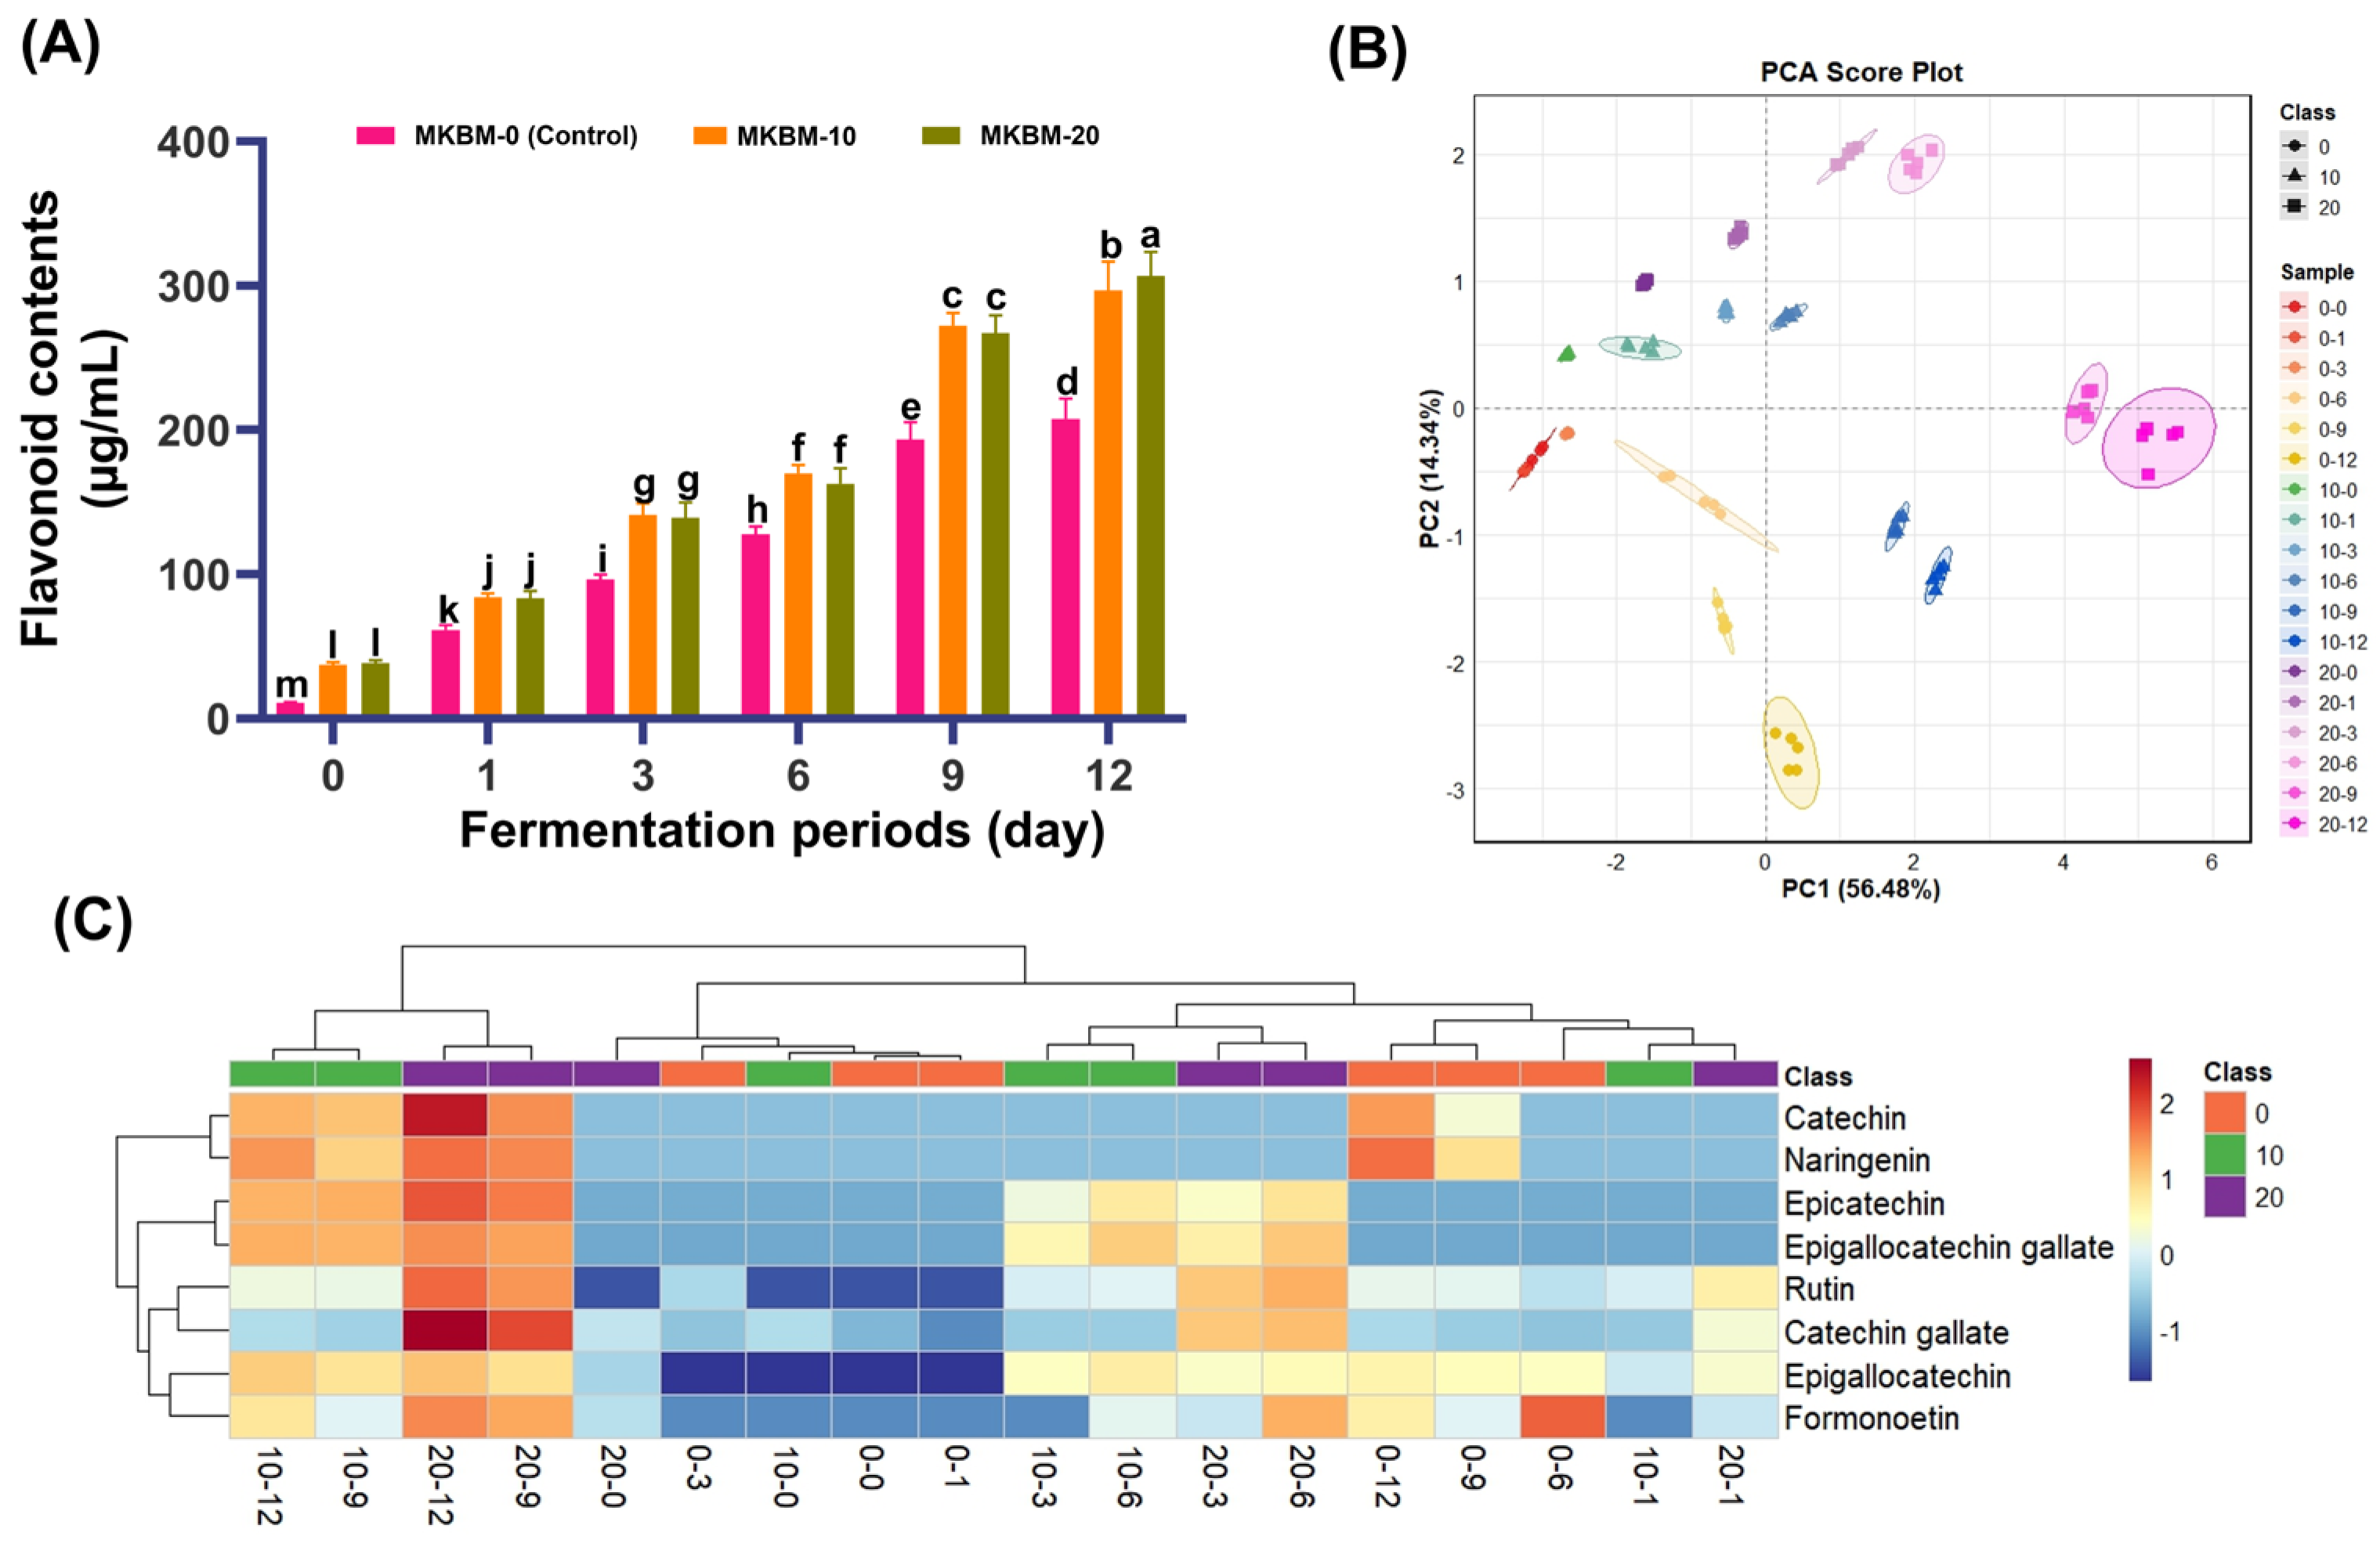
The changes in flavonoids during MKBM fermentation according to BM addition are depicted in Figure 3 and Table S4. The flavonoids increased >7-fold in all treatment groups than that before fermentation, exhibiting the most dramatic accumulation change among phenolic compounds. Remarkably, higher amounts of BM addition resulted in a concentration-dependent trend (MKBM-0: 32–207 µg/mL; MKBM-10: 35–289 µg/mL; and MKBM-20: 41–314 µg/mL) compared with the control group. In the control group, MKBM-0, the contents of compounds such as EGC, catechin, and naringenin were either undetected or remained at marginal levels during the initial stages of fermentation but exhibited a significant increasing trend from day 6 or 9 onward. Remarkably, catechin and naringenin were not detected in any treatment group until day 6 of fermentation, but they exhibited a characteristic pattern of new emergence on day 9 and rapid accumulation on day 12 of fermentation (MKBM-20: 64.42 and 19.45 µg/mL, respectively). Compared with the other treatment groups, the MKBM-20 group, which contained the highest BM concentration, showed the fastest and most abundant accumulation of overall flavonoids (Figure 3A and Table S4).
Moreover, EC and EGCG demonstrated compositional changes specifically detected only in the BM-added groups (MKBM-10 and MKBM-20). These compounds began to be detected from day 3 of fermentation and showed significantly increased levels to 32.46 and 39.67 µg/mL, respectively, in the MKBM-20 group by the end of fermentation. Other major components, including rutin and CG, also showed significantly higher final concentrations in the MKBM-20 group (48.21 µg/mL) than in MKBM-0 (12.05 µg/mL) and MKBM-10 (12.48 µg/mL) groups on day 12 of fermentation. PCA analysis revealed distinct clustering patterns based on the amount of BM added and the fermentation periods (PC1: 56.48%, PC2: 14.34%). The MKBM-20 group in the late fermentation stage was clearly distinguished from the other groups, reflecting compositional changes (Figure 3B). All three groups—MKBM-0, MKBM-10, and MKBM-20—showed a tendency to shift in the positive direction as fermentation progressed; notably, the MKBM-20 group at day 12 of fermentation was positioned furthest in the positive direction, exhibiting a distinct clustering pattern. The heatmap visualized confirmed the selective accumulation of catechin, EC, EGC, and rutin during the late fermentation stage. Consistent with the PCA results, the MKBM-20 group at day 12 of fermentation displayed a distinct red color, suggesting a positive correlation with the amount of BM added and the fermentation periods (Figure 3C).
Flavonoids, which are abundant in BM, are generally present as glycosides and can convert these glycosides into aglycones during fermentation to increase bioavailability in the human body [41,42]. In the present study, flavonoids, including catechin, naringenin, and EGC, which were not detected on day 0 were detected with longer fermentation periods (Figure 3). This finding indicates accumulation changes from galloylated catechin to degalloylated catechin and naringenin-7-O-glucoside through metabolic pathways involving naringenin [10,43]. Furthermore, EC and EGC accumulated only in the BM addition group according to the fermentation periods, indicating its detection through decomposition by microorganisms and enzymes generated as the flavonoid precursor present in BM progresses in fermentation [44].

3.5. Changes in TP and TF Contents During MKBM Fermentation

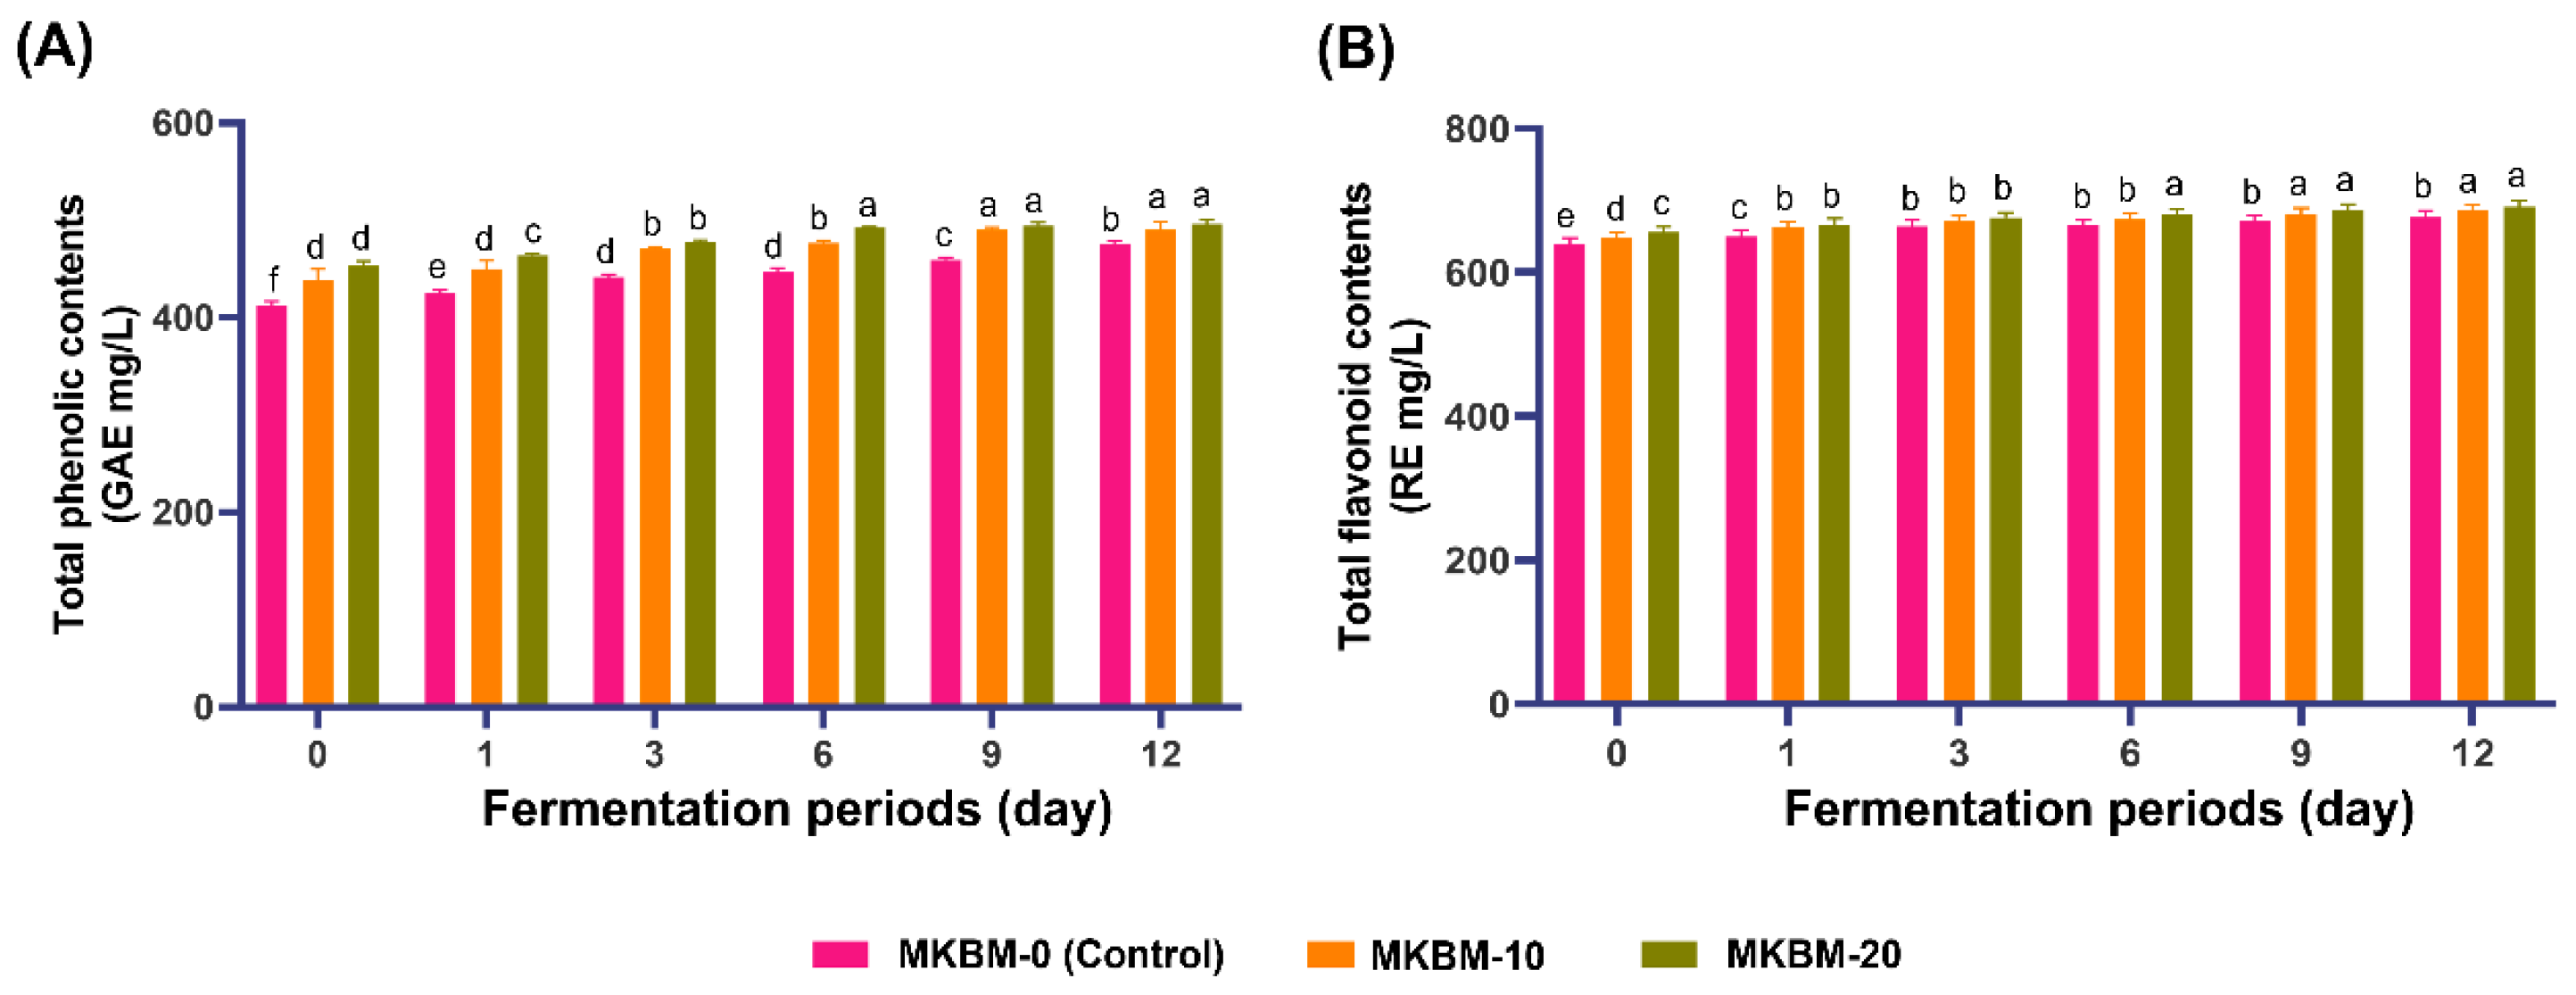
The changes in TP and TF contents during MKBM fermentation according to BM addition are shown in Figure 4. Both parameters exhibited a continuous upward trend throughout the fermentation periods, with significantly higher levels detected in the BM-supplemented groups than in the MKBM-0 control group. TP content was lowest in the MKBM-0 group but increased from day 0 (417.23 mg/L) to day 12 (479.94 mg/L). In comparison, the TP content in the MKBM-20 group increased from 461.65 to 517.17 mg/L during the same periods, consistently maintaining the highest concentration among all groups. The TF contents followed a similar pattern, increasing 621.38 to 662.60 mg/L in the MKBM-0 group and reaching 688.05 and 698.06 mg/L in MKBM-10 and MKBM-20 groups, respectively, by day 12. Overall, as fermentation progressed, TP and TF contents were the highest in the MKBM-20 group.
This study based on fermentation demonstrated a higher content change in TPs and TFs with an increase rate of approximately 1.5-fold than that demonstrated by a similar study of BM according to the extraction method [4]. Moreover, it has been reported that lactobacillus fermentation can contribute to increased TP and TF contents, which is attributed to enzymatic hydrolysis that exerts a significant effect on bioconversion [6]. These phenolic compounds play a vital role in the prevention of chronic diseases in the human body; MKBM, which exhibits a significant increase, has demonstrated its potential as a functional food [45].

3.6. Comparison of Antioxidant Activities and Digestive Enzyme Inhibitory Activity

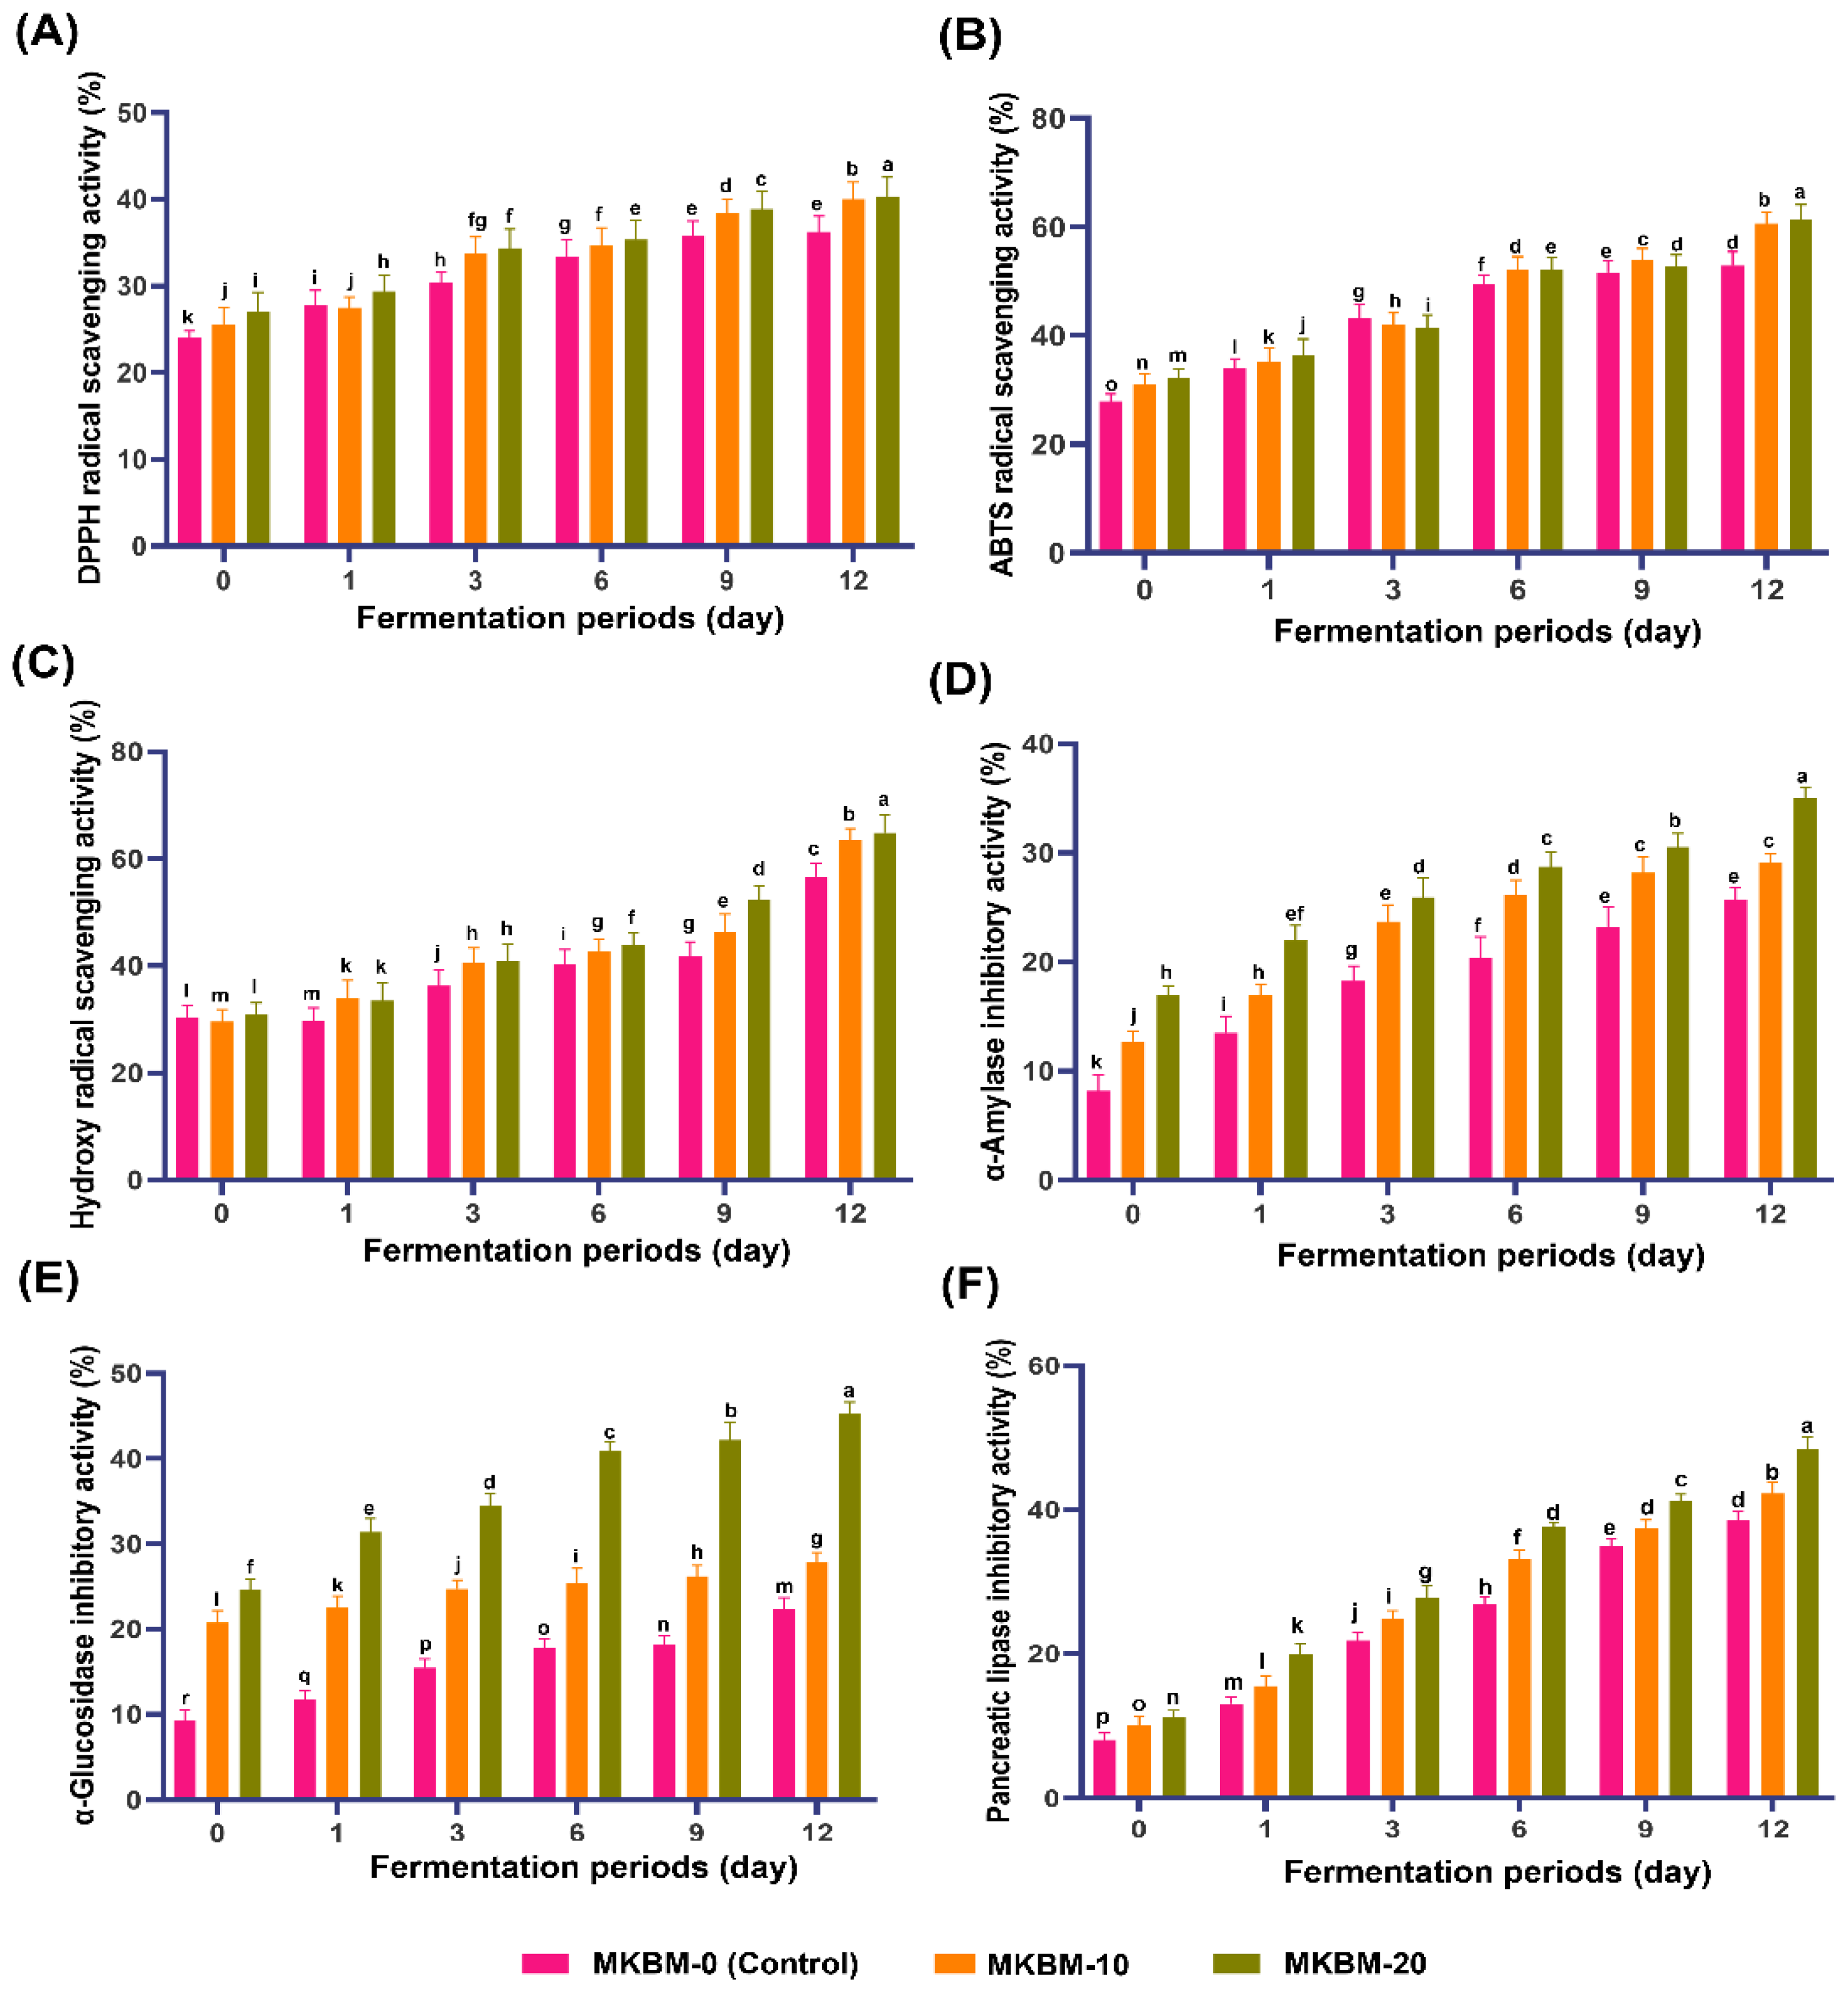
The antioxidant activities of MKBM according to fermentation periods and BM additions are depicted in Figure 5. The antioxidant capacity exhibited a positive correlation with both BM concentration and fermentation duration, and all antioxidant assays revealed similar trends. The DPPH radical scavenging activity increased progressively as fermentation advanced, particularly from day 0 to day 12, with higher BM addition amount resulting in greater activity (MKBM-20: 26.32–40.38%). A similar increasing trend was detected for the ABTS radical scavenging activity, indicating a strong antioxidant potential. Specifically, MKBM-0 (28.32–54.21%), MKBM-10 (30.98–61.88%), and MKBM-20 (32.35–63.32%) groups showed progressive increases in antioxidant activities, with the MKBM-20 group exhibiting the highest activity among the groups (Figure 5B). Regarding the ∙OH radical scavenging activity, the MKBM-20 group again exhibited the greatest change, increasing from 30.67% on day 0 to 65.02% on day 12, representing a >2-fold increase and the strongest antioxidant effect among the treatments (Figure 5C). Overall, the MKBM-20 group, containing the highest BM concentration, consistently demonstrated superior antioxidant performance throughout the fermentation process. The inhibitory activities of MKBM extracts against carbohydrate and lipid-digesting enzymes, including α-glucosidase, α-amylase, and pancreatic lipase, are illustrated in Figure 5D–F, which increased progressively during fermentation. During MKBM fermentation, the α-glucosidase inhibitory activity significantly increased over time (MKBM-20: 24.56–45.91%), and a similar pattern was detected for the α-amylase inhibitory activity. On day 12, the MKBM-20 group demonstrated the highest α-amylase inhibitory activity (35.86%) compared with the MKBM-0 group (25.97%). Among the enzyme inhibitory activities, the pancreatic lipase inhibitory effect was most prominent (Figure 5F), showing a markedly higher effect of approximately 7-fold than that in the control group (MKBM-0, day 0: 8.06%; MKBM-20, day 12: 47.49%).
The findings of this study are consistent with previous reports that phenolic acid accumulation results in increased physiological activity [46]. In particular, phenolic acid accumulation during plant fermentation is a consequence of improved electron extraction ability as the polysaccharide structure is transformed, and this has proven a positive correlation leading to increased physiological activity [46,47]. Although this study did not include a positive control, previous studies have reported that BM extract exhibits significant α-amylase and α-glucosidase inhibitory activity when compared to acarbose, a positive control [48,49]. These findings, similar to those of previous studies, suggest that physiologically active substances such as cucurbitan-type triterpenoids, phenolic acids, flavonoids contribute to blood sugar reduction, cholesterol reduction, and anti-inflammatory and anti-obesity effects and support the pharmacological efficacy of BM [1,50,51]. Therefore, the results of this study can support the enzyme inhibitory activity of MKBM based on previous studies that have confirmed the functional benefits and increased enzyme inhibitory activity through microbial fermentation.

3.7. Protective Effect Against Oxidative DNA Damage During MKBM Fermentation

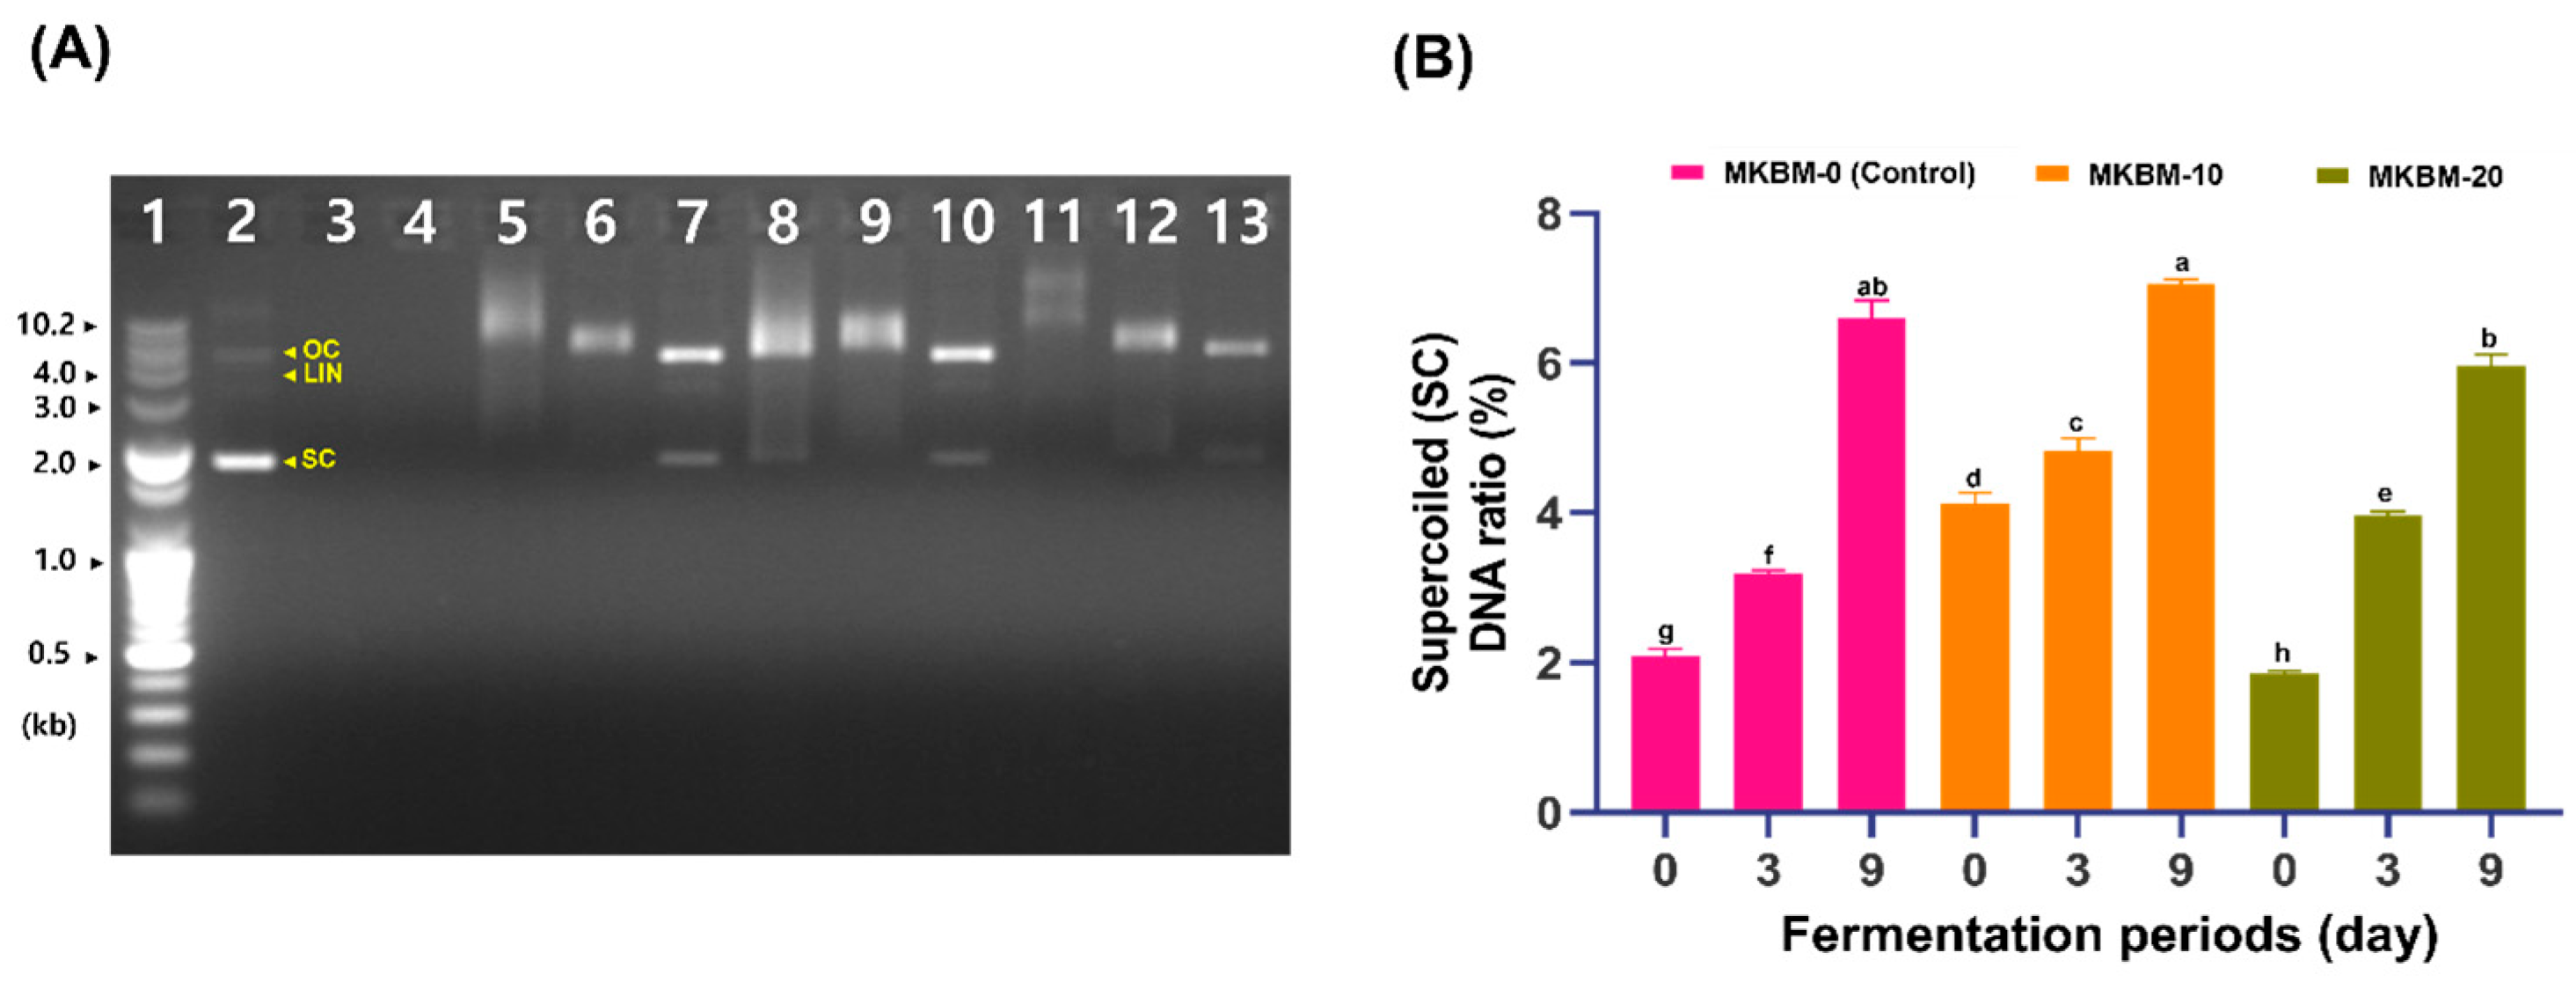
The protective effect of MKBM extracts against hydroxyl radical ∙OH-induced DNA damage is depicted in Figure 6. Based on preliminary experiments indicating that the supercoiled (SC) DNA band was first restored to a level comparable to that of the untreated control at day 9 of fermentation, representative fermentation stages (0, 3, and 9 days) were selected to evaluate the DNA-protective effects of MKBM-0, MKBM-10, and MKBM-20. In the early fermentation stages (days 0 and 3), MKBM-0, MKBM-10, and MKBM-20 extracts demonstrated limited protective efficacy, as indicated by the smeared DNA bands from oxidative DNA damage. However, on day 9, the SC band ratio became more prominent, displaying an electrophoretic pattern similar to that of the positive control group not exposed to oxygen. In the case of the MKBM extract, the DNA was better protected from oxidative damage as fermentation progressed. Overall, unlike the results showing a significant increase in antioxidant activity as the amount of BM added and the fermentation periods increased, the DNA-protective effect tended to depend only on the fermentation periods rather than the amount of BM added.
Considering a negative correlation between increased TP content due to fermentation and DNA-protective effects, it can be interpreted that the potential mechanism of DNA-protective effects varies due to the impact of individual compounds or their components depending on the altered metabolite patterns [29,52]. Furthermore, previous studies have demonstrated the superiority of phenol compounds and flavonoids whose contents increased after fermentation as DNA-protective effect and in particular, the memory aging model mouse study found that the prevention of aging by the input of EC and EGCG of flavonoids showed a positive correlation [8,53]. The total contents of phenolic compounds and flavonoids in MKBM tended to increase as fermentation progressed (Figure 2 and Figure 3), and in particular, EC and EGCG appeared on day 3 of fermentation only in the BM-added group (Table S4). These changes in components are confirmed to exert a DNA damage protection effect by removing ROS and toxic metabolites and increasing the antioxidant activity of MKBM according to a pattern consistent with previously reported results [54].

4. Conclusions

This study investigated MKBM changes in physicochemical properties, bioactive metabolites, and functional properties according to the amount of BM added and the fermentation periods. As a result, the MKBM-20 group at day 12 showed the greatest changes. In particular, catechin and naringin, which were not detected in the initial control group (MKBM-0, day 0), began to be produced from day 6 of fermentation. By the end of fermentation, their levels increased rapidly by 64-fold (64.42 µg/mL) and 19-fold (19.45 µg/mL), respectively, compared with the initial stage. In addition, the TP and TF contents also increased significantly. These increases in metabolite levels showed a close correlation with enhanced antioxidant activity, digestive enzyme inhibitory activity, and DNA-protective efficacy. Our findings demonstrate MKBM’s potential as a value-added functional food material utilizing BM. Nevertheless, this study is limited by its exclusive focus on verifying functional properties related to bioactivity evaluation, and a more systematic investigation is required to determine the effects of fermentation periods and the amount of BM added on metabolite production. Future research should investigate diverse microbial communities and introduce in vivo verification models to determine the practical applicability for the commercialization of MKBM.

Supplementary Materials

The following supporting information can be downloaded at: https://www.mdpi.com/article/10.3390/fermentation12070328/s1, Table S1: Formula for mul-kimchi with bitter melon prepared with different conditions; Table S2: Change of organic acid contents during fermentation of mul-kimchi with bitter melon; Table S3: Change of phenolic acid contents during fermentation of mul-kimchi with bitter melon; Table S4: Change of flavonoid contents during fermentation of mul-kimchi with bitter melon.

Author Contributions

Conceptualization, K.-M.C.; methodology, D.-Y.B. and D.-Y.C., software, D.-Y.B., J.-B.J. and M.-Y.J.; validation, D.-Y.B., D.-Y.C. and H.-Y.L.; formal analysis, H.-R.K., Y.-R.J. and D.-C.S.; investigation, D.-Y.B., J.-B.J., H.-Y.L. and K.-M.C.; resources, M.-J.A., D.-H.K. and K.-M.C.; data curation, M.-Y.J. and D.-C.S.; writing—original draft preparation, D.-Y.B.; writing—review and editing, D.-Y.C. and K.-M.C.; visualization, H.-Y.L., H.-R.K. and K.-M.C.; supervision, K.-M.C.; project administration, K.-M.C.; funding acquisition, K.-M.C. All authors have read and agreed to the published version of the manuscript.

Funding

This research was supported by the Basic Science Research Program through the National Research Foundation of Korea (NRF) funded by the Ministry of Education (Grant number RS-2023-00245096 and RS-2025-25400419), Republic of Korea.

Institutional Review Board Statement

Not applicable.

Informed Consent Statement

Not applicable.

Data Availability Statement

The original contributions presented in this study are included in the article/Supplementary Materials. Further inquiries can be directed to the corresponding authors.

Conflicts of Interest

The authors declare no conflicts of interest.

References

  1. Chung, H.J.; Shin, J.S.; Kim, M.S.; Ahn, S.C.; Koh, Y.H.; Eom, S.H.; Baik, M.Y. Enhancement of health beneficial bioactivities of bitter melon (Momordica charantia L.) by puffing. Food Chem. 2025, 471, 142780. [Google Scholar] [CrossRef] [PubMed]
  2. Kim, J.; Yu, S.; Jeong, Y.; Kim, M. Enhancement of bioactive properties in Momordica charantia by Leuconostoc fermentation. Fermentation 2023, 9, 523. [Google Scholar] [CrossRef]
  3. Ali, A.M.; Moqbel, M.S.; Al-Hizab, F.A. Effect of Momordica charantia on Insulin Immune-Reactive Pancreatic Beta Cells and Blood Glucose Levels in Streptozotocin-Induced Diabetic Rats. Indian J. Pharm. Sci. 2022, 84, 1233. [Google Scholar] [CrossRef]
  4. Perez, J.L.; Jayaprakasha, G.K.; Patil, B.S. Metabolite profiling and in vitro biological activities of two commercial bitter melon (Momordica charantia Linn.) cultivars. Food Chem. 2019, 288, 178–186. [Google Scholar] [CrossRef] [PubMed]
  5. Akintimehin, E.S.; Karigidi, K.O.; Charles, D.N.; Ibijola, A.P.; Adetuyi, F.O. Momordica charantia Leaf Extract Attenuates Cyanide Toxicity by Enhancing Antioxidant, Anti-inflammatory and Cholinergic Response in Rats’ Brain. Trop. J. Nat. Prod. Res. 2025, 9, 646–652. [Google Scholar] [CrossRef]
  6. Liang, Z.; Huang, Y.; Zhang, P.; Fang, Z. Impact of fermentation on the structure and antioxidant activity of selective phenolic compounds. Food Biosci. 2023, 56, 103147. [Google Scholar] [CrossRef]
  7. Tan, S.P.; Kha, T.C.; Parks, S.E.; Roach, P.D. Bitter melon (Momordica charantia L.) bioactive composition and health benefits: A review. Food Rev. Int. 2016, 32, 181–202. [Google Scholar]
  8. Watkins, B.A.; Mitchell, A.E.; Shin, A.C.; Dehghani, F.; Shen, C.L. Dietary flavonoid actions on senescence, aging, and applications for health. J. Nutr. Biochem. 2025, 139, 109862. [Google Scholar] [CrossRef] [PubMed]
  9. Alharbi, N.A. Polyphenol metabolites in fermented foods: Biotransformation, bioavailability, and functional roles. Front. Nutr. 2026, 13, 1767453. [Google Scholar] [CrossRef] [PubMed]
  10. Leonard, W.; Zhang, P.; Ying, D.; Adhikari, B.; Fang, Z. Fermentation transforms the phenolic profiles and bioactivities of plant-based foods. Biotechnol. Adv. 2021, 49, 107763. [Google Scholar] [CrossRef] [PubMed]
  11. Sliti, A.; Singh, V.; Fentie, E.G.; Lim, K.; Shin, J.H. Comprehensive characterization of traditional Korean fermented foods via integrated physicochemical, metagenomic, and metabolomic approaches. Food Biosci. 2025, 71, 107171. [Google Scholar] [CrossRef]
  12. Kim, M.J.; Jung, S.; Kim, H.S.; Jeong, J.Y.; Hwang, I.M.; Jun, W.; Lee, J.H. Garlic as a modulator of bacterial dynamics and metabolite profiles in kimchi fermentation. Food Biosci. 2025, 69, 106911. [Google Scholar] [CrossRef]
  13. Wang, L.; Sun, B.; Kang, S.O.; Liu, R. Comparative Microbiome and Functional Profiling of Cowpea Kimchi Fermented Using Korean and Sichuan Techniques. Fermentation 2025, 12, 10. [Google Scholar] [CrossRef]
  14. Lee, J.Y.; Jo, Y.H.; Kim, T.H.; Lee, S.E.; Hong, E.S.; Kang, T.S. Microbial and sensory characteristics of traditional watery Kimchi (Dongchimi) fortified with probiotics. J. Food Prot. 2025, 88, 100422. [Google Scholar] [CrossRef] [PubMed]
  15. Xing, Y.; Qiu, Y.; Yue, T.; Yi, R.; Xu, Q.; Rao, Y.; Pan, H. Correlation between microbial communities and volatile flavor compounds in the fermentation of new pickle fermentation broth. Food Biosci. 2023, 56, 103167. [Google Scholar] [CrossRef]
  16. Farid, M.S.; Hussain, M.I.; Rashid, S.; Ibtisam, R.; Abbas, A.; Khalid, S.; Łopusiewicz, Ł. Applications of Limosilactobacillus fermentum in Fruit and Vegetable Fermentations: Biotechnological Mechanisms, Nutritional Outcomes, and Industrial Relevance. Fermentation 2026, 12, 119. [Google Scholar] [CrossRef]
  17. Lim, J.Y.; Choi, Y.J.; Choi, J.Y.; Park, S.H.; Min, S.G.; Lee, M.A. Effects of Adding Various Salted Seafood (Jeotgal) Types on the Microbial, Metabolic, and Sensory Dynamics of Kimchi during Fermentation. Food Chem. X 2026, 35, 103832. [Google Scholar] [CrossRef] [PubMed]
  18. Seo, M.J. Fermented foods and food microorganisms: Antioxidant benefits and biotechnological advancements. Antioxidants 2024, 13, 1120. [Google Scholar] [CrossRef] [PubMed]
  19. Purewal, S.S.; Salar, R.K.; Bhatti, M.S.; Sandhu, K.S.; Singh, S.K.; Kaur, P. Solid-state fermentation of pearl millet with Aspergillus oryzae and Rhizopus azygosporus: Effects on bioactive profile and DNA damage protection activity. J. Food Meas. Charact. 2020, 14, 150–162. [Google Scholar]
  20. Cho, K.M.; Math, R.K.; Islam, S.M.A.; Lim, W.J.; Hong, S.Y.; Kim, J.M.; Yun, H.D. Biodegradation of chlorpyrifos by lactic acid bacteria during kimchi fermentation. J. Agric. Food Chem. 2009, 57, 1882–1889. [Google Scholar] [CrossRef] [PubMed]
  21. Lee, D.Y.; Kim, E.J.; Park, S.E.; Cho, K.M.; Kwon, S.J.; Roh, S.W.; Son, H.S. Impact of essential and optional ingredients on microbial and metabolic profiles of kimchi. Food Chem. X 2024, 22, 101348. [Google Scholar] [CrossRef] [PubMed]
  22. Li, W.; Wang, M.; Zhang, X.; Xie, Y.; Chen, W.; Yao, L.; He, X. Co-fermentation of dark septate endophytes and Trichoderma viride can effectively degrade cellulose in different Chinese medicinal herbal residues. Int. Biodeterior. Biodegrad. 2025, 196, 105949. [Google Scholar]
  23. Hwang, C.E.; Kim, S.C.; Lee, H.Y.; Suh, H.K.; Cho, K.M.; Lee, J.H. Enhancement of isoflavone aglycone, amino acid, and CLA contents in fermented soybean yogurts using different strains: Screening of antioxidant and digestive enzyme inhibition properties. Food Chem. 2021, 340, 128199. [Google Scholar] [CrossRef] [PubMed]
  24. Cho, D.Y.; Lee, H.Y.; Jeong, J.B.; Lee, J.H.; Lee, G.Y.; Jang, M.Y.; Cho, K.M. Comprehensive changes in nutrient constituents and antioxidant activity during food processing of isoflavone-enriched soybean leaf by mycelia of Tricholoma matsutake. Fermentation 2023, 9, 677. [Google Scholar] [CrossRef]
  25. Jeong, J.B.; Lee, H.Y.; Cho, D.Y.; Jang, M.Y.; Kim, D.H.; Bang, D.Y.; Cho, K.M. Changes in Phytochemical Compositions and Biological Activities After Fermentation According to the Harvest Periods of Mountain-Cultivated Ginseng Sprouts. Foods 2026, 15, 774. [Google Scholar] [CrossRef] [PubMed]
  26. Park, D.H.; Kwak, Y.S.; Choi, K.H.; Chung, E.H.; Kim, J.S.; Park, J.H.; Lee, J.H. Optimization of conventional extraction and multivariate metabolite profiling of soybean seeds (Glycine max L. Merrill) for enhanced isoflavones and antioxidant properties. Food Chem. 2026, 507, 148237. [Google Scholar] [CrossRef] [PubMed]
  27. Lee, H.Y.; Kim, H.S.; Kim, M.J.; Seo, Y.H.; Cho, D.Y.; Lee, J.H.; Cho, K.M. Comparison of primary and secondary metabolites and antioxidant activities by solid-state fermentation of Apios americana Medikus with different fungi. Food Chem. 2024, 461, 140808. [Google Scholar] [CrossRef] [PubMed]
  28. Zhang, B.; Deng, Y.; Song, Y.; Yang, F.; He, Y.; Guo, T. Inhibition effects of xanthohumol on α-amylase and α-glucosidase: Kinetics, multi-spectral and molecular docking. Int. J. Biol. Macromol. 2025, 311, 143676. [Google Scholar] [CrossRef] [PubMed]
  29. Cho, K.M.; Lee, H.Y.; Kim, S.C.; Lee, Y.M.; Kim, D.H.; Cho, D.Y.; Lee, J.H. Investigating alterations of nutritional constituents, antioxidant abilities, and physicochemicals in aging processes of ginseng sprouts. Heliyon 2024, 10, e34341. [Google Scholar] [CrossRef] [PubMed]
  30. Chen, Y.; Gong, H.; Ren, H.; Liu, L.; Zang, S.; Liu, T.; Zhao, Q. A comprehensive study on the quality deterioration mechanism and main paths of cowpea pickles during storage. Food Chem. 2025, 492, 145445. [Google Scholar] [CrossRef] [PubMed]
  31. Dissanayake, I.H.; Tabassum, W.; Alsherbiny, M.; Chang, D.; Li, C.G.; Bhuyan, D.J. Lactic acid bacterial fermentation as a biotransformation strategy to enhance the bioavailability of phenolic antioxidants in fruits and vegetables: A comprehensive review. Food Res. Int. 2025, 209, 116283. [Google Scholar] [CrossRef] [PubMed]
  32. Choi, Y.J.; Lee, H.W.; Yang, J.H.; Hong, S.W.; Park, S.H.; Lee, M.A. Changes in quality properties of kimchi based on the nitrogen content of fermented anchovy sauce, Myeolchi Aekjeot, during fermentation. Food Sci. Biotechnol. 2018, 27, 1145–1155. [Google Scholar] [CrossRef] [PubMed]
  33. Choi, Y.J.; Kim, H.E.; Lee, M.J.; Kim, M.; Park, S.J.; Choi, J.Y.; Lee, M.A. Comparative Study of the Physicochemical, Microbial, and Metabolite Changes During Kimchi Fermentation with Different Salt Types. LWT 2025, 228, 118084. [Google Scholar] [CrossRef]
  34. Li, Y.; Zhang, L.; Xu, X.; Lin, S.; Xie, J.; Li, J. Formation Mechanism and Nutritional Effects of Organic Acids in Fermented Foods: A Review. J. Food Sci. 2025, 90, e70745. [Google Scholar] [CrossRef] [PubMed]
  35. Zhang, X.; Ye, W.; Jiang, W.; Gu, Y. Pyruvate-formate lyase and beyond. J. Environ. Chem. Eng. 2024, 12, 114737. [Google Scholar] [CrossRef]
  36. Xiong, S.; Xu, X.; Du, T.; Liu, Q.; Huang, T.; Ren, H.; Xie, M. Organic acids drove the microbiota succession and consequently altered the flavor quality of Laotan Suancai across fermentation rounds: Insights from the microbiome and metabolome. Food Chem. 2024, 450, 139335. [Google Scholar] [CrossRef] [PubMed]
  37. Xia, Y.; Zhu, W.; Su, Y.; Chen, Y. Novel insights into the quality changes and metabolite transfer rules of pickles during fermentation: Pickle versus pickle solution. Food Chem. X 2025, 25, 102203. [Google Scholar] [CrossRef] [PubMed]
  38. Horvat, D.; Šimić, G.; Drezner, G.; Lalić, A.; Ledenčan, T.; Tucak, M.; Zdunić, Z. Phenolic acid profiles and antioxidant activity of major cereal crops. Antioxidants 2020, 9, 527. [Google Scholar] [CrossRef] [PubMed]
  39. Rajan, M.; Andrade, J.K.S.; Barros, R.G.C.; Guedes, T.J.F.L.; Narain, N. Enhancement of polyphenolics and antioxidant activities of jambolan (Syzygium cumini) fruit pulp using solid state fermentation by Aspergillus niger and A. flavus. Biocatal. Agric. Biotechnol. 2023, 47, 102589. [Google Scholar] [CrossRef]
  40. Devi, A.; Anu-Appaiah, K.A. Diverse physiological and metabolic adaptations by Lactobacillus plantarum and Oenococcus oeni in response to the phenolic stress during wine fermentation. Food Chem. 2018, 268, 101–109. [Google Scholar] [CrossRef] [PubMed]
  41. Díaz, M.C.; Pinto, D.C.; Silva, A.M. Plant flavonoids: Chemical characteristics and biological activity. Molecules 2021, 26, 5377. [Google Scholar] [CrossRef]
  42. Nguyen Thai, H.; Van Camp, J.; Smagghe, G.; Raes, K. Improved release and metabolism of flavonoids by steered fermentation processes: A review. Int. J. Mol. Sci. 2014, 15, 19369–19388. [Google Scholar] [CrossRef]
  43. Fang, X.; Pu, Q.; Qu, A.; Wang, C.; Shen, T.; Wu, S.; Huang, Y. Mechanisms of phenolic conversion in anaerobic fermentation of tea leaves revealed by integrating microbiome and metabolome analysis. Food Res. Int. 2026, 228, 118381. [Google Scholar] [CrossRef] [PubMed]
  44. Wang, K.; Hao, Y.; Duan, Y.; Guo, X.; Yang, Z.; Waffo-Téguo, P.; Ma, W. Updated insights into esterified Flavan-3-ols in grapevine and wine: Origin, transformation, and taste response of epicatechin-3-O-vanillate and -3-O-gallate. Food Chem. 2025, 496, 146892. [Google Scholar] [CrossRef] [PubMed]
  45. Babaei-Rad, S.; Mumivand, H.; Mollaei, S.; Khadivi, A. Postharvest UV-B and UV-C treatments combined with fermentation enhance the quality characteristics of Capparis spinosa L. fruit, improving total phenols, flavonoids, anthocyanins, phenolic acids, and antioxidant activity. Food Chem. 2025, 483, 144306. [Google Scholar] [CrossRef] [PubMed]
  46. Yin, R.; Jiang, J.; Ma, X.; Xie, Y.; Cui, M.; Chen, Y.; Gao, F. Dynamic changes of physicochemical parameters, antioxidant activity, organic acids, polyphenols, and volatile components in prune vinegar during fermentation. Food Biosci. 2024, 59, 104042. [Google Scholar] [CrossRef]
  47. Liu, S.; Hu, J.; Zhong, Y.; Hu, X.; Yin, J.; Xiong, T.; Xie, M. A review: Effects of microbial fermentation on the structure and bioactivity of polysaccharides in plant-based foods. Food Chem. 2024, 440, 137453. [Google Scholar] [CrossRef] [PubMed]
  48. Poovitha, S.; Parani, M. In Vitro and In Vivo α-Amylase and α-Glucosidase Inhibiting Activities of the Protein Extracts from Two Varieties of Bitter Gourd (Momordica charantia L.). BMC Complement. Altern. Med. 2016, 16, 185. [Google Scholar] [CrossRef] [PubMed]
  49. Hussain, F.; Hafeez, J.; Khalifa, A.S.; Naeem, M.; Ali, T.; Eed, E.M. In vitro and in vivo study of inhibitory potentials of α-glucosidase and acetylcholinesterase and biochemical profiling of M. charantia in alloxan-induced diabetic rat models. Am. J. Transl. Res. 2022, 14, 3824. [Google Scholar] [PubMed]
  50. Deligiannidou, G.E.; Pritsa, A.; Nikolaou, A.; Poulios, E.; Kontogiorgis, C.; Papadopoulou, S.K.; Giaginis, C. Nutraceutical Potential of Bitter Melon (Momordica charantia) on Cancer Treatment: An Overview of In Vitro and Animal Studies. Curr. Issues Mol. Biol. 2025, 47, 425. [Google Scholar] [CrossRef] [PubMed]
  51. Amini, M.R.; Pourreza, S.; Akhgarjand, C.; Sheikhhossein, F.; Askari, G.; Hekmatdoost, A. The Effects of Bitter Melon (Momordica charantia) on Weight Loss and Body Composition: A Systematic Review and Dose-Response Meta-Analysis of Randomized Controlled Trials. J. Food Biochem. 2025, 2025, 2921435. [Google Scholar] [CrossRef]
  52. Huang, S.; Ma, Y.; Sun, D.; Fan, J.; Cai, S. In vitro DNA damage protection and anti-inflammatory effects of Tartary buckwheats (Fagopyrum tataricum L. Gaertn) fermented by filamentous fungi. Int. J. Food Sci. Technol. 2017, 52, 2006–2017. [Google Scholar] [CrossRef]
  53. Wu, H.; Caldow, M.K.; Chan, A.S.; Liu, Z.; Lynch, G.S.; Suleria, H.A. Phenolic compounds from spontaneously fermented coffee beans alleviate cellular stress and modulate inflammatory signaling in lipopolysaccharide-treated RAW264.7 macrophages. Food Biosci. 2026, 78, 108601. [Google Scholar] [CrossRef]
  54. Feng, J.; Zuo, X.; Gao, X.; Sun, R.; Pu, Y.; Zhang, J. Astragalus polysaccharide alleviates benzene-induced DNA damage and hematopoietic toxicity by inhibiting oxidative stress. Food Biosci. 2025, 68, 106593. [Google Scholar] [CrossRef]
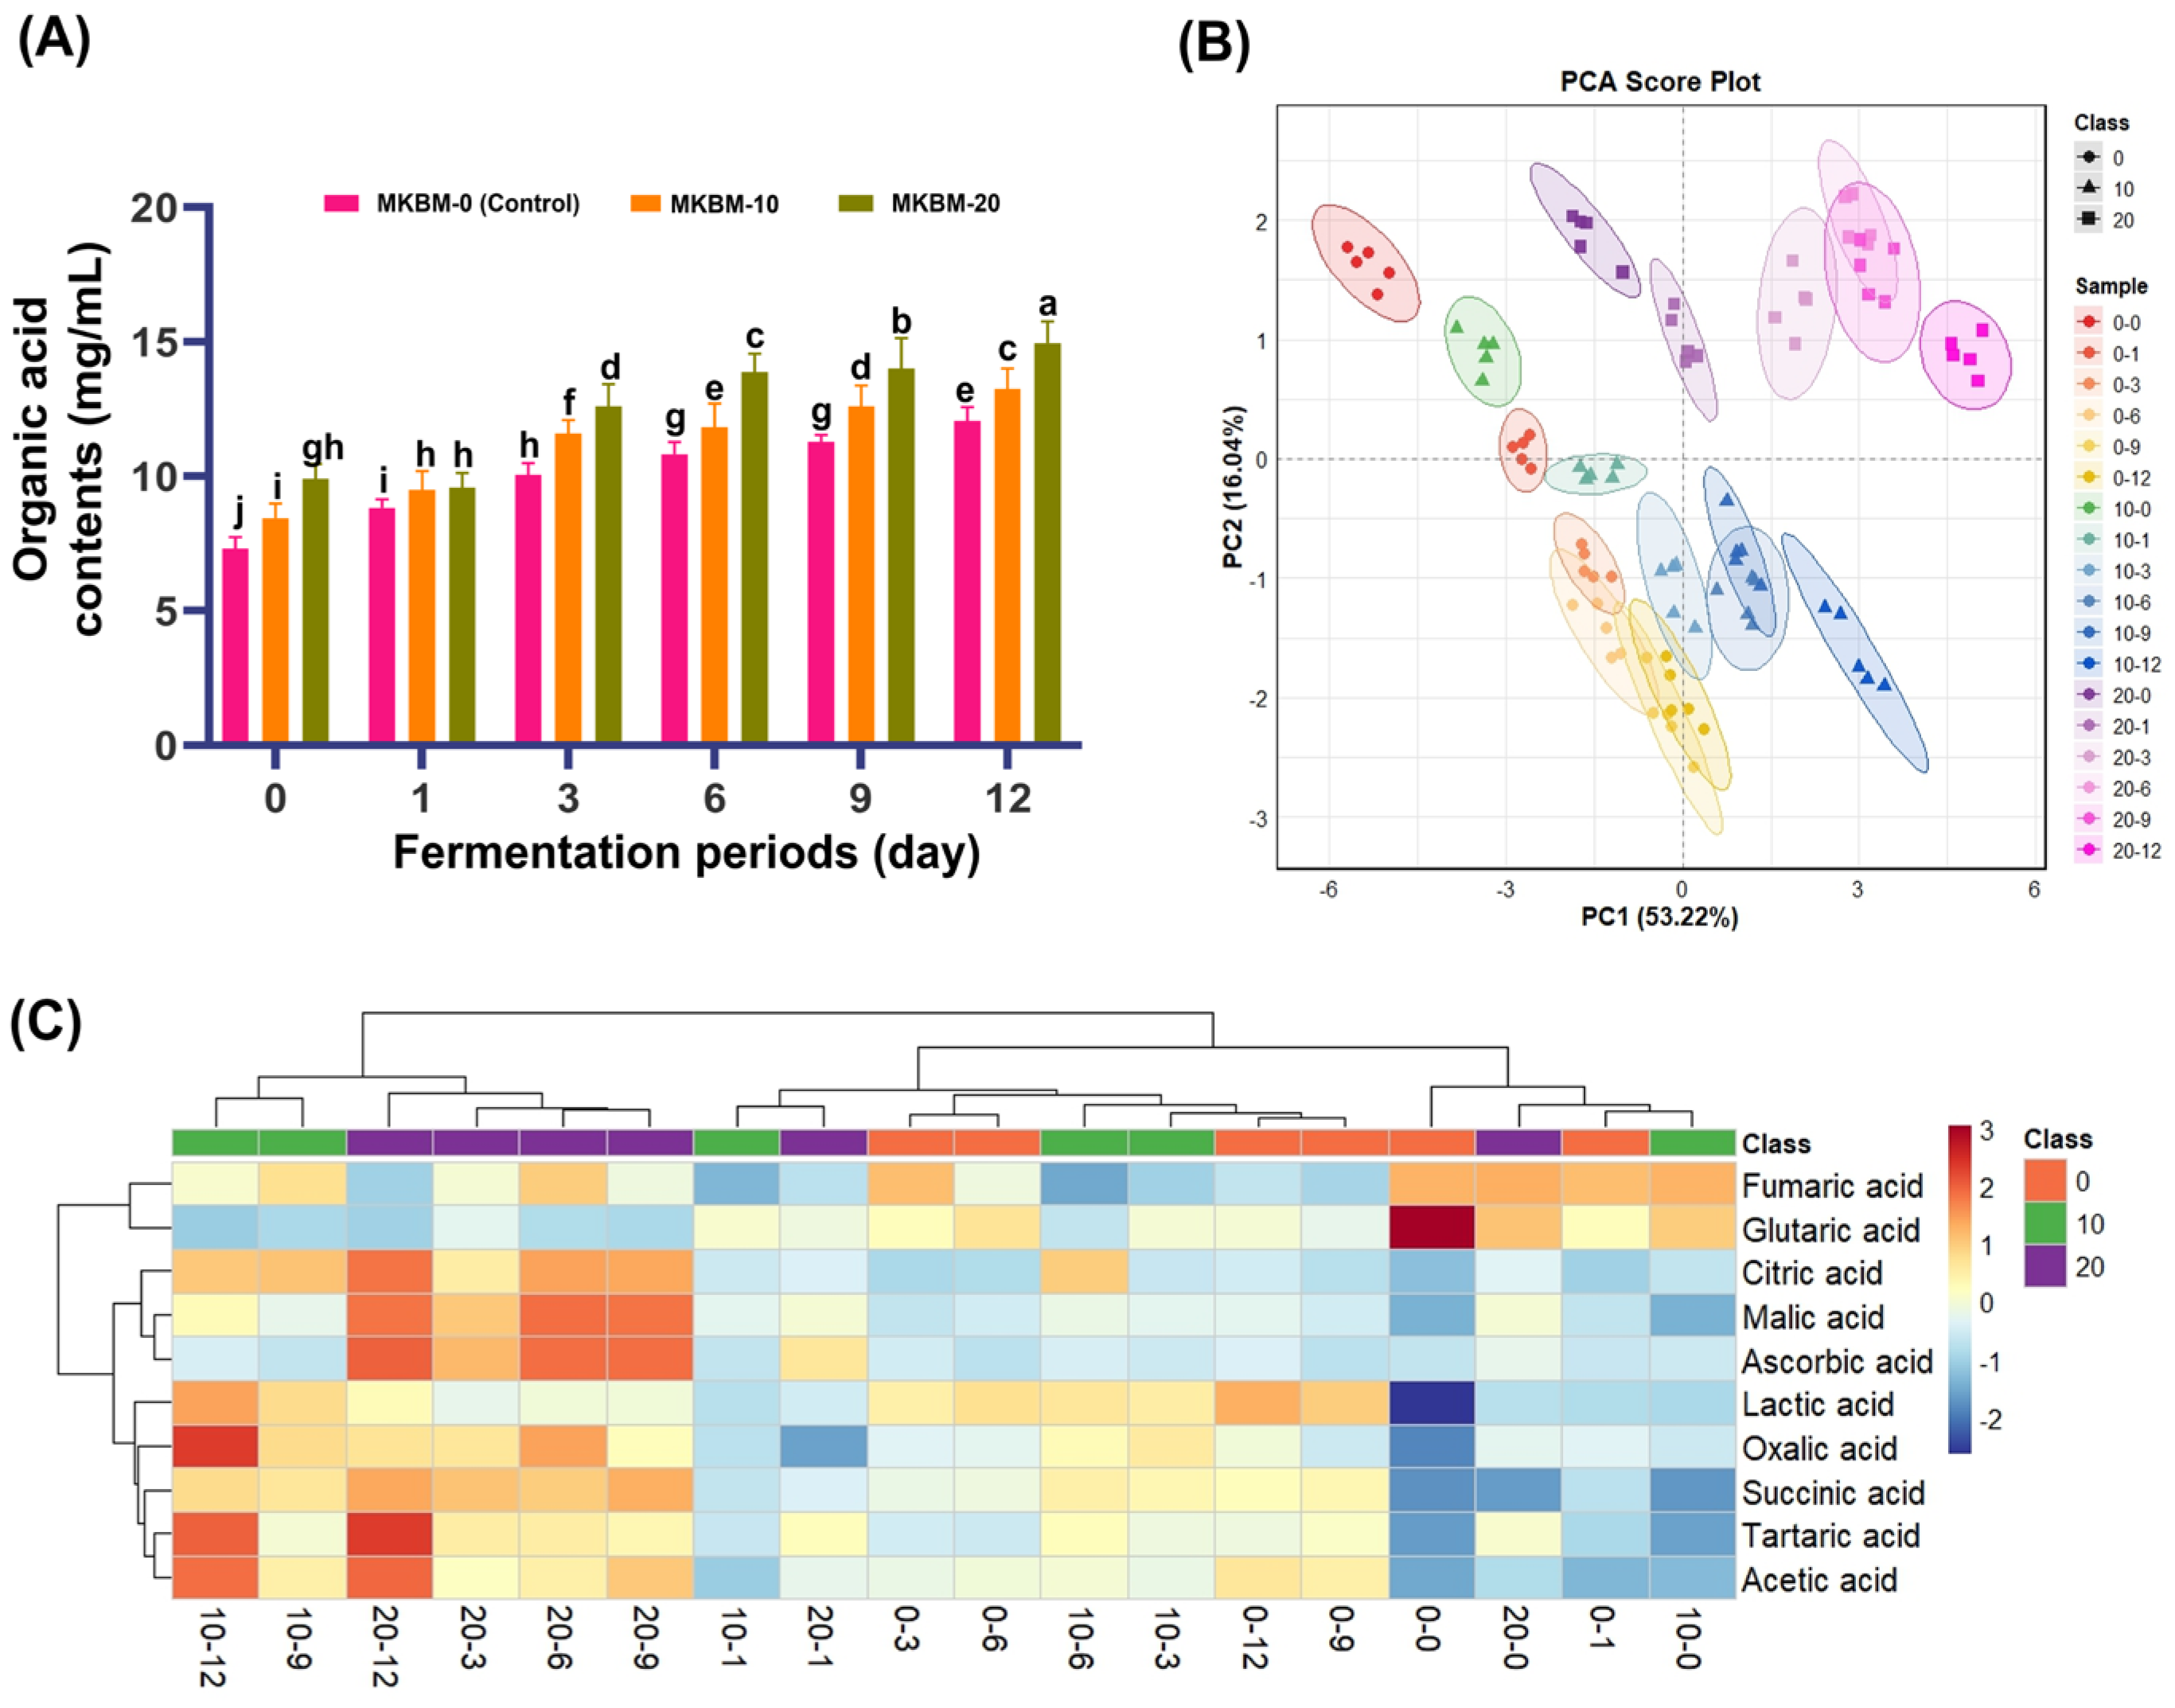
Figure 1. Changes in organic acid profiles according to fermentation periods and the amount of added bitter melon: (A) organic acid contents; (B) PCA score plot based on organic acid profiles; and (C) heatmap of organic acid contents. All values are expressed as mean ± SD of five independent experiments. Different letters correspond to significant differences related to samples using one-way ANOVA followed by Tukey’s post hoc test (p < 0.05). MKBM−0, mul−kimchi with bitter melon 0%; MKBM−10, mul−kimchi with 10% bitter melon; MKBM−20, mul−kimchi with 20% bitter melon.
Fermentation 12 00328 g001
Figure 2. Changes in phenolic acid profiles according to fermentation periods and the amount of added bitter melon: (A) phenolic acid contents; (B) PCA score plot based on phenolic acid profiles; and (C) heatmap of phenolic acid contents. All values are expressed as mean ± SD of five independent experiments. Different letters correspond to significant differences related to samples using one-way ANOVA followed by Tukey’s post hoc test (p < 0.05). MKBM−0, mul−kimchi with bitter melon 0%; MKBM−10, mul−kimchi with 10% bitter melon; MKBM−20, mul−kimchi with 20% bitter melon.
Fermentation 12 00328 g002
Figure 3. Changes in flavonoids profiles according to fermentation periods and the amount of added bitter melon: (A) flavonoid contents; (B) PCA score plot based on flavonoid profiles; and (C) heatmap of flavonoid contents. All values are expressed as mean ± SD of five independent experiments. Different letters correspond to significant differences related to samples using one-way ANOVA followed by Tukey’s post hoc test (p < 0.05). MKBM−0, mul−kimchi with bitter melon 0%; MKBM−10, mul−kimchi with 10% bitter melon; MKBM−20, mul−kimchi with 20% bitter melon. The analyzed flavonoids include flavan−3−ols (catechin, epicatechin, epigallocatechin, epigallocatechin gallate, and catechin gallate), a flavanone (naringenin), a flavonol glycoside (rutin), and an isoflavone (formononetin).
Fermentation 12 00328 g003
Figure 4. Total phenolic contents and total flavonoid contents were higher with longer fermentation periods and greater amounts of added bitter melon: (A) total phenolic contents and (B) total flavonoid contents. All values are expressed as mean ± SD of five independent experiments. Different letters correspond to significant differences related to samples using one-way ANOVA followed by Tukey’s multiple comparison test (p < 0.05). MKBM−0, mul−kimchi with bitter melon 0%; MKBM−10, mul−kimchi with 10% bitter melon; MKBM−20, mul−kimchi with 20% bitter melon.
Fermentation 12 00328 g004
Figure 5. Antioxidant activity and digestive enzyme inhibitory activity were higher with longer fermentation periods and greater amounts of added bitter melon: (A) DPPH; (B) ABTS; (C) hydroxy radical; (D) α−amylase; (E) α−glucosidase; and (F) pancreatic lipase inhibitory activity. All values are expressed as mean ± SD of five independent experiments. Different letters correspond to significant differences related to samples using one-way ANOVA followed by Tukey’s multiple comparison test (p < 0.05). MKBM−0, mul−kimchi with bitter melon 0%; MKBM−10, mul−kimchi with 10% bitter melon; MKBM−20, mul−kimchi with 20% bitter melon.
Fermentation 12 00328 g005
Figure 6. DNA-protective activity tended to increase with longer fermentation periods: (A) Agarose gel electrophoresis image showing DNA-protective effects of MKBM. Lane 1, DNA size marker; Lane 2, untreated DNA; Lane 3, blank control; Lane 4, treated control; Lanes 5–7, MKBM-0% fermented for 0, 3, and 9 days, respectively; Lanes 8–10, MKBM-10% fermented for 0, 3, and 9 days, respectively; Lanes 11–13, MKBM-20% fermented for 0, 3, and 9 days, respectively. SC, supercoiled DNA; OC, open circular DNA; LIN, linear DNA; (B) Quantitative analysis of DNA-protective activity calculated from DNA band intensities using ImageJ software (version 6.1). Different letters above the bars indicate significant differences among samples according to one-way ANOVA followed by Tukey’s multiple comparison test (p < 0.05).
Fermentation 12 00328 g006
Table 1. Changes of physicochemical properties and viable cell numbers during fermentation of mul-kimchi with bitter melon.
Samples 1Fermentation Periods (Day)
0136912
pH
MKBM-0 6.12 ± 0.31 a4.12 ± 0.25 b4.00 ± 0.20 b4.03 ± 0.24 b4.12 ± 0.16 b4.01 ± 0.20 b
MKBM-105.99 ± 0.30 a4.09 ± 0.25 b3.92 ± 0.16 b4.02 ± 0.20 b4.03 ± 0.16 b3.90 ± 0.24 b
MKBM-205.92 ± 0.30 a4.07 ± 0.24 b3.92 ± 0.24 b3.89 ± 0.19 b4.00 ± 0.24 b3.85 ± 0.23 b
Acidity (%, lactic acid)
MKBM-00.08 ± 0.04 g0.32 ± 0.16 f0.48 ± 0.14 d0.56 ± 0.18 c0.50 ± 0.2 cd0.62 ± 0.41 ab
MKBM-100.12 ± 0.12 g0.36 ± 0.11 f0.50 ± 0.41 cd0.56 ± 0.28 bc0.54 ± 0.37 bc0.62 ± 0.21 a
MKBM-200.12 ± 0.15 g0.38 ± 0.24 ef0.46 ± 0.23 de0.62 ± 0.11 a0.56 ± 0.38 bc0.64 ± 0.12 a
Salinity (%)
MKBM-03.72 ± 0.29 bc3.79 ± 0.19 bc3.62 ± 0.28 cd3.84 ± 0.21 bc4.12 ± 0.11 bc4.16 ± 0.23 bc
MKBM-103.72 ± 0.05 cd3.69 ± 0.21 de3.44 ± 0.47 f3.97 ± 0.11 bc4.43 ± 0.08 a3.99 ± 0.17 bc
MKBM-203.63 ± 0.18 cd3.70 ± 0.31 ab3.57 ± 0.61 f3.62 ± 0.28 de4.15 ± 0.24 ab3.85 ± 0.29 bc
Reducing sugar (mg/mL)
MKBM-02.52 ± 0.17 d2.64 ± 0.21 bc2.67 ± 0.23 bc2.75 ± 0.57 bc2.85 ± 0.27 ab2.90 ± 0.13 ab
MKBM-102.54 ± 0.12 bc2.65 ± 0.14 bc2.69 ± 0.21 bc2.75 ± 0.14 bc2.85 ± 0.1 ab2.90 ± 0.17 ab
MKBM-202.55 ± 0.43 cd2.66 ± 0.19 bc2.70 ± 0.45 bc2.76 ± 0.31 bc2.88 ± 0.47 ab2.91 ± 0.22 a
Viable cell numbers (log CFU/mL)
MKBM-04.84 ± 0.31 g8.06 ± 0.12 bc9.25 ± 0.26 a6.40 ± 0.32 de6.14 ± 0.41 de6.44 ± 0.17 d
MKBM-105.03 ± 0.08 fg8.31 ± 0.70 ab9.36 ± 0.37 a6.45 ± 0.22 d6.45 ± 0.32 cd7.11 ± 0.51 cd
MKBM-205.17 ± 0.21 ef8.55 ± 0.32 ab8.96 ± 0.51 ab6.56 ± 0.47 d6.24 ± 0.21 de6.06 ± 0.48 de
Changes in physicochemical properties and viable cell numbers of mul-kimchi with bitter melon (MKBM) according to the amount of added bitter melon and fermentation periods: 1 A mul-kimchi fermentation with 0–20% bitter melons at 25 °C for 6 h and after 8 °C for 12 days. All values are expressed as mean ± SD (n = 5). Different superscript letters within the same row indicate significant differences among samples according to one-way ANOVA followed by Tukey’s multiple comparison test (p < 0.05). MKBM-0, mul-kimchi without bitter melon; MKBM-10, mul-kimchi with 10% bitter melon; MKBM-20, mul-kimchi with 20% bitter melon.
Disclaimer/Publisher’s Note: The statements, opinions and data contained in all publications are solely those of the individual author(s) and contributor(s) and not of MDPI and/or the editor(s). MDPI and/or the editor(s) disclaim responsibility for any injury to people or property resulting from any ideas, methods, instructions or products referred to in the content.