
Article

Sustainable Bioethanol Production from Cocoa Pod Husk with and Without Reductive Catalytic Fractionation (RCF)

by
Sebastian Andrade
1,2,
Claudia García
1,
Samanta Iturralde
1,
Jorge Delgado-Noboa
1,
Verónica Pinos-Vélez
2,3,*,
Mónica Abril-González
2,3 and
Angelica Vele-Salto
3
1
Department of Applied Chemistry and Systems of Production, Faculty of Chemical Sciences, Eco-Campus Balzay, Universidad de Cuenca, Av. Victor Manuel Albornoz, Cuenca 010203, Ecuador
2
Departamento de Recursos Hídricos y Ciencias Ambientales, Eco-Campus Balzay, Universidad de Cuenca, Av. Victor Manuel Albornoz, Cuenca 010203, Ecuador
3
Grupo de Ingeniería de las Reacciones, Catálisis y Tecnologías del Medio Ambiente, Departamento de Biociencias, Eco-Campus Balzay, Universidad de Cuenca, Av. Victor Manuel Albornoz, Cuenca 010203, Ecuador
*
Author to whom correspondence should be addressed.
Fermentation 2026, 12(6), 257; https://doi.org/10.3390/fermentation12060257
Submission received: 28 March 2026 / Revised: 16 May 2026 / Accepted: 19 May 2026 / Published: 25 May 2026
(This article belongs to the Special Issue Recent Advancements in Fermentation Technology: Biofuels Production)

Abstract

The urgent need to reduce greenhouse gas emissions has driven the search for sustainable alternatives to fossil fuels. In this context, cocoa residues emerge as a promising feedstock for bioethanol production. This study evaluated the influence of a catalytic biorefinery treatment on the bioethanol production potential from cocoa pod husks. Both raw and catalytically treated biomass were characterized using SEM, pore size distribution analysis, and TGA. Subsequently, enzymatic hydrolysis was performed using various cellulase and hemicellulase loadings, followed by anaerobic fermentation with Saccharomyces cerevisiae. Bioethanol production was modeled using the modified Gompertz equation. The results evidenced changes in the structure and composition of the lignocellulosic matrix following catalytic treatment, increasing surface area and reducing hemicellulose content. Although total sugar release during hydrolysis was comparable between the two samples, the biomass processed via the catalytic biorefinery promoted higher sugar consumption and bioethanol concentration, reaching 3.36 g/L with a yield of 112 g kg−1 of dry biomass. The kinetic model showed a strong fit (R2 between 0.94 and 0.97). These findings demonstrate that the integration of catalytic biorefinery, enzymatic hydrolysis, and fermentation constitutes a viable alternative for the valorization of cocoa residues.

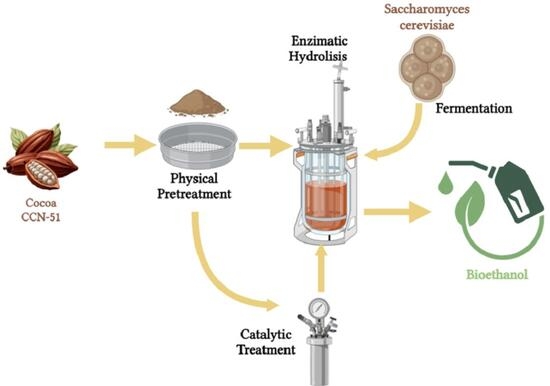
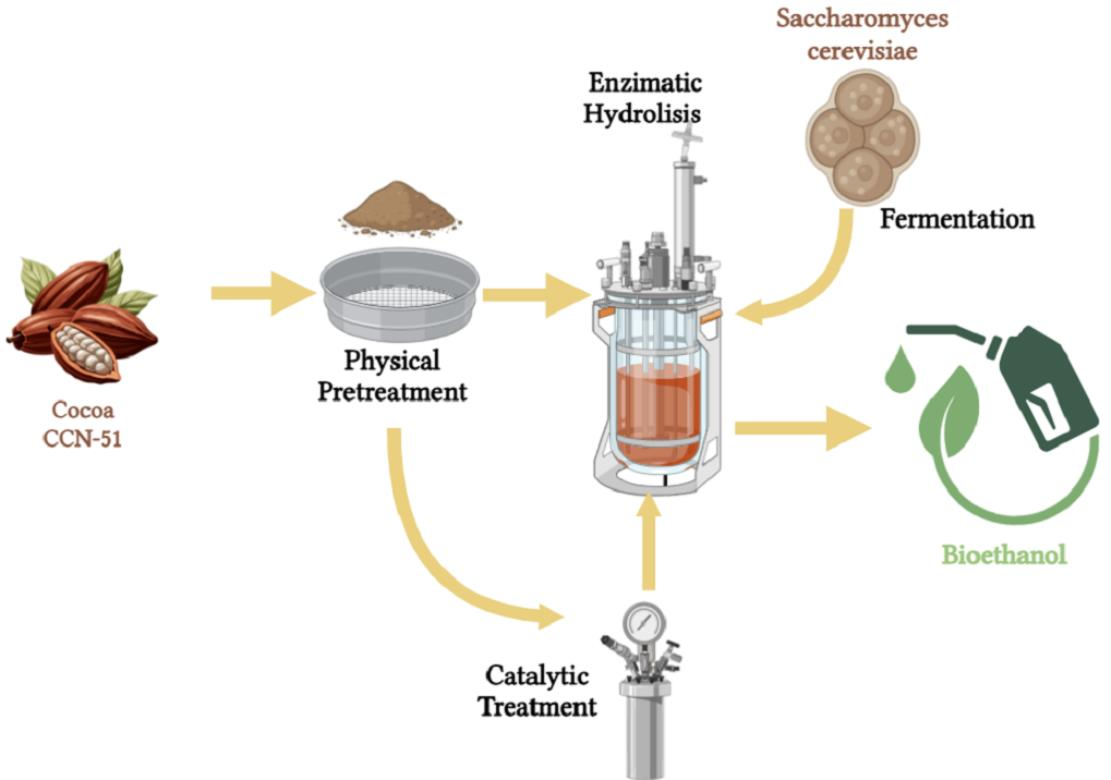
Graphical Abstract

1. Introduction

Currently, climate change—largely driven by fossil fuel consumption, agricultural activities, and industrial development—represents one of the most urgent global challenges [1,2]. In 2024, it was estimated that 66% of total CO2 emissions originated from these fuels [3,4]. Countries such as China, the United States, India, Russia, Japan, and Brazil, among others, have committed to reducing CO2 emissions to limit global warming under the terms of the Paris Agreement. In Europe, this agreement is supported by climate targets introduced under the European Green Deal and the ‘Fit for 55’ package [5]. Given this scenario, research over recent decades has focused on the search for renewable alternative fuels characterized by minimal pollutant emissions, enabling cleaner combustion and reducing dependence on fossil fuels [6].
Among liquid biofuels, bioethanol is a highly sought-after option. It can be utilized as an oxygenated gasoline additive, enhancing octane ratings and lowering the fuel’s boiling point, which promotes more efficient combustion and reduced atmospheric pollutant emissions without requiring modifications to engines or infrastructure [7,8]. Biofuel consumption in Latin America has increased by 80% over the last decade and is expected to grow by 37% in the next five years, while global biofuel demand could rise by 20% in the same period [9]. Furthermore, several countries have established mandatory blending mandates for bioethanol in fuels: Brazil requires a blend of approximately 27% (with projections nearing 30%), the United States primarily utilizes E10, and India has reached nearly 20%, while Argentina and Colombia maintain levels of 10% and 12%, respectively. In Ecuador, the blending percentage ranges between 5% and 10%. These policies can contribute to reducing GHG emissions by 15% to 70%, in addition to decreasing local pollutants such as NOx by up to 20%, suggesting a potential positive environmental impact in the short term under specific production and usage conditions [10].
Bioethanol (C2H5OH) produced from biomass has established itself as a robust alternative to fossil fuels, noted for its capacity to reduce greenhouse gas (GHG) emissions and promote a circular economy [11,12]. From a technological standpoint, bioethanol is produced through the alcoholic fermentation of sugars derived from biomass. The primary feedstocks used are classified into three generations based on the nature of the substrate. First-generation bioethanol is obtained from food crops rich in simple sugars and starches, such as sugarcane, sugar beet, and corn; second-generation includes lignocellulosic biomass sourced from organic residues; and third-generation is based on algal biomass [13,14]. Second-generation feedstocks enable the valorization of residues that do not compete with food security [15].
Latin America possesses high potential for the energetic valorization of residual biomass due to its extensive agro-industrial activity. In particular, South America presents favorable agro-ecological conditions that generate large volumes of lignocellulosic residues with energy potential. At a national scale, Ecuador has approximately 4.8 million hectares of agricultural land [16]. One of its primary crops is cocoa, with exports reaching around 602,046 tons in 2025 [17,18]. Its residues—pod husk, mucilage, and bean shell—represent nearly 70% of the total mass and constitute a promising feedstock for bioethanol production [19,20].
Lignocellulosic biomass, such as the cocoa pod husk used in bioethanol production, is primarily composed of lignin, cellulose, and hemicellulose [21]. Its complex structure prevents direct fermentation by yeast, necessitating the application of pretreatments to modify cellulosic chains, remove lignin, and release fermentable sugars, including both hexoses and pentoses [22,23]. Among the most widely used pretreatments are physical methods, such as milling and microwave treatment; chemical methods, including acid and alkaline pretreatments, as well as the use of ionic liquids and deep eutectic solvents; and biological methods, based on ligninolytic fungi and specific enzymes [24,25,26,27]. Once the lignocellulosic material is pretreated, cellulase and hemicellulase enzymes are employed to convert cellulose and hemicellulose into simple sugars [28]. Subsequently, anaerobic fermentation enables the conversion of these sugars into bioethanol using microorganisms such as yeast, fungi, or bacteria. The yeast Saccharomyces cerevisiae is the most commonly utilized for bioethanol production due to its ability to ferment sugars completely and efficiently [7,29]. However, the described processes prioritize sugar recovery, resulting in more recalcitrant lignin polymers with limited applications, thus achieving only partial valorization of the lignocellulosic biomass [30].
The effective valorization of lignin and carbohydrates within the lignocellulosic matrix under the biorefinery concept is a primary strategy for producing sustainable chemicals and fuels [31]. The lignin-first biorefinery approach seeks to valorize all biomass components through catalytic reduction processes. These methods prioritize the depolymerization of lignocellulosic material via solvolysis in the presence of hydrogenation catalysts, commonly palladium, ruthenium, and nickel-based. One of the approaches to lignin-first is the reductive catalytic fraction (RCF). In the presence of a metal catalyst and a reducing agent (usually H2), at high temperatures and pressures, the β-O-4 motifs of native lignin are broken down, yielding a lignin oil rich in monomeric phenolic compounds. This transformation comprises three steps: the solvolysis of lignin from cellulose and hemicellulose by breaking lignin-sugar bonds, followed by the fragmentation of polymeric lignin into monomers and oligomers by breaking a C-O bond, and finally the stabilization of reactive allylic species by hydrogenation. RCF allows for the simultaneous valorization of lignin, cellulose, and hemicellulose; this prevents lignin from being burned or disposed of, thus avoiding polluting emissions into the atmosphere and soil contamination [32,33]. Lignin hydrogenolysis produces an oil rich in phenolic compounds and high-quality cellulosic pulps suitable for fermentation processes [34,35]. It has been reported that these pulps can contain between 48% and 84% glucose by weight, representing a favorable starting point for anaerobic fermentation and bioethanol production. Nevertheless, the process still presents limitations, such as the partial loss of reducing sugars into the lignin oil and the high requirements for catalyst separation, energy, and reagents [36]. For this reason, it is necessary to study this process under milder pressure and temperature conditions, lowering energy consumption and making the process safer and more environmentally friendly.
Furthermore, to better understand the anaerobic fermentation process, various kinetic modeling techniques have been developed to predict and control the system. These techniques facilitate parameter estimation, optimization of bioethanol production, and evaluation of process performance, thereby reducing the need for industrial-scale experimentation [37,38,39]. Among these, the modified Gompertz model is particularly prominent. It describes the formation of products associated with microbial growth as a function of the lag phase time, the maximum production rate, and the maximum bioethanol concentration achieved. This model is highly regarded for its effectiveness in fitting experimental data, enabling the accurate prediction of the fermentation process yield [40,41,42].
The objective of this study was to determine the influence of a lignin-first catalytic biorefinery treatment on bioethanol production by comparing the fermentation yield of the refined solid residue against that of non-catalytically treated biomass. Cocoa pod husk was utilized as the primary feedstock with the Ni-NiO/α-Al2O3 system under autogenous pressure, using alcohols as hydrogen donors, nickel efficiently catalyzes hydrogen transfer reactions, eliminating the need for external H2. This reduces operating costs and risks associated with handling pressurized gases, making nickel a viable alternative to noble metals (Ru, Pd, Pt), while maintaining good catalytic activity at a lower cost. The solid fractions and catalyst were characterized prior to performing enzymatic hydrolysis with varying cellulase and hemicellulase loadings, followed by anaerobic fermentation and the subsequent kinetic modeling of production using the modified Gompertz model.

2. Materials and Methods

2.1. Raw and Treated Cocoa Biomass

Cocoa pod husks of the CCN-51 variety (Colección Castro Naranjal 51) were used, sourced from a cocoa plantation in Los Ríos, Ecuador. The husks were chopped into approximately 2 cm pieces and dried in an oven at 110 °C for 48 h. Once dried, the sample underwent size reduction and was passed through an ASTM #35 sieve (Endecotts Ltd., London, UK) to achieve a particle size of less than 0.5 mm. The biomass obtained following this physical pretreatment is referred to as raw biomass (SRC). Subsequently, the SRC sample underwent a catalytic fractionation process to produce the treated sample, treated biomass (RC). For this purpose, a nickel oxide catalyst supported on gamma alumina was prepared. Nickel (II) nitrate hexahydrate (Fisher, 98%) was used as the precursor salt, with ethylene glycol serving as the reducing agent. The mixture was placed under reflux at 180 °C for 5 h. Afterward, the nickel oxide nanoparticles were extracted using ethyl alcohol. The extracted nanoparticles were deposited onto commercial gamma alumina using a rotary evaporator (Buchi Rotavapor R-300, Büchi Labortechnik AG, Flawil, Switzerland) at 60 °C. The resulting material was dried at 120 °C for 12 h, yielding a catalyst composed of 10% nickel oxide supported on gamma alumina.
The morphology of the catalyst was characterized by transmission electron microscopy (TEM) using an FEI Tecnai Spirit Twin G20 microscope (FEI Company, Hillsboro, OR, USA) equipped with an Eagle 4K camera Eagle 4K camera (FEI Company, Hillsboro, OR, USA). The sample was deposited onto a 300-mesh Formvar/carbon-coated copper grid. Micrographs were obtained at an acceleration voltage of 80 kV. Furthermore, structural analysis was conducted via X-ray diffraction (XRD) using a PANalytical Empyrean diffractometer in a Bragg–Brentano configuration, equipped with a copper tube (Kα, λ = 1.54056 Å) operated at 45 kV and 40 mA. The catalyst was mounted on a standard diffraction sample holder, and each measurement was performed in triplicate to ensure reproducibility.
The catalytic biorefinery process, following a lignin-first approach, reductive catalytic fractionation (RCF), was carried out in a high-pressure stainless steel hydrothermal reactor (Model THR 250, Xi’an TOPTION Instrument Co., Ltd., Xi’an, China) with a 250 mL capacity. The biomass was loaded into the reactor along with a 60% propanol solution and the Ni-NiO/α-Al2O3 catalyst. The catalyst contained nickel and nickel oxide as the active phase, chosen for their ability to selectively promote hydrogenolysis reactions and stabilize lignin fragments under mild reducing conditions. The α-Al2O3 support provides high thermal and mechanical stability and prevents condensation reactions. A support test was performed, showing that no reaction occurred and demonstrating the need for the nickel as an active phase. The 10 wt% Ni-NiO/α-Al2O3 catalyst was prepared using the polyol method with nickel(II) nitrate hexahydrate (Fisher, 98%) as the precursor salt and ethylene glycol as the solvent and reducing agent. The system was refluxed at 140 °C for 12 h. After the heat treatment, the suspension was cooled to room temperature, and the solid was recovered and washed with ethanol. Finally, the nickel and nickel oxide nanoparticles were deposited onto the α-Al2O3 support using a rotary evaporator. The resulting material was dried at 120 °C for 12 h. Experimental conditions were controlled by placing the reactor in a muffle furnace for a reaction time of 150 min at 220 °C. A filtration process was used to recover the residual solids rich in reducing sugars that were used in this study.

2.2. Analysis for Characterization of Raw and Treated Biomass

SEM Analysis: Surface morphology of the samples was analyzed using scanning electron microscopy (SEM). Raw biomass (SRC) and treated biomass (RC) from the lignin-first catalytic biorefinery process were evaluated. Each sample was placed in a sample holder and coated with gold for 30 s using an evaporator (Quorum 150R ES, Quorum Technologies Ltd., East Sussex, UK). Observations were performed with a TESCAN MIRA 3 scanning electron microscope (TESCAN ORSAY HOLDING, Brno, Czech Republic) employing a secondary electron (SE) detector at an acceleration voltage of 5 kV.
Pore distribution analysis: Textural properties were determined using nitrogen adsorption–desorption isotherms at 77 K with a Quantachrome NOVA 2200e surface area and porosity analyzer (Quantachrome Instruments, Boynton Beach, FL, USA). Both SRC and RC samples were previously degassed under vacuum to remove moisture and adsorbed volatile compounds. The total pore volume and pore size distribution were determined using the Density Functional Theory (DFT) model implemented in the instrument’s software, utilizing the adsorption branch of the isotherm to ensure an accurate reconstruction of the porous structure.
Thermogravimetric Analysis (TGA): Thermogravimetric analysis was conducted to evaluate the thermal behavior and stability of the SRC and RC samples. The tests were performed using a TGA 1 STAR System analyzer (Mettler-Toledo AG, Greifensee, Switzerland). Previously dried samples were placed in ceramic crucibles and subjected to a heating program from 25 °C to 700 °C at a rate of 20 °C/min under an inert nitrogen atmosphere. Isothermal stages were included at 100 °C for 10 min under a nitrogen atmosphere and at 700 °C for 20 min under an air atmosphere. Mass loss was recorded as a function of temperature and time during the analysis, yielding the TGA and DTG curves. From these data, the moisture content, volatile matter, fixed carbon, and ash content of the samples were estimated. Prior to deconvolution, a polynomial baseline correction was applied to segments without thermal events, and the signals were smoothed using a Savitzky–Golay filter. Subsequently, deconvolution was performed by fitting Gaussian functions using OriginPro 2025 software. Furthermore, only the data obtained from the heating process under a nitrogen atmosphere were analyzed. The fit quality was evaluated using the adjusted coefficient of determination (R2) and the physicochemical coherence analysis of the thermal profiles.

2.3. Experimentation of Enzymatic Hydrolysis

Enzymatic hydrolysis was carried out in a Biotron Smart GX batch stirred-tank bioreactor (Guangzhou Biotron Technology Co., Ltd., Guangzhou, China) with a total capacity of 2 L and a working volume of 1.8 L. The reaction medium consisted of distilled water supplemented with 0.05 M sodium citrate buffer, and the pH was adjusted to 5.2 with 1 N NaOH. Hydrolysis was performed at 45 °C under constant stirring at 200 rpm, using a biomass loading of 30 g (1.67% w/w).
For the reaction, enzymatic loading was varied using a three-factor experimental design, as presented in Table 1. The first factor was biomass treatment, with two levels: with and without catalytic treatment. The second and third factors were the concentrations of cellulase from Trichoderma reesei (C2730, Sigma-Aldrich, St. Louis, MO, USA) and hemicellulase from Aspergillus niger (H2125, Sigma-Aldrich, St. Louis, MO, USA), respectively. The selected enzymatic ratios were based on previous studies by Conesa et al., who reported cellulase loadings between approximately 5 and 20 FPU/g, and by Xu et al., who evaluated hemicellulase concentrations between 0 and 300 U/g [43,44]. Enzyme activities were not determined experimentally but were taken directly from the manufacturer’s specifications. For clarity, cellulase loadings of 6.5, 13, and 19.5 FPU/g correspond to mass-based loadings of approximately 0.1, 0.2, and 0.3 g of enzyme preparation per gram of dry biomass, respectively, while hemicellulase loadings of 100 and 300 U/g correspond to 0.1 and 0.3 g, respectively. These enzymes were added simultaneously at the beginning of each hydrolysis experiment according to the corresponding combination. Finally, six distinct experimental runs were conducted without replicates; from these, the three most representative runs were selected to compare the performance of catalytically treated and untreated biomass.

2.4. Sugar Quantification

Total sugar content was determined using the phenol–sulfuric acid colorimetric method (DuBois method). This assay is based on the reaction of sugars with phenol and concentrated sulfuric acid, forming colored compounds whose intensity is proportional to the concentration present [45]. Absorbance was measured at 490 nm using a UV–Visible spectrophotometer (Thermo Scientific Genesys 18-Thermo Fisher Scientific Inc., Waltham, MA, USA); all determinations were performed in triplicate [46].

2.5. Experimentation of Anaerobic Fermentation

Anaerobic fermentation was performed in the same bioreactor used for the enzymatic hydrolysis stage. A commercial strain of Saccharomyces cerevisiae (baker’s yeast) obtained from a local supplier was utilized at a concentration of 10 g/L, at pH 5 and 30 °C [47]. To maintain anaerobic conditions, a continuous nitrogen flow of 0.5 mL/min was applied. The yeast was inoculated into the previously obtained hydrolysate, and the process was carried out for 72 h [37]. Samples were collected at 0, 1, 2, 3, 6, 12, 24, 36, 48, 60, and 72 h.

2.6. Ethanol Quantification

For the quantification of ethanol, the non-chromatographic Conway microdiffusion method was employed, which allowed for the determination of volatile substances through their transfer and fixation in an appropriate medium for subsequent quantification. A hermetically sealed bipetri dish was used; the fermented sample was placed in the first chamber. Following the volatilization of ethanol into the second chamber, it was oxidized with K2Cr2O7 dissolved in H2SO4. The excess unreacted dichromate was determined through its reaction with potassium iodide to form iodine, which was then titrated with sodium thiosulfate using starch as an indicator [48].

2.7. Kinetic Modeling

For the kinetic modeling, the Modified Gompertz model was applied to bioethanol production during fermentation. The Levenberg–Marquardt non-linear least squares method (1) was used to obtain the maximum bioethanol production rate and the best correlation coefficient; its programming was carried out in MATLAB® R2021b [40].
P E = P E m a x · e x p e x p r p m · e x p ( 1 ) P E m a x · t l t + 1
where r p m represents the maximum ethanol production rate (g/(L·h)), P E corresponds to the ethanol concentration at time t (g/L), P E m a x is the maximum ethanol concentration achieved (g/L), t indicates the fermentation time (h), and t l corresponds to the lag phase (h).

3. Results and Discussion

3.1. Catalyst Characterization

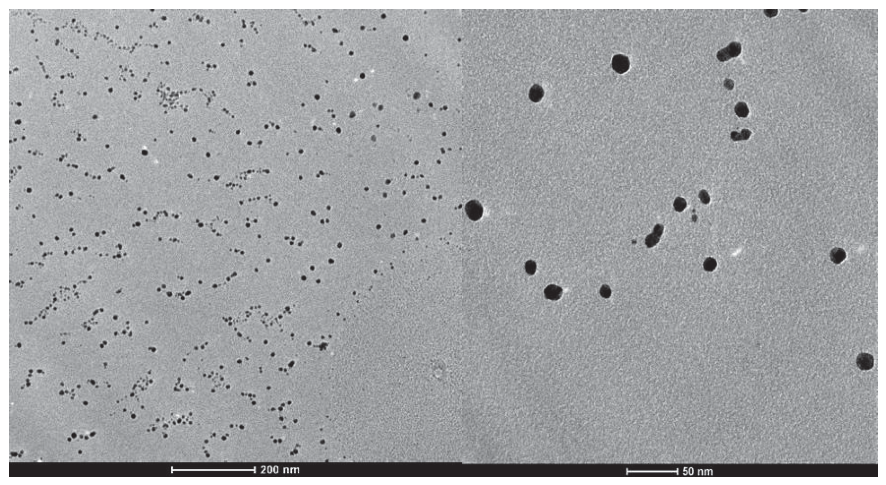
Figure 1 shows the transmission electron microscopy (TEM) image of the Ni-NiO/α-Al2O3 catalyst, revealing a homogeneous dispersion of nickel particles on the alumina support matrix. Dark nanoparticles, attributable to the active Ni-NiO phase, are observed distributed over a lighter phase corresponding to the α-Al2O3 support. The nickel particle size is within the nanometric range, evidencing the formation of small, well-dispersed particles. No significant agglomeration of metallic particles is evident, suggesting a strong metal–support interaction, which is expected in alumina-supported nanoparticles [49].
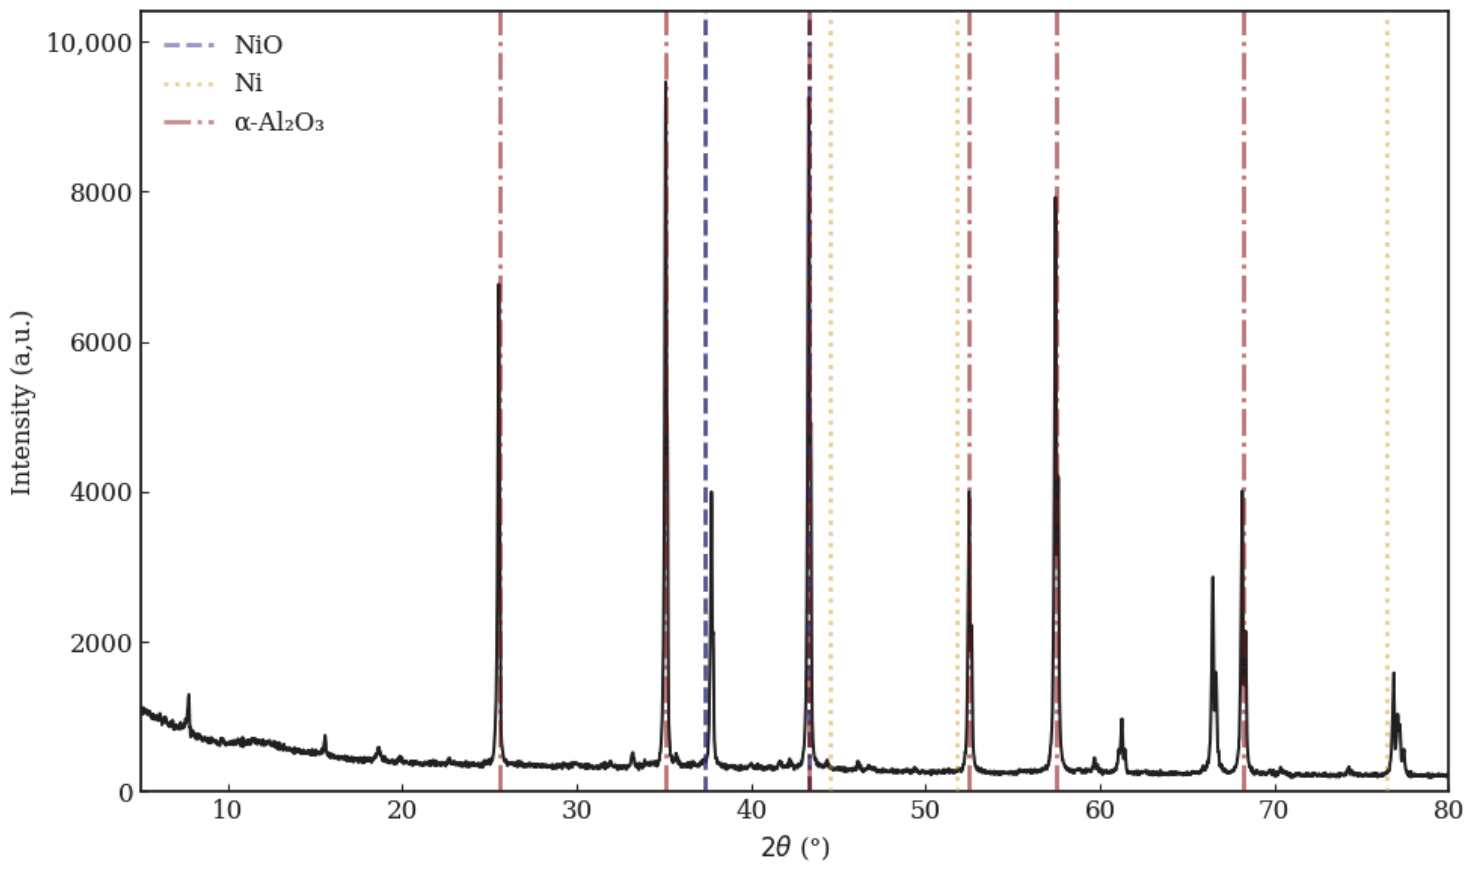
Figure 2 displays a diffractogram of the Ni-NiO/α-Al2O3 catalyst, where the main peaks correspond to the following phases: (1) Ni phase in 44.8° and 52.1° and 76.6° [50,51]; (2) NiO phase distinct signals are identified at angles 2θ ≈ 37.3° (111), 43.3° (200), 75.4°, and 79.4° [52]. (3) The support phase (α-Al2O3) is identified with typical signals observed around 2θ ≈ 45.0°–46° y 66.8°–67° [53]. Figure 2 shows that the active phase is a mixture of nickel and nickel oxide, indicating that both species were obtained during the polyol method synthesis. A predominance of alpha alumina patterns can be observed because its high crystallinity dominates the diffraction pattern, and because the small size of the nickel nanoparticles and their low content (only 10% of the total, compared to 90% of α-Al2O3. The α-Al2O3 a highly crystalline structure and generates very intense reflections that mask the active phases. Some NiO and metallic Ni peaks appear in regions near the principal reflections of α-Al2O3. For example: NiO: ~37°, 43°, 63° (2θ) and Ni0: ~44.5°, 51.8°, 76°.

3.2. Characterization of Raw and Treated Biomass

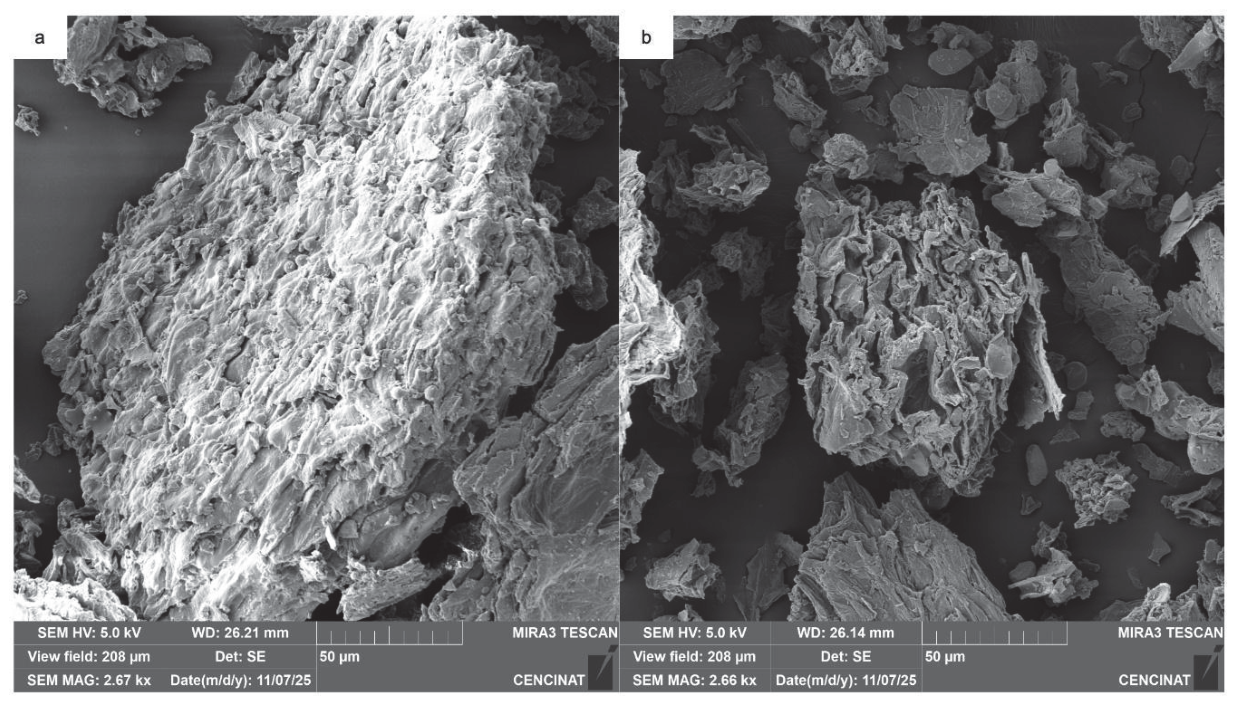
SEM Analysis: The SRC biomass sample (Figure 3a) exhibits a more compact and intact structure, characteristic of lignocellulosic material in its natural state. Continuous fibers and a lower degree of porosity are observed. Regarding the RC sample (Figure 3b), significant structural changes are evident, such as fiber breakage and fragmentation, increased porosity, and a more irregular texture, indicating the action of the catalytic process on the biomass components. These modifications suggest greater accessibility to cellulose and hemicellulose, facilitating their subsequent utilization.
Pore distribution analysis: The raw cacao SRC biomass exhibited a total pore volume of 0.002 cc/g, and a modal pore radius of 17.339 Å. These values are consistent with the compact structure typical of lignocellulosic materials, where lignin limits internal accessibility and restricts the formation of open, reactive pores. After lignin-first biorefining, the residual solid RC displayed clear changes in textural properties, the total pore volume rose to 0.007 cc/g, and the modal pore radius shifted slightly to 18.137 Å, indicating the generation of additional accessible pores and a modest expansion of dominant pore structures.
Although the increase in pore size was moderate, previous studies have shown that even small enlargements can reduce steric hindrance and improve molecular diffusion within the lignocellulosic matrix, enhancing the contact between the solid and reactants such as water, enzymes, or catalysts. This improved accessibility is particularly relevant for the enzymatic hydrolysis stage, where greater pore openness is associated with higher glucose release. The results demonstrate that the biorefining process partially deconstructed the structure of the cacao biomass, producing a more open architecture that is favorable for subsequent bioconversion steps.
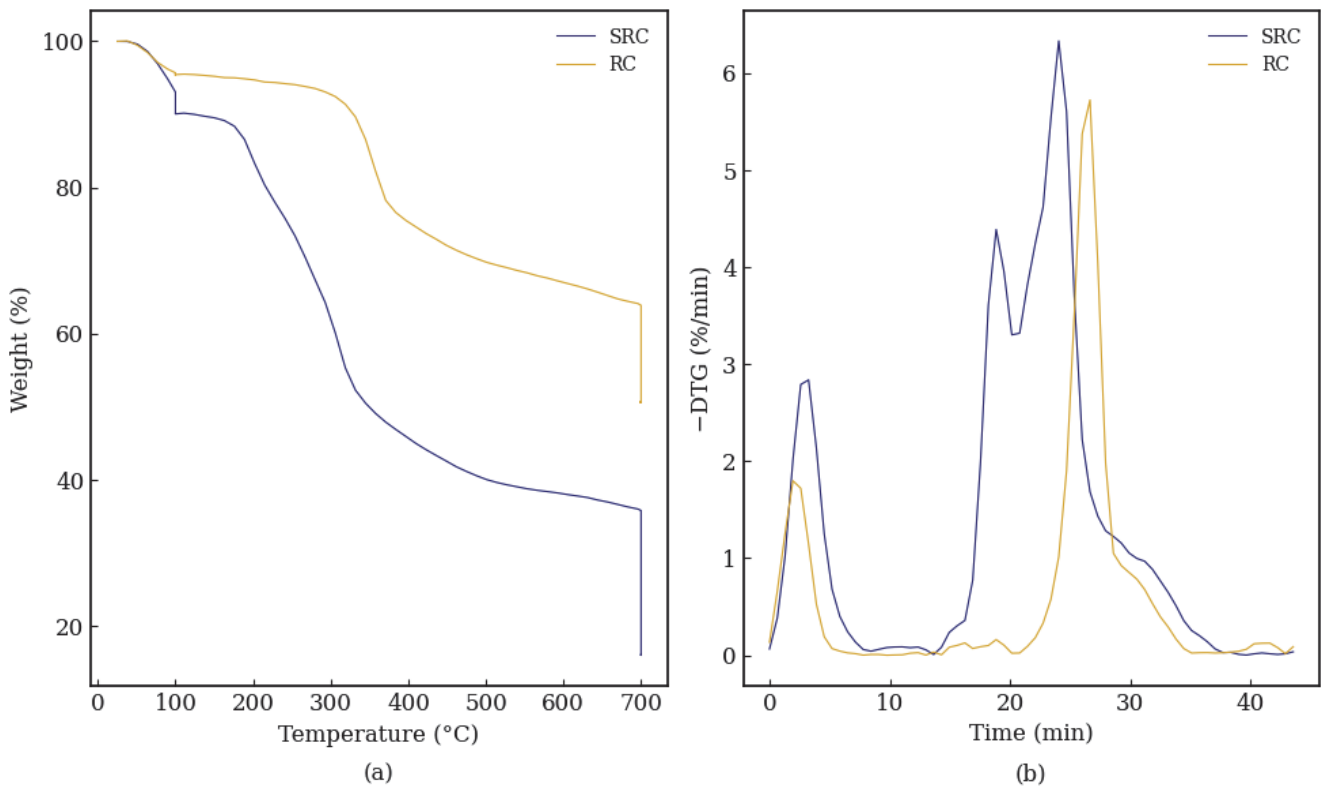
Thermogravimetric Analysis and Curve Deconvolution: The mass loss curve (Figure 4a) revealed a series of stages reflecting the progressive decomposition of the samples as the temperature increased. In the range of 25 °C (0 min) to 100 °C (13 min), a slight reduction in mass was observed due to moisture loss. This was followed by a rapid mass loss corresponding to the decomposition of volatile matter. For samples SRC and RC, values of 54.32% and 31.60% were recorded, respectively. Subsequently, the presence of fixed carbon was observed at 700 °C (44.2 min), yielding values of 19.71% and 13.29% for samples SRC and RC, respectively. The residual material in the aforementioned samples corresponds to their ash content: 16.03% for samples SRC and 50.55% for samples RC. The reduction in volatile matter and the increase in ash content of the RC sample are due to the sample being a combination of pretreated solid residue and catalyst. The results presented for the SRC samples, corresponding to volatile matter and fixed carbon, are lower than the values obtained in similar studies, which show values of 67.13% and 21.49%, respectively [54]. It is worth noting that this variation may be due to the initial moisture content, which is 9.94% for the SRC sample and 3.8% in the comparative study. On the other hand, the Indonesian cocoa husk samples have a composition of 9.96% moisture, 65.3% volatile matter, 20.94% fixed carbon, and 3.8% ash [55]. In all cases, the SRC type cocoa husk samples have a volatile matter content greater than 54%.
For the analysis of the DTG curve, the characteristic peaks of the biomass samples were considered. A first peak usually appears from room temperature up to approximately 100 °C, corresponding to moisture loss. At higher temperatures, the degradation of extractables and lignocellulosic compounds occurs. Cellulose degrades between 250 °C and 380 °C, while hemicellulose degrades between 200 °C and 300 °C, which generally results in a distortion of the cellulose peak. Finally, lignin exhibits a broader decomposition range starting at 200 °C, with maximum degradation near 400 °C, where a small peak is observed that overlaps with the cellulose degradation [56].
Figure 4b shows the DTG curve for samples SRC and RC. In both samples, the first moisture peak is visible in the range of 0 min (25 °C) to 14 min (100 °C), while in the range of 15 min (130 °C) to 38 min (600 °C), the degradation of the main sample components is observed as they decompose during the heating process, releasing volatile compounds. Sample SRC contains extractives, hemicellulose, cellulose, and lignin, while sample RC shows peaks reflecting the cellulose and lignin content. In this case, a shift in the cellulose peak is observed, which may be due to the presence of a catalyst in the sample. It is important to note, based on the thermogravimetric analysis, that after subjecting the cocoa husk sample to the catalytic biorefining process, the extractives and hemicellulose content were removed from the sample, and the lignin content was reduced. Therefore, a sample with high cellulose content and low lignin content was used for the enzymatic fermentation process.
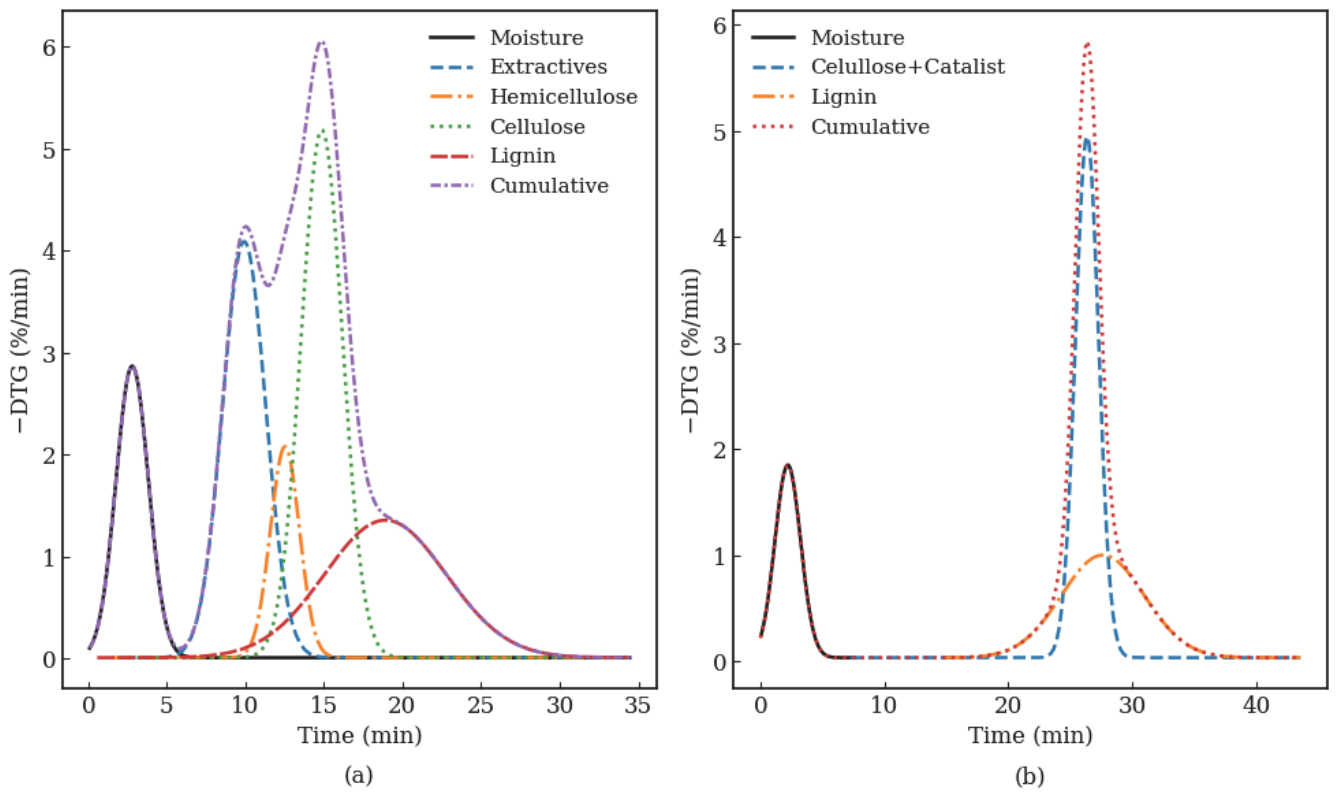
Figure 5a,b show the deconvolution of the DTG curve for the SRC and RC samples, yielding R2 values of 0.992 and 0.995, respectively, using the Gaussian model. The graphs confirm the elimination of the extractives and hemicellulose peaks when the sample undergoes catalytic refining. Analysis with OriginPro software yielded an area under the curve (AUC) for cellulose of 17.07% and 11.56% mass loss for the SRC and RC samples, respectively. For lignin, the AUC was 13.08% and 8.12% mass loss. This result indicates that when the SRC sample undergoes the catalytic refining reaction, in addition to the decomposition of the extractives and hemicellulose, there is also a reduction in the cellulose and lignin content present in the original sample.

3.3. Enzymatic Hydrolysis

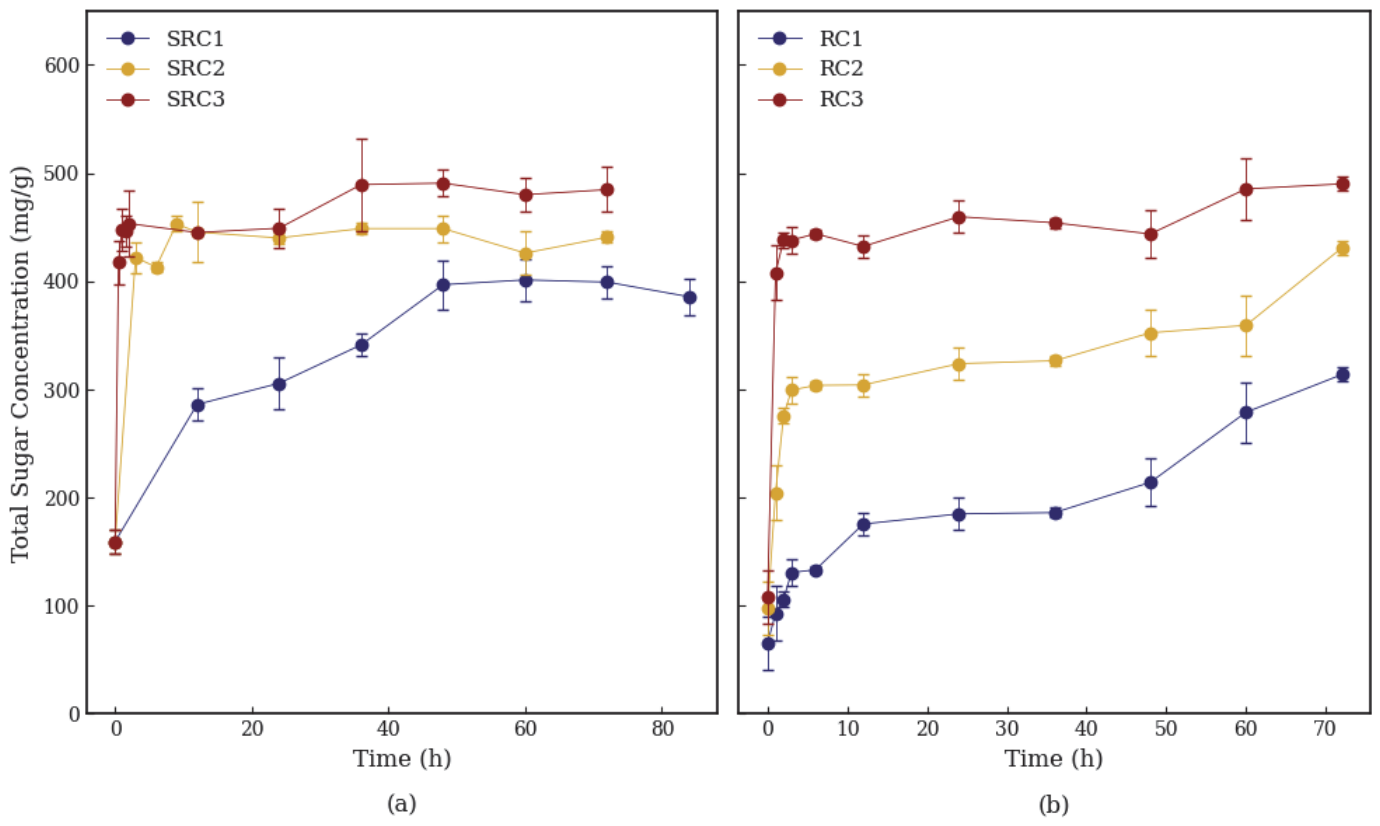
Figure 6 shows the total sugar concentration curves obtained during the enzymatic hydrolysis of SRC and RC biomass. These were evaluated under six experimental conditions, corresponding to three enzyme concentrations applied for each treatment type. Each point represents the average value of the three replicates performed.
Hydrolysis performed with a hemicellulase concentration of 100 U/g (SRC1, RC1) yielded a lower amount of total sugars. Conversely, the hemicellulase concentration of 300 U/g (SRC2, SRC3, RC2, RC3) generated a higher amount of sugars. Although the specific sugar profile was not characterized in this study, the literature suggests that the higher total sugar yields obtained with increased hemicellulase loading are likely due to a greater conversion of hemicellulose into soluble compounds such as galactomannans, glucomannans, and various oligosaccharides [57]. Furthermore, previous studies indicate that an enhanced breakdown of the hemicellulose network facilitates enzyme penetration through the lignocellulosic matrix, thereby increasing the overall efficiency of cellulose hydrolysis [58].
It was also observed that using a higher concentration of hemicellulases significantly reduced the reaction time, as the concentration remained constant after 24 h. This is similar to the findings of Xu et al., who obtained almost complete hydrolysis of the biomass using a high concentration of hemicellulases [44].
As shown in Figure 6, in the samples without pretreatment, the SRC3 test yielded the highest sugar production, at 484.67 mg/g of biomass. Similarly, in the samples with catalytic pretreatment, the RC3 test obtained the highest sugar concentration, at 489.97 mg/g of biomass. These values exceed those reported by Sarmiento-Vásquez et al., demonstrating a high conversion potential under the evaluated conditions [59]. The higher sugar production observed can be attributed to the efficiency of the hydrolysis process using a high enzyme concentration, reflecting greater biomass utilization.
Comparing the hydrolysis results obtained without pretreatment and with catalytic treatment reveals similarities between the datasets, suggesting that catalytic pretreatment does not produce appreciable changes in total sugar production. It was observed that, with the Reductive Catalytic Fractionation (RCF) method proposed in this study, under mild conditions and using a more economical catalyst, no appreciable loss of total sugars occurred, which is usually a disadvantage of this approach [33]. Furthermore, the catalyst was recovered at the end of the process and can therefore be reused.
This insignificant change may be due to the findings in the following study, which indicate that the presence of residual lignin and other inhibitory factors continues to represent a significant barrier to the efficient action of cellulolytic enzymes, even after pretreatment. These substances can interact unproductively with enzymes, reducing their catalytic activity and limiting carbohydrate conversion. Furthermore, soluble, hydrophobic aromatic compounds derived from lignin can intensify this effect, interfering with enzyme activity and hindering the efficient conversion of lignocellulosic material [60].
Comparatively, the values obtained in this study fall within the range reported for other widely studied lignocellulosic biomasses, such as elephant grass, bamboo, sorghum, and rice residues [58,61,62,63]. However, these studies generally employ conventional alkaline or physicochemical pretreatments (e.g., NaOH, dilute acid), aimed at maximizing sugar release through extensive lignin removal. For example, elephant grass treated with NaOH achieves high delignification (up to 88%) and ethanol yields, while sorghum straw pretreated with 0.5 M NaOH reaches 464.2 mg/g of reducing sugars.
In contrast, the catalytic Lignin-First approach applied in this study operates under milder conditions and yields comparable sugar production (484.67 mg/g biomass), but through a different mechanism. This strategy promotes partial solubilization of hemicellulosic fractions and selective lignin transformation, which may limit the increase in measured sugars during hydrolysis but contributes to improved downstream fermentability. This similarity suggests that cocoa husk has a competitive performance as a viable biomass for bioethanol production.

3.4. Anaerobic Fermentation

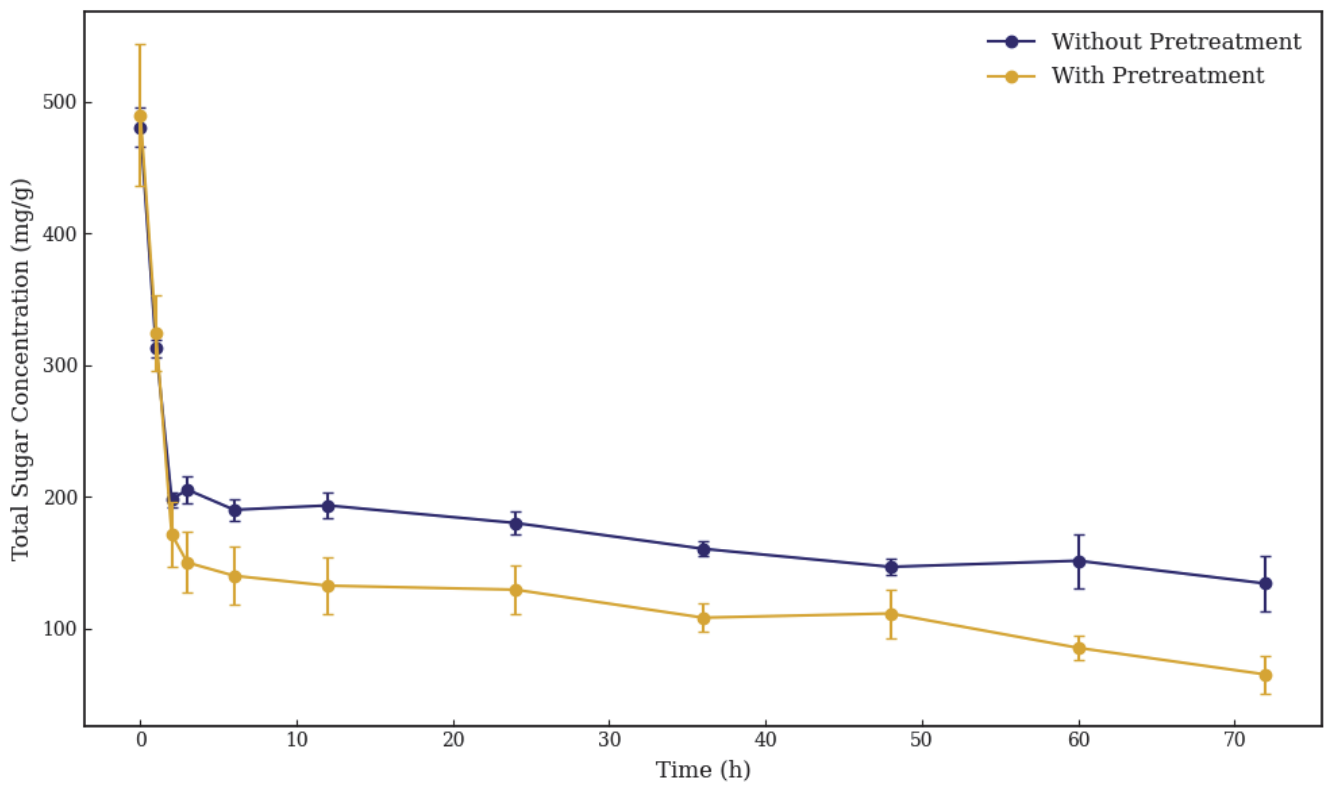
Based on the results obtained during the enzymatic hydrolysis stage, samples SRC3 and RC3 were selected for the fermentation process, as they showed the highest release of fermentable sugars. After fermentation, sample SRC3 registered a sugar consumption of 72.12%, while sample RC3 reached 88.62%, demonstrating greater efficiency in substrate conversion for the pretreated biomass. In general, the values obtained are within or close to the ranges reported for cocoa waste subjected to pretreatment and subsequent enzymatic hydrolysis, where sugar consumption has been documented between approximately 80% and 97%, depending on the process conditions and the pretreatment method applied [64,65,66].
Figure 7 shows the evolution of the total sugar concentration during the fermentation process in samples SRC3 and RC3. A general decreasing trend is observed, associated with the progressive consumption of sugars by the yeast.
The low sugar consumption in the untreated sample may be due to the ineffectiveness of the strain used against the different types of inhibitors present in the reaction. To avoid this, it is recommended to use specialized strains or combine two types of yeast to increase sugar consumption and, consequently, bioethanol production. This is because the yeast Saccharomyces cerevisiae cannot ferment the five-carbon sugars (pentoses) derived from hemicellulose, so it is important to combine it with other yeasts such as Candida or Schizosaccharomyces, which can ferment these sugars and convert them into ethanol [67,68].
Currently, improving the fermentation environment is one of the main challenges in bioethanol production. The presence of inhibitory compounds derived from lignin and phenolic compounds reduces yeast efficiency, compromising its performance and stability. Therefore, efforts are underway to decrease the lignin content and its byproducts through catalytic pretreatments, which reduces the presence of these inhibitors. This improves the fermentation environment and creates a favorable environment for the development of Saccharomyces cerevisiae. By reducing the concentration of toxic aromatic compounds, a more favorable environment for this yeast is fostered, increasing its efficiency [69,70].
The hydrolysis of lignocellulosic material is a fundamental process in biorefineries for breaking down the complex structure of biomass and converting it into fermentable sugars. This process, however, generates residual lignin and inhibitory compounds such as furfural and hydroxymethylfurfural, among others, which can negatively affect subsequent stages, including fermentation [71]. Furthermore, these studies indicate that inhibitors such as furfural and HMF have clear negative effects on bacteria, yeasts, and filamentous fungi, reducing their vitality, viability, specific growth rate, ethanol yield, and ethanol productivity, as shown in various studies [72,73].
As an overall result of the process, while the application of catalytic refining under the Lignin-First approach improved the fermentability of the released sugars, a slight decrease in the total amount of sugars detected after enzymatic hydrolysis was observed. This phenomenon can be partly attributed to the solubilization of oligosaccharides and hemicellulosic fractions during pretreatment, as indicated by several studies, which point out that the entrainment of water-soluble compounds to the liquid phase is common during catalytic solvolysis. While this represents a relative loss for the hydrolysis stage, it did not prevent these sugars from being subsequently used in fermentation [30,74].
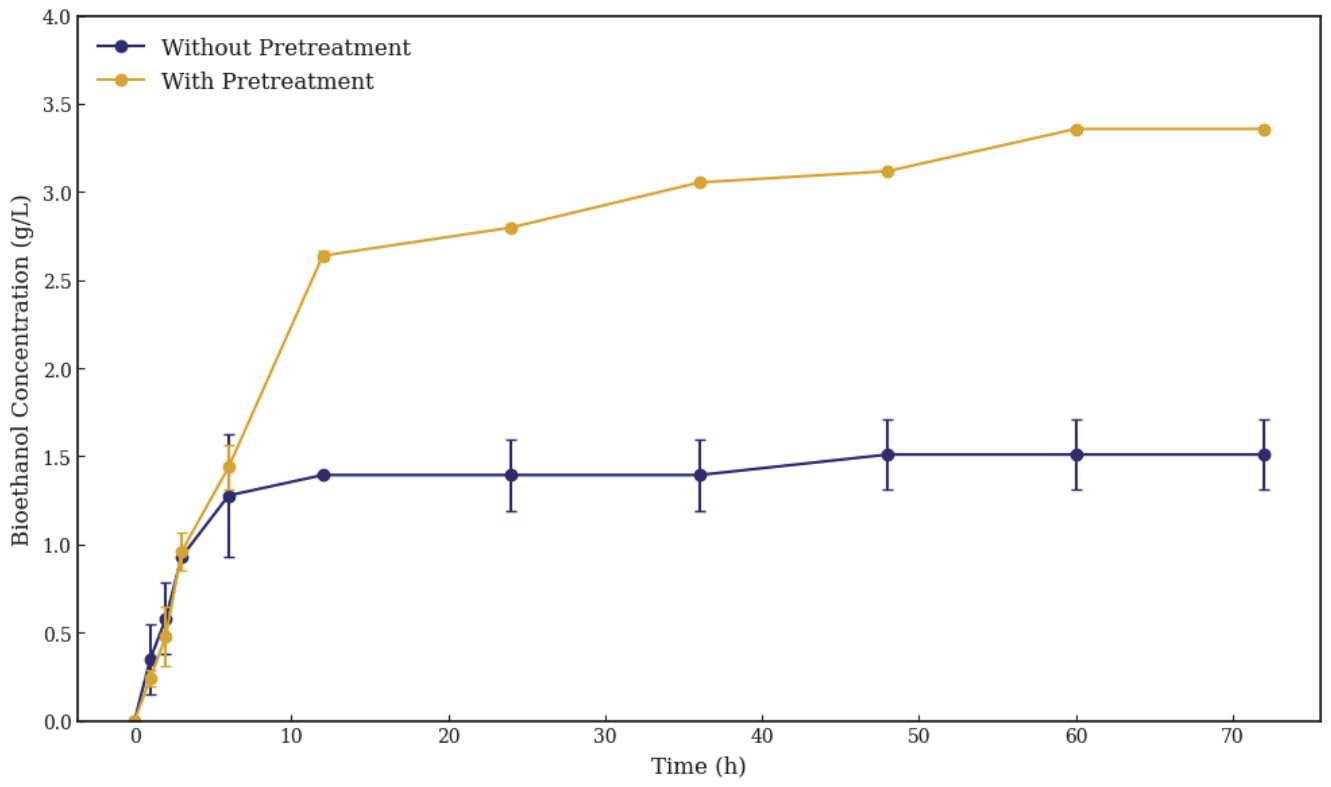
Following the process, as shown in Figure 8, the bioethanol content in the untreated sample was 1.51 g/L, while the catalytic treatment resulted in a maximum concentration of 3.36 g/L. This suggests that the pretreatment directly reduces lignin-derived inhibitors and creates a favorable environment for yeast activity during fermentation. This demonstrates that the use of catalytic processes, such as lignin-first, promotes greater utilization of fermentable sugars [31,75,76].
This yield corresponds to an approximate production of 120 L of bioethanol per ton of treated husk, which is a yield similar to other biomasses such as sugar beet (100–110 L ton−1) or sugar cane (70–90 L ton−1), although low when compared to sugar cane bagasse (318–500 L ton−1) or sorghum bagasse (250 L ton−1) [77,78].
Although bioethanol yield has doubled, it is important to note that the raw material used in the second process was obtained as solid residue from the catalytic fraction. This process valorizes all components of lignocellulosic biomass by depolymerizing lignin into phenolic compounds and fermenting the solid residue to produce bioethanol [74]. The development of this technology, compared to direct anaerobic fermentation of untreated biomass, requires additional inputs such as propylene glycol. It also relies on highly efficient and selective catalysts capable of selectively decomposing the biomass into its main components without generating undesirable byproducts. Furthermore, these catalysts must operate under moderate reaction conditions and maintain their stability over multiple cycles. However, the design of such catalysts remains a challenge due to their high cost [79]. Furthermore, it should be considered that the catalytic fraction generates multiple co-products with environmental impacts that must be attributed to each of them within a life cycle assessment (LCA) framework. Consequently, there will be an increase in the environmental impacts associated with the production of bioethanol obtained from traditional processes [80].

3.5. Modified Gompertz Model

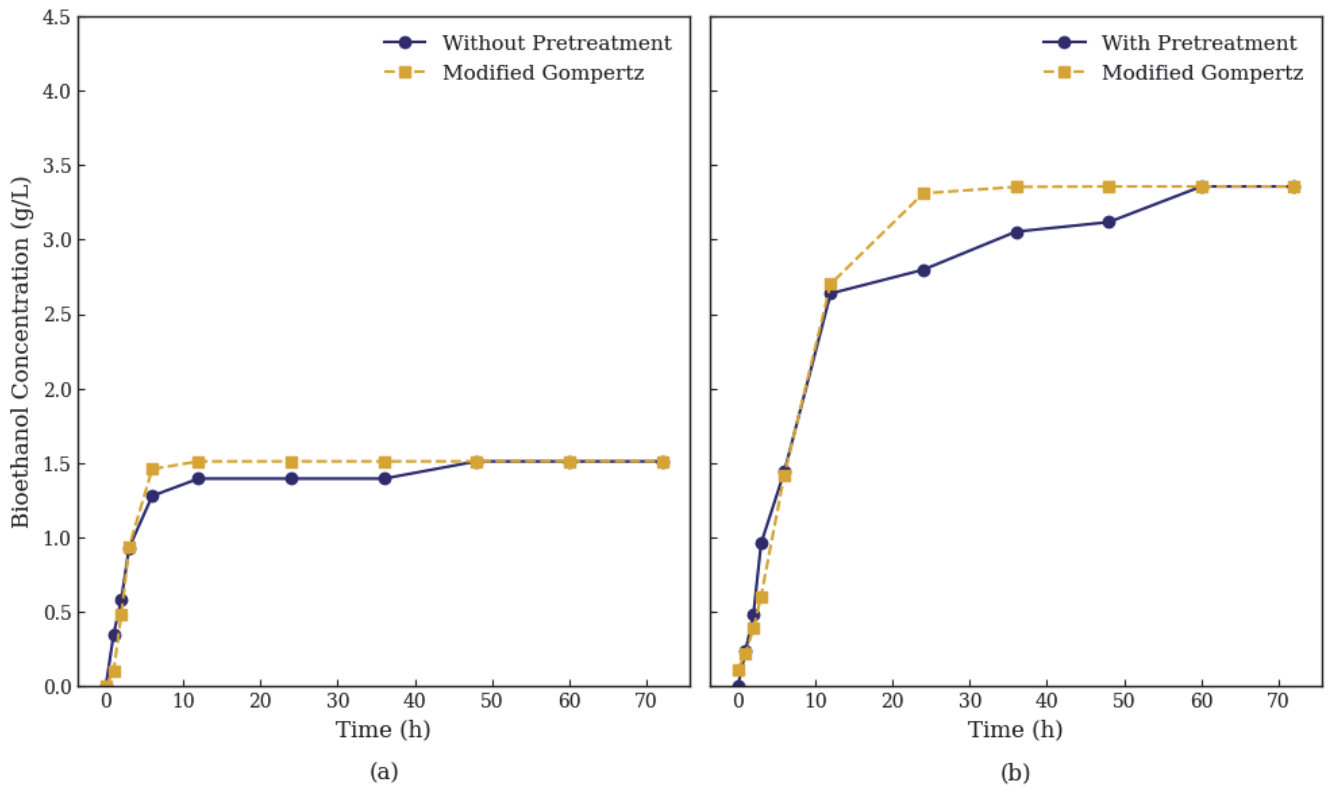
When performing the kinetic modeling in MATLAB®, a one-hour delay was used, as concentration changes began to be observed after this time. The R2 value for the SRC process model was 0.94 and for the RC process model, 0.97, indicating a good fit and representation of the experimental behavior with this nonlinear model.
Table 2 presents a comparative overview of the kinetic parameters derived from the modified Gompertz model for different types of biomass. This table was adapted from the study by Delgado et al. [37]. Regarding our experimental runs, the results indicate a lag phase (tL) of 1 h for both the untreated and catalytically treated samples. Furthermore, the pretreated sample achieved a maximum bioethanol concentration (Pmax) of 3.36 g/L, whereas the untreated sample reached a maximum concentration of only 1.51 g/L.
As shown in Figure 9, comparing the experimentally obtained data with the kinetic model reveals that bioethanol production occurs almost exclusively during the first 24 h of fermentation. This indicates that the maximum bioethanol concentration has been reached and suggests that extending the fermentation time is unnecessary, since a stationary phase occurs after this period instead of the growth phase observed during the first 24 h.
The analysis of the bioethanol content of the untreated sample yielded 90.59 g kg−1 of cocoa husk. In contrast, the pretreated sample yielded 112 g of bioethanol per kg of dry biomass, a higher yield than that obtained without pretreatment. These values are also higher than those reported in other studies on cocoa husk, which indicate yields between 28 and 76.16 g of bioethanol per kg of biomass [64,90].

4. Conclusions

The lignin-first catalytic biorefinery treatment, using a Ni-NiO/α-Al2O3 catalyst, produced structural and compositional modifications in the biomass, as evidenced by SEM, BET, and TGA characterization. The CR sample exhibited a structure with greater porosity, a larger surface area, and lower hemicellulose, extractive, and lignin content, which facilitated cellulose exposure for subsequent conversion processes.
During enzymatic hydrolysis, the increased concentration of hemicellulases improved the release of total sugars in both samples. However, under the evaluated conditions, the pretreated biomass did not show a marked increase in total sugar concentration compared to the biomass without catalytic treatment, suggesting that the benefit of pretreatment is not directly reflected in the hydrolysis stage, but rather in subsequent processes.
In anaerobic fermentation, the RC sample exhibited higher sugar consumption and greater bioethanol production compared to the SRC sample. A maximum concentration of 3.36 g/L and a yield of 112 g of bioethanol per kg of dry biomass were achieved, demonstrating that the catalytic treatment promotes a more suitable fermentation environment, possibly due to the reduction in lignin-derived inhibitory compounds. The Modified Gompertz model adequately described the bioethanol production kinetics (R2 between 0.94 and 0.97), showing that the greatest bioethanol formation occurs in the first 24 h of fermentation.
Taken together, the results confirm that cocoa husks constitute a viable lignocellulosic biomass for the sustainable production of second-generation bioethanol. The integration of a catalytic biorefinery process with enzymatic hydrolysis and anaerobic fermentation represents a promising strategy for the comprehensive valorization of cocoa agro-industrial waste within the framework of a circular economy.

Author Contributions

Conceptualization, J.D.-N., V.P.-V. and A.V.-S.; methodology, J.D.-N. and M.A.-G.; validation, S.A., C.G. and S.I.; formal analysis, S.A., C.G., S.I. and M.A.-G.; investigation, S.A., C.G. and S.I.; writing—original draft preparation, S.A., C.G., S.I., V.P.-V., A.V.-S. and M.A.-G. writing—review and editing, S.A., C.G., S.I., V.P.-V., A.V.-S., M.A.-G. and J.D.-N.; supervision, J.D.-N.; project administration, A.V.-S. All authors have read and agreed to the published version of the manuscript.

Funding

This research was funded by Vicerrectorado de Investigación de la Universidad de Cuenca, Cuenca-Ecuador mediante el proyecto “Valorización de los residuos del cacao mediante la aplicación de técnicas de biorefinería catalítica RCF para la obtención de bioaceite de lignina y bioetanol”.

Institutional Review Board Statement

Not applicable.

Informed Consent Statement

Not applicable.

Data Availability Statement

The original contributions presented in this study are included in the article. Further inquiries can be directed to the corresponding author.

Conflicts of Interest

The authors declare no conflicts of interest.

References

  1. Cherwoo, L.; Gupta, I.; Flora, G.; Verma, R.; Kapil, M.; Arya, S.K.; Ravindran, B.; Khoo, K.S.; Bhatia, S.K.; Chang, S.W.; et al. Biofuels an Alternative to Traditional Fossil Fuels: A Comprehensive Review. Sustain. Energy Technol. Assess. 2023, 60, 103503. [Google Scholar] [CrossRef]
  2. Saleem, A.; Anwar, S.; Nawaz, T.; Fahad, S.; Saud, S.; Ur Rahman, T.; Khan, M.N.R.; Nawaz, T. Securing a Sustainable Future: The Climate Change Threat to Agriculture, Food Security, and Sustainable Development Goals. J. Umm Al-Qura Univ. Appl. Sci. 2025, 11, 595–611. [Google Scholar] [CrossRef]
  3. National Oceanic and Atmospheric Administration Current GHG Levels. Available online: https://www.climate.gov/ghg/current-levels (accessed on 21 July 2025).
  4. Jusmet, J.R. La política climática y los combustibles fósiles: Una perspectiva desde la oferta. Rev. Econ. Crítica 2022, 34, 9–25. [Google Scholar] [CrossRef]
  5. Vorwerg, F.C.; Ebadi Torkayesh, A.; Venghaus, S. From Fossil Fuels to Alternative Fuels: Strategy Development for a Sustainable Transport Sector in Germany. Energy Sustain. Soc. 2025, 15, 4. [Google Scholar] [CrossRef]
  6. Wu, P.; Xuan, T.; He, Z.; Shao, Z.; Wang, Q.; Payri, R. A Comparative Study on Combustion Characteristics of PPC and RCCI Combustion Modes in an Optical Engine with Renewable Fuels. Fuel 2025, 381, 133361. [Google Scholar] [CrossRef]
  7. Edeh, I. Bioethanol Production: An Overview. In Bioethanol Technologies; IntechOpen: London, UK, 2020. [Google Scholar]
  8. Khairati, M. Bioethanol: Advances, Benefits, and Future Prospects. Int. J. Res. Rev. 2024, 11, 568–574. [Google Scholar] [CrossRef]
  9. Renewable Energy Agency IRENA. Sustainable Bioenergy Pathways in Latin America: Promoting Bioenergy Investment and Sustainability. Available online: https://www.irena.org/-/media/Files/IRENA/Agency/Publication/2024/Jan/IRENA_Sustainable_bioenergy_Latin_America_2024.pdf (accessed on 22 March 2026).
  10. Rimkus, A.; Mejeras, G.; Dittrich, A.; Pukalskas, S.; Barta, D. Effect of the Concentration of Bioethanol Mixed with Gasoline on the Energy and Environmental Performance of a Hybrid Vehicle in the Worldwide Harmonized Light Vehicles Test Cycle (WLTC). Appl. Sci. 2024, 14, 10858. [Google Scholar] [CrossRef]
  11. Ayodele, B.V.; Alsaffar, M.A.; Mustapa, S.I. An Overview of Integration Opportunities for Sustainable Bioethanol Production from First- and Second-Generation Sugar-Based Feedstocks. J. Clean. Prod. 2020, 245, 118857. [Google Scholar] [CrossRef]
  12. Mujtaba, M.; Fernandes Fraceto, L.; Fazeli, M.; Mukherjee, S.; Savassa, S.M.; Araujo de Medeiros, G.; do Espírito Santo Pereira, A.; Mancini, S.D.; Lipponen, J.; Vilaplana, F. Lignocellulosic Biomass from Agricultural Waste to the Circular Economy: A Review with Focus on Biofuels, Biocomposites and Bioplastics. J. Clean. Prod. 2023, 402, 136815. [Google Scholar] [CrossRef]
  13. Assaf, J.C.; Mortada, Z.; Rezzoug, S.-A.; Maache-Rezzoug, Z.; Debs, E.; Louka, N. Comparative Review on the Production and Purification of Bioethanol from Biomass: A Focus on Corn. Processes 2024, 12, 1001. [Google Scholar] [CrossRef]
  14. Villanueva, P.G.; García, Y.G. Sacarificación y fermentación simultánea de olote pretratado/Simultaneous Saccharification and Fermentation process of pre-treated corn cob. CIBA Rev. Iberoam. Las Cienc. Biológicas Agropecu. 2016, 5, 53–67. [Google Scholar] [CrossRef]
  15. Singh, A.; Singhania, R.R.; Soam, S.; Chen, C.-W.; Haldar, D.; Varjani, S.; Chang, J.-S.; Dong, C.-D.; Patel, A.K. Production of Bioethanol from Food Waste: Status and Perspectives. Bioresour. Technol. 2022, 360, 127651. [Google Scholar] [CrossRef]
  16. INEN Boletín Técnico ESPAC 2024. Available online: https://www.ecuadorencifras.gob.ec/documentos/web-inec/Estadisticas_agropecuarias/espac/2024/Boletin_tecnico_ESPAC_2024.pdf (accessed on 31 July 2025).
  17. Central Bank of Ecuador. Balanza Comercial por Productos: Enero–Diciembre 2025; Subgerencia de Información Estadística: Quito, Ecuador, 2026.
  18. Mendoza Saltos, M. El Cacao Sube la Vara y Espera Romper la Barrera de los US$ 3.000 Millones en Exportaciones. Available online: https://www.forbes.com.ec/negocios/el-cacao-sube-vara-espera-romper-barrera-us-3000-millones-exportaciones-n59016 (accessed on 25 August 2025).
  19. Anoraga, S.B.; Shamsudin, R.; Hamzah, M.H.; Sharif, S.; Saputro, A.D. Cocoa By-Products: A Comprehensive Review on Potential Uses, Waste Management, and Emerging Green Technologies for Cocoa Pod Husk Utilization. Heliyon 2024, 10, e35537. [Google Scholar] [CrossRef] [PubMed]
  20. Dongmo, D.N.; Nguemthe Ngouanwou, M.G.; Atemkeng, C.D.; Lemoupi Ngomade, S.B.; Kenfack Atangana, J.A.; Tiegam Tagne, R.F.; Kamgaing, T. Bioethanol Production from Cocoa Hydrolysate and the Assessment of Its Environmental Sustainability. Heliyon 2024, 10, e25809. [Google Scholar] [CrossRef]
  21. Ahmed, S.F.; Mofijur, M.; Chowdhury, S.N.; Nahrin, M.; Rafa, N.; Chowdhury, A.T.; Nuzhat, S.; Ong, H.C. Pathways of Lignocellulosic Biomass Deconstruction for Biofuel and Value-Added Products Production. Fuel 2022, 318, 123618. [Google Scholar] [CrossRef]
  22. Abril-González, M.; Vele-Salto, A.; Pinos-Vélez, V. Kinetic Study of Acid Hydrolysis of the Glucose Obtained from Banana Plant. ChemEngineering 2023, 7, 39. [Google Scholar] [CrossRef]
  23. Salto, A.M.V.; González, M.F.A.; Piedra, T.S.Z.; Vélez, V.P.P. Mini-Revisión: Aplicación de líquidos iónicos en hidrólisis ácida de material lignocelulósico para la obtención de azúcares. Cienc. Desarro. 2021, 12, 55–67. [Google Scholar] [CrossRef]
  24. Deng, W.; Feng, Y.; Fu, J.; Guo, H.; Guo, Y.; Han, B.; Jiang, Z.; Kong, L.; Li, C.; Liu, H.; et al. Catalytic Conversion of Lignocellulosic Biomass into Chemicals and Fuels. Green Energy Environ. 2023, 8, 10–114. [Google Scholar] [CrossRef]
  25. Shukla, A.; Kumar, D.; Girdhar, M.; Kumar, A.; Goyal, A.; Malik, T.; Mohan, A. Strategies of Pretreatment of Feedstocks for Optimized Bioethanol Production: Distinct and Integrated Approaches. Biotechnol. Biofuels Bioprod. 2023, 16, 44. [Google Scholar] [CrossRef]
  26. Wang, M.; Qiao, J.; Sheng, Y.; Wei, J.; Cui, H.; Li, X.; Yue, G. Bioconversion of Corn Fiber to Bioethanol: Status and Perspectives. Waste Manag. 2023, 157, 256–268. [Google Scholar] [CrossRef]
  27. Zhang, H.; Han, L.; Dong, H. An Insight to Pretreatment, Enzyme Adsorption and Enzymatic Hydrolysis of Lignocellulosic Biomass: Experimental and Modeling Studies. Renew. Sustain. Energy Rev. 2021, 140, 110758. [Google Scholar] [CrossRef]
  28. Binod, P.; Janu, K.; Sindhu, R.; Pandey, A. Hydrolysis of Lignocellulosic Biomass for Bioethanol Production. In Biofuels; Academic Press: New York, NY, USA, 2011; pp. 229–250. [Google Scholar]
  29. Zhang, H.; Zhang, P.; Wu, T.; Ruan, H. Bioethanol Production Based on Saccharomyces cerevisiae: Opportunities and Challenges. Fermentation 2023, 9, 709. [Google Scholar] [CrossRef]
  30. Abu-Omar, M.M.; Barta, K.; Beckham, G.T.; Luterbacher, J.S.; Ralph, J.; Rinaldi, R.; Román-Leshkov, Y.; Samec, J.S.M.; Sels, B.F.; Wang, F. Guidelines for Performing Lignin-First Biorefining. Energy Environ. Sci. 2021, 14, 262–292. [Google Scholar] [CrossRef]
  31. Wu, Y.; Su, C.; Liao, Z.; Zhang, G.; Jiang, Y.; Wang, Y.; Zhang, C.; Cai, D.; Qin, P.; Tan, T. Sequential Catalytic Lignin Valorization and Bioethanol Production: An Integrated Biorefinery Strategy. Biotechnol. Biofuels Bioprod. 2024, 17, 8. [Google Scholar] [CrossRef]
  32. Aghaei, S.; Karimi Alavijeh, M.; Shafiei, M.; Karimi, K. A Comprehensive Review on Bioethanol Production from Corn Stover: Worldwide Potential, Environmental Importance, and Perspectives. Biomass Bioenergy 2022, 161, 106447. [Google Scholar] [CrossRef]
  33. Chen, L.; van Muyden, A.P.; Cui, X.; Fei, Z.; Yan, N.; Laurenczy, G.; Dyson, P.J. Lignin First: Confirming the Role of the Metal Catalyst in Reductive Fractionation. JACS Au 2021, 1, 729–733. [Google Scholar] [CrossRef]
  34. Rinaldi, R.; Woodward, R.T.; Ferrini, P.; Rivera, H.J.E. Lignin-First Biorefining of Lignocellulose: The Impact of Process Severity on the Uniformity of Lignin Oil Composition. J. Braz. Chem. Soc. 2019, 30, 479–491. [Google Scholar] [CrossRef]
  35. Wu, X.; Fan, X.; Xie, S.; Lin, J.; Cheng, J.; Zhang, Q.; Chen, L.; Wang, Y. Solar Energy-Driven Lignin-First Approach to Full Utilization of Lignocellulosic Biomass under Mild Conditions. Nat. Catal. 2018, 1, 772–780. [Google Scholar] [CrossRef]
  36. Tschulkow, M.; Pizzol, M.; Compernolle, T.; Van den Bosch, S.; Sels, B.; Van Passel, S. The Environmental Impacts of the Lignin-First Biorefineries: A Consequential Life Cycle Assessment Approach. Resour. Conserv. Recycl. 2024, 204, 107466. [Google Scholar] [CrossRef]
  37. Delgado, J.; Serpa, A.; Moreno, J.F.; Bernal, T.; Posso, F.; Tenesaca, O. Optimization and Modelling of Bioethanol Production by the Fermentation of CCN-51 Cocoa Mucilage Using the Sequential Simplex Method and the Modified Gompertz Model. Can. J. Chem. Eng. 2025, 103, 2079–2087. [Google Scholar] [CrossRef]
  38. Sudalyandi, K.; Jeyakumar, R. Kinetics and Modelling of Hydrolysis. In Biofuel Production Using Anaerobic Digestion; Sudalyandi, K., Jeyakumar, R., Eds.; Springer Nature: Singapore, 2022; pp. 85–97. [Google Scholar]
  39. Damayanti, A.; Bahlawan, Z.A.S.; Kumoro, A.C. Modeling of Bioethanol Production through Glucose Fermentation Using Saccharomyces cerevisiae Immobilized on Sodium Alginate Beads. Cogent Eng. 2022, 9, 2049438. [Google Scholar] [CrossRef]
  40. Salakkam, A.; Phukoetphim, N.; Laopaiboon, P.; Laopaiboon, L. Mathematical Modeling of Bioethanol Production from Sweet Sorghum Juice under High Gravity Fermentation: Applicability of Monod-Based, Logistic, Modified Gompertz and Weibull Models. Electron. J. Biotechnol. 2023, 64, 18–26. [Google Scholar] [CrossRef]
  41. Adebule, A.P.; Sanusi, I.A.; Kana, G.E.B. Growth-Associated and Non-Growth-Associated Bioethanol Production Kinetics from Nanoadsorbent-Detoxified Pretreated Hydrolysate. Catal. Lett. 2025, 155, 96. [Google Scholar] [CrossRef]
  42. Moodley, P.; Gueguim Kana, E.B. Bioethanol Production from Sugarcane Leaf Waste: Effect of Various Optimized Pretreatments and Fermentation Conditions on Process Kinetics. Biotechnol. Rep. 2019, 22, e00329. [Google Scholar] [CrossRef] [PubMed]
  43. Conesa, C.; Seguí, L.; Fito, P. Hydrolytic Performance of Aspergillus niger and Trichoderma reesei Cellulases on Lignocellulosic Industrial Pineapple Waste Intended for Bioethanol Production. Waste Biomass Valorization 2018, 9, 1359–1368. [Google Scholar] [CrossRef]
  44. Xu, Q.; Wu, J.; Zou, L.; Ouyang, J.; Zheng, Z. Development of a Process for the Enhanced Enzymatic Digestibility of Solid Waste from Tofu to Yield Fermentable Biosugars. Biocatal. Biotransform. 2022, 40, 64–74. [Google Scholar] [CrossRef]
  45. Yue, F.; Zhang, J.; Xu, J.; Niu, T.; Lü, X.; Liu, M. Effects of Monosaccharide Composition on Quantitative Analysis of Total Sugar Content by Phenol-Sulfuric Acid Method. Front. Nutr. 2022, 9, 963318. [Google Scholar] [CrossRef]
  46. Delgado-Noboa, J.; Bernal, T.; Soler, J.; Peña, J.Á. Kinetic Modeling of Batch Bioethanol Production from CCN-51 Cocoa Mucilage. J. Taiwan Inst. Chem. Eng. 2021, 128, 169–175. [Google Scholar] [CrossRef]
  47. Topaloğlu, A.; Esen, Ö.; Turanlı-Yıldız, B.; Arslan, M.; Çakar, Z.P. From Saccharomyces cerevisiae to Ethanol: Unlocking the Power of Evolutionary Engineering in Metabolic Engineering Applications. J. Fungi 2023, 9, 984. [Google Scholar] [CrossRef]
  48. Noriega-Medrano, L.J.; Vega-Estrada, J.; Ortega-López, J.; Ruiz-Medrano, R.; Cristiani-Urbina, E.; Montes-Horcasitas, M.d.C. Alternative Non-Chromatographic Method for Alcohols Determination in Clostridium acetobutylicum Fermentations. J. Microbiol. Methods 2016, 126, 48–53. [Google Scholar] [CrossRef]
  49. Pinos-Vélez, V.; di Luca, C.; Crivoi, D.G.; Medina, F.; Dafinov, A. Catalytic Palladium-Based and Iron-Based Membrane Reactors: Novel Strategies of Synthesis. ACS Omega 2019, 4, 19818–19828. [Google Scholar] [CrossRef]
  50. He, L.; Ren, Y.; Yue, B.; Tsang, S.C.E.; He, H. Tuning Metal–Support Interactions on Ni/Al2O3 Catalysts to Improve Catalytic Activity and Stability for Dry Reforming of Methane. Processes 2021, 9, 706. [Google Scholar] [CrossRef]
  51. Kim, M.-J.; Kim, J.; Kim, Y.J.; Youn, J.-R.; Kim, D.H.; Shapiro, D.; Guo, J.; Lee, K. Surface Control of Ni-Al2O3 Dry Reforming of Methane Catalyst by Composition Segregation. J. CO2 Util. 2024, 81, 102721. [Google Scholar] [CrossRef]
  52. Wang, B.; Wu, Y.; Wu, W.; Wang, H.; Zhang, K. Fabrication and Properties of NiO-Modified Al2O3 Reinforced Sn1.0Ag0.5Cu Composite Solder and Soldering Performance. J. Mater. Sci. 2022, 57, 17491–17502. [Google Scholar] [CrossRef]
  53. Mohammed, A.A.; Khodair, Z.T.; Khadom, A.A. Preparation and Investigation of the Structural Properties of α-Al2O3 Nanoparticles Using the Sol-Gel Method. Chem. Data Collect. 2020, 29, 100531. [Google Scholar] [CrossRef]
  54. Londoño-Larrea, P.; Villamarin-Barriga, E.; García, A.N.; Marcilla, A. Study of Cocoa Pod Husks Thermal Decomposition. Appl. Sci. 2022, 12, 9318. [Google Scholar] [CrossRef]
  55. Dewi, S.R.; Stevens, L.A.; Anwar, M.; Mao, Y.; Ferrari, R.S.; Irvine, D.J.; Binner, E.R. Towards a Scalable Cacao Pod Husk Biorefinery: Understanding the Effects of Process Conditions on Phenolic Antioxidant Extraction and Residual Solid Properties. Chem. Eng. Sci. 2025, 305, 121171. [Google Scholar] [CrossRef]
  56. Díez, D.; Urueña, A.; Piñero, R.; Barrio, A.; Tamminen, T. Determination of Hemicellulose, Cellulose, and Lignin Content in Different Types of Biomasses by Thermogravimetric Analysis and Pseudocomponent Kinetic Model (TGA-PKM Method). Processes 2020, 8, 1048. [Google Scholar] [CrossRef]
  57. Wyman, C.E.; Dale, B.E.; Elander, R.T.; Holtzapple, M.; Ladisch, M.R.; Lee, Y.Y. Coordinated Development of Leading Biomass Pretreatment Technologies. Bioresour. Technol. 2005, 96, 1959–1966. [Google Scholar] [CrossRef]
  58. Laca, A.; Laca, A.; Díaz, M. Hydrolysis: From Cellulose and Hemicellulose to Simple Sugars. In Second and Third Generation of Feedstocks; Elsevier: Amsterdam, The Netherlands, 2019; pp. 213–240. [Google Scholar]
  59. Sarmiento-Vásquez, Z.; Vandenberghe, L.; Rodrigues, C.; Tanobe, V.O.A.; Marín, O.; de Melo Pereira, G.V.; Ghislain Rogez, H.L.; Góes-Neto, A.; Soccol, C.R. Cocoa Pod Husk Valorization: Alkaline-Enzymatic Pre-Treatment for Propionic Acid Production. Cellulose 2021, 28, 4009–4024. [Google Scholar] [CrossRef]
  60. Jönsson, L.J.; Martín, C. Pretreatment of Lignocellulose: Formation of Inhibitory by-Products and Strategies for Minimizing Their Effects. Bioresour. Technol. 2016, 199, 103–112. [Google Scholar] [CrossRef]
  61. Eliana, C.; Jorge, R.; Juan, P.; Luis, R. Effects of the Pretreatment Method on Enzymatic Hydrolysis and Ethanol Fermentability of the Cellulosic Fraction from Elephant Grass. Fuel 2014, 118, 41–47. [Google Scholar] [CrossRef]
  62. Sharma, S.; Kuila, A.; Sharma, V. Enzymatic Hydrolysis of Thermochemically Pretreated Biomass Using a Mixture of Cellulolytic Enzymes Produced from Different Fungal Sources. Clean Technol. Environ. Policy 2017, 19, 1577–1584. [Google Scholar] [CrossRef]
  63. Jagannathan, P.; Muthukumaran, C.; Tamilarasan, K. A Sequential Pretreatment of Lignocelluloses in Bamboo Biomass to Fermentable Sugars by Acid/Enzymatic Hydrolysis. 3 Biotech 2017, 7, 260. [Google Scholar] [CrossRef]
  64. Alvarez-Barreto, J.F.; Larrea, F.; Pinos, C.M.C.; Benalcázar, J.; Oña, D.; Viteri, D.A.; Leon, M.; Almeida-Streitwieser, D.D. Chemical Pretreatments on Residual Cocoa Pod Shell Biomass for Bioethanol Production. Bionatura 2021, 6, 1490–1500. [Google Scholar] [CrossRef]
  65. Hernández-Mendoza, A.G.; Saldaña-Trinidad, S.; Martínez-Hernández, S.; Pérez-Sariñana, B.Y.; Láinez, M. Optimization of Alkaline Pretreatment and Enzymatic Hydrolysis of Cocoa Pod Husk (Theobroma cacao L.) for Ethanol Production. Biomass Bioenergy 2021, 154, 106268. [Google Scholar] [CrossRef]
  66. Rahman, S.A.; Meryandini, A.; Juanssilfero, A.B.; Fahrurrozi. Cocoa Pod Husk (CPH) for Biomass on Bioethanol Production. Int. J. Adv. Sci. Eng. Inf. Technol. 2023, 13, 828–836. [Google Scholar] [CrossRef]
  67. Das, P.K.; Sahoo, A.; Veeranki, V.D. Engineered Yeasts for Lignocellulosic Bioethanol Production. In Advances in Yeast Biotechnology for Biofuels and Sustainability; Elsevier: Amsterdam, The Netherlands, 2023; pp. 47–72. [Google Scholar]
  68. Mohd Azhar, S.H.; Abdulla, R.; Jambo, S.A.; Marbawi, H.; Gansau, J.A.; Mohd Faik, A.A.; Rodrigues, K.F. Yeasts in Sustainable Bioethanol Production: A Review. Biochem. Biophys. Rep. 2017, 10, 52–61. [Google Scholar] [CrossRef] [PubMed]
  69. Zhu, C.; Zhang, R.; Zhu, L.; Zhu, R.; Jiang, Y.; Ni, Y.; Fan, M.; Li, Q. A Green Biomass Pretreatment Using Iron Ion-Catalyzed Hydrogen Peroxide for Lignocellulose Fermentation and Biofuel Production. Cellulose 2024, 31, 7367–7384. [Google Scholar] [CrossRef]
  70. Wi, S.G.; Cho, E.J.; Lee, D.-S.; Lee, S.J.; Lee, Y.J.; Bae, H.-J. Lignocellulose Conversion for Biofuel: A New Pretreatment Greatly Improves Downstream Biocatalytic Hydrolysis of Various Lignocellulosic Materials. Biotechnol. Biofuels 2015, 8, 228. [Google Scholar] [CrossRef]
  71. Fan, J.; Lu, Y.; An, N.; Zhu, W.; Li, M.; Gao, M.; Wang, X.; Wu, C.; Wang, Y. Pretreatment Technologies for Lignocellulosic Biomass: Research Progress, Mechanisms, and Prospects. BioResources 2025, 20, 4897–4924. [Google Scholar] [CrossRef]
  72. Almeida, J.R.; Modig, T.; Petersson, A.; Hähn-Hägerdal, B.; Lidén, G.; Gorwa-Grauslund, M.F. Increased Tolerance and Conversion of Inhibitors in Lignocellulosic Hydrolysates by Saccharomyces cerevisiae. J. Chem. Technol. Biotechnol. 2007, 82, 340–349. [Google Scholar] [CrossRef]
  73. Bhavana, B.K.; Mudliar, S.N.; Bokade, V.V.; Debnath, S. Effect of Furfural, Acetic Acid and 5-Hydroxymethylfurfural on Yeast Growth and Xylitol Fermentation Using Pichia Stipitis NCIM 3497. Biomass Convers. Biorefinery 2024, 14, 4909–4923. [Google Scholar] [CrossRef]
  74. Jindal, M.; Uniyal, P.; Thallada, B. Reductive Catalytic Fractionation as a Novel Pretreatment/Lignin-First Approach for Lignocellulosic Biomass Valorization: A Review. Bioresour. Technol. 2023, 385, 129396. [Google Scholar] [CrossRef] [PubMed]
  75. Mohan Poludasu, R. Individual and Interactive Effects of Peroxide Pretreatment Varibles on Saccharification and Ethanol Yield in Bagasse. J. Wastes Biomass Manag. 2022, 4, 102–110. [Google Scholar] [CrossRef]
  76. Sagues, W.J.; Bao, H.; Nemenyi, J.L.; Tong, Z. Lignin-First Approach to Biorefining: Utilizing Fenton’s Reagent and Supercritical Ethanol for the Production of Phenolics and Sugars. ACS Sustain. Chem. Eng. 2018, 6, 4958–4965. [Google Scholar] [CrossRef]
  77. Manochio, C.; Andrade, B.R.; Rodriguez, R.P.; Moraes, B.S. Ethanol from Biomass: A Comparative Overview. Renew. Sustain. Energy Rev. 2017, 80, 743–755. [Google Scholar] [CrossRef]
  78. Zabed, H.; Sahu, J.N.; Suely, A.; Boyce, A.N.; Faruq, G. Bioethanol Production from Renewable Sources: Current Perspectives and Technological Progress. Renew. Sustain. Energy Rev. 2017, 71, 475–501. [Google Scholar] [CrossRef]
  79. Kumar, A.; Jindal, M.; Rawat, S.; Kumar, J.; Sripadi, P.; Yang, B.; Thallada, B. Upgradation of Sugarcane Bagasse Lignin: Fractionation to Cyclic Alcohols Production. Catal. Today 2023, 408, 182–193. [Google Scholar] [CrossRef]
  80. Dominguez Aldama, D.; Grassauer, F.; Zhu, Y.; Ardestani-Jaafari, A.; Pelletier, N. Allocation Methods in Life Cycle Assessments (LCAs) of Agri-Food Co-Products and Food Waste Valorization Systems: Systematic Review and Recommendations. J. Clean. Prod. 2023, 421, 138488. [Google Scholar] [CrossRef]
  81. García, G.; Moreno, J.F.; Bernal, T.; Posso, F.; Delgado-Noboa, J. Kinetic Modeling of Mead Production. J. Am. Soc. Brew. Chem. 2024, 82, 170–178. [Google Scholar] [CrossRef]
  82. Dodić, S.; Popov, S.; Dodić, J.; Ranković, J.; Zavargo, Z.; Jevtić Mučibabić, R. Bioethanol Production from Thick Juice as Intermediate of Sugar Beet Processing. Biomass Bioenergy 2009, 33, 822–827. [Google Scholar] [CrossRef]
  83. Phukoetphim, N.; Salakkam, A.; Laopaiboon, P.; Laopaiboon, L. Kinetic Models for Batch Ethanol Production from Sweet Sorghum Juice under Normal and High Gravity Fermentations: Logistic and Modified Gompertz Models. J. Biotechnol. 2017, 243, 69–75. [Google Scholar] [CrossRef]
  84. Sewsynker-Sukai, Y.; Gueguim Kana, E.B. Simultaneous Saccharification and Bioethanol Production from Corn Cobs: Process Optimization and Kinetic Studies. Bioresour. Technol. 2018, 262, 32–41. [Google Scholar] [CrossRef]
  85. Chohan, N.A.; Aruwajoye, G.S.; Sewsynker-Sukai, Y.; Gueguim Kana, E.B. Valorisation of Potato Peel Wastes for Bioethanol Production Using Simultaneous Saccharification and Fermentation: Process Optimization and Kinetic Assessment. Renew. Energy 2020, 146, 1031–1040. [Google Scholar] [CrossRef]
  86. Rorke, D.C.S.; Kana, E.B.G. Kinetics of Bioethanol Production from Waste Sorghum Leaves Using Saccharomyces cerevisiae BY4743. Fermentation 2017, 3, 19. [Google Scholar] [CrossRef]
  87. Sebayang, A.H.; Hassan, M.H.; Ong, H.C.; Dharma, S.; Silitonga, A.S.; Kusumo, F.; Mahlia, T.M.I.; Bahar, A.H. Optimization of Reducing Sugar Production from Manihot Glaziovii Starch Using Response Surface Methodology. Energies 2016, 10, 35. [Google Scholar] [CrossRef]
  88. Srimachai, T.; Nuithitikul, K.; O-Thong, S.; Kongjan, P.; Panpong, K. Optimization and Kinetic Modeling of Ethanol Production from Oil Palm Frond Juice in Batch Fermentation. Energy Procedia 2015, 79, 111–118. [Google Scholar] [CrossRef]
  89. Ayala, H.; Kaiser, D.; Pavón, S.; Molina, E.; Siguenza, J.; Bertau, M.; Lapo, B. Valorization of Cocoa’s Mucilage Waste to Ethanol and Subsequent Direct Catalytic Conversion into Ethylene. J. Chem. Technol. Biotechnol. 2022, 97, 2171–2178. [Google Scholar] [CrossRef]
  90. Porto de Souza Vandenberghe, L.; Kley Valladares-Diestra, K.; Amaro Bittencourt, G.; Fátima Murawski de Mello, A.; Sarmiento Vásquez, Z.; Zwiercheczewski de Oliveira, P.; Vinícius de Melo Pereira, G.; Ricardo Soccol, C. Added-Value Biomolecules’ Production from Cocoa Pod Husks: A Review. Bioresour. Technol. 2022, 344, 126252. [Google Scholar] [CrossRef]
Figure 1. TEM image of the catalyst Ni-NiO/α-Al2O3.
Fermentation 12 00257 g001
Figure 2. X-ray diffraction of the catalyst Ni-NiO/α-Al2O3.
Fermentation 12 00257 g002
Figure 3. SEM analysis (a) SRC sample; (b) RC sample.
Fermentation 12 00257 g003
Figure 4. Thermogravimetric analysis of the SRC and RC samples: (a) mass loss curves as a function of temperature; (b) DTG curves as a function of time.
Fermentation 12 00257 g004
Figure 5. Deconvolution of the DTG curve (a) untreated cocoa biomass; (b) cocoa biomass with catalytic treatment.
Fermentation 12 00257 g005
Figure 6. Curves of total sugar concentrations for the different hydrolyses performed: (a) without pretreatment; and (b) with catalytic pretreatment.
Fermentation 12 00257 g006
Figure 7. Curve of total sugar reduction during fermentation.
Fermentation 12 00257 g007
Figure 8. Curve of bioethanol production during fermentation.
Fermentation 12 00257 g008
Figure 9. Comparative curves of bioethanol production performed for: (a) Without pretreatment; and (b) With catalytic pretreatment.
Fermentation 12 00257 g009
Table 1. Experimental design for enzyme loading per gram of dry solid. Assay conditions: 45 °C, 200 rpm, pH 5.2 (0.05 M sodium citrate buffer), solid biomass loading 1.67% (w/w). Enzyme activities (FPU and U) were based on manufacturer specifications.
CodeCatalytic PretreatmentCellulase Concentration (FPU/g)Hemicellulase Concentration (U/g)
SRC1NO6.5100
SRC2NO13300
SRC3NO19.5300
RC1YES6.5100
RC2YES13300
RC3YES19.5300
Table 2. Comparison of kinetic parameters obtained from the modified Gompertz model for various types of lignocellulosic biomass.
SubstratePmax (g/L)rpm (g/L h)tL (h)Reference
Mead8.500.271.98García et al. [81]
Sugar beet raw juice73.314.391.04Dodić et al. [82]
Sweet sorghum juice88.481.822.98Phukoetphim et al. [83]
Corn cobs42.242.391.98Sukai and Kana [84]
Potato peel waste15.481.514.66Chohan et al. [85]
Sorghum leaves17.150.526.31Rorke and Gueguim [86]
Manihot glaziovii starch87.471.842.94Sebayang et al. [87]
Oil palm frond juice3.790.080.77Srimachai et al. [88]
Cocoa mucilage waste86.502.0318.56Ayala et al. [89]
CCN-51 cocoa mucilage28.512.422Delgado et al. [37]
Cocoa husk1.510.491This Study
Pretreated Cocoa husk3.360.281This Study
Disclaimer/Publisher’s Note: The statements, opinions and data contained in all publications are solely those of the individual author(s) and contributor(s) and not of MDPI and/or the editor(s). MDPI and/or the editor(s) disclaim responsibility for any injury to people or property resulting from any ideas, methods, instructions or products referred to in the content.