Article

Bacillus subtilis Genome Reduction Improves Surfactin Production

by
Vitória Fernanda Bertolazzi Zocca
,
Fabiane de Oliveira Barban
,
Guilherme Engelberto Kundlatsch
,
Leonardo Ferro Tavares
,
Flávio Pereira Picheli
,
Adriana Candido da Silva Moura
and
Danielle Biscaro Pedrolli
*
School of Pharmaceutical Sciences, Department of Bioprocess Engineering and Biotechnology, Universidade Estadual Paulista (UNESP), Rodovia Araraquara-Jau km1, Araraquara 14800-903, Brazil
*
Author to whom correspondence should be addressed.
Fermentation 2025, 11(9), 508; https://doi.org/10.3390/fermentation11090508 (registering DOI)
Submission received: 28 July 2025 / Revised: 17 August 2025 / Accepted: 27 August 2025 / Published: 30 August 2025
(This article belongs to the Special Issue The Industrial Feasibility of Biosurfactants)

Abstract

Bacillus subtilis ∆6 is a genome-reduced strain derived from the laboratory strain 168 through deletion of six prophages and AT-rich islands. The parental and the genome-reduced strains were edited to restore the capacity to synthesize surfactin. Although the genome deletions are not directly related to surfactin biosynthesis, the ∆6 strain produces more surfactin while building lower biomass compared to the parental strain. Further editions to ∆6, such as srfA promoter replacement, codY deletion, and comA overexpression, were deleterious to surfactin production. The results showcase that the ∆6 is metabolically distinct from its parental strain and other surfactin-producing strains, as the gene editions made have been previously described to increase surfactin production in these strains. The ∆6 produced the highest surfactin titer, rate, and yield in LB medium enriched with glucose, compared to other commonly used media for B. subtilis. This work demonstrates the enhanced capacity of a genome-reduced strain to produce surfactin compared to the parental strain, as well as the metabolic changes resulting from genome engineering.

1. Introduction

Genome reduction has been used to reduce complexity and heterogeneity by streamlining existing microbial genomes. Common targets are non-essential genes such as those related to mobile genetic elements, extracellular proteases, sporulation, flagella formation, and antibiotic biosynthesis [1]. A genome-reduced strain is, ideally, a simplified cell factory with comparable growth and higher productivity than its parental strain, since it saves energy with genome replication and synthesis of dispensable proteins and has the potential to redirect precursors to the synthesis of value-added compounds [2]. Genome reduction in Bacillus subtilis has been performed stepwise from the laboratory strain 168, starting with 8% (strain Δ6) and reaching up to 36% (strain PS38) of reduction in the size of its chromosome [1,3]. These strains exhibit some notable traits, including increased total cellular NADPH levels, superior secretion of difficult-to-produce antigens, and a good capacity to produce surfactin and acetoin [3,4,5].
Surfactin is a lipopeptide first isolated from B. subtilis in 1968 [6] and since then, it has attracted attention due to its potent surfactant activity, excellent surface activity [6,7], antimicrobial properties [8], high temperature stability, and salt tolerance [7]. However, despite more than half a century of studies, producing surfactin on a large scale remains a challenge.
Surfactin biosynthesis, mediated by non-ribosomal peptide synthetases (NRPSs), integrates multiple metabolic pathways, encompassing the initial synthesis of precursor molecules and culminating in the assembly of the biosurfactant. Once the precursor molecules (fatty acids, NADPH, glutamate, aspartate, valine, and leucine) are available in the cell, surfactin biosynthesis is catalyzed by the modular peptide synthetases SrfAA, SrfAB, SrfAC, and SrfAD, encoded by the srfA operon (26 kb) [9,10,11]. The first three synthetases form a set of seven modules that are responsible for the incorporation of amino acid residues into the lipopeptide structure [10]. The modules have catalytic domains for adenylation, peptidyl carrier (or thiolation), condensation, epimerization, and thioesterase, which are responsible for amino acid activation, peptide chain elongation, and product release [12,13]. Surfactin biosynthesis depends on the maturation of SrfAA, SrfAB, and SrfAC subunits, which occurs through the activation of their peptidyl carrier domains by a 4-phosphopantetheyl transferase encoded by the sfp gene [14]. The SrfAD synthetase recycles misfolded peptidyl carrier domains [10].
Naturally, the transcription of the srfA operon is controlled by the PsrfA promoter, which is activated by the binding of the phosphorylated ComA protein associated with the sigma factor SigA [11]. ComA is a response regulator in the two-component regulatory system ComP/ComA. ComA phosphorylation is the result of a cascade effect initiated by the signal peptide ComX from the quorum-sensing system COMQXPA of B. subtilis, which responds to the cellular concentration in the medium [15]. Rap proteins, a family of aspartate phosphatases, are known to inhibit ComA activity. Meanwhile, Phr peptides, especially PhrC (also known as CSF for competence and sporulation stimulating factor), stimulate ComA activity by antagonizing the Rap regulators [15,16].
The PsrfA is also subject to repression by the CodY protein, a GTP- and branched-chain amino acid-dependent transcriptional regulator, that directly binds to the promoter region and blocks RNA polymerase activity [17]. Other regulators, such as DegU, Abh, PhoP, PerR, and Spx, can influence srfA operon transcription, but some of their mechanisms remain unclear [11,18,19,20,21].
Here, we evaluated the capacity of B. subtilis Δ6 as a surfactin producer and the effect of genome editing affecting the regulation of the srfA operon on surfactin production. Δ6 is a genome-reduced strain derived from B. subtilis 168 through deletion of two prophages (SPβ, PBSX), three prophage-like regions (prophage 1, prophage 3, and skin), and the large polyketide synthase operon (pks), resulting in a 7.7% genome reduction [22,23]. The strain is genetically more stable compared to its parental strain and other natural surfactin-producer strains due to the deletion of prophages and the BsuM restriction-modification system [22], an important trait for industrial strains. Moreover, the deletion of the pks operon, which encodes polyketide synthases related to bacillaene synthesis [24], could be beneficial for surfactin production due to the elimination of competition for precursors [25]. Despite the significant genome reduction, the strain shows no significant difference in physiology, metabolic flux patterns, or genetic competence compared to the parental strain. Importantly, Δ6 maintains the same maximum growth rate as B. subtilis 168.

2. Materials and Methods

2.1. DNA Sequences and Cloning

All plasmids used were derived from pJOE8999 [26]. For each edition, we designed a guide sequence (GS) for the gRNA and a donor DNA sequence for double-strand break repair through homology recombination. The gRNA was designed using online tools such as the CRISPR-Cas9 guide RNA design checker (available on the IDT Integrated DNA Technologies website) and Cas-Designer from CRISPR RGEN Tools [27], and acquired as a pair of single-stranded DNA oligonucleotides. The GS oligonucleotides were annealed and cloned into pJOE8999 using the BsaI restriction sites upstream of the SpCas9 gRNA scaffold sequence (sgRNA) and following usual molecular biology digestion and ligation protocols. The donor DNA consisted of two 400–800 bp homology sequences flanking the desired genome editing site. The parts of the donor DNA were PCR-amplified from genomic DNA or purchased as a synthetic DNA sequence. The parts were assembled through Golden Gate using BsaI restriction sites. The complete donor sequence was cloned into the plasmid using SfiI restriction sites. Plasmid construction was confirmed by Sanger sequencing. All the plasmids used are described in Table 1. More details about the gRNA and donor DNA sequences are provided in Appendix A (Table A1 and Table A2), and sequences corresponding to the donor DNA are provided in the Supplementary Materials.

2.2. Bacterial Strains and Growth Conditions

E. coli TOP10 was used for cloning procedures, and E. coli JM109 was used for plasmid propagation. B. subtilis strains were derived from strains 168 and Δ6, both non-producers of surfactin. All bacterial strains used are presented in Table 2.
Lysogeny broth (LB) was used for cloning and transformation procedures (10 g L−1 tryptone, 5 g L−1 yeast extract, and 10 g L−1 NaCl), enriched with kanamycin (final concentration of 50 µg mL−1 for E. coli and 5 µg mL−1 for B. subtilis). For surfactin production, B. subtilis strains were cultivated in two complex media: LB and PW, and two mineral media: MM1 and MM2. PW medium is composed of 1 g L−1 yeast extract, 25 g L−1 NaNO3, 0.333 g L−1 KH2PO4, 1 g L−1 Na2HPO4·12H2O, 0.15 g L−1 MgSO4·7H2O, 7.5 mg L−1 CaCl2, 6 mg L−1 MnSO4·H2O, 6 mg L−1 FeSO4·7H2O, pH 7.0. MM1 medium is composed of 4 g L−1 KH2PO4, 12.2 g L−1 K2HPO4, 3.3 g L−1 (NH4)2SO4, 0.123 g L−1 MgSO4·7H2O, 2.32 mg L−1 MnSO4·4H2O, 1.7 mg L−1 ZnCl2, 22 mg L−1 ferric ammonium citrate, supplemented with tryptophan 50 µg mL−1, pH 7.0. MM2 has the same composition as MM1, except that the nitrogen source (NH4)2SO4 was replaced with 4.25 g L−1 NaNO3. LB medium was tested without sugar supplementation and with glucose at 1% or 2% (m/v). PW, MM1, and MM2 media were supplemented with glucose at 1% or 2% (m/v). The standard cultivation medium was LB enriched with 1% (m/v) glucose, unless otherwise stated. Chloramphenicol at a final concentration of 5 µg mL−1 was added to the overnight pre-cultures of B. subtilis Δ6 derivatives.
Cultivations for surfactin production were carried out in test tubes (23 mm diameter × 145 mm height) and 250 mL Erlenmeyer flasks containing 6 and 25 mL of culture, respectively. All bacterial strains were aerobically cultivated at 37 °C and 220 rpm.

2.3. B. subtilis Strain Engineering

Genome editing with CRISPR-Cas9 was carried out following a protocol adapted from [26]. B. subtilis cells were transformed with plasmids derived from pJOE8999 following the two-step transformation protocol [29]. Transformed cells were plated on LB enriched with 5 g L−1 mannose and 5 µg mL−1 kanamycin. The plates were incubated at 37 °C for two days. Isolated colonies were collected and streaked onto new LB plates enriched with mannose and 5 µg mL−1 kanamycin and incubated at 30 °C for one day. Following, single colonies were collected, streaked out on LB plates, and incubated at 42 °C (for strain 168) and 46 °C (for strain Δ6 and its derivates) for one day for plasmid curing. The next day, plasmid curing was repeated at higher temperatures: single colonies were selected, streaked out on an LB plate, and incubated at 46 °C (for strain 168) and 50 °C (for strain Δ6 and its derivates) for one more day. Finally, isolated colonies were tested for plasmid loss: single colonies were streaked out on both LB and LB plates enriched with 5 µg mL−1 kanamycin and incubated at 37 °C overnight. Colonies that grew only on the LB plates were then tested for genome editing through colony PCR and Sanger sequencing. Positive clones were preserved at –80 °C with 20% (v/v) glycerol.
To eliminate the premature stop codon in the sfp gene and enable surfactin production, B. subtilis strains 168 and Δ6 were edited using pEBScas9.1, resulting in B. subtilis CS01 and D6S01. Strain D6S01 was further edited with pEBScas9.2 and pEBScas9.3, resulting in strains D6S02 and D6S03, respectively. Strain D6S02 was further edited with pEBScas9.4, resulting in strain D6S04. Strain D6S04 was further edited with pEBScas9.5, resulting in strain D6S05. Strain D6S05 was further edited with pEBScas9.6, resulting in strain D6S06.

2.4. Analytical Methods

Culture samples were collected periodically to determine growth and surfactin production. Culture growth was measured by optical density at 600 nm (OD600) in a 96-well transparent plate filled with 200 µL samples and read in a microplate reader Tecan Infinite 200 Pro (Tecan, Männedorf, Switzerland). B. subtilis cell suspensions at different OD600 were dried out completely and weighed to correlate OD600 to dry weight. The conversion of OD600 to biomass (g L−1) was calculated based on the resulting calibration curve using Equation (1):
O D 600   =   1.1005 × B i o m a s s   ( g · L 1 )     0.0046
where R 2 = 0.9984 and 0.089   g / L B i o m a s s 0.896   g / L .
Culture samples were centrifuged at 17,000× g for 10 min at room temperature to collect the cell-free supernatant. The reducing sugars (glucose) present in the supernatant were quantified by the method of Miller [30] modified by [31].
Surfactin was measured by HPLC after extraction using the cell-free supernatant [32]. Extraction started by adding 2 mL of chloroform/methanol (2:1) to 2 mL of culture supernatant. The mixture was vortexed for 30 s and centrifuged at 3000× g for 10 min at 4 °C. The lower layer was collected in a fresh tube, and the extraction process was repeated two more times with the upper layer. The fractions collected were dried out in a fume hood at room temperature overnight. Dried samples were resuspended in 2 mL of methanol 100% (HPLC grade) and filtered through a hydrophilic PTFE 0.22 μm membrane. HPLC analysis was performed on Shimadzu Scientific Instruments equipment (Kyoto, Japan) with an SPD-M20A photodiode detector, using an InfinityLab Poroshell 120 EC-C18 column (3.0 × 50 mm, 2.7 μm; Agilent–Santa Clara, CA, USA). The mobile phase consisted of acetonitrile (HPLC grade) and 3.8 mM trifluoroacetic acid (TFA) at 80:20 (v/v), and an isocratic flow of 0.4 mL/min at 30 °C [33,34]. Surfactin isoforms were detected at 200 nm and compared to the HPLC-grade standard (Merck S3523) used to build the calibration curve.
The cell-free supernatant was also used to quantify surfactin by a colorimetric method based on bromothymol blue (BTB) and cetylpyridinium chloride (CPC) [35]. The reaction was carried out on a 48-well transparent plate, adding 100 µL of sample and 800 µL of 0.1 mM CPC–BTB (buffered with 0.1 M PBS at pH 8.0). The plate was incubated for five minutes at room temperature and orbital shaking (6 mm amplitude) in the microplate reader, and the change of color was measured at 600 nm in the microplate reader. Surfactin HPLC-grade standard (Merck S3523) was used to build the calibration curve.

2.5. Data Analysis

The yields of surfactin per substrate (YP/S) and product per biomass (YP/X) were determined using Equations (2) and (3).
Y P / S = P S
Y P / X = P X
where P is the highest surfactin concentration detected in g L−1, S is the consumed total reducing sugar in g L−1, and X is the biomass in g L−1 at the highest point detected.
It is noteworthy that B. subtilis preferably consumes glucose, and when it is depleted, B. subtilis may use complex mixtures such as yeast extract (present in LB and PW media) and tryptone (LB medium) as carbon sources. Therefore, the reported yields represent values under the assumption that the reducing sugars (glucose included) were the sole carbon source.
Statistical analysis was performed using one-way ANOVA, Levene test for equality of variances, and post hoc Tukey test with 95% significance. For data with p < 0.05 on the Levene test, the post hoc Games–Howell test was performed with 95% significance.

3. Results

3.1. Genome-Reduced B. subtilis Performs Better than Its Parental Strain

Laboratory strains, such as B. subtilis 168, carry a mutant sfp gene that encodes a truncated and inactive 4’-phosphopantetheinyl transferase (Sfp). Such strains still have a functional srfA operon. However, the encoded non-ribosomal peptide synthases are unable to synthesize surfactin if not activated by Sfp. We edited the genomes of B. subtilis strains 168 and D6 to reverse the mutation and turn them into surfactin producers, resulting in strains D6S01 and CS01, respectively (Figure 1A).
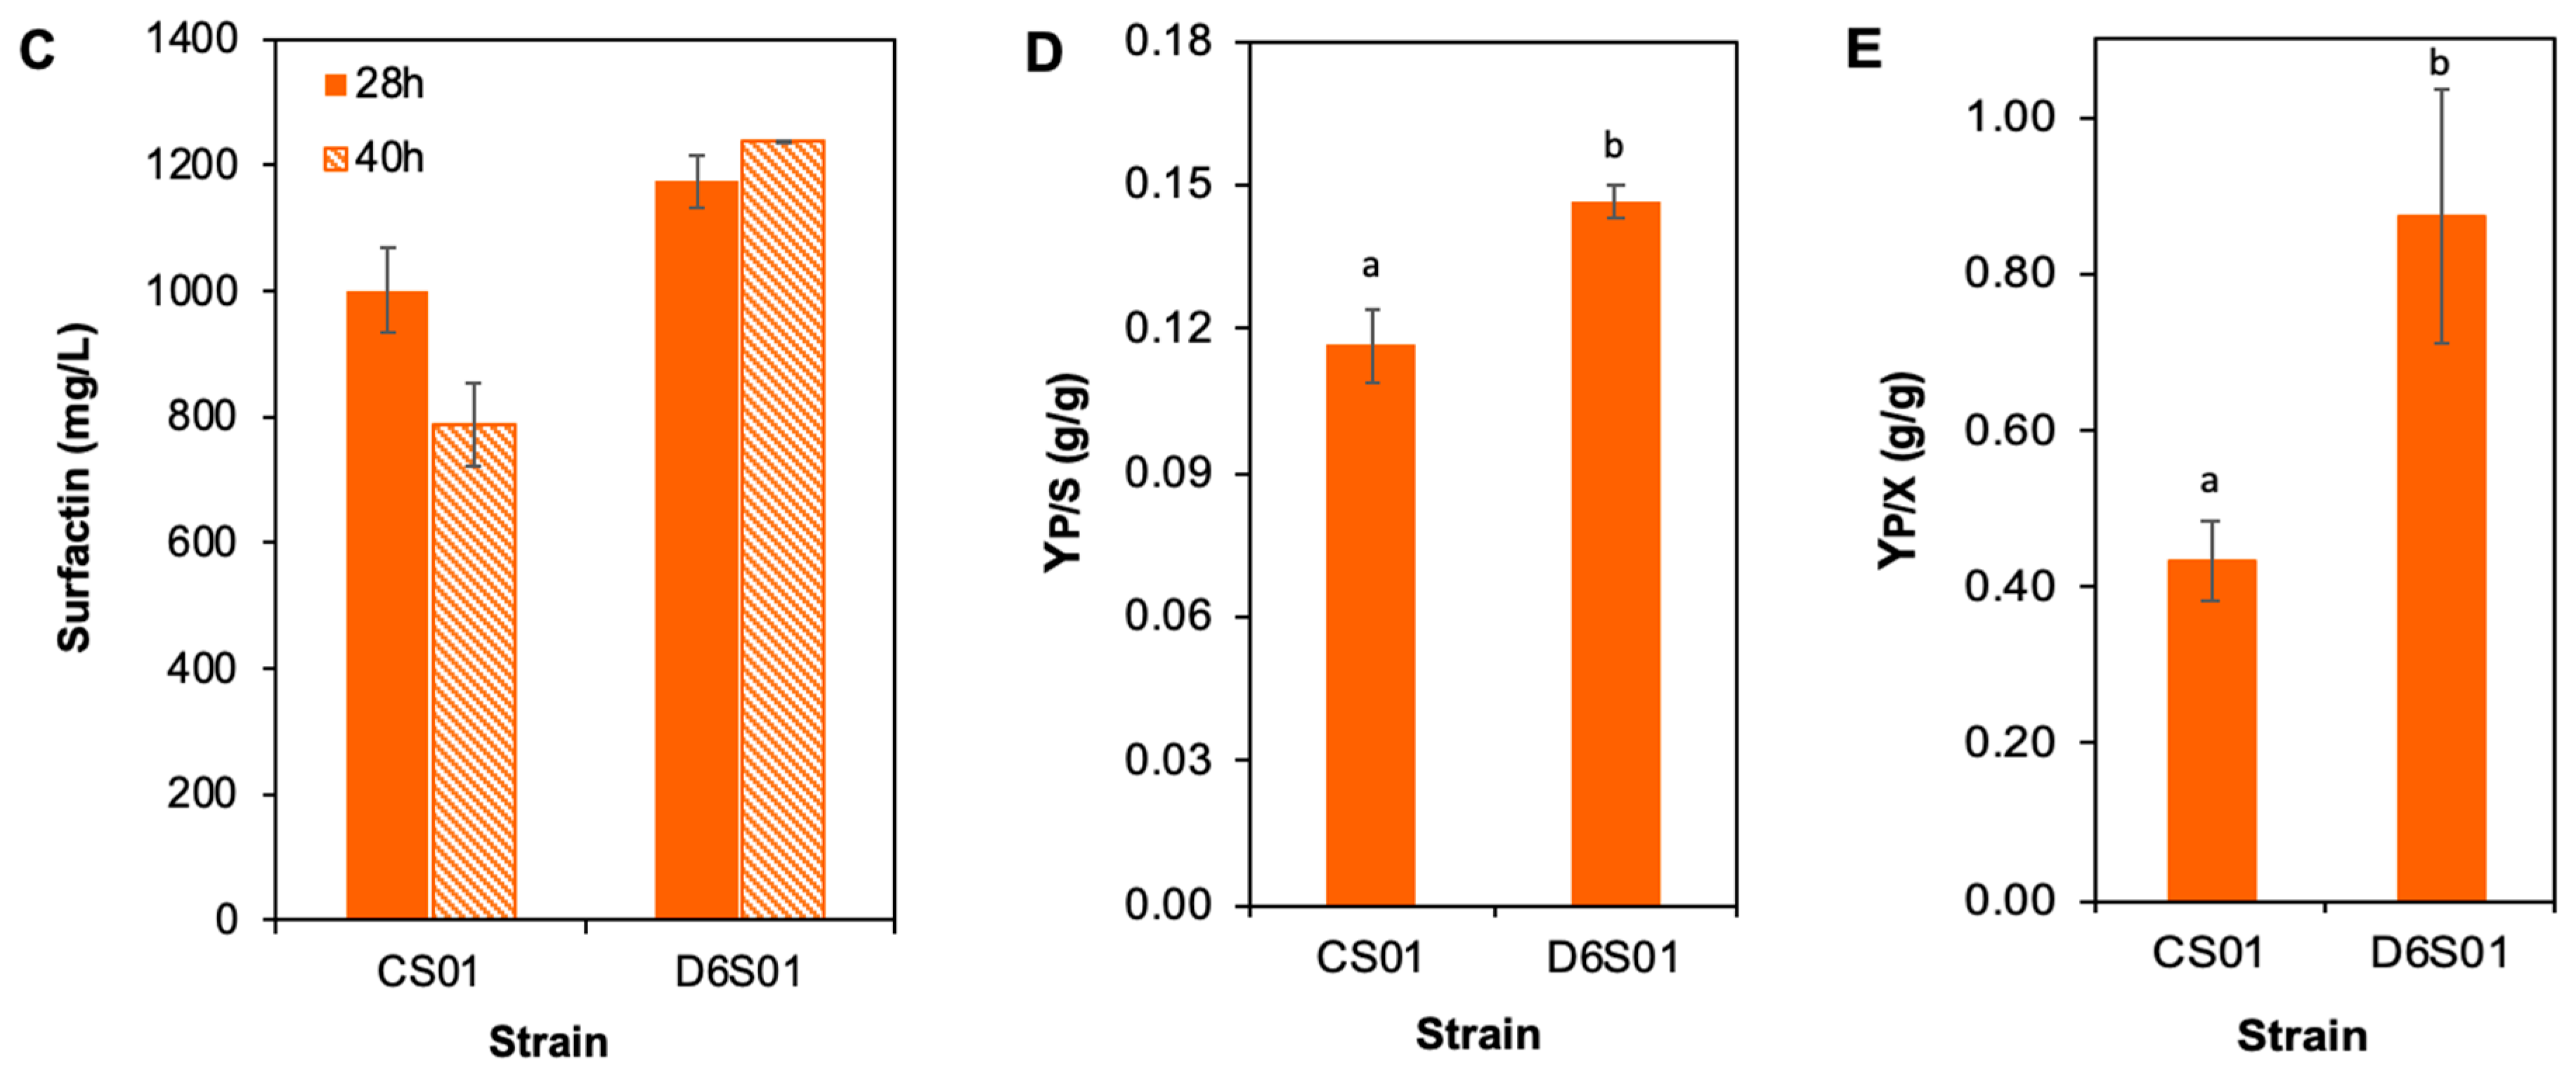
Strain CS01 showed faster and higher biomass formation, reaching 2.3 g L−1 in 28 h compared to 1.4 g L−1 reached by D6S01 in the same period (Figure 1B). Surfactin concentration for both strains reached a maximum within 28 h, when D6S01 produced 1.2 g L−1 and CS01 produced 1.0 g L−1. The difference between the strains was larger after 40 h, when CS01 degraded some of the surfactin in the culture medium, while D6S01 preserved the produced biosurfactant (Figure 1C). The strain D6S01 was slightly better at converting glucose into surfactin, reaching 0.15 g g−1 compared to 0.12 for CS01 (Figure 1D). The higher difference was found for the product yield per biomass, with D6S01 reaching 0.87, twice as high as the yield reached by CS01 (Figure 1E). These findings indicate that the genome-reduced strain redirected resources from biomass to product formation, compared to the parental strain.
The surfactin mixture produced by the DS6S01 strain is composed of 21% C14-surfactin and 42.8% C15-surfactin. Additional peaks, potentially accounting for C16- and C17-surfactins, were also found. The total share of surfactins with 15 or longer C-chains was 58.7% of the total surfactin amount produced. This is very similar to the composition of the surfactin produced by the CS01, with 23% of C14 and 56.5% of C15 or longer C-chain surfactins.

3.2. Promoter Editing

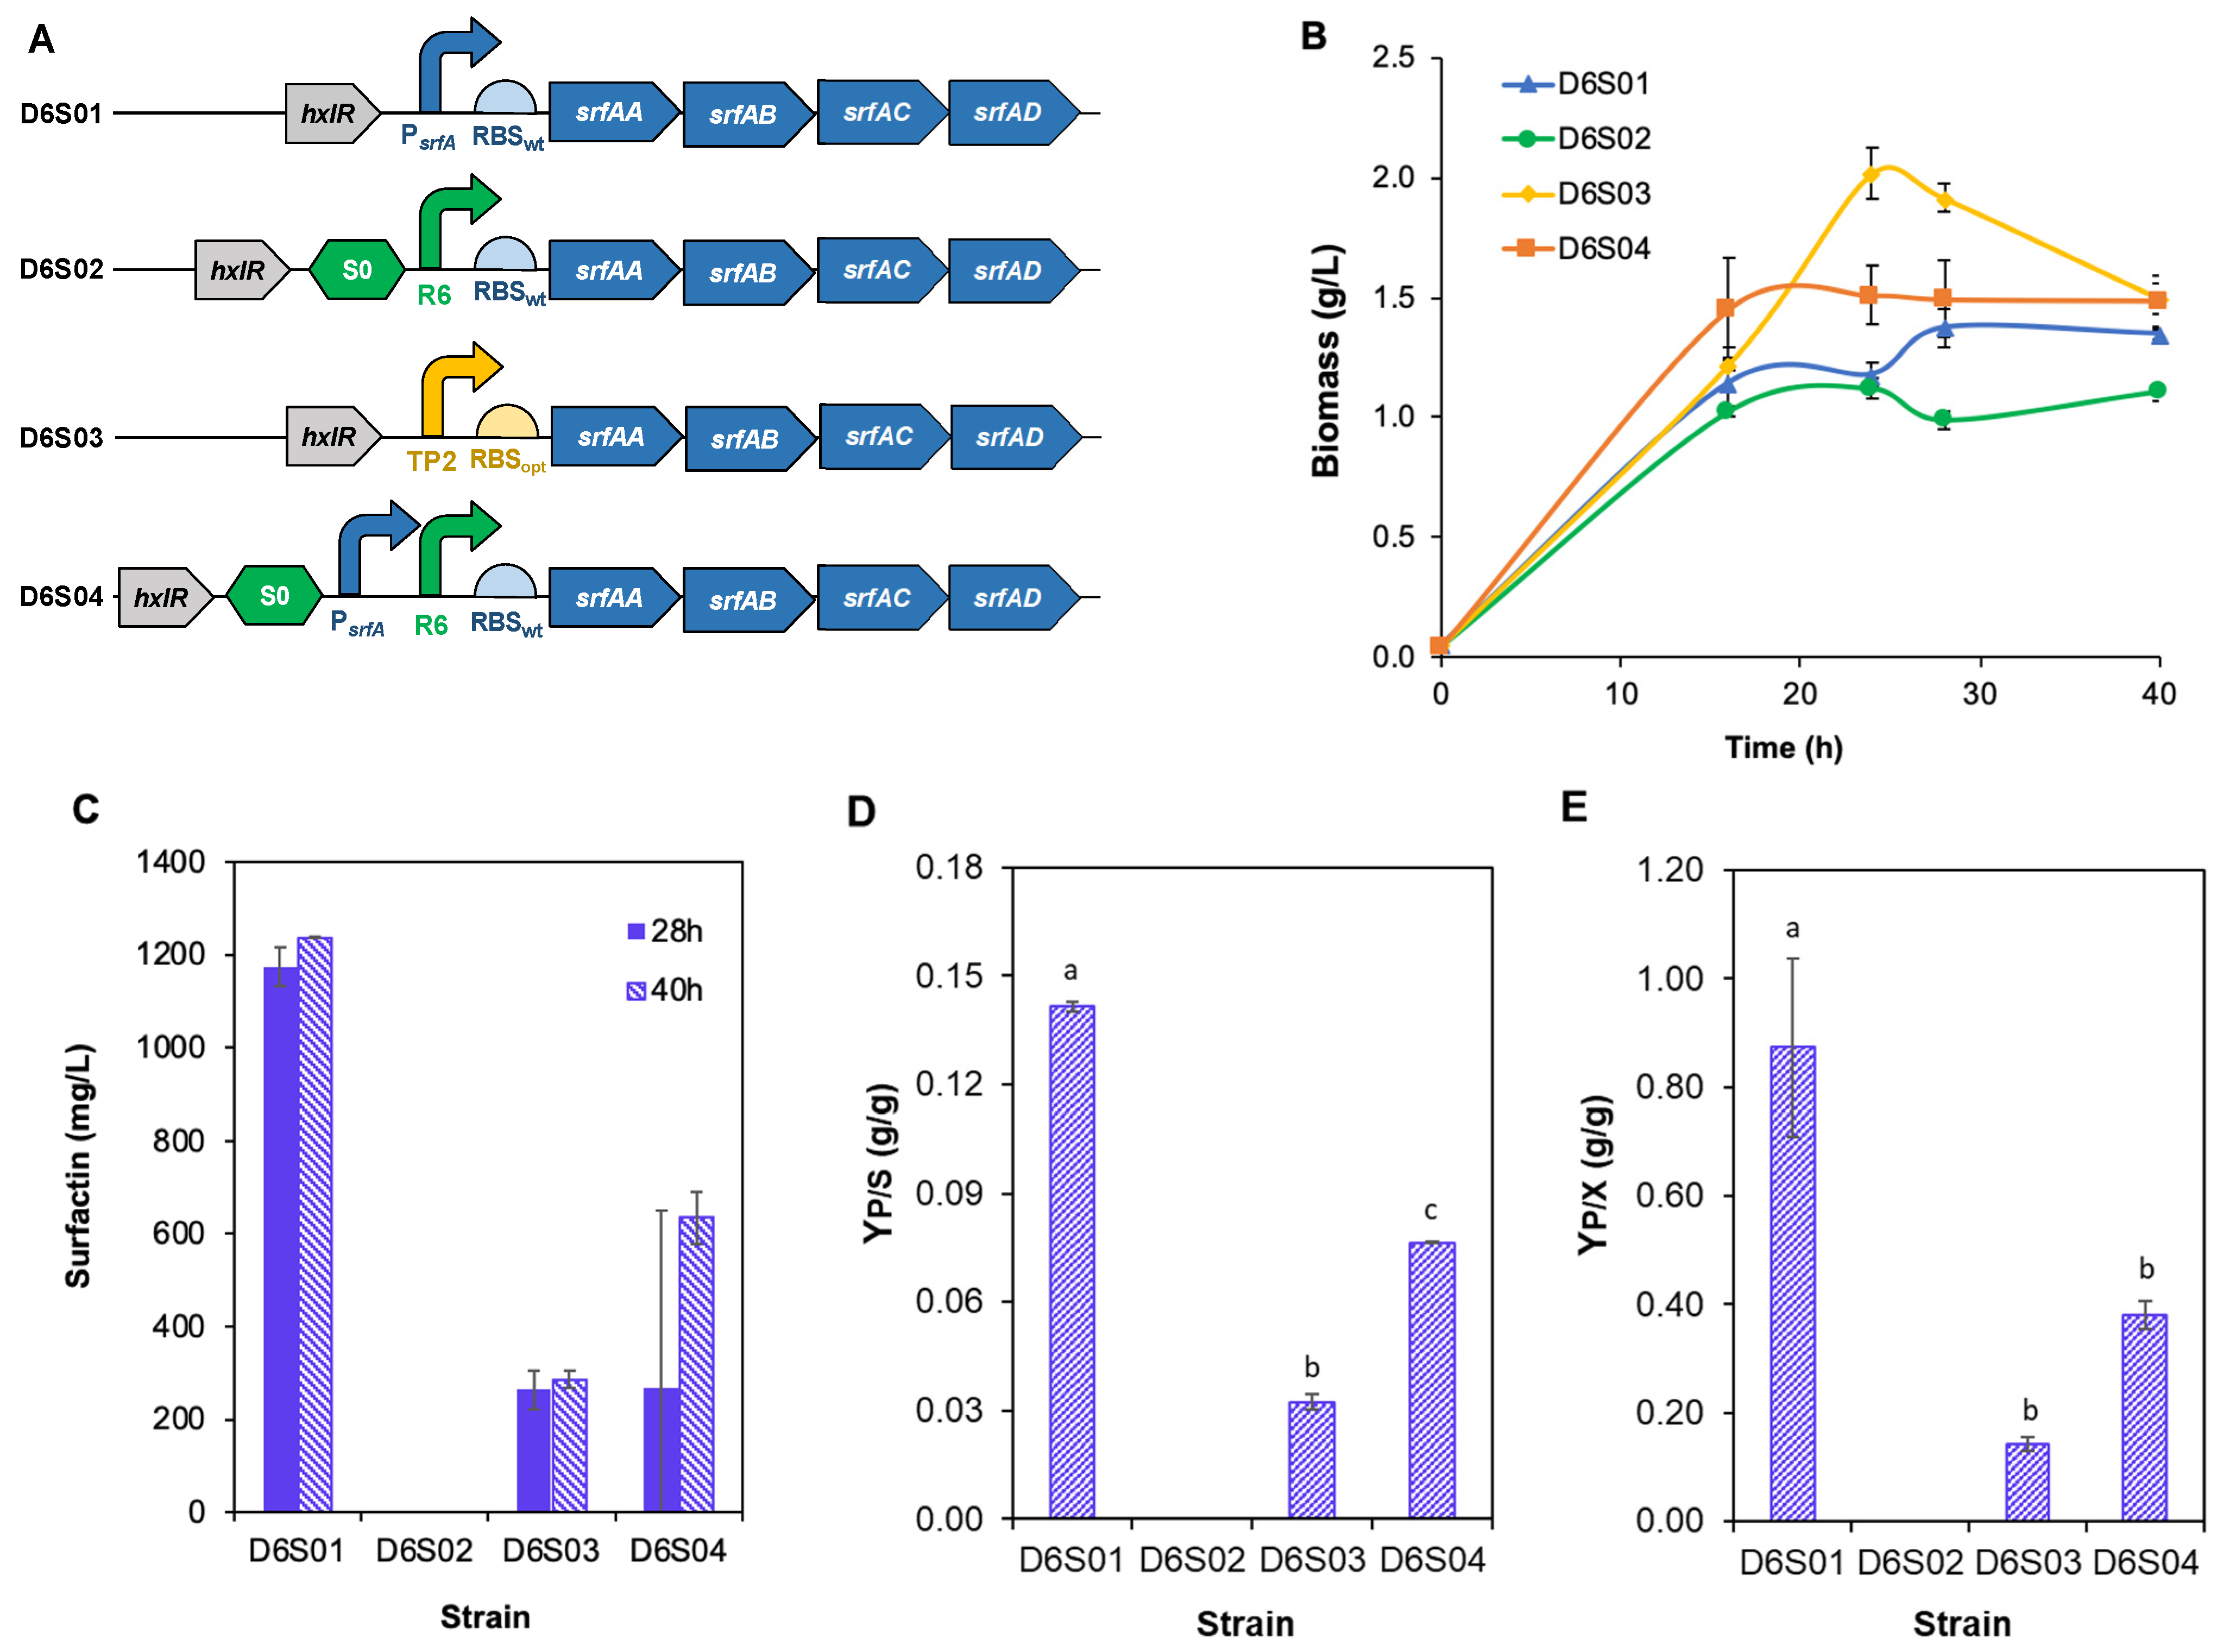
The PsrfA is a strong promoter activated during the transition to the stationary phase of growth by the ComQXPA quorum-sensing system in B. subtilis. Previous attempts to replace the PsrfA showed divergent results. While some reported an increase in production [36,37], others reported a loss of surfactin biosynthesis [38,39] when the native PsrfA was replaced. Therefore, we decided to test three different promoter configurations: (i) replacement of the PsrfA with the constitutive and strong dual-promoter TP2 [40] to generate the strain D6S03; (ii) replacement of the PsrfA with a synthetic autoinduction device S0-R6 [41] to generate the strain D6S02; and (iii) insertion of the synthetic autoinduction device S0-R6 in addition to the PsrfA to generate the strain D6S04, creating a double autoinduced process to control the srfA genes (Figure 2A). We chose the synthetic autoinduction device S0-R6 because it is a quorum-sensing-based system like the ComQXPA-PsrfA, but with an earlier induction point in the first half of the exponential growth phase. All three strategies were deleterious to production. Replacing the PsrfA with the synthetic autoinduction device S0-R6 was the worst strategy, abolishing the production completely. Interestingly, the resources were not re-allocated to biomass formation, and the strain D6S02 built the lowest amount of biomass from all tested (Figure 2B,C). Replacing PsrfA with the strong TP2 promoter (D6S03) resulted in low levels of surfactin production, with resources re-allocated to the formation of biomass. Finally, we decided to use the two autoinduction processes simultaneously, in an attempt to start production earlier and continue the biosynthesis through the stationary phase. Therefore, we inserted the S0 induction module (luxRI genes) upstream of the PsrfA and the R6 promoter downstream of the PsrfA (Figure 2A). The R6 promoter is only suitable for induction by the LuxR protein, while the PsrfA is suitable for both repression and activation processes. Therefore, the inverse order for the promoters would cause the R6 blockage by the repressors of PsrfA. The double-promoter strategy resulted in increased production parameters compared to the production solely driven by the S0-R6 device. However, the D6S04 only reached about half the production yield of the D6S01 strain. From these results, we inferred that the regulatory processes involved in the srfA transcription are important for high levels of surfactin production, and abolishing or even perturbing them is deleterious to the biosynthesis.

3.3. Engineering Transcription Regulators

Since our efforts on promoter editing did not increase surfactin production, we turned our attention to two transcription regulators involved in the biosynthetic process, the CodY and the ComA. The two regulators have opposite effects on the PsrfA; the first represses transcription, and the second activates it. CodY is a regulator that acts as a transcriptional repressor to genes involved in carbon and nitrogen metabolism, transportation of degraded extracellular macromolecules, and sporulation competence [42], some of which are involved in surfactin biosynthesis. CodY affects surfactin biosynthesis in two ways: (i) it binds directly to the PsrfA promoter, inhibiting transcription [17]; (ii) it also inhibits the transcription of ilvD, ybgE, and ilvBHC-leuABCD, involved in the biosynthesis of branched-chain amino acids [43], and of the bkd operon, which is responsible for the biosynthesis of branched-chain ketoacids (precursors of branched-chain fatty acids) [44]. The ComA regulatory protein is involved in the expression of at least 89 genes in 35 operons in B. subtilis, acting predominantly as a transcription activator. In its phosphorylated form, ComA is responsible for directly activating the transcription from the PsrfA [45].
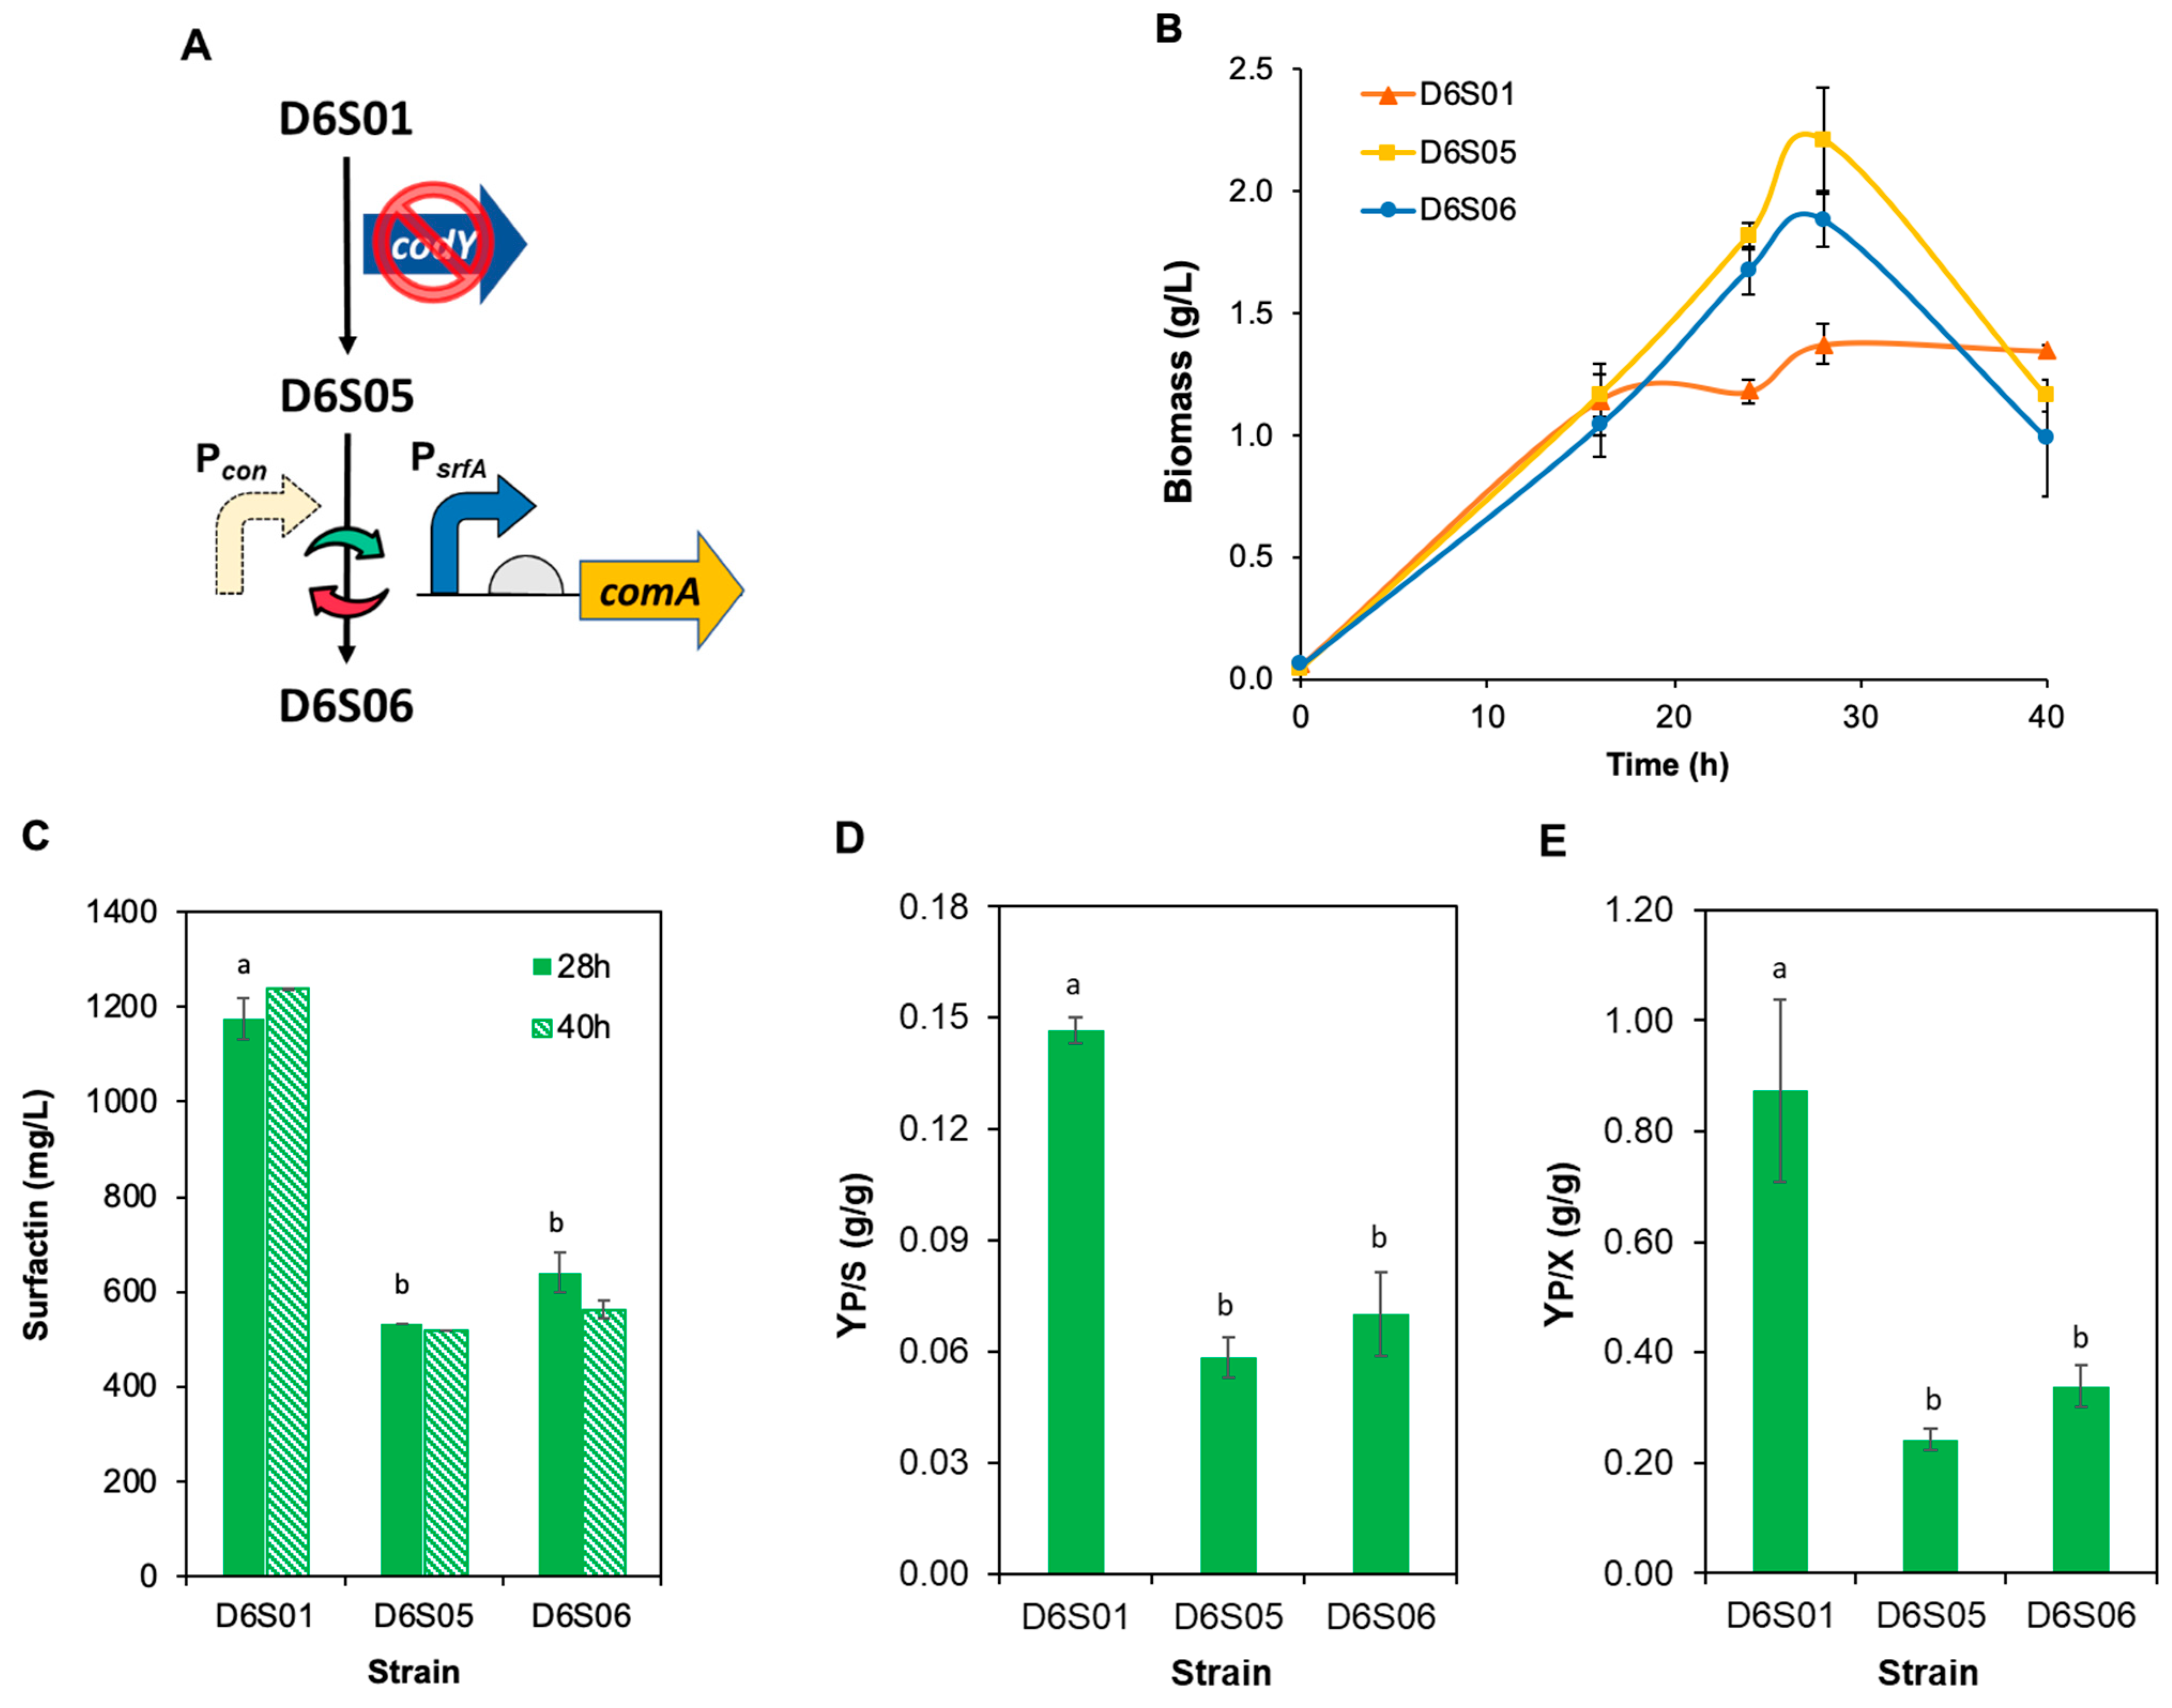
To eliminate the direct and indirect interference of the transcriptional repressor CodY in the surfactin production, we deleted codY in the strain D6S01 to generate D6S05 (Figure 3A). CodY deletion reduced surfactin yields by over two-fold while increasing biomass formation (Figure 3B–E). Based on this result, we hypothesized that releasing the CodY blockage could be beneficial only if transcription activation would increase at the same time. Therefore, we further edited D6S05 to add the PsrfA promoter between genes comP and comA in the comQXPA operon (strain D6S06) so that comA can be transcribed at an increased rate to activate the srfA operon upon culture transition to the stationary phase (Figure 3A). D6S06 showed a slight increase of 1.2 to 1.4-fold in surfactin yields compared to the parental strain D6S05. However, D6S06 still performs much worse than D6S01 (Figure 3C–E). These findings confirm that changing the regulatory processes involved in the srfA operon transcription is indeed deleterious to surfactin biosynthesis in B. subtilis Δ6.

3.4. Culture Medium Optimization

The biosynthesis of surfactin, which involves the condensation of four amino acids and a fatty acid, is subject to stringent regulation by global cellular mechanisms; consequently, surfactin yields are significantly influenced by the composition of the culture medium, among other cultivation parameters. Some ingredients, such as nitrate, have been suggested to increase surfactin production [46]. However, the combination of ingredients and the genetic background of the producer make it difficult to foresee the optimal formulation. With that in mind, we tested the strain D6S01 in three media formulations with two different glucose concentrations for each.
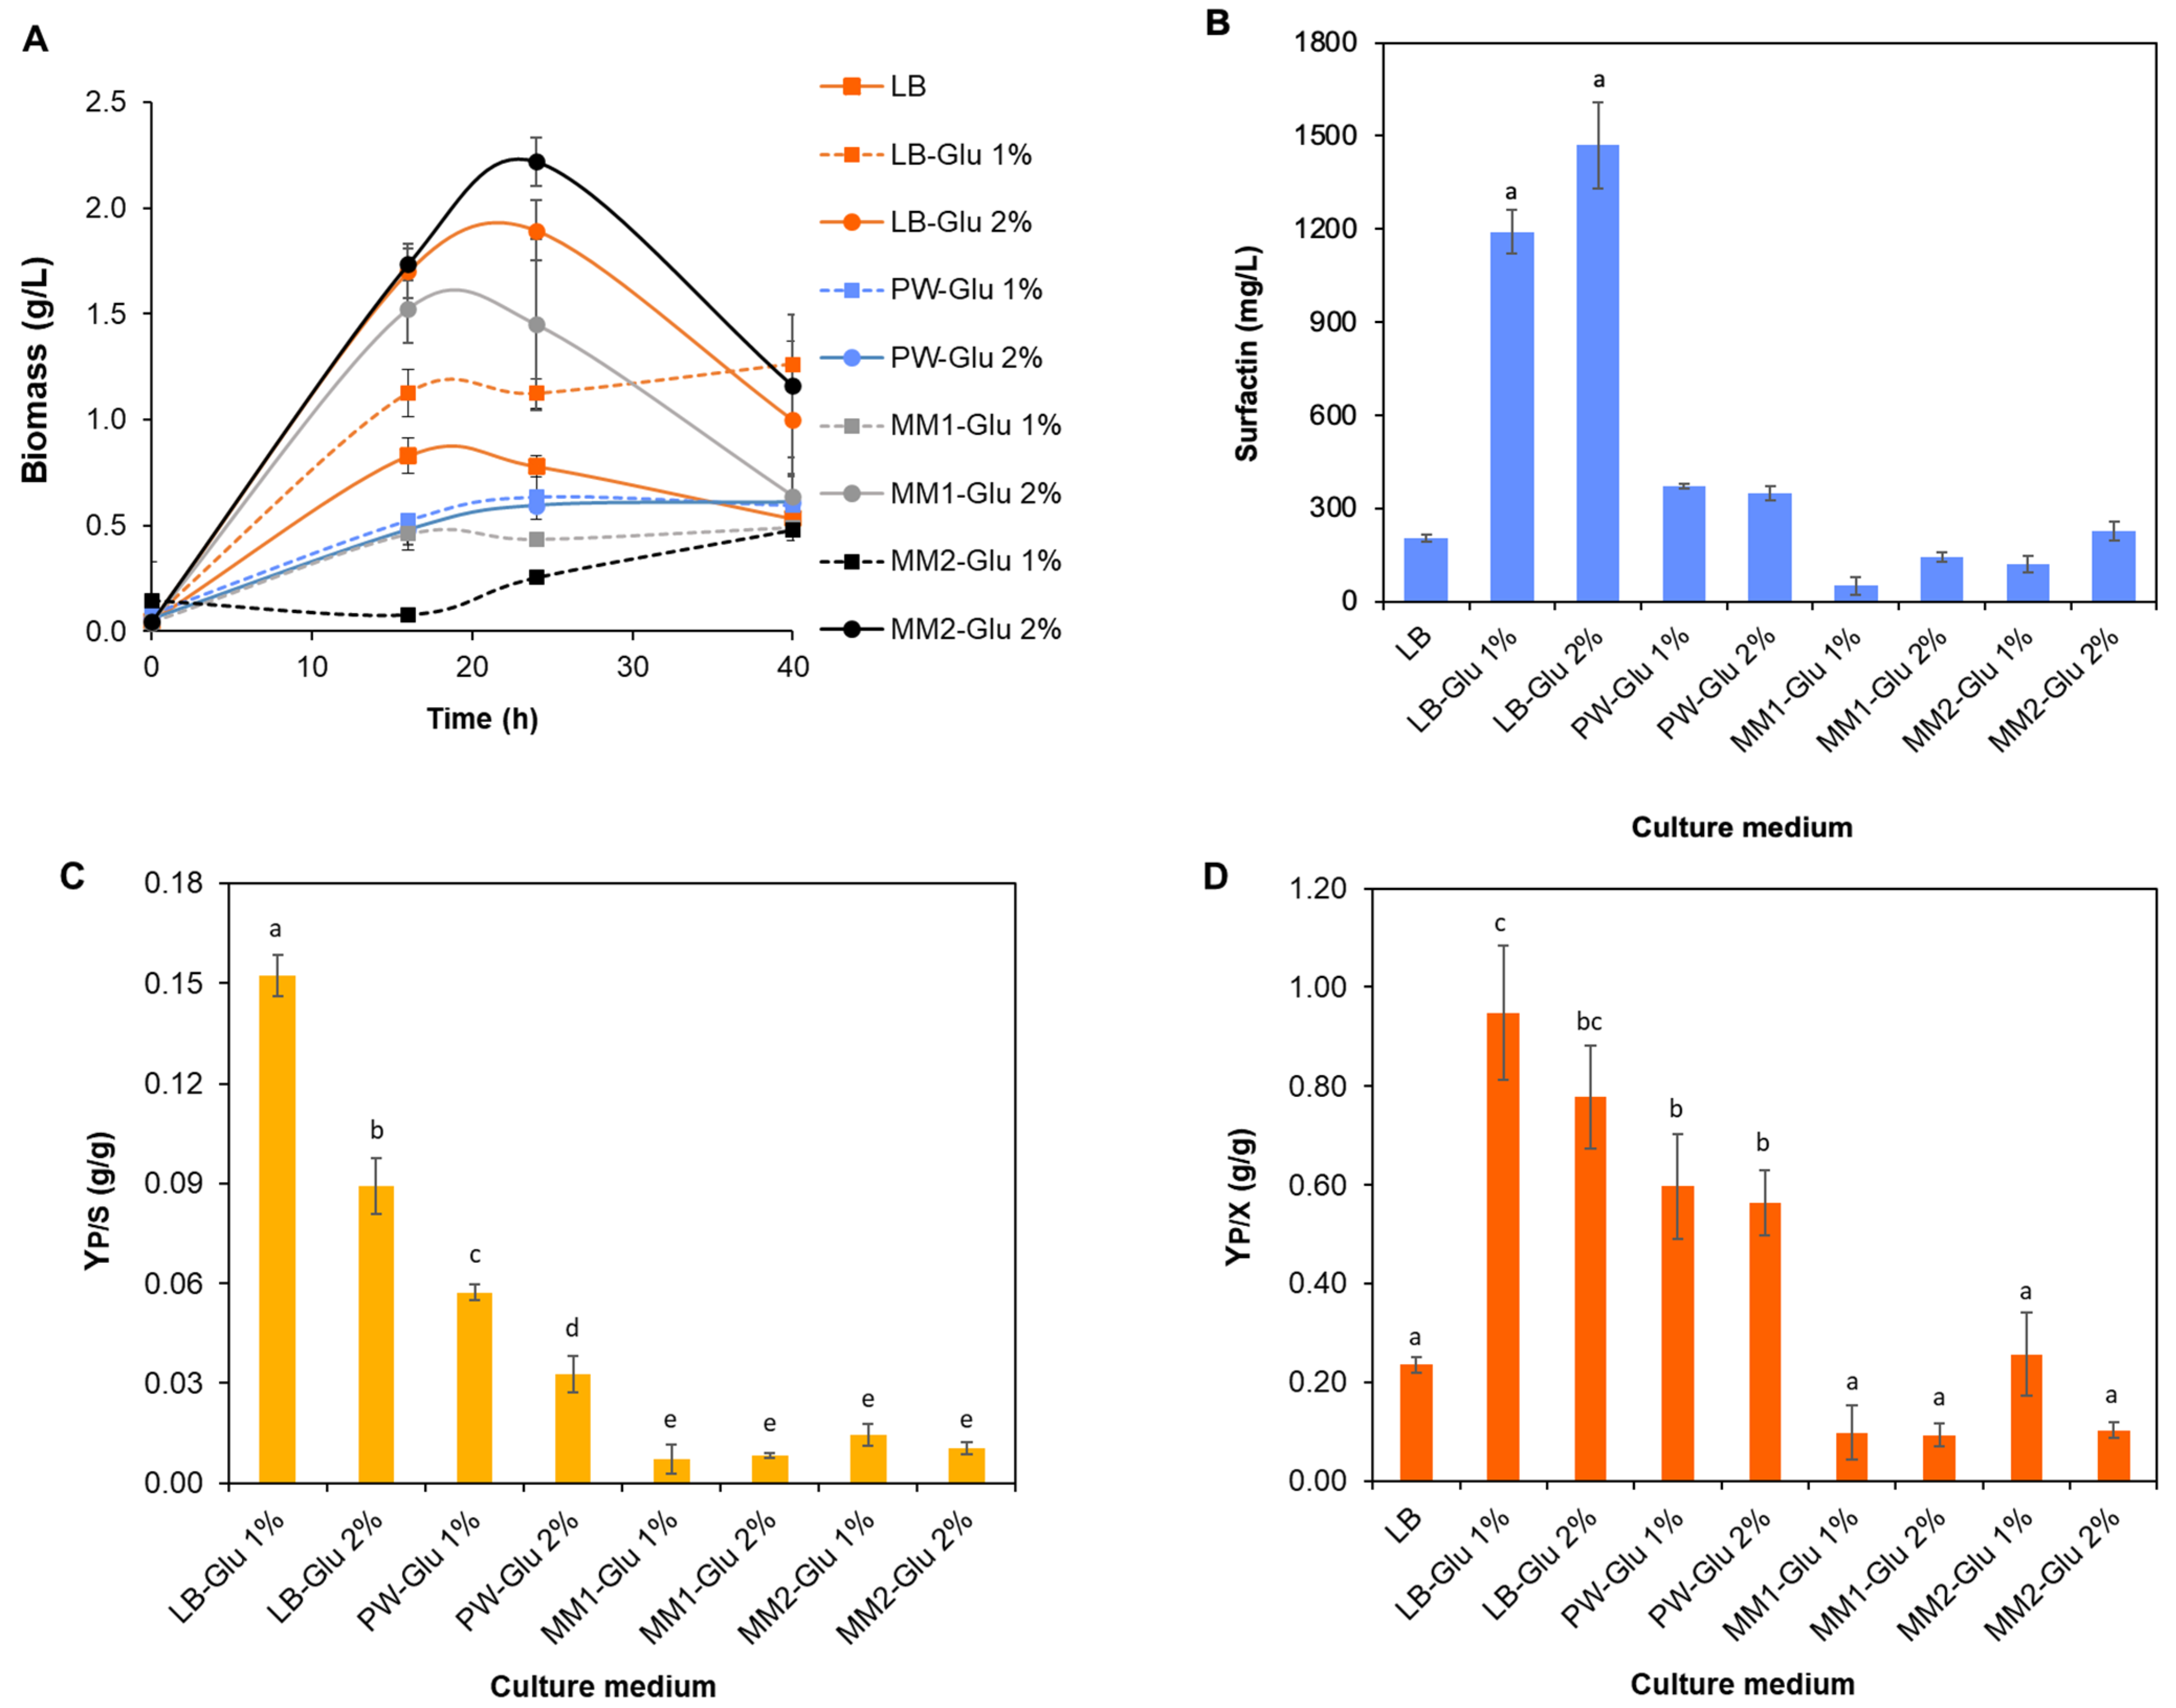
Mineral medium C (MM1), a commonly used defined medium for B. subtilis [47], supported poor growth and the worst surfactin yield when supplemented with 1% (m/v) glucose (Figure 4A). Increasing glucose supplementation to 2% (m/v) resulted in a 3.3-fold increase in biomass formation and a 2.8-fold increase in surfactin concentration (Figure 4A,B). Nonetheless, the production level was still too low. In an attempt to increase the production performance in the mineral medium, we modified its composition by replacing the nitrogen source from ammonium sulfate to ammonium nitrate (MM2). MM2 supplemented with 1% (m/v) glucose had a strong deleterious effect on growth, extending the lag phase. Surprisingly, increasing the glucose supplementation three times resulted in a 6.5-fold increase in biomass formation (Figure 4A). Although the production yield increased in MM2 compared to MM1, the gain in biomass did not translate into a proportional increase in surfactin production (Figure 4B–D). From these results, we inferred that using nitrate was beneficial, but the medium formulation was not yet ideal for surfactin biosynthesis. Therefore, we tested the PW medium, a complex medium formulated with yeast extract, sugar as a carbon source, and NaNO3 as an additional inorganic nitrogen source, commonly used for surfactin production [35,48,49,50]. The PW formulation supported a 2.3 to 3.4-fold increase in surfactin yields compared to MM2 at 1% (m/v) glucose (Figure 4B–D). However, increasing glucose supplementation did not increase biomass formation or production. Since more glucose was consumed (Table A3), we suspect that carbon was lost through side products such as acetate and lactate. Finally, we tested lysogeny broth (LB). LB is widely used for routine bacterial cultivation in the laboratory, but it is not commonly used for surfactin production. Surfactin yield in LB only was still at low levels; however, supplementation with glucose strongly boosted production and growth (Figure 4A–D). At 1% (m/v), glucose supplementation resulted in surfactin yields of 1.2 g L−1, 0.15 g/g of glucose, and 0.95 g g−1 of biomass. LB supplemented with more glucose (2%, m/v) resulted in a higher surfactin concentration; however, with no statistical difference compared to 1%. Moreover, the other yield parameters were worse for the higher glucose concentration.
Comparing the surfactin production in LB only and LB enriched with glucose, we can evaluate the sugar contribution to the production. At 1% (m/v), glucose generated an extra 0.99 g/L of surfactin concentration, resulting in a conversion yield of 0.13 g/g, still the highest among all conditions tested.

3.5. The CPC–BTB Method Is Suitable for Interference from the Culture Medium

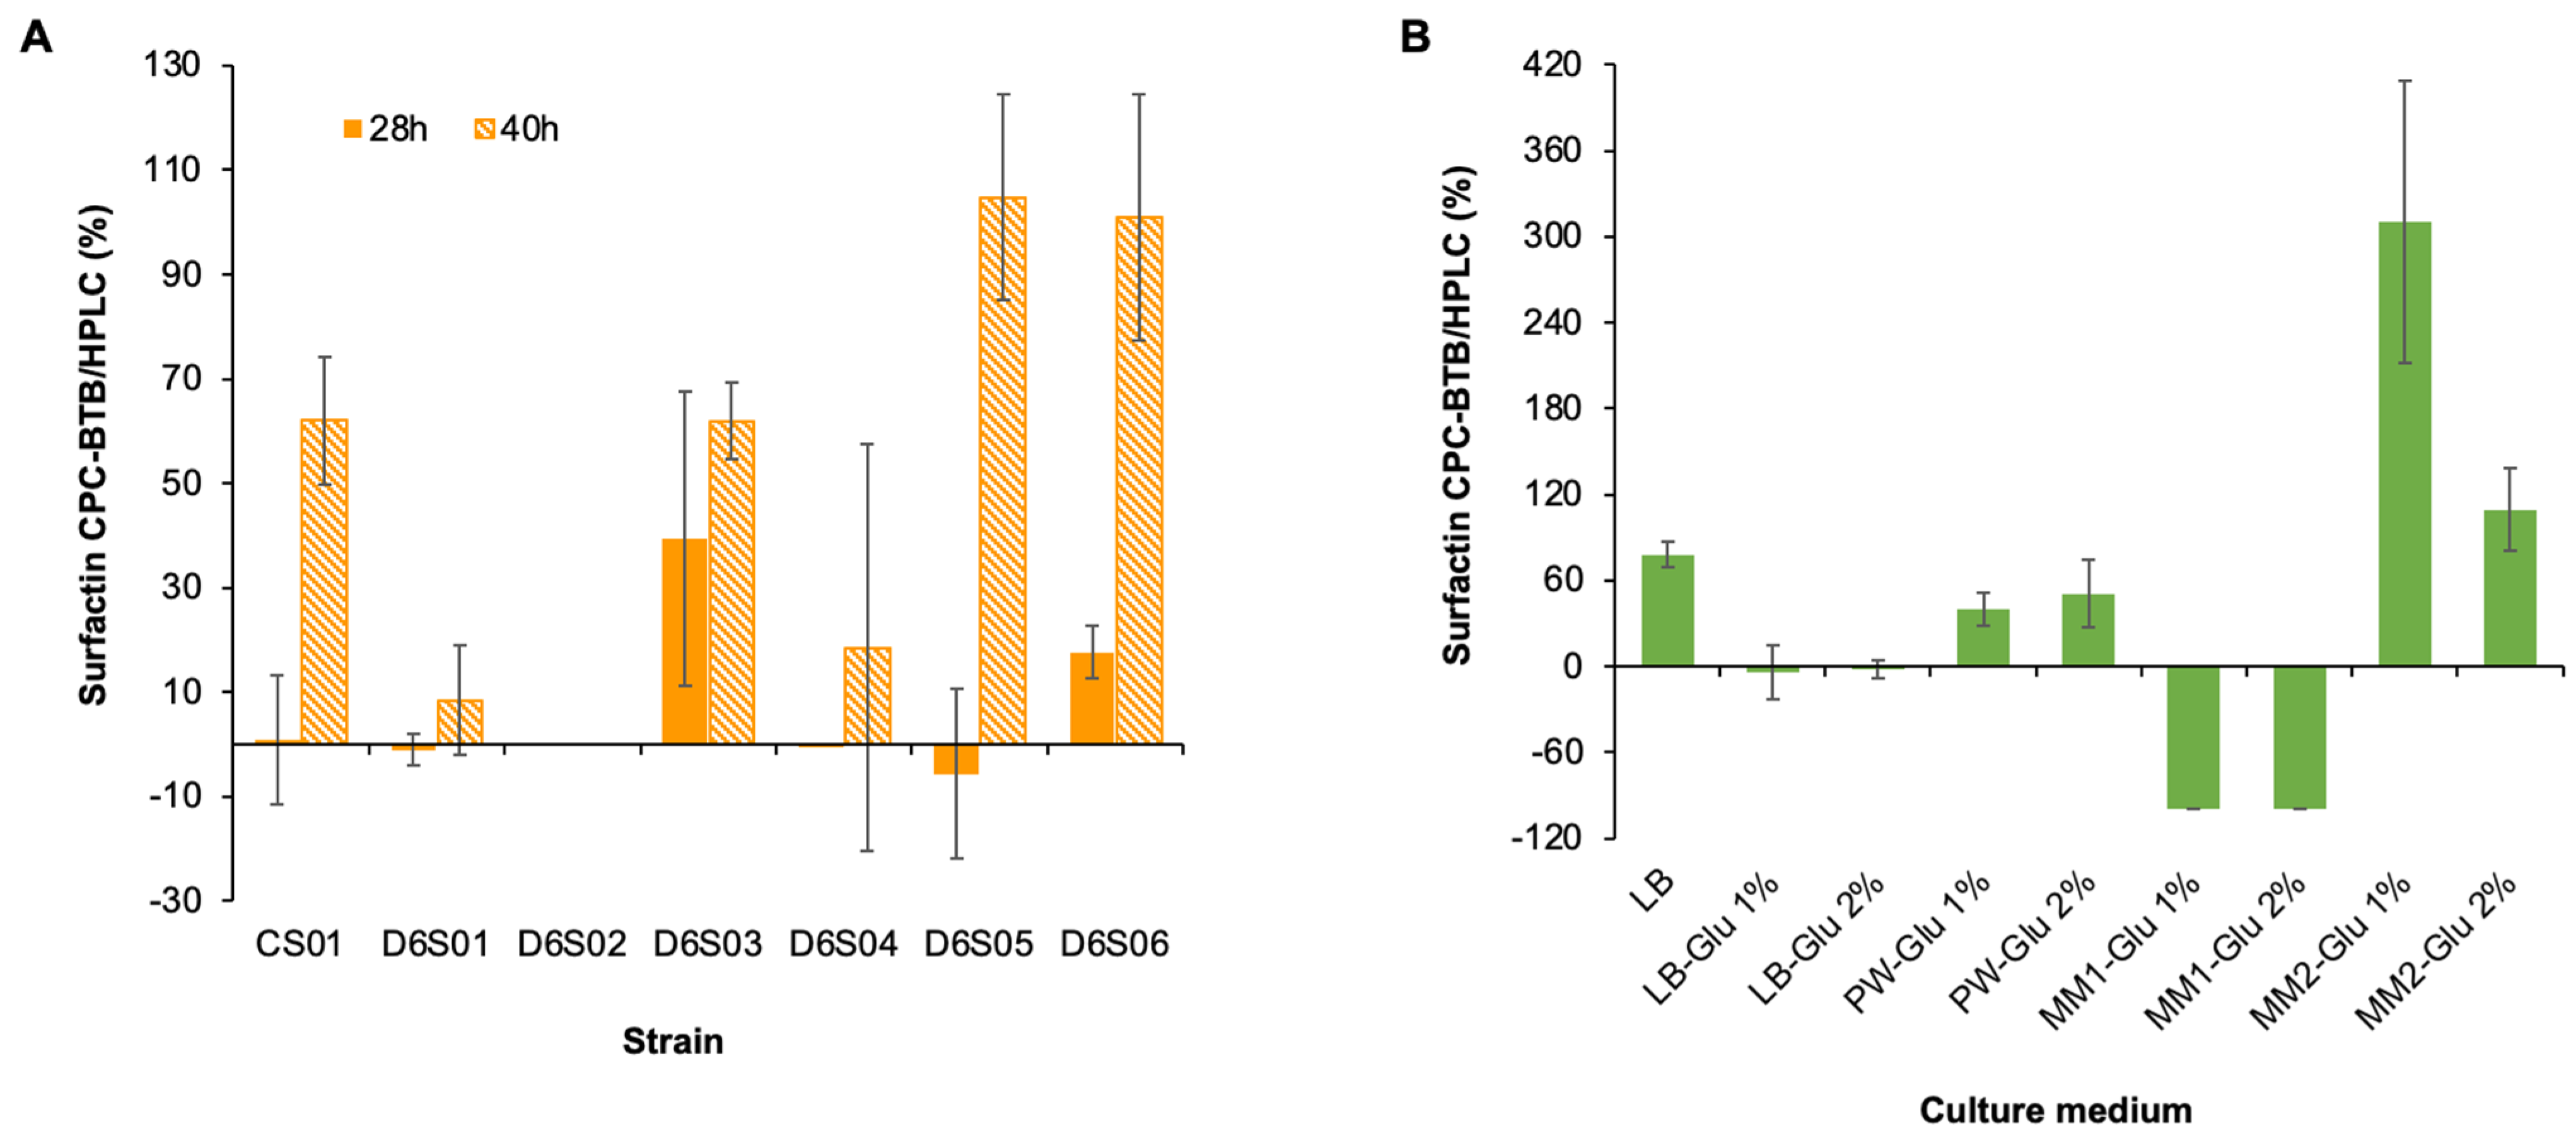
The surfactin quantification presented so far in this work has been measured using HPLC, as described in the Methods section. In an attempt to increase the throughput during the study, we tested the colorimetric CPC–BTB method for surfactin quantification [35]. A comparison between the CPC–BTB and the HPLC methods for culture supernatants from different strains in the same medium (Figure 5A) and different media for the same strain (Figure 5B) showed a large discrepancy. The colorimetric method only agreed with the HPLC for the strains CS01 and D6S01 cultivated in LB enriched with glucose 1% (m/v) for 28 h. For all other strains and conditions tested, we found discrepancies up to 310%. The CPC–BTB method seems to suffer interference from the medium composition, including compounds generated during microbial growth. Therefore, it is not a reliable method for absolute surfactin measurement nor for relative comparison.

4. Discussion

Genome-reduced microbes are simplified cell factories, with stable genomes and lower maintenance energy requirements compared to their parental strains [1]. Therefore, they are attractive for engineering metabolite-producing strains for industrial scale. The highly genome-reduced strain PG10, which lacks 36% of the original genome, has been demonstrated to be an efficient cell factory for proteins considered difficult to produce. The strain seems to have a higher translational efficiency than the parental strain 168, which is speculated to be a consequence of the decreased number of translatable mRNAs in the strain [51]. Indeed, basal processes such as DNA replication, transcription, and translation together require 47.5% of the resources of the translation apparatus [1]. Any relief in that cost due to genome reduction can potentially make the remaining cellular processes more efficient.
We compared the strains B. subtilis 168 and its genome-reduced variant Δ6 for surfactin production. Despite the reduction, Δ6 keeps all the required genes for surfactin biosynthesis. Indeed, the genome-reduced strain is more efficient for surfactin biosynthesis, yielding 0.95 g g−1 of biomass and 0.15 g g−1 of sugar using LB, and 0.13 g.g−1 of glucose (excluding LB-supported surfactin production). The latter represents 29.5% of the maximum theoretical yield from glucose (0.44 g/g) [25]. This is a better performance than achieved for the further reduced genome strain IIG-Bs20-5-1, which yielded 0.87 g g−1 of biomass and 0.10 g g−1 of glucose [4]. The strain IIG-Bs20-5-1 has a 13% genome reduction in size, with further prophages and antibiotic biosynthesis genes deleted, along with protease and sporulation-related genes; none of these genes is directly related to surfactin biosynthesis [52]. Although high yields for YP/S and YP/X have been achieved for Δ6, the volumetric production is still far from the best engineered strains. A systematic engineering approach increased the production from 0.4 to 12.8 g L−1 using B. subtilis 168 sfp+ [25]. However, looking from the starting point, the first step of reversing the sfp mutation resulted in a much higher surfactin production from the Δ6 (1.2 g L−1).
In an attempt to improve the Δ6 strain production capacity, we replaced the srfA promoter with a strong constitutive promoter, which was highly deleterious to the surfactin yields. Combining the wild-type promoter with another autoinduced promoter was less prejudicial, but still worse than PsrfA alone. A previous study reported that replacing PsrfA with a constitutive promoter only benefited a weak surfactin-producer strain [39]. Similarly, another study tested eight different promoters to replace PsrfA in a weak surfactin producer and found that three of them enhanced the surfactin biosynthesis [53].
Unable to improve surfactin biosynthesis through promoter engineering, we turned our attention to the regulators of PsrfA. Deletion of codY, a PsrfA repressor, has been demonstrated to increase surfactin production in different strains of B. subtilis, including 168 [25,54,55,56]. However, we could not reproduce these gains in the Δ6 strain. The other target we approached was comA, a PsrfA activator. Two other studies indicated that overexpression of this regulator is beneficial to surfactin biosynthesis [25,56]. However, Δ6 did not yield higher surfactin production after this edition. Genome reduction affects the entire cell metabolism, including carbon catabolism and amino acid biosynthesis [1]. Therefore, genome-reduced strains may not respond to genome editing in the same way as their parental strain.
Finally, we tested different culture media for surfactin production. Compared to commonly used media for production, LB enriched with glucose supported much higher surfactin yields. Interestingly, LB provides an organic source for nitrogen, but the literature correlates inorganic nitrogen, especially nitrate, with increased surfactin biosynthesis [45]. This different response to the nitrogen source reinforces our claim that the genome-reduced strain has significant differences in its basal metabolism that are not easily deduced from its genetic background, resulting from the deletions.
The genome-reduced B. subtilis Δ6 strain is a compelling chassis for surfactin production, yielding a C15-rich mixture of surfactins with potential application in formulations requiring high antibacterial activity [57]. This study not only elucidates its potential in surfactin biosynthesis but also highlights the significant influence of the genetic background on both product yield and the strain’s responsiveness to regulatory processes.

Supplementary Materials

The following supporting information can be downloaded at: https://www.mdpi.com/article/10.3390/fermentation11090508/s1, File S1: Supplementary material (nucleic acid sequences as a Microsoft Word file); File S2: Supplementary data (raw data as a Microsoft Excel file).

Author Contributions

Conceptualization: D.B.P. and V.F.B.Z.; Investigation: V.F.B.Z., F.d.O.B. and L.F.T.; Analysis: V.F.B.Z. and G.E.K.; Resources: F.P.P. and A.C.d.S.M.; Data curation: V.F.B.Z. and D.B.P.; Writing—original draft preparation: V.F.B.Z. and D.B.P.; Writing—review and editing: V.F.B.Z. and D.B.P.; Supervision: D.B.P.; Project administration: D.B.P.; Funding acquisition: D.B.P. All authors have read and agreed to the published version of the manuscript.

Funding

This research was funded by the Conselho Nacional de Desenvolvimento Científico e Tecnológico (CNPq) grants 405490/2021-6, 310023/2020-3, 305324/2023-3, 465603/2014-9, and 141389/2021-4.

Institutional Review Board Statement

Not applicable.

Data Availability Statement

All data generated in this study are provided in Appendix A and Supplementary Materials.

Conflicts of Interest

The authors declare no conflicts of interest.

Appendix A

Appendix A.1. gRNA Sequences

Each gRNA is composed of a guide sequence (GS), the spacer, and the scaffold sequence. The spacer and the scaffold sequences are provided by the pJOE8999 plasmid [29].
Table A1. gRNA sequences used in this study.
IDTargetSequence (5′-3′)Reference
GS1sfpAAAGCTTTATCAAACAAGGAThis study
GS2PsrfAAAAGATTGAACGCAGCAGTTThis study
GS3R6AATAGGTAAGGATAAAGAGAThis study
GS4codYACCCAAGGAGTTTCCCTCTGThis study
GS5comAACTAGTGATTGATGACCATCThis study

Appendix A.2. Donor DNA Sequences

Table A2. DNA parts used in this study.
DNA Part *DescriptionReference
S0-R6Transcription autoinduction device[40]
TP2Constitutive dual promoter[39]
RBSoptOptimized RBS[39]
PsrfAWild-type inducible promoter, amplified from the B. subtilis Δ6 genomeThis study
RBSwtWild-type RBS associated with PsrfA, amplified from the B. subtilis Δ6 genomeThis study
DS1Donor DNA 1 for sfp point mutationsThis study
DS2Donor DNA 2 for substitution of PsrfA for S0-R6 to control srfA operon expressionThis study
DS3Donor DNA 3 for substitution of PsrfA-RBSwt for TP2-RBSopt to control srfA operon expressionThis study
DS4Donor DNA 4 for insertion of PsrfA between S0 and R6 to control srfA operon expressionThis study
DS5Donor DNA 5 for codY deletionThis study
DS6Donor DNA 6 for insertion of PsrfA-RBSwt to control comA expressionThis study
* DNA sequences for all donor sequences (DS) are presented in the Supplementary Materials.

Appendix A.3. Culture Medium Optimization: Reducing Sugars Quantification

Table A3. Sugar consumption and surfactin production by strain D6S01 in different media.
MediumInitial Reducing Sugars (g L−1)Final Reducing Sugars (g L−1)Consumed Reducing Sugars (g L−1)Surfactin
(g L−1)
LB0.16 ± 0.000.11 ± 0.020.04 ± 0.010.20 ± 0.01
LB-Glu 1%9.26 ± 0.030.28 ± 0.057.82 ± 0.141.19 ± 0.07
LB-Glu 2%26.09 ± 1.207.29 ± 0.4516.47 ± 1.061.47 ± 0.14
PW-Glu 1%7.83 ± 0.170.31 ± 0.136.50 ± 0.360.37 ± 0.01
PW-Glu 2%23.23 ± 2.1811.71 ± 2.3010.82 ± 1.760.35 ± 0.02
MM1-Glu 1%8.08 ± 0.040.54 ± 0.246.96 ± 0.02 0.05 ± 0.03
MM1-Glu 2%23.76 ± 0.576.68 ± 0.9417.08 ± 0.94 0.14 ± 0.02
MM2-Glu 1%8.42 ± 0.320.07 ± 0.018.32 ± 0.040.12 ± 0.03
MM2-Glu 2%24.30 ± 0.890.07 ± 0.0221.79 ± 1.010.23 ± 0.03

References

  1. Reuß, D.R.; Altenbuchner, J.; Mäder, U.; Rath, H.; Ischebeck, T.; Sappa, P.K.; Thürmer, A.; Guérin, C.; Nicolas, P.; Steil, L.; et al. Large-Scale Reduction of the Bacillus subtilis Genome: Consequences for the Transcriptional Network, Resource Allocation, and Metabolism. Genome Res. 2017, 27, 289–299. [Google Scholar] [CrossRef]
  2. Choe, D.; Cho, S.; Kim, S.C.; Cho, B.K. Minimal Genome: Worthwhile or Worthless Efforts toward Being Smaller? Biotechnol. J. 2016, 11, 199–211. [Google Scholar] [CrossRef]
  3. Aguilar Suárez, R.; Kohlstedt, M.; Öktem, A.; Neef, J.; Wu, Y.; Ikeda, K.; Yoshida, K.I.; Altenbuchner, J.; Wittmann, C.; van Dijl, J.M. Metabolic Profile of the Genome-Reduced Bacillus subtilis Strain IIG-Bs-27-39: An Attractive Chassis for Recombinant Protein Production. ACS Synth. Biol. 2024, 13, 2199–2214. [Google Scholar] [CrossRef] [PubMed]
  4. Geissler, M.; Kühle, I.; Morabbi Heravi, K.; Altenbuchner, J.; Henkel, M.; Hausmann, R. Evaluation of Surfactin Synthesis in a Genome Reduced Bacillus subtilis Strain. AMB Express 2019, 9, 84. [Google Scholar] [CrossRef]
  5. Yan, P.; Wu, Y.; Yang, L.; Wang, Z.; Chen, T. Engineering Genome-Reduced Bacillus subtilis for Acetoin Production from Xylose. Biotechnol. Lett. 2018, 40, 393–398. [Google Scholar] [CrossRef]
  6. Arima, K.; Kakinuma, A.; Tamura, G. Surfactin, a Crystalline Peptidelipid Surfactant Produced by Bacillus subtilis: Isolation, Characterization and Its Inhibition of Fibrin Clot Formation. Biochem. Biophys. Res. Commun. 1968, 31, 488–494. [Google Scholar] [CrossRef]
  7. Abdel-Mawgoud, A.M.; Aboulwafa, M.M.; Hassouna, N.A.H. Characterization of Surfactin Produced by Bacillus subtilis Isolate BS5. Appl. Biochem. Biotechnol. 2008, 150, 289–303. [Google Scholar] [CrossRef]
  8. Meena, K.R.; Kanwar, S.S. Lipopeptides as the Antifungal and Antibacterial Agents: Applications in Food Safety and Therapeutics. BioMed Res. Int. 2015, 2015. [Google Scholar] [CrossRef]
  9. Cosmina, P.; Rodriguez, F.; de Ferra, F.; Grandi, G.; Perego, M.; Venema, G.; van Sinderen, D. Sequence and Analysis of the Genetic Locus Responsible for Surfactin Synthesis in Bacillus subtilis. Mol. Microbiol. 1993, 8, 821–831. [Google Scholar] [CrossRef]
  10. Koglin, A.; Löhr, F.; Bernhard, F.; Rogov, V.V.; Frueh, D.P.; Strieter, E.R.; Mofid, M.R.; Güntert, P.; Wagner, G.; Walsh, C.T.; et al. Structural Basis for the Selectivity of the External Thioesterase of the Surfactin Synthetase. Nature 2008, 454, 907–911. [Google Scholar] [CrossRef]
  11. Zhi, Y.; Wu, Q.; Xu, Y. Genome and Transcriptome Analysis of Surfactin Biosynthesis in Bacillus Amyloliquefaciens MT45. Sci. Rep. 2017, 7, 40976. [Google Scholar] [CrossRef]
  12. Finking, R.; Marahiel, M.A. Biosynthesis of Nonribosomal Peptides. Annu. Rev. Microbiol. 2004, 58, 453–488. [Google Scholar] [CrossRef] [PubMed]
  13. Hamdache, A.; Azarken, R.; Lamarti, A.; Aleu, J.; Collado, I.G. Comparative Genome Analysis of Bacillus spp. and Its Relationship with Bioactive Nonribosomal Peptide Production. Phytochem. Rev. 2013, 12, 685–716. [Google Scholar] [CrossRef]
  14. Reuter, K. Crystal Structure of the Surfactin Synthetase-Activating Enzyme Sfp: A Prototype of the 4’-Phosphopantetheinyl Transferase Superfamily. EMBO J. 1999, 18, 6823–6831. [Google Scholar] [CrossRef] [PubMed]
  15. Hamoen, L.W.; Venema, G.; Kuipers, O.P. Controlling Competence in Bacillus subtilis: Shared Use of Regulators. Microbiology 2003, 149, 9–17. [Google Scholar] [CrossRef]
  16. Auchtung, J.M.; Lee, C.A.; Grossman, A.D. Modulation of the ComA-Dependent Quorum Response in Bacillus subtilis by Multiple Rap Proteins and Phr Peptides. J. Bacteriol. 2006, 188, 5273–5285. [Google Scholar] [CrossRef]
  17. Serror, P.; Sonenshein, A.L. CodY Is Required for Nutritional Repression of Bacillus subtilis Genetic Competence. J. Bacteriol. 1996, 178, 5910–5915. [Google Scholar] [CrossRef]
  18. Miras, M.; Dubnau, D. A DegU-P and DegQ-Dependent Regulatory Pathway for the K-State in Bacillus subtilis. Front. Microbiol. 2016, 7, 1868. [Google Scholar] [CrossRef]
  19. Hayashi, K.; Ohsawa, T.; Kobayashi, K.; Ogasawara, N.; Ogura, M. The H2O2 Stress-Responsive Regulator PerR Positively Regulates SrfA Expression in Bacillus subtilis. J. Bacteriol. 2005, 187, 6659–6667. [Google Scholar] [CrossRef]
  20. Qi, X.; Liu, W.; He, X.; Du, C. A Review on Surfactin: Molecular Regulation of Biosynthesis. Arch. Microbiol. 2023, 205, 313. [Google Scholar] [CrossRef]
  21. Chumsakul, O.; Takahashi, H.; Oshima, T.; Hishimoto, T.; Kanaya, S.; Ogasawara, N.; Ishikawa, S. Genome-Wide Binding Profiles of the Bacillus subtilis Transition State Regulator AbrB and Its Homolog Abh Reveals Their Interactive Role in Transcriptional Regulation. Nucleic Acids Res. 2011, 39, 414–428. [Google Scholar] [CrossRef] [PubMed]
  22. Westers, H.; Dorenbos, R.; Van Dijl, J.M.; Kabel, J.; Flanagan, T.; Devine, K.M.; Jude, F.; Séror, S.J.; Beekman, A.C.; Darmon, E.; et al. Genome Engineering Reveals Large Dispensable Regions in Bacillus subtilis. Mol. Biol. Evol. 2003, 20, 2076–2090. [Google Scholar] [CrossRef] [PubMed]
  23. Reuß, D.R.; Thürmer, A.; Daniel, R.; Quax, W.J.; Stülke, J. Complete Genome Sequence of Bacillus subtilis subsp. subtilis Strain Δ6. Genome Announc. 2016, 4, 10-1128. [Google Scholar] [CrossRef] [PubMed]
  24. Vargas-Bautista, C.; Rahlwes, K.; Straight, P. Bacterial Competition Reveals Differential Regulation of the pks Genes by Bacillus subtilis. J. Bacteriol. 2014, 196, 717–728. [Google Scholar] [CrossRef]
  25. Wu, Q.; Zhi, Y.; Xu, Y. Systematically Engineering the Biosynthesis of a Green Biosurfactant Surfactin by Bacillus subtilis 168. Metab. Eng. 2019, 52, 87–97. [Google Scholar] [CrossRef]
  26. Altenbuchner, J. Editing of the Bacillus subtilis Genome by the CRISPR-Cas9 System. Appl. Environ. Microbiol. 2016, 82, 5421–5427. [Google Scholar] [CrossRef]
  27. Park, J.; Bae, S.; Kim, J.-S. Cas-Designer: A web-based tool for choice of CRISPR-Cas9 target sites. Bioinformatics 2015, 31, 24, 4014–4016. [Google Scholar] [CrossRef]
  28. Yanisch-Perron, C.; Vieira, J.; Messing, J. Improved M13 Phage Cloning Vectors and Host Strains: Nucleotide Sequences of the M13mpl8 and PUC19 Vectors. Gene 1985, 33, 103–119. [Google Scholar] [CrossRef]
  29. Bron, S.; Meima, R.; van Dijl, J.M.; Wipat, A.; Harwood, C.R. Molecular Biology and Genetics of Bacillus Species. In Manual of Industrial Microbiology and Biotechnology; Demain, A.L., Davies, J.E., Atlas, R.M., Eds.; American Society for Microbiology: Washington, DC, USA, 1999; pp. 392–416. ISBN 9781555811280. [Google Scholar]
  30. Miller, G.L. Use of Dinitrosalicylic Acid Reagent for Determination of Reducing Sugar. Anal. Chem. 1959, 31, 426–428. [Google Scholar] [CrossRef]
  31. de Lima, J.G.O.; Veríssimo, N.V.P.; de Azevedo Lima, C.; Picheli, F.P.; de Paula, A.V.; Santos-Ebinuma, V.D.C. Improvement of Torularhodin Production by Rhodotorula Glutinis through the Stimulation of Physicochemical Stress and Application of the Bioproduct as an Additive in the Food Industry. Bioprocess. Biosyst. Eng. 2025, 48, 543–563. [Google Scholar] [CrossRef]
  32. Geissler, M.; Oellig, C.; Moss, K.; Schwack, W.; Henkel, M.; Hausmann, R. High-Performance Thin-Layer Chromatography (HPTLC) for the Simultaneous Quantification of the Cyclic Lipopeptides Surfactin, Iturin A and Fengycin in Culture Samples of Bacillus Species. J. Chromatogr. B Analyt Technol. Biomed. Life Sci. 2017, 1044–1045, 214–224. [Google Scholar] [CrossRef] [PubMed]
  33. Koim-Puchowska, B.; Kłosowski, G.; Mikulski, D.; Menka, A. Evaluation of Various Methods of Selection of B. subtilis Strains Capable of Secreting Surface-Active Compounds. PLoS ONE 2019, 14, e0225108. [Google Scholar] [CrossRef] [PubMed]
  34. Mohd Isa, M.H.; Shamsudin, N.H.; Al-Shorgani, N.K.N.; Alsharjabi, F.A.; Kalil, M.S. Evaluation of Antibacterial Potential of Biosurfactant Produced by Surfactin-Producing Bacillus Isolated from Selected Malaysian Fermented Foods. Food Biotechnol. 2020, 34, 1–24. [Google Scholar] [CrossRef]
  35. Yang, H.; Yu, H.; Shen, Z. A Novel High-Throughput and Quantitative Method Based on Visible Color Shifts for Screening Bacillus subtilis THY-15 for Surfactin Production. J. Ind. Microbiol. Biotechnol. 2015, 42, 1139–1147. [Google Scholar] [CrossRef]
  36. Sun, H.; Bie, X.; Lu, F.; Lu, Y.; Wu, Y.; Lu, Z. Enhancement of Surfactin Production of Bacillus subtilis FmbR by Replacement of the Native Promoter with the Pspac Promoter. Can. J. Microbiol. 2009, 55, 1003–1006. [Google Scholar] [CrossRef]
  37. Jiao, S.; Li, X.; Yu, H.; Yang, H.; Li, X.; Shen, Z. In Situ Enhancement of Surfactin Biosynthesis in Bacillus subtilis Using Novel Artificial Inducible Promoters. Biotechnol. Bioeng. 2017, 114, 832–842. [Google Scholar] [CrossRef]
  38. Coutte, F.; Leclère, V.; Béchet, M.; Guez, J.S.; Lecouturier, D.; Chollet-Imbert, M.; Dhulster, P.; Jacques, P. Effect of Pps Disruption and Constitutive Expression of SrfA on Surfactin Productivity, Spreading and Antagonistic Properties of Bacillus subtilis 168 Derivatives. J. Appl. Microbiol. 2010, 109, 480–491. [Google Scholar] [CrossRef]
  39. Willenbacher, J.; Mohr, T.; Henkel, M.; Gebhard, S.; Mascher, T.; Syldatk, C.; Hausmann, R. Substitution of the Native SrfA Promoter by Constitutive Pveg in Two B. subtilis Strains and Evaluation of the Effect on Surfactin Production. J. Biotechnol. 2016, 224, 14–17. [Google Scholar] [CrossRef]
  40. Liu, D.; Mao, Z.; Guo, J.; Wei, L.; Ma, H.; Tang, Y.; Chen, T.; Wang, Z.; Zhao, X. Construction, Model-Based Analysis, and Characterization of a Promoter Library for Fine-Tuned Gene Expression in Bacillus subtilis. ACS Synth. Biol. 2018, 7, 1785–1797. [Google Scholar] [CrossRef]
  41. Corrêa, G.G.; Lins, M.R.D.C.R.; Silva, B.F.; de Paiva, G.B.; Zocca, V.F.B.; Ribeiro, N.V.; Picheli, F.P.; Mack, M.; Pedrolli, D.B. A Modular Autoinduction Device for Control of Gene Expression in Bacillus subtilis. Metab. Eng. 2020, 61, 326–334. [Google Scholar] [CrossRef]
  42. Sonenshein, A.L. Control of Key Metabolic Intersections in Bacillus subtilis. Nat. Rev. Microbiol. 2007, 5, 917–927. [Google Scholar] [CrossRef] [PubMed]
  43. Shivers, R.P.; Sonenshein, A.L. Activation of the Bacillus subtilis Global Regulator CodY by Direct Interaction with Branched-Chain Amino Acids. Mol. Microbiol. 2004, 53, 599–611. [Google Scholar] [CrossRef] [PubMed]
  44. Debarbouille, M.; Gardan, R.; Arnaud, M.; Rapoport, G. Role of BkdR, a Transcriptional Activator of the SigL-Dependent Isoleucine and Valine Degradation Pathway in Bacillus subtilis. J. Bacteriol. 1999, 181, 2059–2066. [Google Scholar] [CrossRef]
  45. Comella, N.; Grossman, A.D. Conservation of Genes and Processes Controlled by the Quorum Response in Bacteria: Characterization of Genes Controlled by the Quorum-Sensing Transcription Factor ComA in Bacillus subtilis. Mol. Microbiol. 2005, 57, 1159–1174. [Google Scholar] [CrossRef]
  46. Xia, L.; Hou, Z.; Zhu, F.; Wen, J. Enhancing Surfactin Production in Bacillus subtilis: Insights from Proteomic Analysis of Nitrate-Induced Overproduction and Strategies for Combinatorial Metabolic Engineering. Bioresour. Technol. 2024, 397, 130499. [Google Scholar] [CrossRef]
  47. Martin-Verstraete, I.; Dkbarbouilk, M.; Klier, A.; Rapoport, G. Levanase Operon of Bacillus subtilis Includes a Fructose-Specific Phosphotransferase System Regulating the Expression of the Operon. J. Mol. Biol. 1990, 214, 657–671. [Google Scholar] [CrossRef]
  48. Wang, Q.; Yu, H.; Wang, M.; Yang, H.; Shen, Z. Enhanced Biosynthesis and Characterization of Surfactin Isoforms with Engineered Bacillus subtilis through Promoter Replacement and Vitreoscilla Hemoglobin Co-Expression. Process Biochem. 2018, 70, 36–44. [Google Scholar] [CrossRef]
  49. Wang, C.; Cao, Y.; Wang, Y.; Sun, L.; Song, H. Enhancing Surfactin Production by Using Systematic CRISPRi Repression to Screen Amino Acid Biosynthesis Genes in Bacillus subtilis. Microb. Cell Fact. 2019, 18, 90. [Google Scholar] [CrossRef]
  50. Wang, M.; Yu, H.; Shen, Z. Antisense RNA-Based Strategy for Enhancing Surfactin Production in Bacillus subtilis TS1726 via Overexpression of the Unconventional Biotin Carboxylase II to Enhance ACCase Activity. ACS Synth. Biol. 2019, 8, 251–256. [Google Scholar] [CrossRef]
  51. Aguilar Suárez, R.; Stülke, J.; van Dijl, J.M. Less Is More: Toward a Genome-Reduced Bacillus Cell Factory for “Difficult Proteins”. ACS Synth. Biol. 2019, 8, 99–108. [Google Scholar] [CrossRef]
  52. Wenzel, M.; Altenbuchner, J. Development of a Markerless Gene Deletion System for Bacillus subtilis Based on the Mannose Phosphoenolpyruvate-Dependent Phosphotransferase System. Microbiology 2015, 161, 1942–1949. [Google Scholar] [CrossRef]
  53. Liu, F.-F.; Liu, Y.-F.; Qiao, Y.-W.; Guo, Y.-Z.; Kuang, F.-Y.; Lin, X.-Q.; Liu, J.-F.; Yang, S.-Z.; Zhang, H.-Z.; Sand, W.; et al. Improvement Surfactin Production by Substitution of Promoters in Bacillus subtilis TD7. Appl. Environ. Biotechnol. 2021, 6, 31–41. [Google Scholar] [CrossRef]
  54. Coutte, F.; Niehren, J.; Dhali, D.; John, M.; Versari, C.; Jacques, P. Modeling Leucine’s Metabolic Pathway and Knockout Prediction Improving the Production of Surfactin, a Biosurfactant from Bacillus subtilis. Biotechnol. J. 2015, 10, 1216–1234. [Google Scholar] [CrossRef]
  55. Dhali, D.; Coutte, F.; Arias, A.A.; Auger, S.; Bidnenko, V.; Chataigné, G.; Lalk, M.; Niehren, J.; de Sousa, J.; Versari, C.; et al. Genetic Engineering of the Branched Fatty Acid Metabolic Pathway of Bacillus subtilis for the Overproduction of Surfactin C14 Isoform. Biotechnol. J. 2017, 12, 1600574. [Google Scholar] [CrossRef] [PubMed]
  56. Sun, J.; Liu, Y.; Lin, F.; Lu, Z.; Lu, Y. CodY, ComA, DegU and Spo0A Controlling Lipopeptides Biosynthesis in Bacillus amyloliquefaciens FmbJ. J. Appl. Microbiol. 2021, 131, 1289–1304. [Google Scholar] [CrossRef]
  57. Su, Y.; Gao, L.; Li, C.; Wang, L.; Zhou, H.; Zhang, C.; Xia, X. Regulation Mechanism and Bioactivity Characteristic of Surfactin Homologues with C14 and C15 Fatty Acid Chains. Microb. Cell Fact. 2024, 23, 94. [Google Scholar] [CrossRef]
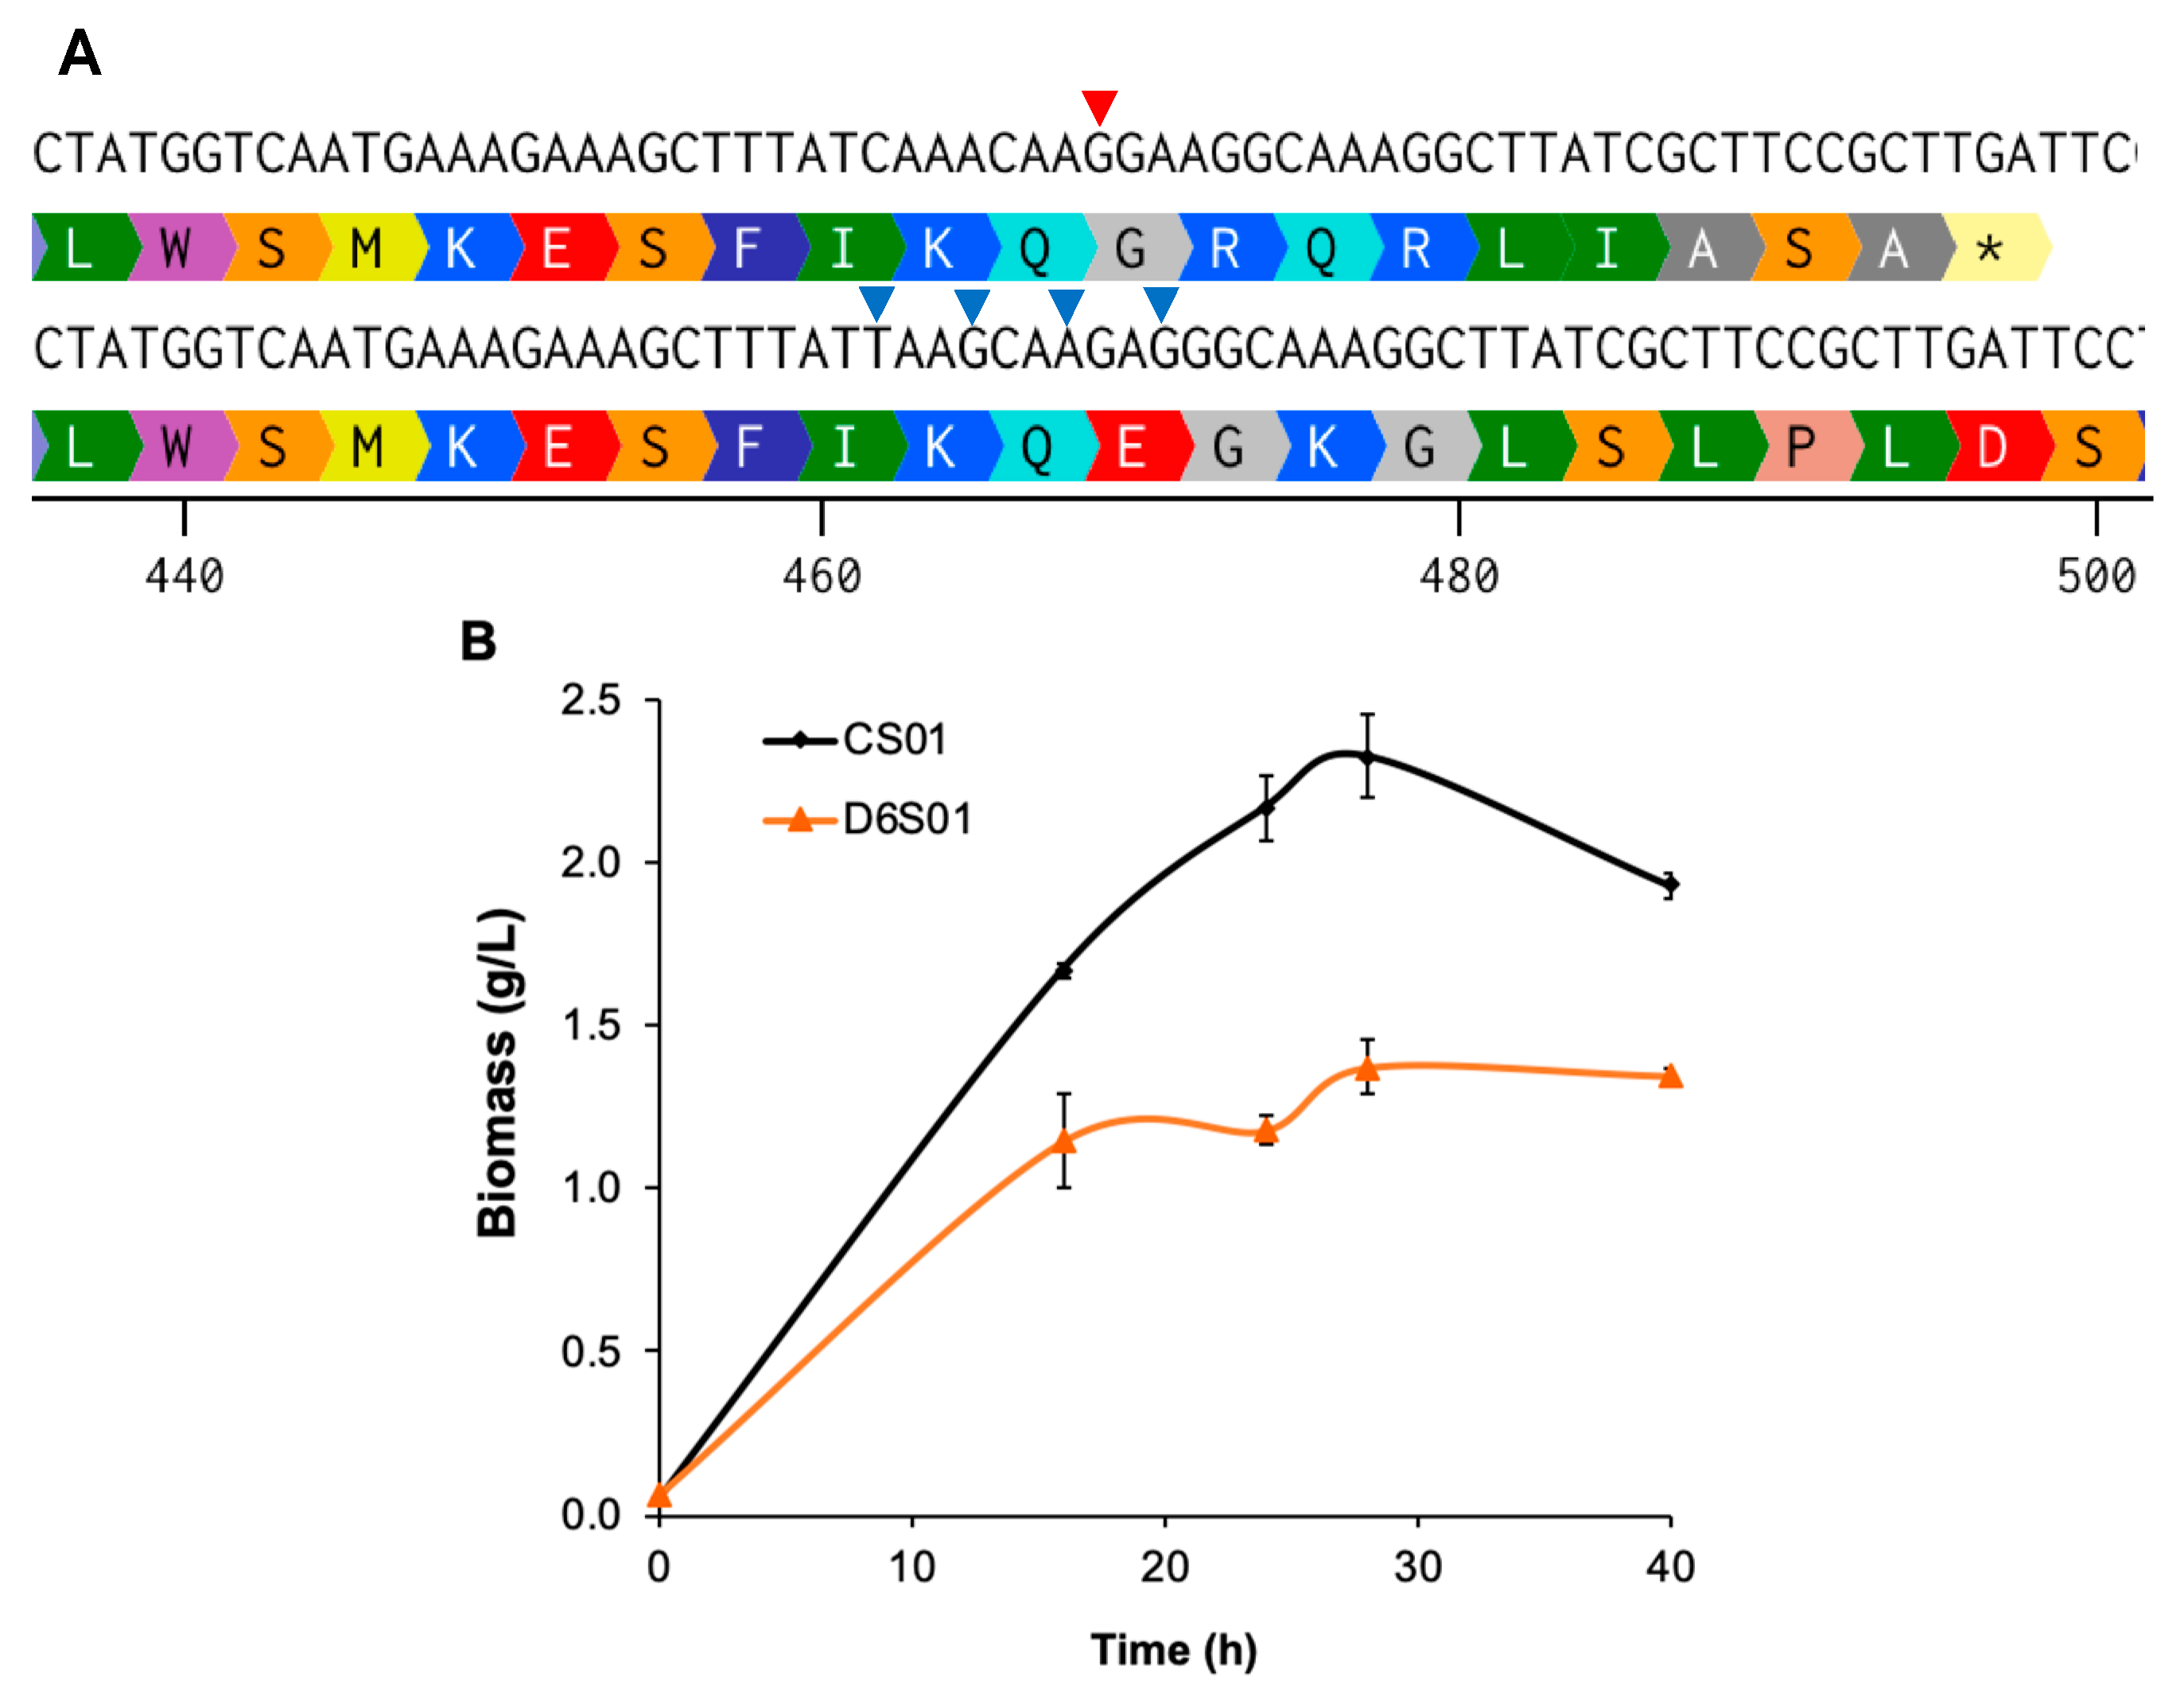
Figure 1. Surfactin production by sfp-edited B. subtilis 168 (CS01) and B. subtilis D6 (D6S01). (A) sfp gene and the 4’-phosphopantetheinyl transferase partial sequences. The upper sequence represents the inactive version of sfp found in both strains with a G insertion at position 469 (marked with a red triangle), causing a frame shift and creating a premature stop codon (represented as * in the amino acid sequence). The lower sequence shows the edited gene with a deletion of G-469, and silent point mutations C462T, A465G, G468A, and A471G (blue triangles). (B) Biomass formation over time. (C) Surfactin concentration in the cultures after 28 h and 40 h. (D) Surfactin yield per mass of glucose at 28 h of cultivation. (E) Surfactin yield per biomass. Data are presented as mean ± SD (n = 3). Different small letters identify statistically significant differences.
Fermentation 11 00508 g001aFermentation 11 00508 g001b
Figure 2. Production of surfactin from different promoter configurations. (A) Wild-type srfA operon and edited operons. The PsrfA was either replaced or used in combination with another promoter. (B) Biomass formation over time. (C) Surfactin concentration in the cultures after 28 h and 40 h. (D) Surfactin yield per mass of glucose. (E) Surfactin yield per biomass. Data are presented as mean ± SD, n = 3 (for D6S04 surfactin production, n = 2). Different small letters identify statistically significant differences.
Fermentation 11 00508 g002
Figure 3. Production of surfactin by regulator-edited strains. (A) Edited strains. codY was deleted from the genome of D6S01 to generate D6S05. The PsrfA was inserted into the comQXPA operon to drive the expression of comA. In this configuration, the operon transcription is still driven by the wild-type constitutive promoter (Pcon), and comA is additionally transcribed from the PsrfA activation in the late exponential growth phase. (B) Biomass formation over time. (C) Surfactin concentration in the cultures after 28 h and 40 h. (D) Surfactin yield per mass of glucose. (E) Surfactin yield per biomass. Data are presented as mean ± SD, n = 3. Different small letters identify statistically significant differences.
Fermentation 11 00508 g003
Figure 4. Production of surfactin in different media formulations. (A) Biomass formation over time. (B) Surfactin concentration in the cultures after 28 h. (C) Surfactin yield per mass of glucose. (D) Surfactin yield per biomass. Data are presented as mean ± SD, n = 3. Media used: LB and LB supplemented with glucose 1% or 2% (m/v), PW medium, mineral medium 1 (MM1), and 2 (MM2), also supplemented with glucose 1% or 2% (m/v). Data are presented as mean ± SD, n = 3. Different small letters identify statistically significant differences.
Fermentation 11 00508 g004
Figure 5. Comparison of quantification methods for surfactin produced using different strains (A) and different media (B). B. subtilis strains in (A) were cultivated in medium LB enriched with 1% (m/v) glucose. Strain D6S01 was cultivated in different media in (B). Data are presented as mean ± SD, n = 3.
Fermentation 11 00508 g005
Table 1. Plasmids used in this study.
PlasmidCharacteristicsReference
pJOE8999Base plasmid: pUCori, rep pE194ts, kanR, PmanP-cas9, PvanP-lacPOZ’-sgRNA[26]
pEBScas9.1pJOE8999, PvanP-gRNA_1, sfp *This study
pEBScas9.2pJOE8999, PvanP-gRNA_2, hxlR*-S0-R6-srfAA *This study
pEBScas9.3pJOE8999, PvanP-gRNA_2, hxlR*-TP2-srfAA *This study
pEBScas9.4pJOE8999, PvanP-gRNA_3, S0*-PsrfA-R6-srfAA *This study
pEBScas9.5pJOE8999, PmanP-cas9, PvanP-gRNA_4, hslU *-flgB *This study
pEBScas9.6pJOE8999, PvanP-gRNA_5, comP *-PsrfA-comAThis study
* Denotes a partial sequence of the gene, necessary for homologous recombination.
Table 2. Bacterial strains used in this study.
StrainCharacteristicsReference
E. coli JM109recA1, endA1, gyrA96, thi-1, hsdR17(rK, mk+), mcrA, supE44, gyrA96, relA1, λ, Δ(lac-proAB), F’(traD36, proAB +, lacIq, (ΔlacZ)M15)[28]
E. coli TOP10mcrA, Δ(mrr-hsdRMS-mcrBC), Phi80lacZ(del)M15, ΔlacX74, deoR, recA1, araD139, Δ(ara-leu)7697, galU, galK, rpsL(SmR), endA1, nupGInvitrogen
B. subtilis ATCC 21332Wild-type, surfactin producerBGSCID 3A22 *
B. subtilis 168 B. subtilis Marburg 168, trpC2BGSCID 1A1 *
B. subtilis Δ6Genome-reduced B. subtilis 168
trpC2, Δskin, ICEBs1(0), Δprophage1, Δprophage3, ΔSPbeta, ΔPBSX, Δpks::CmR
BGSID 1A1299 *
B. subtilis CS01B. subtilis 168 derivate sfp+This study
B. subtilis D6S01B. subtilis Δ6 derivate sfp+This study
B. subtilis D6S02B. subtilis D6S01 derivate
sfp+, S0-R6-srfAABCD
This study
B. subtilis D6S03B. subtilis D6S01 derivate
sfp+, TP2-srfAABCD
This study
B. subtilis D6S04B. subtilis D6S02 derivate
sfp+, S0-PsrfA-R6-srfAABCD
This study
B. subtilis D6S05B. subtilis D6S01 derivate
sfp+, ΔcodY
This study
B. subtilis D6S06B. subtilis D6S05 derivate
sfp+, ΔcodY, PsrfA-comA
This study
* ID number for the strain at the Bacillus Genetic Stock Center (BGSC).
Disclaimer/Publisher’s Note: The statements, opinions and data contained in all publications are solely those of the individual author(s) and contributor(s) and not of MDPI and/or the editor(s). MDPI and/or the editor(s) disclaim responsibility for any injury to people or property resulting from any ideas, methods, instructions or products referred to in the content.