Article

Characterization of SCOBY and Lactiplantibacillus plantarum ELB90 Fermented Coffee Kombucha from Different Coffee Sources

Food Engineering Department, Chemical and Metallurgical Engineering Faculty, Yildiz Technical University, Istanbul 34210, Turkey
*
Author to whom correspondence should be addressed.
Fermentation 2025, 11(8), 428; https://doi.org/10.3390/fermentation11080428
Submission received: 11 June 2025 / Revised: 11 July 2025 / Accepted: 19 July 2025 / Published: 25 July 2025
(This article belongs to the Section Fermentation for Food and Beverages)

Abstract

Coffee kombucha beverages were developed by fermenting various coffee substrates, including instant coffee (I), coffee brews of ground coffee beans (G), and additional spent coffee added ground coffee (GSC) using either SCOBY (S) or Lactiplantibacillus plantarum ELB90 (L), or a combination of both (SL). The combined SL inoculation did not synergistically enhance the growth of acetic and lactic acid bacteria, nor did it increase the acetic and lactic acid concentrations or improve retention of caffeoylquinic acids (CQA) compared to non-fermented controls stored for the incubation period (7 days). Samples fermented with L better preserved the total CQAs during incubation, notably increasing 3-CQA and 4-CQA in L-fermented G and GSC samples by up to 40%, whereas 5-CQA showed a slight decrease (up to 8%) in L-fermented G and GSC samples. After one week, all fermented samples maintained stable levels of 3-CQA compared to the non-fermented SCG control, with significantly elevated 4-CQA. Caffeic acid was detected only in the bound fraction of beans, exhibiting similar concentrations in both fermented and non-fermented samples. SL-fermented coffees showed significant reductions in caffeine contents, except for I coffee substrate, and spent coffee grounds (SCG) filtered from the SL-fermented sample also had significantly lower caffeine content. Panelists preferred coffee kombucha beverages inoculated with S over those fermented with L, which were rated least appealing. The study concludes that fermentation with specific inoculation cultures could mitigate the degradation of coffee phenolic compounds during storage and facilitate the production of beverages with lower caffeine content, potentially enhancing both functional properties and consumer acceptability.

1. Introduction

Consumer demand for functional beverages has been increasing due to their health and wellness benefits. Fermentation technology in beverage production uses live microorganisms, including probiotic bacteria and yeasts, which provide distinct advantages such as extended shelf life, appealing flavor and taste changes, as well as improved nutritional and bioactive properties.
Kombucha is traditionally made by fermenting sweetened black or green tea (Camellia sinensis) infusions with a symbiotic culture of bacteria and yeast (SCOBY), which produces a pleasant, fizzy, and sour taste. Its microbiota consists of various genera of acetic acid bacteria, yeasts, and, to a lesser extent, lactic acid bacteria [1,2]. Polyphenols, sugars, organic acids, amino acids, and vitamins are the primary bioactive constituents that are either derived from the substrates or modified into new compounds during fermentation [3,4]. There is a growing interest in producing kombucha beverages with alternative substrates, either by partially substituting C. sinensis infusions or completely replacing them with fruits, vegetables, cereals, legumes, algae, herbs, spices, milk, and coffee [5].
The substitution of tea infusion with coffee brew in the production of kombucha would modify the composition, including different polyphenol constituents and caffeine concentration. Moderate coffee consumption (3–4 cups daily) and its principal bioactive components, including alkaloids (caffeine, trigonelline), phenolics (chlorogenic acid derivatives, ferulic, p-coumaric, and sinapic acids), and diterpenes (cafestol, kahweol, and their esters) [6], have been linked to numerous health benefits, such as reduced risks of type-2 diabetes, several cancers, chronic liver diseases, as well as the onset of depression and anxiety [7].
Phenolic compounds exist in two forms: soluble (free) within plant cell vacuoles and insoluble, bound to the cell wall polymeric molecules through ester and glycoside bonds. Brewing coffee beans can only extract free phenolics, whereas spent coffee grounds (SCG), a byproduct of this process, serve as a valuable source for phenolics [8]. Fermentation can improve the liberation of bound phenolics from coffee beans and pulp. For example, yeast fermentation may weaken the strong bonds of phenolic compounds in the cell wall and facilitate easier extraction [6]. Alcoholic fermentation with Saccharomyces cerevisiae increased the chlorogenic acid content in coffee pulp extract by cleaving the ester bonds between chlorogenic acid derivatives and the pulp cell wall, facilitating caffeine detoxification [9,10]. Milić et al. [11] demonstrated that fermenting SCG with an enzymatic cocktail containing Lactobacillus rhamnosus (ATCC® 7469™) significantly increased the bioactive compounds (total polyphenols, chlorogenic acid, reducing sugars, and free amino acids) and antioxidant activity. During coffee roasting, 23% of phenolic compounds are co-polymerised to the melanoidin backbone, and fermentation, influenced by the inoculated strain, has been documented to promote the release of chlorogenic acids from the coffee melanoidin backbone, or chlorogenic acids can be hydrolyzed to more bioavailable free hydroxycinnamic acid derivatives, or enzymatic catalysis of free p-coumaric, caffeic, and ferulic acids to vinylphenols and ethylphenols, which are also desirable for roasted and smoky coffee aromas [12].
Previous studies have evaluated the use of coffee brews, coffee extracts [13,14,15,16,17], and various coffee by-products, including Robusta coffee leaf teas [18,19] and exfoliated Arabica coffee pulp [20], as alternative substrates for kombucha beverages. Bueno et al. [13] only compared the microbial diversity of kombucha coffees produced with SCOBY and those further inoculated with Lactobacillus casei (LC) and L. rhamnosus (LG). Watawana et al. [16] reported that the kombucha fermentation increased the chlorogenic acid concentration, antioxidant activity (DPPH and ORAC), and α-amylase inhibitory potential, whereas Pavlović et al. [15] stated that the fermented coffees showed a significantly lower DPPH antioxidant activity and that fermentation did not influence α-amylase inhibition. No significant differences were observed in the total phenolic compounds, 5-caffeoylquinic acid content, and antioxidant activities between the unfermented and kombucha-fermented Arabic coffee infusions [14]. Kombucha fermentation reduced the content of total polyphenols, flavonoids, and caffeoylquinic acids in green coffee extract depending on the incubation period [17].
Different from previous studies, the brews of instant coffee powder (I), ground coffee beans (G), and spent coffee added ground coffee (GSC) were fermented with SCOBY (S), L. plantarum ELB90 (L), and both (SL). The main objective of this study was to evaluate the impact of different microbial inocula (SCOBY, L. plantarum, and their combination) and coffee substrates (instant, ground, and spent coffee-enriched brews) on the phenolic composition, antioxidant activity, caffeine content, and microbial profiles of fermented coffee beverages. Simultaneously, their non-fermented counterparts, prepared and stored under identical conditions (25 °C for 7 days), were analyzed at the onset (day 0) and end of the incubation period (day 7). The total phenolic, total flavonoid, caffeine content, antioxidant activities, and individual phenolic acid compositions of all formulations were compared to elucidate the effects of coffee type and inoculated culture. Additionally, the changes in insoluble/bound and soluble phenolics and caffeine contents of spent coffee grounds (SCG) filtered from fermented GSC coffees were assessed and compared to those separated from unfermented control coffees to better understand the effects of fermentation. In this study, fermentation was anticipated to improve the functional and nutritional quality of coffee-based beverages through several mechanisms. These included: (i) enhanced antioxidant activity, due to potential release or biotransformation of bound phenolics; (ii) reduction in caffeine content, especially by combined microbial activity of SCOBY and L. plantarum ELB90; and (iii) improved retention or increase of certain phenolic acids, notably 3-CQA and 4-CQA, in some formulations. In addition, the fermentation process was expected to mitigate phenolic degradation during storage and potentially improve consumer acceptability through modulated acidity and sensory profiles.

2. Materials and Methods

2.1. Chemicals and Reagents

The medium-dark roasted coffee beans (Coffee arabica) (Kahve Dunyası, İstanbul, Türkiye), instant coffee (Nescafe Classic, Nestle), and SCOBY (Kefir Market) were purchased from local markets in Istanbul, Turkey. L. plantarum ELB90 was isolated from sourdough [21]. The caffeoylquinic acids, caffeic, ferulic, p-coumaric acids, gallic acid, caffeine, 2,2-Diphenyl-1-picrylhydrazyl radical (DPPH), Folin-Ciocalteu (FC), methanol, and ethyl acetate were bought from Sigma-Aldrich (Steinheim, Germany). GYC agar (Glucose yeast extract calcium carbonate) (Condalab, Torrejón de Ardoz, Spain), MRS (De Man Rogosa Sharpe), and Saboraud dextrose agar (Merck, Darmstadt, Germany) were used. All media were prepared in accordance with the manufacturer’s instructions.

2.2. Preparation of Fermented Coffee Beverages

Whole coffee beans were ground and brewed (G) using a coffee machine (Delonghi Magnifica, Treviso, Italy) by setting the coffee mill to level 5 (1 = finest and 7 = most coarse milling) in the extra-strong mode. 20.80 g of coffee beans were brewed with 250 mL of water (80 °C). 5 g of instant coffee was dissolved in 250 mL of water (I) to get the same soluble solid content (Bx of 2°) of sample G. The residue of the brewed coffee grounds (SCG) was added to G coffee to prepare GSC coffee. Granulated sugar (17.5 g) was dissolved in each 250 mL coffee sample (I, G, GSC), resulting in a final concentration of 7% (w/v). This concentration was selected based on established kombucha fermentation protocols and previous studies using tea or coffee substrates, where sugar levels between 5–10% (w/v) are commonly used to support microbial activity and metabolite production while maintaining desirable sensory properties [22].
Before inoculation, L. plantarum ELB90 was activated by streaking on MRS agar and incubating for 48 h at 37 °C. A single colony was then transferred to 5 mL MRS broth and incubated for 24 h, followed by inoculation into 50 mL MRS broth and incubation for an additional 20 h. The culture was centrifuged at 8600× g for 10 min at 4 °C, and the pellet was washed sequentially with 0.9% sterile NaCl solution and sterile distilled water. The washed cell pellets were suspended in 10 mL sterile distilled water, and this suspension was used to inoculate the coffee samples at 2% (v/v), yielding an initial LAB concentration of approximately 109 CFU/mL, confirmed by viable cell counts using serial dilution and plating. The same procedure was followed across all fermentation batches to ensure standardization. SCOBY was rinsed with sterile distilled water prior to use and inoculated at a rate of approximately 150 g per 250 mL of coffee. All fermentations were performed under static conditions in an air-circulated incubator at 25 °C for 7 days. To minimize batch variation, all samples were incubated simultaneously in the same chamber. Non-fermented controls and inoculated samples, covered with sterile cotton gauze fabric, were both incubated in an air-circulated incubator at 25 °C for 7 days. SCOBY was separated from S and SL fermented samples, and SCGs were filtered from GSC coffees. The samples were taken for microbiological analyses, organic acids, and sensory evaluations on the final day of incubation; for other measurements, the samples were stored at −18 °C until analysis.

2.3. pH, Titratable Acidity (TA%), Organic Acid Determination

The pH values of samples were measured daily throughout the incubation days (0, 1, 2, 3, 5, and 7 days) using a pH meter (InoLab 720, Weilheim, Germany). Titratable acidity (TA%) values were determined by titrating 10 mL of the sample with a 0.1 N NaOH until the pH was 8 [23]. The organic acids were analyzed on a Shimadzu HPLC system (LC-20A pump, DGU-20A5R degasser, SIL-20A HT autosampler, CTO-10ASVP column oven, SPD-20A UV-VIS detector, and CMB-20A communication module). The mobile phase was 0.2 M KH2PO4 (pH 2.4) with a flow rate of 0.8 mL/min. 10 µL filtered samples were injected into an Inert Sustain C18 column (5 µm, 4.6 × 250 mm). The concentrations of organic acids were calculated using the calibration curves of the relevant standards [24]. The results were presented as mg/L for coffee drinks.

2.4. Enumeration of Lactic Acid Bacteria (LAB), Acetic Acid Bacteria (AAB), and Yeast

Serial dilutions ranging from 10−1 to 10−6 were prepared using sterile 0.85% saline solution. For each dilution, 100 µL was plated in triplicate onto the corresponding agar medium using the spread plate method. Diluted samples were inoculated onto GYC agar and incubated at 30 °C for 5 days; cream-colored colonies with a clear precipitation zone were counted as acetic acid bacteria (AAB). MRS agar incubated at 37 °C for 48 h was used for the enumeration of lactic acid bacteria (LAB), while Sabouraud dextrose agar incubated at 30 °C for 48 h was used to count yeasts. Microbial counts were expressed as log10 CFU/mL. In cases where no colonies were detected, the detection limit was considered to be 1.00 log CFU/mL, corresponding to 10 CFU/mL based on the lowest dilution and plating volume.

2.5. Bioactive Compound Analysis

2.5.1. Extraction of Free and Bound Phenolics

The extraction methods of Wu et al. [25] and Almeida et al. [26] were modified. SCGs filtered from non-fermented (day 0 and 7) and S, L, and SL-fermented GSCs were dried overnight at room temperature (at a moisture content of ~12.5%), defatted with hexane (1:10, w/v) on the magnetic stirring (100 rpm, 30 min), and centrifuged (3630× g, 20 min, 25 °C). Hexane was removed with air flow under a fume hood.
Free/soluble phenolics of samples were extracted with 80% aqueous methanol (1:75, w/v) for 30 min in an orbital shaking water bath (60 °C, 100 rpm), followed by an ultrasonic water bath (300 W, Daihan, Wonju, Republic of Korea) for 30 min (25 °C, ice cubes used to maintain temperature), and centrifuged (6140× g, 15 min, 4 °C), and the residue was re-extracted. The combined supernatants evaporated to dryness (40 °C, 100 mmHg) were dissolved in methanol (2 mL) and stored at −18 °C (free fraction).
The extraction of the bound/insoluble fraction was performed in two stages: alkaline and acidic hydrolysis. After free phenolic extraction, the dried solid residue was mixed with 2 M NaOH (10 mM EDTA, 2% ascorbic acid) at 1:20 (w/v) for 30 min. The pH was adjusted to 2 (6 M HCl), ethyl acetate (1:1, v/v) was added and stirred for 10 min., and centrifuged (2940× g, 5 min, 25 °C). The residue was extracted four more times, and the supernatants were pooled. The residue remained after alkaline hydrolysis was incubated with HCl (6 M) in an orbital shaking water bath (85 °C) for 1 h, brought to pH 2 with 6 M NaOH, ethyl acetate extraction step above was repeated, and all supernatants of alkaline and acid hydrolysis were mixed, evaporated to dryness and dissolved in methanol (2 mL), stored at −18 °C (bound fraction).

2.5.2. Total Phenolic Content (TPC) and Total Flavonoid Content (TFC), and Antioxidant Activity Assays

TPC, TFC, DPPH radical scavenging activity, and the FRAP assay were determined [27]. TPC and TFC were expressed as mg gallic acid equivalents (GAE)/mL coffee and mg GAE/g dry weight (dw) of coffee beans and SCG, and as mg catechin equivalents (CE)/mL and mg CE/g dw, respectively. Antioxidant activity results were given as mg Trolox equivalents (TE)/mL and mg TE/g dw.

2.5.3. HPLC Analysis of Phenolics

Phenolic compounds were determined using the HPLC system previously described (2.3) coupled to a SPDM20A diode array detector (Shimadzu Corp., Tokyo, Japan). Separations were conducted at 40 °C on an Inertsil ODS-3C18 reversed-phase column (250 × 4.6 mm, 5 μm, GL Sciences, Tokyo, Japan) coupled with an Inertsil ODS-3 cartridge guard column (10 × 4 mm, 5 μm). The mobile phase included solvent A, Milli-Q water with 0.1% (v/v) trifluoroacetic acid (TFA), and solvent B, acetonitrile with 0.1% v/v TFA. Linear gradient elution was: at 0 min, 95% of solvent A, at 50 min, 65% of solvent A, at 52 min, 25% of solvent A, and at 59 min, returns to initial conditions. The flow rate was 1 mL/min [28]. Identification and quantification were performed using retention time and external standard curves. The results were given as mg/L and mg/100 g dw.

2.6. Sensory Analysis

The sensory analysis of the fermented coffee beverages was conducted on the 7th day of fermentation. The tests were performed anonymously and on a voluntary basis. Twenty-five experienced panelists (13 women and 12 men), familiar with kombucha-based beverages, participated in the study. The panelists were students and faculty members from Yildiz Technical University, aged between 25 and 55 years, with over 90% holding a graduate degree. The safety of the products was verified through microbiological analysis before sensory testing. In addition, panelists were briefed on the samples and evaluation procedures. Although coffee and kombucha are not classified as major allergens, participants with sensitivities to fermented products or microbial cultures (e.g., yeast or bacteria) were informed accordingly. Appearance, sourness, astringency, palatability, odor, mouthfeel, and overall acceptability were evaluated using a 5-point hedonic scale (1 = dislike very much, 3 = neither like nor dislike, 5 = like very much) [29]. Approximately 30 mL of each sample, stored at 4 °C, was used for sensory analysis and served in 40 mL polystyrene foam cups coded with random three-digit numbers, presented in a randomized order. Panelists were instructed to rinse their mouths with potable water between samples.

2.7. Statistical Analysis

All samplings and experiments were carried out in triplicate, and the data were reported as the mean ± standard deviation. Statistical analysis was performed with SPSS (IBM version 20, Armonk, NY, USA). The effect of coffee type and inoculated culture and their interaction on the measured responses was evaluated by two-way analysis of variance (ANOVA). If a significant interaction effect was observed between the independent variables, Bonferroni’s test for multiple comparisons was used to evaluate. The effect of inoculated culture on the properties of spent coffee grounds (SCG) filtered from GSC coffees was evaluated by one-way analysis of variance (ANOVA) followed by Tukey’s multiple comparison test. Statistical significance was inferred at p < 0.05.

3. Results and Discussion

3.1. Physicochemical Properties of Fermented Coffee Drinks

The endpoint of kombucha fermentation ranged from 7 to 14 days [30]. The pH measurement quantifies the concentration of hydrogen ions in an aqueous solution, reflecting the amount of deprotonated acid molecules. A well-balanced acidity is crucial for a good cup of coffee, as it often enhances flavor [31]. The Food and Drug Administration (FDA) requires that commercial kombuchas maintain a pH range of 2.5 to 4 [32]. The fermentation was concluded after one week because the last three measurements exhibited similar pH values, mitigating the risk of a vinegar-like taste in the final beverages with longer fermentation. A pH lower than 3 would also make kombucha drinks excessively acidic and unpalatable [33].
The pH values of non-fermented control coffees were approximately 5.20 on the day of preparation (day 0) and slightly decreased to around 5.10 at the end of the incubation period (day 7). After inoculation, the pH values of the S and SL-inoculated samples (day 0) decreased (4.03–4.53) due to the residual SCOBY infusion. The pH of all fermented coffees was significantly decreased to 3.29–4.58 on day 7 (Table S1), depending on the inoculation culture and coffee substrate. At the end of fermentation, L-fermented samples (4.07, 4.40, and 4.58 for I, G, and GSC, respectively) exhibited higher pH values, whereas SL-fermented samples demonstrated the lowest pH values (3.29, 3.55, and 3.71 for I, G, and GSC, respectively). Notably, GSC samples fermented with L maintained relatively higher pH values than other groups. This observation may suggest a potential buffering effect provided by the insoluble matrix of spent coffee grounds, which might have partially neutralized the organic acids formed during fermentation. Following one day of incubation, the pH reduction was more pronounced in S and SL-fermented coffees and remained steady throughout the incubation period. Although samples inoculated with L showed less pH reduction on the first day, this gradually decreased during incubation.
Organic acids were not only responsible for the tart and sour taste in beverages but also essential for reducing the contamination risk. The coffees inoculated with SL had the highest TA (%) value (8.40–9.50%), followed by those fermented with S (5.90–6.60%) (Table S2). The concentrations of acetic and lactic acids in fermented coffees were given in Table 1. The interaction between substrate (coffee type) and inoculated culture significantly affected the concentration of organic acids. Within each coffee group, L-fermented coffees exhibited the lowest acetic acid content. The acetic acid content in S-fermented coffees was independent of the substrate, while in L and SL-fermented samples, it was dependent on the coffee type. For example, the SL fermentation resulted in the highest acetic acid concentration in G coffees (1683.53 mg/L). In other coffee substrates, fermentation with S yielded higher acetic acid concentrations ranging from 1425.26 to 1493.02 mg/L. Lactic acid was undetected in samples inoculated only with S in each coffee group. In coffees of I and GSC, L fermentation produced a higher lactic acid concentration (p < 0.05) compared to SL fermentation; however, in G coffees, SL fermentation resulted in higher levels (584.62 mg/L). Between the G and GSC groups, in which the only difference was the added SCG, the production of lactic acid and acetic acid was lower in GSC coffees. The increase in organic acid content in fermented beverages is linked to a decrease in pH, attributed to the microbial inoculum metabolizing sucrose and producing various acids. Acetic, gluconic, glucuronic, and lactic acids were reported to be the main organic acids in SCOBY-fermented beverages [33], though lactic acid was not detected in our samples fermented only with S. The presence of lactic acid bacteria (LAB) in kombucha beverages has been inconsistently reported; for example, no LAB was isolated in kombucha black and green teas fermented up to 21 days [34]. Jayabalan et al. [35] reported a low level of lactic acid in kombucha black tea. Less than half of the sixteen Estonian kombucha teas contained lactic acid [32].

3.2. Lactic Acid Bacteria (LAB), Acetic Acid Bacteria (AAB), and Yeast Counts

No detectable growth of LAB, AAB, or yeast was observed in the 7-day stored non-fermented samples. Figure 1 illustrates the population dynamics of LAB, AAB, and yeast (log CFU/mL) in fermented coffee samples. S-fermented coffees showed comparatively low LAB counts (4.36 to 5.56 log CFU/mL). Previous studies reported inconsistent results, with some samples exhibiting no LAB presence [34], while others, based on culture and sequencing, have identified Lactobacillus, Lactococcus, and Oenococcus in the SCOBY microbiota [36,37]. LAB counts of L-fermented I and G coffees reached up to 10.34 log CFU/mL, whereas L-fermented GSC coffee had retained almost the initial load (8.83 log CFU/mL).
AAB was not detected in L-fermented coffees and ranged from 2.74 to 4.61 log CFU/mL in S and SL-fermented samples, with the lowest in SL-fermented GSC coffee and the highest in S-fermented I coffee. The AAB counts were higher in I and GSC samples that were fermented with S compared to the SL-inoculated ones. Though there was no significant difference in AAB counts when the substrate was G coffee brew. SL inoculation seemed to suppress LAB growth, likely due to an amensal interaction with AAB, where elevated acetic acid levels in SL samples may have created an unfavorable environment for LAB. A similar dynamic was also observed for LAB counts; for example, SL-fermented coffees had lower LAB counts than L-fermented samples. Similar inhibitory effects between LAB and AAB have also been reported in other fermentation processes. In the solid-state fermentation of cereal vinegar, Xia et al. [38] found that Acetobacter pasteurianus inhibited the growth and metabolism of L. helveticus. They further noted that there was no nutritional competition; instead, ethanol, lactic acid, and particularly acetic acid were identified as key endogenous factors regulating their growth profiles.
No yeast growth occurred in L-fermented coffees, and in other samples it ranged from 3.18 to 4.72 log CFU/mL. Compared to S-inoculated coffees, the additional introduction of L resulted in an increase in yeast counts in G and GSC coffees, but not in I coffees. For example, the yeast count of S-inoculated G coffee was 3.55 log CFU/mL and rose to 4.72 log CFU/mL (p < 0.05) when the same substrate (G) was inoculated with SL. Similarly, yeast counts in GSC coffee increased from 3.49 to 4.68 log CFU/mL (p < 0.05) when the inoculation culture contained both S and L. Numerous fermentation studies, such as sourdough [39] or kefir [40], have shown that yeast and LAB interact synergistically to promote microbial growth [41].

3.3. TPC, TFC, Antioxidant Activities, Caffeine, and Phenolic Constituents of Fermented Coffee Drinks

The TPC, TFC, and antioxidant activities (DPPH and FRAP) of samples were given in Table 1. The initial TPC of non-fermented coffees (day 0) ranged from 2.48 to 3.27 mg GAE/mL, with the GSC prepared by the additional SCG presenting the highest (p < 0.05) initial concentration. In all non-fermented control coffees stored for one week, the concentration was reduced to approximately 1.15 mg GAE/mL (Table 1), where coffee samples underwent possible oxidation reactions.
The interaction between coffee type and inoculated culture on the measured values was significant (p < 0.05). When the inoculation culture was SL, the TPC of all fermented coffees was not significantly different. In the I and G coffee groups, SL inoculation yielded higher values, ranging from 2.30 to 2.70 mg GAE/mL, whereas in the GSC coffee group, L fermentation resulted in higher TPC (2.92 mg GAE/mL). Previous studies by Pavlović et al. [15] and Ferreira de Miranda et al. [14], which compared the fermented coffees to the initial non-fermented product (day 0), reported negligible changes in the TPC. In our fermented samples, all GSC coffees, SL- and L-fermented G and I, and L-fermented G coffees had higher TPC than their non-inoculated but 7-day-stored controls. In all coffee samples, depending on the inoculation culture, fermentation could protect the phenolic compounds to some extent against oxidative degradation that occurred during storage. This protective effect was statistically significant (p < 0.05) in SL-inoculated G and I coffees as well as L-inoculated GSC, indicating that the combined action of SCOBY and L. plantarum (SL group) or the L. plantarum strain alone may effectively retain phenolic compounds during storage.
The initial TFC of non-fermented coffees ranged from 2.16 to 2.69 mg CE/mL, with the lowest (p < 0.05) value observed in the I sample (Table 1). In each coffee group, 7-day stored non-inoculated samples, TFC was slightly reduced (p > 0.05) to 2.05 and 2.30 mg CE/mL. In S-fermented coffees, the TFC value attained was not dependent on the coffee type. L-fermentation resulted in the significantly higher TFC in GSC and I coffees. Although in G coffees, TFC of L-fermentation was higher than in other samples, the difference was not significant (p > 0.05).
The initial DPPH values (day 0) for the non-fermented I and G coffees were 3.43 and 2.57 mg TE/mL, respectively, while GSC coffee had a significantly higher value (11.50 mg TE/mL), which decreased to 8.78 mg TE/mL during storage (Table 1). After brewing, the residue, SCG, still possesses a significant amount of phenolics (Figure 2); thus, their addition to G coffee could elevate the measured antioxidant activity values of GSC. Besides phenolics, SCG contains other water-soluble compounds like caffeine, trigonelline, and Maillard reaction products, which have antioxidant properties [42,43]. Due to compounds remaining in the SCG after brewing, GSC may have higher DPPH values. The higher antioxidant activity values of whole coffee brews compared to their filtered portion were previously attributed to the removal of potentially antioxidant high-molecular-weight compounds such as melanoidins during the coffee clarification process [44]. Therefore, as expected, fermented GSC samples had higher DPPH values than other coffees. Compared to their non-fermented counterparts at day 7, in each coffee group, inoculation by SL did not result in significant differences in DPPH values. However, the results of either L or S inoculation differed depending on the substrate. For example, I and G coffees only with L inoculation resulted in lower DPPH values, whereas in GSC coffees, the DPPH values were significantly lowered (p < 0.05) by L and S inoculation (Table 1). The kombucha fermented coffee of Pavlović et al. [15] showed a significantly lower ability to reduce DPPH radicals compared to the initial non-fermented samples. According to Zofia et al. [17], the fermentation duration of green coffee extracts influenced antioxidant activity. Fermented samples for 7 and 14 days exhibited reduced DPPH values compared to their non-fermented samples. Whereas samples fermented for 27 days showed no difference.
Among non-fermented coffees on the day of preparation (day 0), the ferric ion reducing ability (FRAP) ranged from 3.52 to 4.71 mg TE/mL, with the lowest value (p < 0.05) in I-coffee (Table 1). The FRAP values of all non-inoculated coffees decreased after a week of storage, which was not became significant only in I coffees. The fermented coffees, except L and SL-G coffees, had significantly higher FRAP values than their 7-day-stored non-fermented control sample. The different trend observed between the FRAP and DPPH assays could be related to the different mechanisms of action. The FRAP assay acts by single electron transfer (SET) and could provide an overall picture of oxidation/reduction of all antioxidants present in the sample, while DPPH was reported to act by SET and hydrogen atom transfer [45].
The initial caffeine concentration in non-fermented coffees ranged from 961.10 to 1137.72 mg/L and remained relatively stable (967–1058 mg/L) after one week of storage (Table 1). In contrast, all SL-fermented samples exhibited significantly reduced caffeine levels, ranging from 733.39 to 883.08 mg/L, particularly in G and GSC coffees with higher initial caffeine concentrations. Although we did not perform microbial profiling of the inocula, known caffeine-degrading genera such as Pseudomonas, Klebsiella, and Bacillus [46] are not typically present in SCOBY. Therefore, enzymatic caffeine degradation via N-demethylation is considered unlikely. Lactiplantibacillus plantarum is also not typically associated with caffeine catabolism, and SCOBY does not typically contain caffeine-degrading species. However, the yeasts and acetic acid bacteria present in SCOBY may contribute to caffeine reduction through cellular uptake, intracellular sequestration, or limited metabolic transformation. For instance, Saccharomyces cerevisiae has been shown to absorb and utilize caffeine to a certain extent, expelling excess amounts as needed [47]. These findings are consistent with previous studies, in which yeast or mixed microbial fermentations led to measurable reductions in the caffeine content of coffee and tea. For example, Purwoko et al. [47] reported a 9–11% caffeine reduction in robusta coffee after 4 days of fermentation with S. cerevisiae, L. mesenteroides, and L. casei. Wang et al. [48] also observed reduced caffeine levels in teas fermented with yeast. In contrast, Watawana et al. [16] observed a slight increase in caffeine in instant and fine-ground coffees fermented with tea fungus, likely due to the release of caffeine from chlorogenic acid complexes. Taken together, the caffeine decrease observed in our study likely reflects a combination of microbial absorption and partial metabolism rather than true enzymatic degradation. This reduction was statistically significant (p < 0.05) in G and GSC samples, further supporting the conclusion that co-fermentation with SCOBY and L. plantarum effectively reduces caffeine content in coffee beverages.
In our samples (Figure 3), the isomers of caffeoylquinic acids (CQA), mainly 5-CQA, 4-CQA, and 3-CQA, were the main phenolic acids detected, and their concentration followed the order of 5-CQA > 4-CQA > 3-CQA. Although Kučera et al. [49] identified 4-CQA as the primary component in roasted Coffee arabica L. beans, various studies showed 5-CQA as the primary CQA component in brewed coffee and beans, accounting for 56–62% of total CQA, considering that 4-isomers usually equal or slightly exceed 3-isomers [50,51]. The degradation of 5-CQA was reported to contribute to the isomerization and intermediate rise of the minor isomers as 3-CQA and 4-CQA, during coffee roasting. The levels of the substitutes in the 5-CAQ decrease substantially, while those of the substitutes in the 3 and 4 positions increase to almost double their original levels [52]. In our coffee drinks sourced from ground beans, the amount of 5-CQA is slightly higher than that of 4-CQA, though the concentration of 5-CQA was lower than that of 4-CQA in the instant coffee (Figure 3), which could be attributed to both the source of coffee beans and previous processing conditions. In addition to these factors, microbial enzymatic activity may have contributed to the observed changes in CQA isomers. LAB such as Lactiplantibacillus plantarum are known to produce hydrolytic enzymes, including esterases, which can cleave ester bonds between phenolic acids and the plant cell wall or melanoidin complexes. This may not only facilitate the release of bound phenolics but also promote isomerization of 5-CQA into 3-CQA and 4-CQA, enhancing the bioavailability and structural diversity of phenolic compounds in fermented products [53]. Specifically, the cleavage of ester bonds in 5-CQA may induce a positional rearrangement of the caffeoyl moiety on the quinic acid backbone, resulting in the formation of its 3- and 4-isomers.
The initial total CQA content of non-fermented G (1061.70 mg/L) and GSC (1137.49 mg/L) was not different and significantly higher than that of non-fermented I (403.58 mg/L). Total CQA content remained almost unchanged during the storage of non-fermented I and G coffees but decreased (p < 0.05) in the GSC (984.89 mg/L) coffee (Figure 3D). The reduction of 5-CQA and 4-CQA of non-fermented GSC coffees was up to 27% by storage, while only 5-CQA was reduced up to 12% in G coffees (Figure 3B,C). Chlorogenic acids were reported to be the least stable compounds in the cold-brew coffees during storage [54].
Compared to their non-fermented counterparts, a significant reduction in total CQA was observed in SL-fermented G (569.94 mg/L) and GSC (760.48 mg/L), while the reduction in I coffee (328.81 mg/L) was not significant. For example, compared to their initial content, 65%, 20%, and 60% reductions were determined at 5-CQA, 4-CQA, and 3-CQA concentrations in SL-fermented G coffee. The total CQA content was increased in L-fermented G (1090 mg/L) and GSC (1331 mg/L) coffees, but this increase was only significant (p < 0.05) when the substrate was GSC. The 3-CQA and 4-CQA content of those samples increased (up to 40%) compared to their initial non-fermented counterparts (day 0), whereas their 5-CQA values were reduced up to 8% (Figure 3A–C). The inoculation with only S showed a different trend depending on the substrate and measured CQA. For example, compared to the initial amount, the 5-CQA content was increased up to 21% in S-fermented G, but reduced in S-fermented GSC and I coffees up to 30% (Figure 3C).
The presence of p-coumaric and ferulic acid was also determined in samples (Figure 4). The initial concentration of p-coumaric acid in all non-fermented coffees was significantly decreased by storage. This significant reduction was also observed in fermented coffees except L-fermented I coffees (Figure 4A). The initial concentrations of ferulic acid in non-fermented G (4.01 mg/L) and GSC (3.76 mg/L) coffees were similar (p > 0.05), and increased in non-fermented I and G and slightly reduced in GSC after a week of storage. It was detected in all S-fermented coffees, but not in I coffees fermented with L and SL, and GSC coffee fermented with L (Figure 4B).

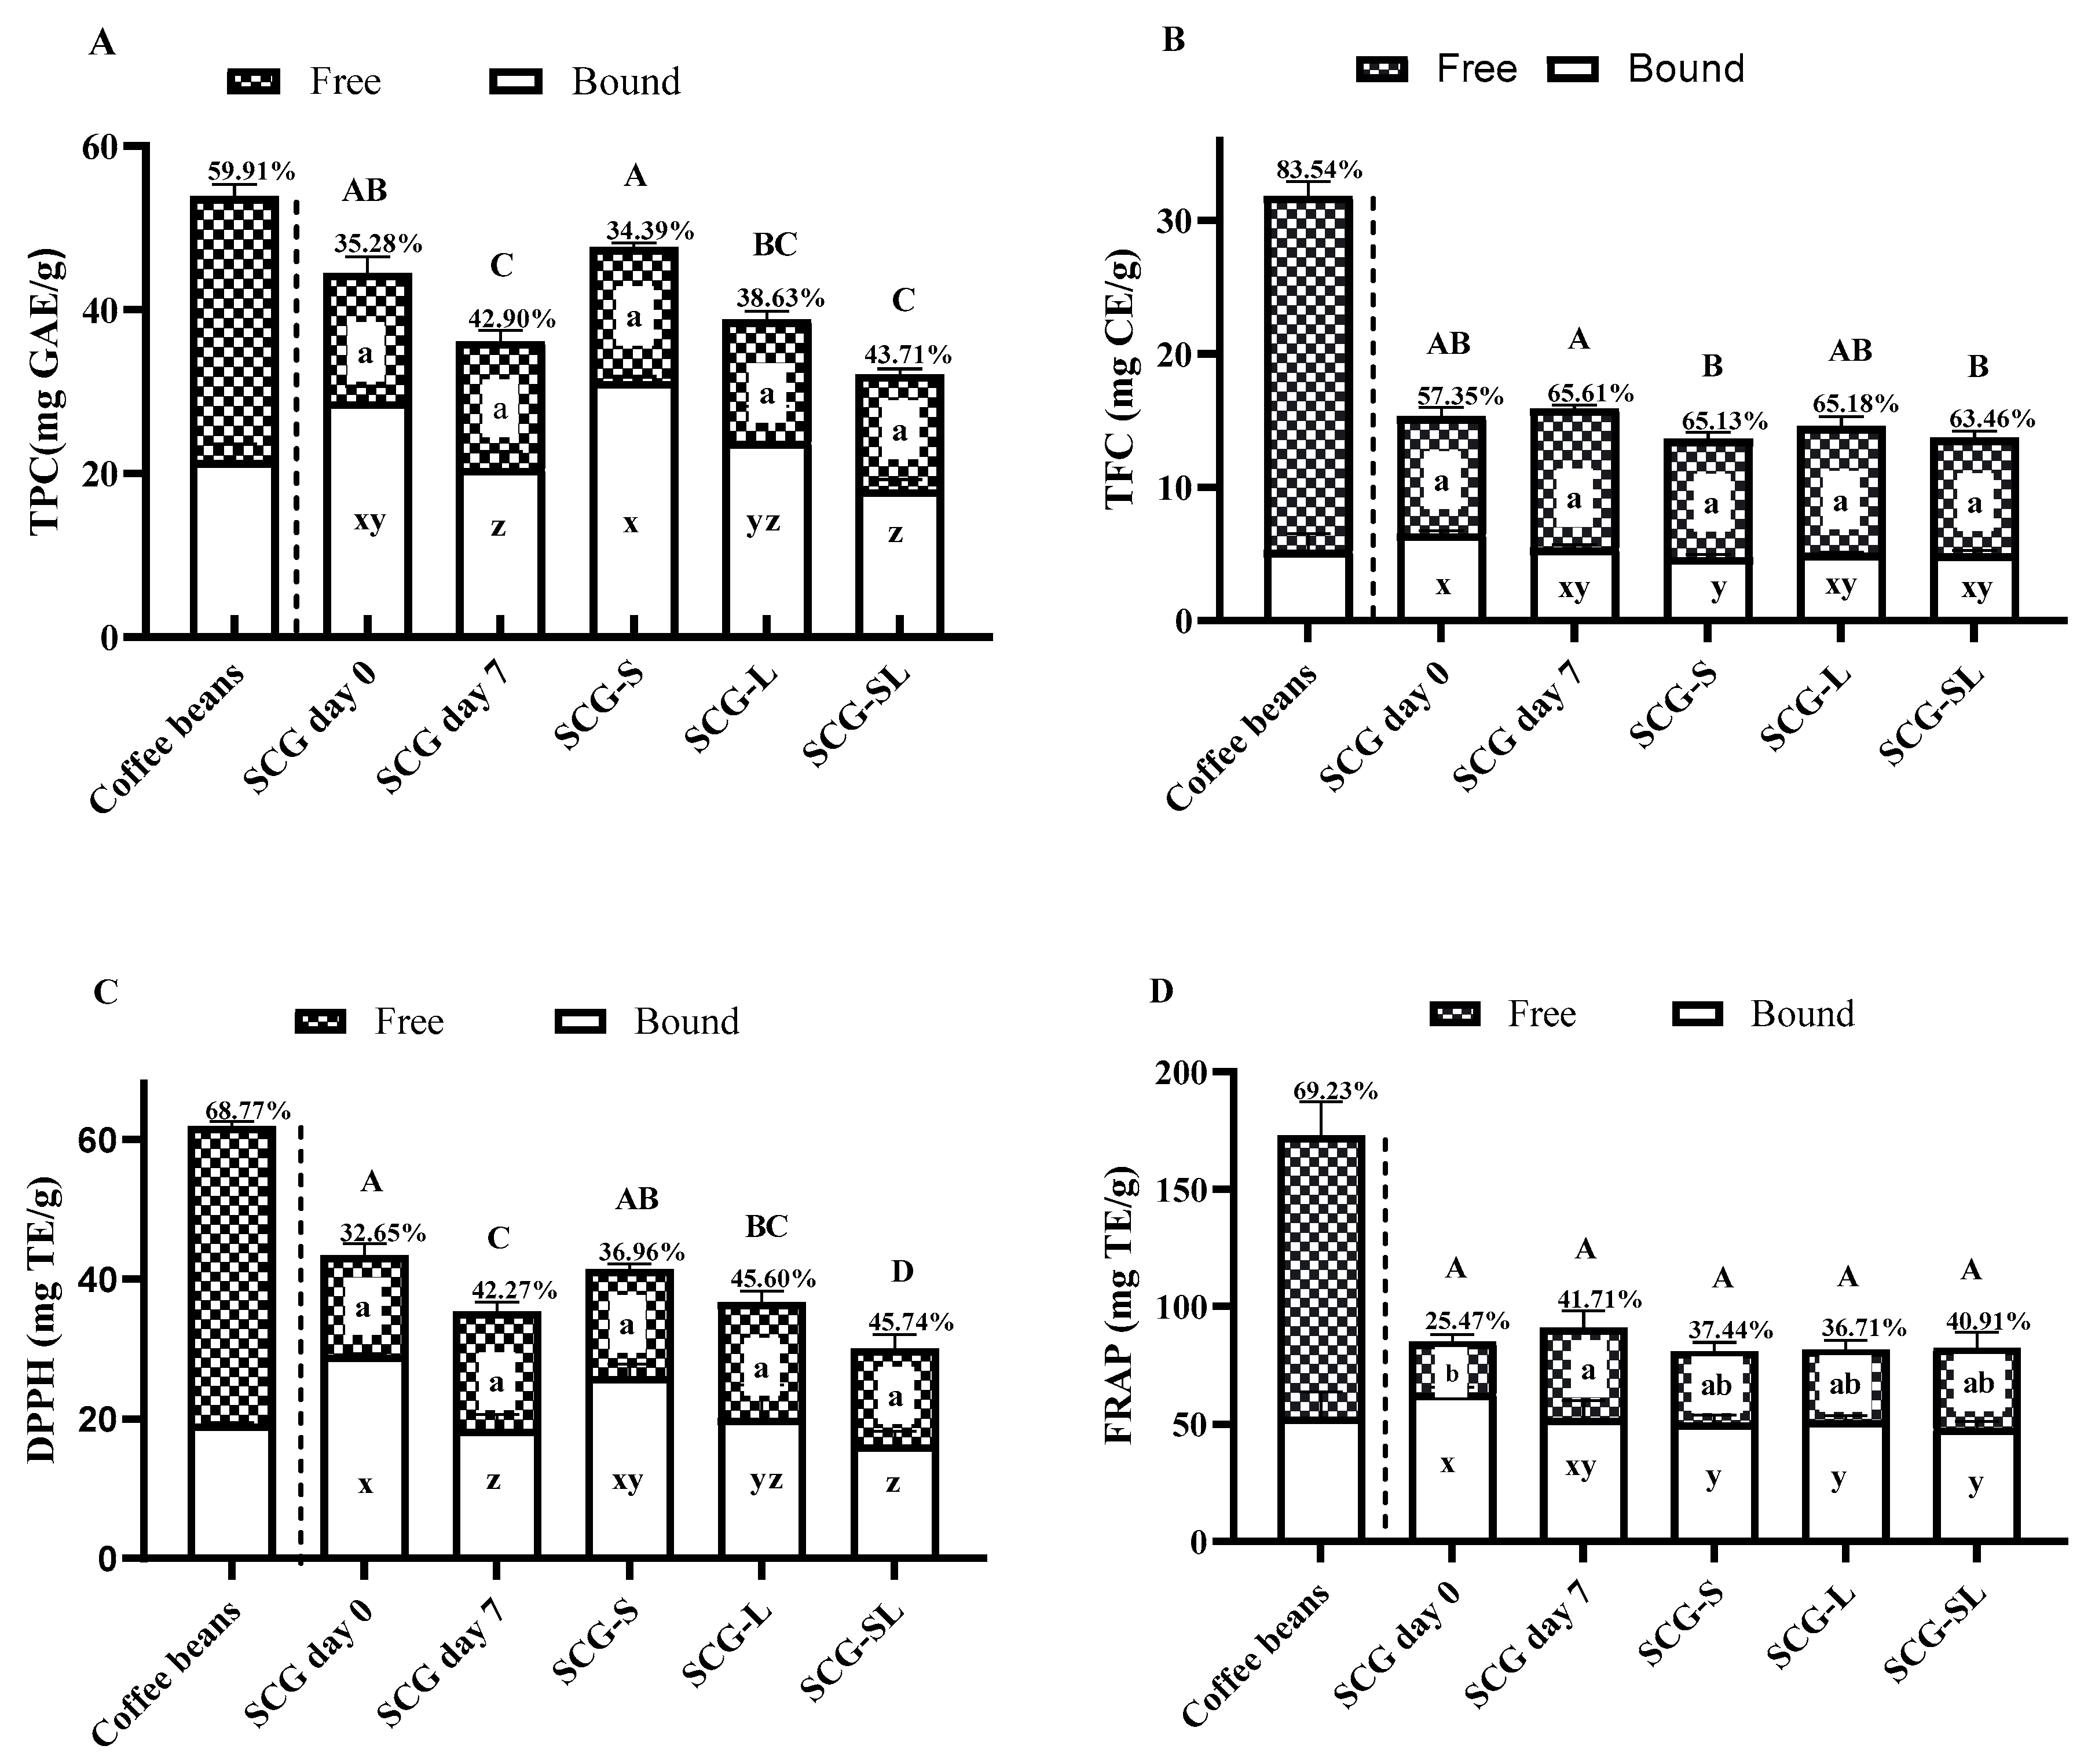
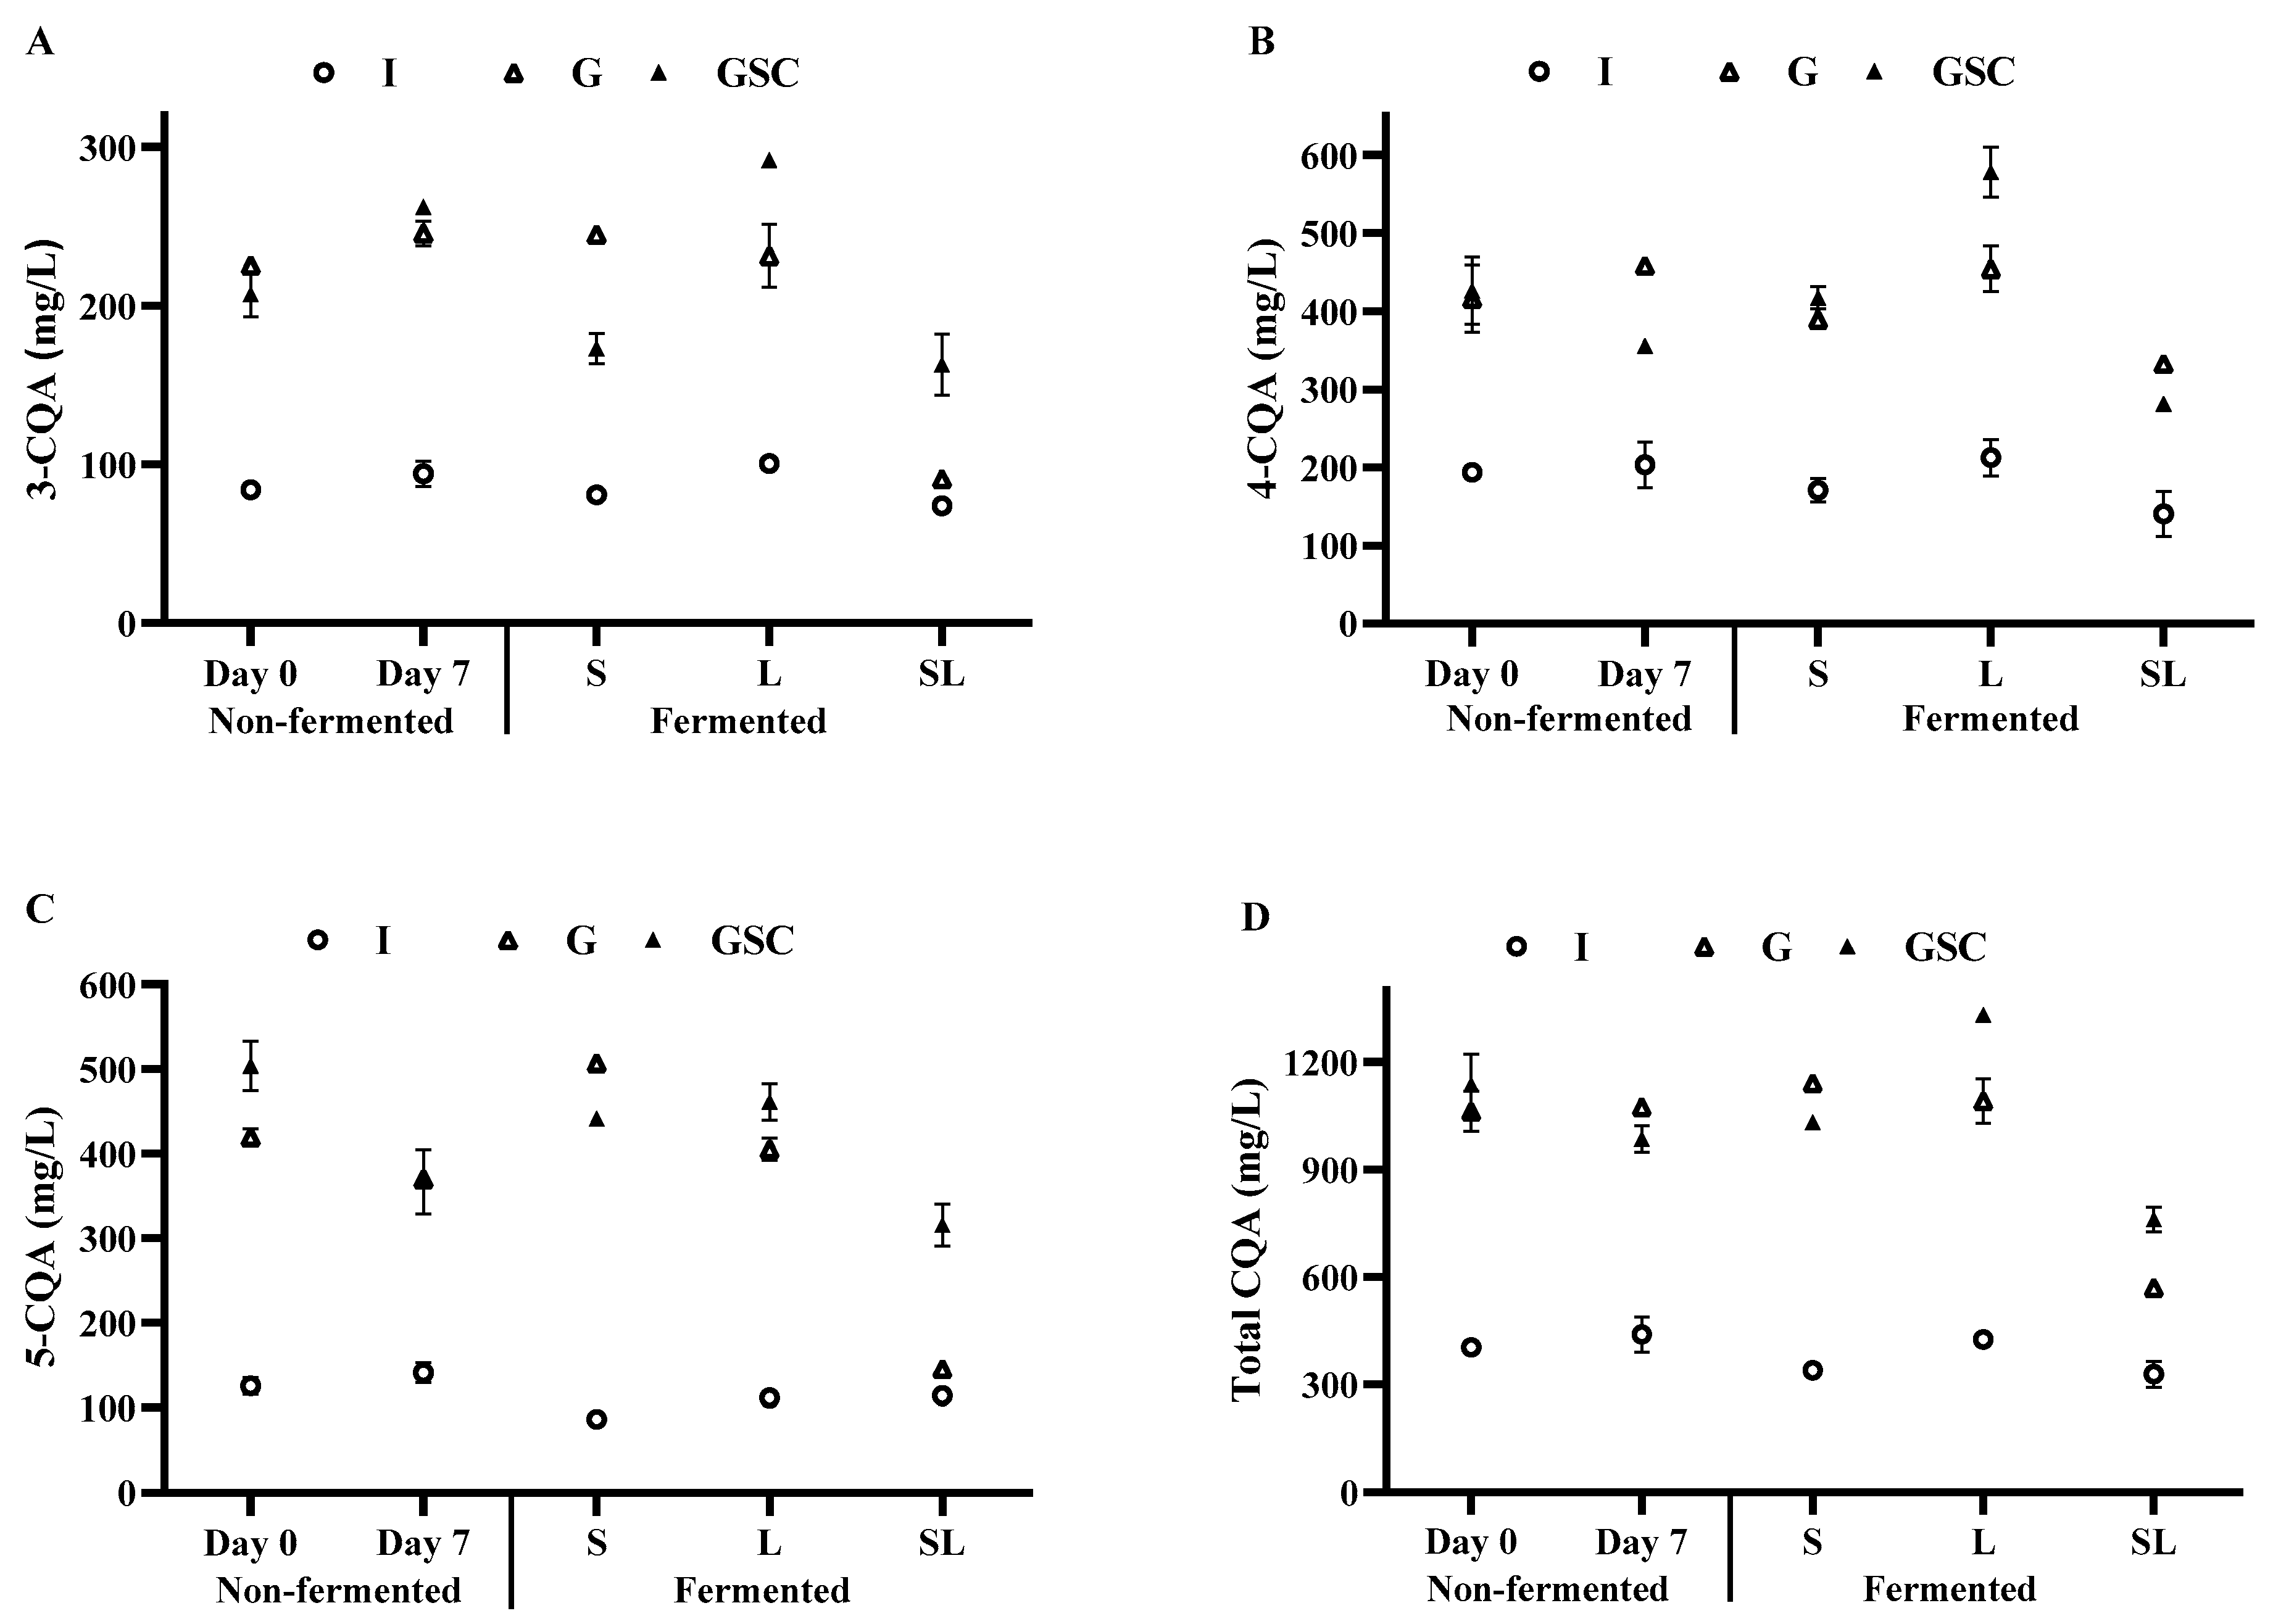
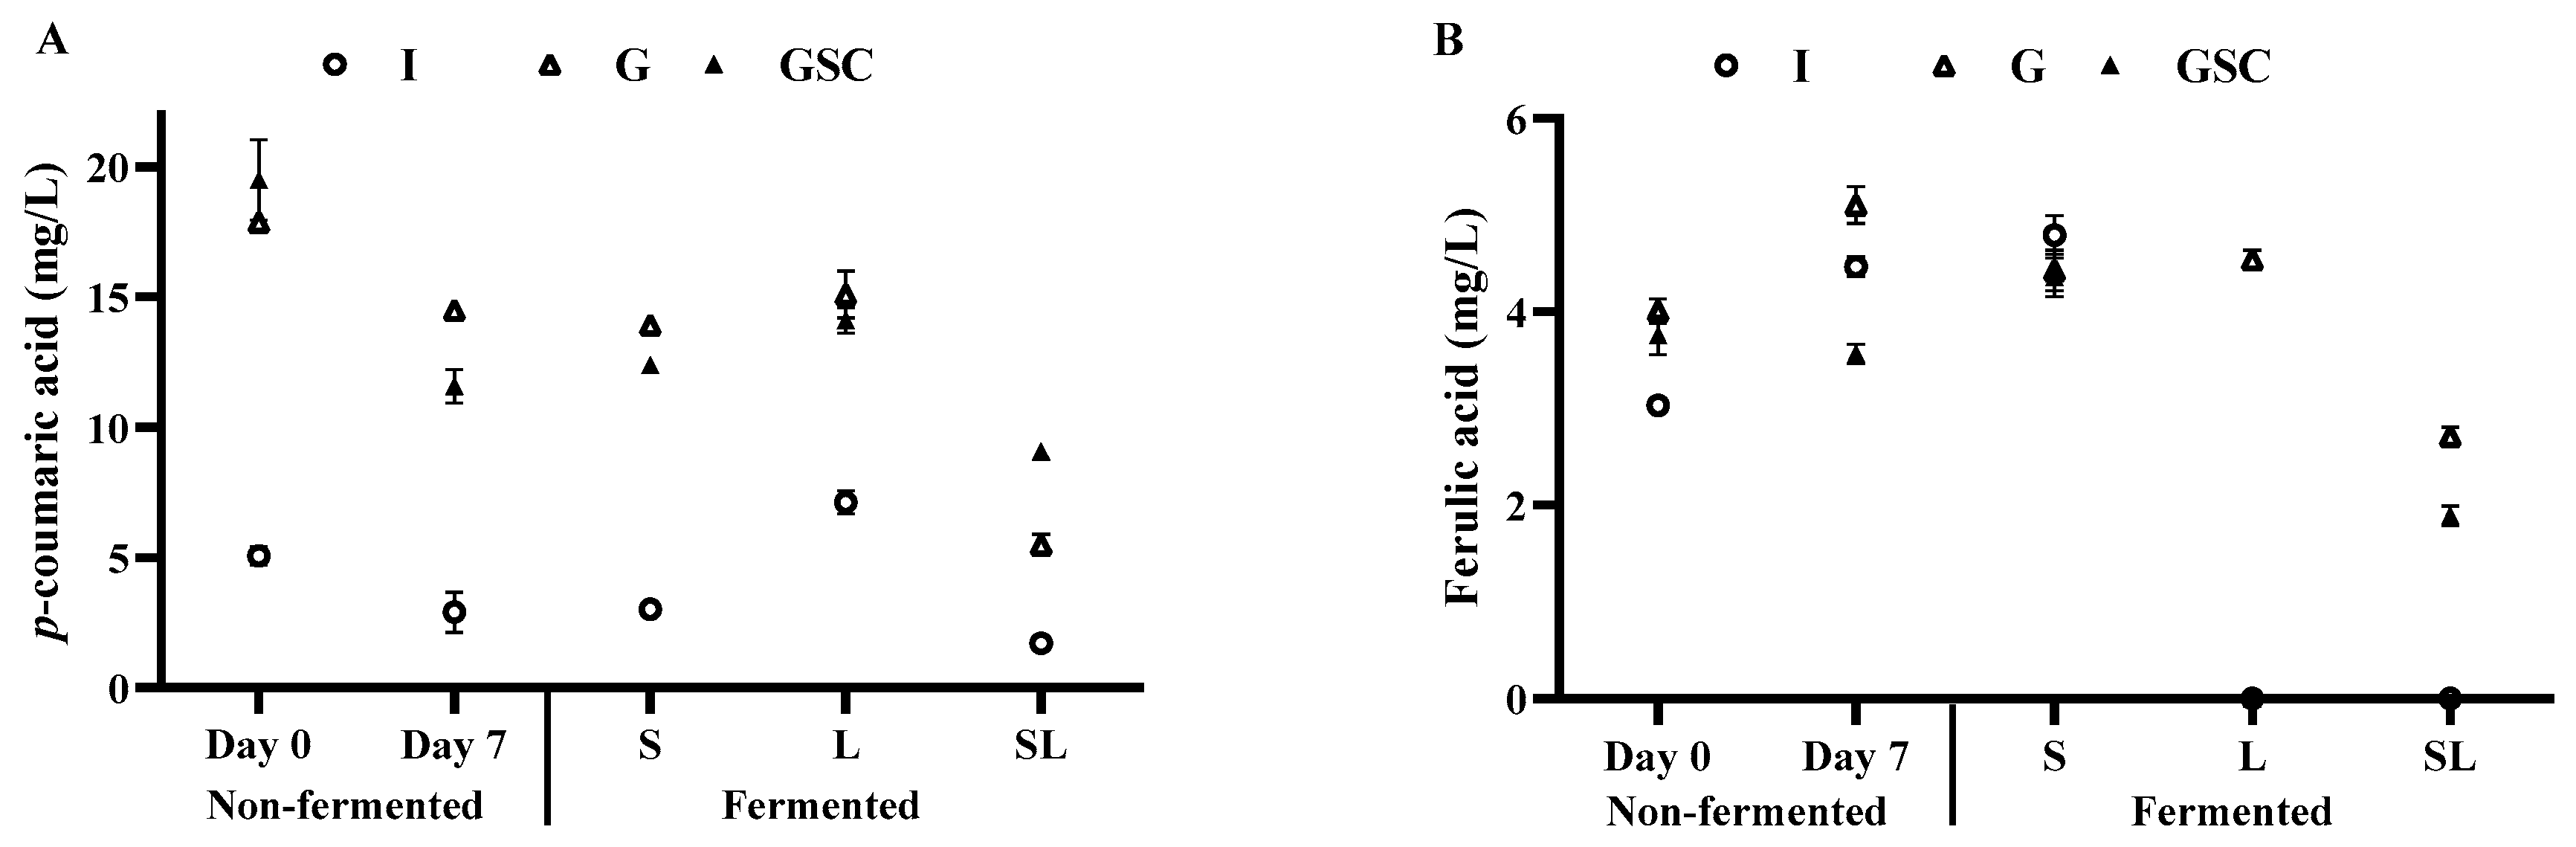
3.4. TPC, TFC, Antioxidant Activities, Caffeine, and Phenolic Constituents of SCG

SCGs were filtered from non-fermented and fermented GSC samples. The TPC, TFC, and antioxidant activities of free and bound phenolics in the initial whole coffee beans, non-fermented SCGs (days 0 and 7), and their fermented counterparts were determined, and the results are given in Figure 2.
The sum of free and bound phenolic contents of whole coffee beans was 53.90 mg GAE/g dw, and the bound phenolics (21.63 mg GAE/g dw) contributed around 40% of the total content, while free phenolics (32.27 mg GAE/g dw) contributed around 60% (Figure 2A). When those beans were ground and brewed, the SCG (day 0) still had a high amount of TPC (44.55 mg GAE/g dw), but this time the contribution of bound phenolics (28.82 mg GAE/g dw) became dominant (64.7%) due to the extraction of free phenolics during brewing. The total TPC value of SCG filtered from a 7-day stored-non-inoculated control significantly decreased (36.16 mg GAE/g dw), accompanied by a reduction in the TPC of bound phenolics (20.70 mg GAE/g dw, 57.1%) with almost constant free phenolic content (15.49 mg GAE/g dw, 42.9%) (Figure 2A). In the GSC coffees that contain SCG, the 7-day-stored non-inoculated control coffee also yielded the lowest TPC (Table 1).
The SCG filtered from the S-fermented sample had a comparable TPC (47.69 mg GAE/g dw) to the initial SCG filtered from the non-fermented sample (day 0), with free phenolics accounting for 34.4% (16.40 mg GAE/g dw) (Figure 2A). The SCG filtered from SL-fermented coffee had the lowest total TPC (32.14 mg GAE/g dw), with free phenolics accounting for 43.71% (14.04 mg GAE/g dw), comparable to the SCG filtered from the 7-day stored non-fermented control (Figure 2A). During 7 days of aerobic incubation, the extraction of soluble components from SCG and their oxidation might have continued simultaneously. The total TPC of SCGs and the contribution of free/bound fractions to the overall value varied depending on the inoculation. The S and L inoculations were more effective in maintaining the TPC of SCGs at day 0.
The contribution of bound phenolics to the TFC of whole coffee beans was around 16.6% of the total content (31.83 mg CE/g dw). When those beans were ground and brewed, in the residue (SCG), the contribution of bound phenolics became 42.6% of the total TFC (15.31 mg CE/g dw). The total TFC was not changed in the SCG filtered from the 7-day stored non-fermented control. The TFC value of bound and free phenolics also remained at similar levels in the residues of all fermented samples (Figure 2B).
In whole coffee beans, the contribution of bound phenolics to the antioxidant activity values (DPPH and FRAP) was around 30% of the total value, whereas after brewing, the bound phenolics in the residue (SCG) contributed to around 70% of the total antioxidant activity values (Figure 2C,D). The FRAP value (free + bound phenolics) of SCGs was not changed between control and inoculated samples (Figure 2D). Similar to TPC values, the DPPH value of SCG filtered from the non-fermented control (day 7) was lower than its initial counterpart (day 0), accompanied by lower antioxidant values contributed by bound phenolics (Figure 2C). Similar to the TPC values, the lowest (p < 0.05) total DPPH value (free + bound phenolics) was determined in the SCG filtered from the SL-fermented sample compared to the residues of the S and L-inoculated samples.
The phenolic constituents of free and bound phenolic fractions of whole coffee beans and SCGs filtered from GSC coffees are given in Table 2. The CQAs were detected only in the soluble/free phenolic fractions of the extracts, whereas caffeic acid was only detected in the bound fraction. The total CQA of whole coffee beans was 1945.43 mg/100 g dw. After brewing, the amount of total CQA remaining in the residue (SCG, day 0) was 534.85 mg/100 g dw, and it was significantly decreased to 351.42 mg/100 g dw in the SCG filtered from the 7-day-stored non-fermented GSC. A similar decrease of CQAs by storage was also detected in the non-fermented GSC coffee (Figure 3). Although the total CQA values of SCGs filtered from fermented GSC coffees were significantly lower than their initial concentration at day 0 (Table 2), they were all higher (401.15–445.52 mg/100 g dw) than those of SCGs filtered from the 7-day stored non-fermented GSC sample (351.42 mg/100 g dw). This might indicate that the possible degradation of phenolic acids that occurred during the 7-day storage of samples was prevented to some extent by fermentation.
The change of individual CQAs in SCGs was varied depending on the measured CQA and inoculation (Table 2). For example, compared to the SCG of the non-fermented control at day 7, the fermented samples showed no change in 3-CQA, while 4-CQA (176–241.99 mg/100 g dw) values were significantly elevated. The change of 5-CQA was dependent on the inoculation; for example, its concentration (126.43 mg/100 g dw) was about the same as the non-fermented control (day 7) when the fermentation was done by SL, whereas in other inoculations (S and L), it was much higher (around 150 mg/100 g dw) than the control (day 7).
The caffeic acid was only found in the bound fraction of beans. Its concentration remained almost unchanged after brewing but decreased from 242.23 to 198.75 mg/100 g dw in the SCG filtered from the non-fermented sample stored for one week. The SCGs of fermented samples yielded similar concentrations of caffeic acid (p > 0.05) to the non-fermented control (day 7). The p-coumaric acid was detected in both fractions, but it was higher in the free fraction, whereas ferulic acid was more abundant in the bound fraction (Table 2). Compared to the SCG of the non-fermented control (day 7), the p-coumaric acid content of the free fraction was higher in the SCGs filtered from S and L fermented samples; a similar trend was also observed in the same GSC coffees (Figure 4). The bound and free ferulic acid content in the SCGs of the non-fermented sample was decreased by storage (day 7). Compared to the non-fermented sample (day 7), the ferulic acid content of the bound fraction was not different in fermented samples, while its concentration in the free fraction was increased (p < 0.05) (Table 2).
The caffeine content of whole coffee beans was 1105.81 mg/100 g dw (Table 2). The amount of caffeine left in the SCG of the non-fermented control (day 7) was 366.41 mg/100 g dw. The concentration of caffeine in the residues (SCGs) of S, L, and SL-fermented GSC samples was 330.21, 359.00, and 255.67 mg/100 g dw, respectively. Consistent with the results of GSC coffee drinks presented in Table 1, significantly lower caffeine content (p < 0.05) was determined in the SCGs filtered from the SL-fermented sample (Table 2).

3.5. Sensory Properties of Fermented Coffee Drinks

The change in sensory scores was primarily influenced by the inoculation culture. S-fermented coffees generally scored higher, while L-fermented samples received the lowest scores across all coffee types (Figure S1). Among all groups, S-fermented G coffee received significantly higher scores. In contrast, L-fermented I coffee was rated lowest for overall acceptability and was perceived as more sour and astringent. Fermentation with L. plantarum may have imparted an overly acidic character to the beverage. These results suggest that microbial consortia like SCOBY can enhance the sensory attributes of the final product. Although volatile compounds were not analyzed in this study, sensory responses appeared to reflect differences in organic acid composition. S-fermented coffees, which contained higher levels of acetic acid but no detectable lactic acid, received higher sensory scores, especially in terms of overall acceptability and balanced sourness. In contrast, L-fermented samples, which contained lactic acid but minimal acetic acid, were perceived as excessively sour and astringent, particularly in the I group. SL-fermented samples, which contained both acids, received intermediate scores. These results suggest that the relative proportions of acetic and lactic acids may significantly influence flavor perception, possibly by modulating the perceived balance between brightness and sharpness in fermented coffee beverages. Furthermore, the reduced acceptability of L-fermented samples may also be linked to the absence of yeast-derived esters, which are known to contribute to fruity and floral aroma notes. The lack of such volatiles, combined with high lactic acid concentrations, might have intensified the perception of sourness and diminished overall flavor complexity.

4. Conclusions

This study demonstrated that coffee kombucha beverages can be successfully produced using both S and L in combination. Coffees fermented with only L were found to be less appealing. The presence of SCG in the coffee brews during fermentation reduced the growth of LAB, as well as the concentrations of acetic and lactic acid, while enhancing the phenolic compounds and antioxidant activity. The simultaneous inoculation of S and L did not exhibit synergistic effects on the production of lactic and acetic acids. The total CQA and total phenolic content of all non-fermented coffees stored under identical conditions as the fermented samples decreased, whereas this reduction was not observed in L-fermented coffees. While SL fermentation was able to maintain the total phenolic content of all samples compared to the non-fermented control, it yielded the lowest levels of individual phenolic acid constituents in the fermented samples, regardless of the substrate. However, SL fermentation generated better outcomes in reducing the caffeine content of coffee beverages and SCGs. Future studies could explore the effect of the roasting degree of coffee beans and the inoculation culture on the properties of the coffee kombucha beverages, particularly the change of coffee melanoidins and aromatic compounds.

Supplementary Materials

The following supporting information can be downloaded at: https://www.mdpi.com/article/10.3390/fermentation11080428/s1, Table S1. pH values of coffees; Table S2. Titratable acidity (TA %) of coffees; Figure S1. The sensory characteristics of coffee. I: Instant coffee drink, G: Ground coffee drink, GSC: Spent coffee added ground coffee drink S: SCOBY, L: Lactiplantibacillus plantarum ELB90, and SL: both S and L.

Author Contributions

O.S.: Investigation; Methodology; Writing—original draft; Visualization Y.G.I.: Investigation; Visualization; R.M.Y.: Methodology; Writing—original draft; Supervision. A.K.: Conceptualization; Funding acquisition; Resources; Writing—review and editing; Supervision. All authors have read and agreed to the published version of the manuscript.

Funding

This research has been supported by Yildiz Technical University scientific research projects coordination office under project number FKD-2022-5026.

Institutional Review Board Statement

The sensory analysis procedure in this study was approved by the Ethical Committee of the Yildiz Technical University Food Engineering Department (#2024.012, approval date: 16 December 2024). It was carried out in compliance with the principles set forth in the Declaration of Helsinki, and written informed consent was obtained from all participants.

Informed Consent Statement

Informed consent was obtained from all subjects involved in the study.

Data Availability Statement

The original contributions presented in this study are included in the article/Supplementary Materials. Further inquiries can be directed to the corresponding author.

Conflicts of Interest

The authors declare no conflicts of interest.

References

  1. Harrison, K.; Curtin, C. Microbial Composition of SCOBY Starter Cultures Used by Commercial Kombucha Brewers in North America. Microorganisms 2021, 9, 1060. [Google Scholar] [CrossRef]
  2. Tran, T.; Grandvalet, C.; Verdier, F.; Martin, A.; Alexandre, H.; Tourdot-Maréchal, R. Microbial Dynamics between Yeasts and Acetic Acid Bacteria in Kombucha: Impacts on the Chemical Composition of the Beverage. Foods 2020, 9, 963. [Google Scholar] [CrossRef]
  3. Liu, Y.; Zheng, Y.; Yang, T.; Mac Regenstein, J.; Zhou, P. Functional Properties and Sensory Characteristics of Kombucha Analogs Prepared with Alternative Materials. Trends Food Sci. Technol. 2022, 129, 608–616. [Google Scholar] [CrossRef]
  4. Sanwal, N.; Gupta, A.; Bareen, M.A.; Sharma, N.; Sahu, J.K. Kombucha Fermentation: Recent Trends in Process Dynamics, Functional Bioactivities, Toxicity Management, and Potential Applications. Food Chem. Adv. 2023, 3, 100421. [Google Scholar] [CrossRef]
  5. Freitas, A.; Sousa, P.; Wurlitzer, N. Alternative Raw Materials in Kombucha Production. Int. J. Gastron. Food Sci. 2022, 30, 100594. [Google Scholar] [CrossRef]
  6. Wu, H.; Gu, J.; BK, A.; Nawaz, M.A.; Barrow, C.J.; Dunshea, F.R.; Suleria, H.A.R. Effect of Processing on Bioaccessibility and Bioavailability of Bioactive Compounds in Coffee Beans. Food Biosci. 2022, 46, 101373. [Google Scholar] [CrossRef]
  7. Min, J.; Cao, Z.; Cui, L.; Li, F.; Lu, Z.; Hou, Y.; Yang, H.; Wang, X.; Xu, C. The Association between Coffee Consumption and Risk of Incident Depression and Anxiety: Exploring the Benefits of Moderate Intake. Psychiatry Res. 2023, 326, 115307. [Google Scholar] [CrossRef] [PubMed]
  8. Monente, C.; Ludwig, I.A.; Irigoyen, A.; De Peña, M.-P.; Cid, C. Assessment of Total (Free and Bound) Phenolic Compounds in Spent Coffee Extracts. J. Agric. Food Chem. 2015, 63, 4327–4334. [Google Scholar] [CrossRef] [PubMed]
  9. da Silveira, J.S.; Mertz, C.; Morel, G.; Lacour, S.; Belleville, M.-P.; Durand, N.; Dornier, M. Alcoholic Fermentation as a Potential Tool for Coffee Pulp Detoxification and Reuse: Analysis of Phenolic Composition and Caffeine Content by HPLC-DAD-MS/MS. Food Chem. 2020, 319, 126600. [Google Scholar] [CrossRef]
  10. Santos da Silveira, J.; Durand, N.; Lacour, S.; Belleville, M.-P.; Perez, A.; Loiseau, G.; Dornier, M. Solid-State Fermentation as a Sustainable Method for Coffee Pulp Treatment and Production of an Extract Rich in Chlorogenic Acids. Food Bioprod. Process. 2019, 115, 175–184. [Google Scholar] [CrossRef]
  11. Milić, M.D.; Buntić, A.V.; Mihajlovski, K.R.; Ilić, N.V.; Davidović, S.Z.; Dimitrijević-Branković, S.I. The Development of a Combined Enzymatic and Microbial Fermentation as a Viable Technology for the Spent Coffee Ground Full Utilization. Biomass Convers. Biorefinery 2023, 13, 6747–6759. [Google Scholar] [CrossRef]
  12. Chan, M.Z.A.; Liu, S.-Q. Coffee Brews as Food Matrices for Delivering Probiotics: Opportunities, Challenges, and Potential Health Benefits. Trends Food Sci. Technol. 2022, 119, 227–242. [Google Scholar] [CrossRef]
  13. Bueno, F.; Chouljenko, A.; Sathivel, S. Development of Coffee Kombucha Containing Lactobacillus rhamnosus and Lactobacillus casei: Gastrointestinal Simulations and DNA Microbial Analysis. LWT 2021, 142, 110980. [Google Scholar] [CrossRef]
  14. Ferreira de Miranda, J.; Martins Pereira Belo, G.; Silva de Lima, L.; Alencar Silva, K.; Matsue Uekane, T.; Gonçalves Martins Gonzalez, A.; Naciuk Castelo Branco, V.; Souza Pitangui, N.; Freitas Fernandes, F.; Ribeiro Lima, A. Arabic Coffee Infusion Based Kombucha: Characterization and Biological Activity during Fermentation, and in Vivo Toxicity. Food Chem. 2023, 412, 135556. [Google Scholar] [CrossRef]
  15. Pavlović, M.O.; Stajić, M.; Gašić, U.; Duletić-Laušević, S.; Ćilerdžić, J. The Chemical Profiling and Assessment of Antioxidative, Antidiabetic and Antineurodegenerative Potential of Kombucha Fermented Camellia sinensis, Coffea arabica and Ganoderma lucidum Extracts. Food Funct. 2023, 14, 262–276. [Google Scholar] [CrossRef]
  16. Watawana, M.I.; Jayawardena, N.; Waisundara, V.Y. Enhancement of the Functional Properties of Coffee Through Fermentation by “Tea Fungus” (Kombucha). J. Food Process. Preserv. 2015, 39, 2596–2603. [Google Scholar] [CrossRef]
  17. Zofia, N.-Ł.; Aleksandra, Z.; Tomasz, B.; Martyna, Z.-D.; Magdalena, Z.; Zofia, H.-B.; Tomasz, W. Effect of Fermentation Time on Antioxidant and Anti-Ageing Properties of Green Coffee Kombucha Ferments. Molecules 2020, 25, 5394. [Google Scholar] [CrossRef]
  18. Fibrianto, K.; Zubaidah, E.; Muliandari, N.A.; Wahibah, L.Y.; Putri, S.D.; Legowo, A.M.; Al-Baarri, A.N. Antioxidant Activity Optimisation of Young Robusta Coffee Leaf Kombucha by Modifying Fermentation Time and Withering Pre-Treatment. IOP Conf. Ser. Earth Environ. Sci. 2020, 475, 12029. [Google Scholar] [CrossRef]
  19. Zubaidah, E.; Iastika, A.R.; Widyaningsih, T.D.; Febrianto, K. Immunomodulatory Activity of Black Tea Kombucha (Camellia sinensis) and Arabica Coffee Leaves Tea Kombucha (Coffee arabica) for Salmonella Typhi-Infected Mice. IOP Conf. Ser. Earth Environ. Sci. 2021, 733, 12128. [Google Scholar] [CrossRef]
  20. Muzaifa, M.; Andini, R.; Sulaiman, M.I.; Abubakar, Y.; Rahmi, F. Nurzainura Novel Utilization of Coffee Processing By-Products: Kombucha Cascara Originated from ‘Gayo-Arabica’. IOP Conf. Ser. Earth Environ. Sci. 2021, 644, 12048. [Google Scholar] [CrossRef]
  21. Yildirim, R.M.; Arici, M. Effect of the Fermentation Temperature on the Degradation of Phytic Acid in Whole-Wheat Sourdough Bread. LWT 2019, 112, 108224. [Google Scholar] [CrossRef]
  22. Jayabalan, R.; Malbaša, R.V.; Lončar, E.S.; Vitas, J.S.; Sathishkumar, M. A Review on Kombucha Tea—Microbiology, Composition, Fermentation, Beneficial Effects, Toxicity, and Tea Fungus. Compr. Rev. Food Sci. Food Saf. 2014, 13, 538–550. [Google Scholar] [CrossRef] [PubMed]
  23. Karadag, A.; Bozkurt, F.; Bekiroglu, H.; Sagdic, O. Use of Principal Component Analysis and Cluster Analysis for Differentiation of Traditionally-Manufactured Vinegars Based on Phenolic and Volatile Profiles, and Antioxidant Activity. Pol. J. Food Nutr. Sci. 2020, 70, 347–360. [Google Scholar] [CrossRef]
  24. Ozkan, K.; Karadag, A.; Sagdic, O.; Ozcan, F.S.; Ozer, H. The Effects of Different Drying Methods on the Sugar, Organic Acid, Volatile Composition, and Textural Properties of Black ‘Isabel’ Grape. J. Food Meas. Charact. 2023, 17, 1852–1861. [Google Scholar] [CrossRef]
  25. Wu, H.; Lu, P.; Liu, Z.; Sharifi-Rad, J.; Suleria, H.A.R. Impact of Roasting on the Phenolic and Volatile Compounds in Coffee Beans. Food Sci. Nutr. 2022, 10, 2408–2425. [Google Scholar] [CrossRef]
  26. de Almeida, S.S.; da Costa, G.B.M.; Barreto, M.S.; Freire, D.M.G.; Lobo, L.A.; Domingues, R.M.C.P.; Moura-Nunes, N.; Monteiro, M.; Perrone, D. Bioaccessibility and Gut Metabolism of Phenolic Compounds of Breads Added with Green Coffee Infusion and Enzymatically Bioprocessed. Food Chem. 2020, 333, 127473. [Google Scholar] [CrossRef]
  27. Yener, E.; Saroglu, O.; Sagdic, O.; Karadag, A. The Effects of Different Drying Methods on the In Vitro Bioaccessibility of Phenolics, Antioxidant Capacity, and Morphology of European Plums (Prunes domestica L.). ACS Omega 2024, 9, 12711–12724. [Google Scholar] [CrossRef]
  28. Ozcan, B.E.; Saroglu, O.; Karakas, C.Y.; Karadag, A. Encapsulation of Purple Basil Leaf Extract by Electrospraying in Double Emulsion (W/O/W) Filled Alginate-Carrageenan Beads to Improve the Bioaccessibility of Anthocyanins. Int. J. Biol. Macromol. 2023, 250, 126207. [Google Scholar] [CrossRef]
  29. Zhi, R.; Zhao, L.; Shi, J. Improving the Sensory Quality of Flavored Liquid Milk by Engaging Sensory Analysis and Consumer Preference. J. Dairy Sci. 2016, 99, 5305–5317. [Google Scholar] [CrossRef]
  30. Nyhan, L.M.; Lynch, K.M.; Sahin, A.W.; Arendt, E.K. Advances in Kombucha Tea Fermentation: A Review. Appl. Microbiol. 2022, 2, 73–103. [Google Scholar] [CrossRef]
  31. Bellumori, M.; Angeloni, G.; Guerrini, L.; Masella, P.; Calamai, L.; Mulinacci, N.; Parenti, A.; Innocenti, M. Effects of Different Stabilization Techniques on the Shelf Life of Cold Brew Coffee: Chemical Composition, Flavor Profile and Microbiological Analysis. LWT 2021, 142, 111043. [Google Scholar] [CrossRef]
  32. Andreson, M.; Kazantseva, J.; Kuldjärv, R.; Malv, E.; Vaikma, H.; Kaleda, A.; Kütt, M.-L.; Vilu, R. Characterisation of Chemical, Microbial and Sensory Profiles of Commercial Kombuchas. Int. J. Food Microbiol. 2022, 373, 109715. [Google Scholar] [CrossRef]
  33. Bishop, P.; Pitts, E.R.; Budner, D.; Thompson-Witrick, K.A. Kombucha: Biochemical and Microbiological Impacts on the Chemical and Flavor Profile. Food Chem. Adv. 2022, 1, 100025. [Google Scholar] [CrossRef]
  34. Barbosa, C.D.; Trovatti Uetanabaro, A.P.; Rodrigues Santos, W.C.; Caetano, R.G.; Albano, H.; Kato, R.; Cosenza, G.P.; Azeredo, A.; Góes-Neto, A.; Rosa, C.A.; et al. Microbial–Physicochemical Integrated Analysis of Kombucha Fermentation. LWT 2021, 148, 111788. [Google Scholar] [CrossRef]
  35. Jayabalan, R.; Marimuthu, S.; Swaminathan, K. Changes in Content of Organic Acids and Tea Polyphenols during Kombucha Tea Fermentation. Food Chem. 2007, 102, 392–398. [Google Scholar] [CrossRef]
  36. Coton, M.; Pawtowski, A.; Taminiau, B.; Burgaud, G.; Deniel, F.; Coulloumme-Labarthe, L.; Fall, A.; Daube, G.; Coton, E. Unraveling Microbial Ecology of Industrial-Scale Kombucha Fermentations by Metabarcoding and Culture-Based Methods. FEMS Microbiol. Ecol. 2017, 93, 48. [Google Scholar] [CrossRef]
  37. Marsh, A.J.; O’Sullivan, O.; Hill, C.; Ross, R.P.; Cotter, P.D. Sequence-Based Analysis of the Bacterial and Fungal Compositions of Multiple Kombucha (Tea Fungus) Samples. Food Microbiol. 2014, 38, 171–178. [Google Scholar] [CrossRef]
  38. Xia, M.; Zhang, X.; Xiao, Y.; Sheng, Q.; Tu, L.; Chen, F.; Yan, Y.; Zheng, Y.; Wang, M. Interaction of Acetic Acid Bacteria and Lactic Acid Bacteria in Multispecies Solid-State Fermentation of Traditional Chinese Cereal Vinegar. Front. Microbiol. 2022, 13, 964855. [Google Scholar] [CrossRef]
  39. Gobbetti, M. The Sourdough Microflora: Interactions of Lactic Acid Bacteria and Yeasts. Trends Food Sci. Technol. 1998, 9, 267–274. [Google Scholar] [CrossRef]
  40. Stadie, J.; Gulitz, A.; Ehrmann, M.A.; Vogel, R.F. Metabolic Activity and Symbiotic Interactions of Lactic Acid Bacteria and Yeasts Isolated from Water Kefir. Food Microbiol. 2013, 35, 92–98. [Google Scholar] [CrossRef]
  41. Canon, F.; Nidelet, T.; Guédon, E.; Thierry, A.; Gagnaire, V. Understanding the Mechanisms of Positive Microbial Interactions That Benefit Lactic Acid Bacteria Co-Cultures. Front. Microbiol. 2020, 11, 2088. [Google Scholar] [CrossRef]
  42. Anese, M.; Nicoli, M.C. Antioxidant Properties of Ready-to-Drink Coffee Brews. J. Agric. Food Chem. 2003, 51, 942–946. [Google Scholar] [CrossRef] [PubMed]
  43. Vignoli, J.A.; Bassoli, D.G.; Benassi, M.T. Antioxidant Activity, Polyphenols, Caffeine and Melanoidins in Soluble Coffee: The Influence of Processing Conditions and Raw Material. Food Chem. 2011, 124, 863–868. [Google Scholar] [CrossRef]
  44. Perrone, D.; Farah, A.; Donangelo, C.M. Influence of Coffee Roasting on the Incorporation of Phenolic Compounds into Melanoidins and Their Relationship with Antioxidant Activity of the Brew. J. Agric. Food Chem. 2012, 60, 4265–4275. [Google Scholar] [CrossRef] [PubMed]
  45. Karadag, A.; Ozcelik, B.; Saner, S. Review of Methods to Determine Antioxidant Capacities. Food Anal. Methods 2009, 2, 41–60. [Google Scholar] [CrossRef]
  46. Ashihara, H.; Crozier, A. Caffeine: A Well Known but Little Mentioned Compound in Plant Science. Trends Plant Sci. 2001, 6, 407–413. [Google Scholar] [CrossRef]
  47. Purwoko, T.; Suranto; Setyaningsih, R.; Marliyana, S.D. Chlorogenic Acid and Caffeine Content of Fermented Robusta Bean. Biodiversitas 2022, 23, 902–906. [Google Scholar] [CrossRef]
  48. Wang, X.; Wan, X.; Hu, S.; Pan, C. Study on the Increase Mechanism of the Caffeine Content during the Fermentation of Tea with Microorganisms. Food Chem. 2008, 107, 1086–1091. [Google Scholar] [CrossRef]
  49. Kučera, L.; Papoušek, R.; Kurka, O.; Barták, P.; Bednář, P. Study of Composition of Espresso Coffee Prepared from Various Roast Degrees of Coffea arabica L. Coffee Beans. Food Chem. 2016, 199, 727–735. [Google Scholar] [CrossRef]
  50. Farah, A.; Donangelo, C.M. Phenolic Compounds in Coffee. Braz. J. Plant Physiol. 2006, 18, 23–36. [Google Scholar] [CrossRef]
  51. Macheiner, L.; Schmidt, A.; Mayer, H.K. A Novel Basis for Monitoring the Coffee Roasting Process: Isomerization Reactions of 3-Caffeoylquinic and 4-Caffeoylquinic Acids. LWT 2021, 152, 112343. [Google Scholar] [CrossRef]
  52. Farah, A.; de Paulis, T.; Trugo, L.C.; Martin, P.R. Effect of Roasting on the Formation of Chlorogenic Acid Lactones in Coffee. J. Agric. Food Chem. 2005, 53, 1505–1513. [Google Scholar] [CrossRef] [PubMed]
  53. Filannino, P.; Di Cagno, R.; Gobbetti, M. Metabolic and Functional Paths of Lactic Acid Bacteria in Plant Foods: Get out of the Labyrinth. Curr. Opin. Biotechnol. 2018, 49, 64–72. [Google Scholar] [CrossRef] [PubMed]
  54. Maksimowski, D.; Oziembłowski, M.; Kolniak-Ostek, J.; Stach, M.; Zubaidi, M.A.; Nawirska-Olszańska, A. Effect of Cold Brew Coffee Storage in Industrial Production on the Physical-Chemical Characteristics of Final Product. Foods 2023, 12, 3840. [Google Scholar] [CrossRef] [PubMed]
Figure 1. Microbial counts of lactic acid bacteria (LAB), acetic acid bacteria (AAB), and yeasts in fermented coffee drinks. I: Instant coffee drink, G: Ground coffee drink, GSC: Spent coffee added ground coffee drink S: SCOBY, L: Lactiplantibacillus plantarum ELB90, and SL: both S and L. Different letters (a–c) indicate significant differences (p < 0.05) among the samples (S, L, and SL fermented samples) within each coffee drink group (I, G, and GSC). Different letters (x–z) indicate significant differences (p < 0.05) among the coffee drink groups (I, G, and GSC) within S, L, and SL fermented samples.
Fermentation 11 00428 g001
Figure 2. The change of total phenolic content (TPC) (A), total flavonoid content (TFC) (B) and DPPH (C), and FRAP (D) antioxidant activities of whole coffee beans, non-fermented and fermented spent coffee grounds (SCG). SCG separated from non-fermented GSC (Spent coffee added ground coffee drink) at day 0 and day 7, and S (SCOBY), L (Lactiplantibacillus plantarum ELB90), and SL (both S and L) fermented GSC drinks. The percentage (%) above graphs denotes the contribution of free phenolics to the total measured values. Different uppercase letters (A–D) indicate the significant differences (p < 0.05) among the total values. Different lowercase letters (a,b) and (x–z) indicate significant differences (p < 0.05) among the values measured for free and bound phenolic fractions, respectively.
Fermentation 11 00428 g002
Figure 3. Caffeoylquinic acids (3-CQA) (A), 4-CQA (B), 5-CQA (C), and total CQA (D) contents of coffee drinks. I: Instant coffee drink, G: Ground coffee drink, GSC: Spent coffee added ground coffee drink, S: SCOBY, L: Lactiplantibacillus plantarum ELB90, and SL: both S and L.
Fermentation 11 00428 g003
Figure 4. p-coumaric acid (A) and ferulic acid (B) contents of coffee drinks. I: Instant coffee drink, G: Ground coffee drink, GSC: Spent coffee added ground coffee drink, S: SCOBY, L: Lactiplantibacillus plantarum ELB90, and SL: both S and L.
Fermentation 11 00428 g004
Table 1. The contents of acetic acid, lactic acid, caffeine, TPC, TFC, and antioxidant activities (DPPH, FRAP) of coffee drinks.
IGGSC
Non-FermentedFermentedNon-FermentedFermentedNon-FermentedFermented
UnitDay 0Day 7SLSLDay 0Day 7SLSLDay 0Day 7SLSL
Acetic Acidmg/L--1425.26 ± 15.93 a,x193.22 ± 4.82 c,y1314.43 ± 39.61 b,y--1493.02 ± 13.67 b,x336.98 ± 25.72 c,x1683.53 ± 64.18 a,x--1488.34 ± 117.66 a,x241.85 ± 0.74 c,y1399.13 ± 23.25 b,y
Lactic Acid--nd583.31 ± 5.84 a,x378.69 ± 70.45 b,y--nd502.44 ± 12.47 b,xy584.62 ± 92.48 a,x--nd448.74 ± 16.45 a,y320.67 ± 31.66 b,y
Caffeine961.1 ± 40.18 b,y1058.55 ± 70.09 a,x941.70 ± 4.27 b,z841.41 ± 0.72 c,z883.08 ± 0.11 bc,x1137.72 ± 13.76 a,x1022.83 ± 6.8 b,xy1176.50 ± 9.39 a,x1137.14 ± 44.59 a,y754.66 ± 1.33 c,y1087.72 ± 51.62 b,x967.0 ± 39.58 c,y1102.2 ± 25.67 b,y1226.82 ± 41.06 a,x733.39 ± 6.92 d,y
TPCmg
GAE/mL
2.54 ± 0.47 a,y1.18 ± 0.03 b,x1.31 ± 0.11 b,y1.06 ± 0.23 b,z2.30 ± 0.14 a,x2.48 ± 0.26 ab,y1.14 ± 0.13 c,x1.58 ± 0.15 c,y2.10 ± 0.20 b,y2.70 ± 0.13 a,x3.27 ± 0.11 a,x1.15 ± 0.04 c,x2.30 ± 0.14 b,x2.92 ± 0.21 a,x2.39 ± 0.15 b,x
TFCmg
CE/mL
2.16 ± 0.04 b,y2.05 ± 0.06 b,y2.17 ± 0.07 b,x2.58 ± 0.17 a,y2.21 ± 0.08 b,x2.56 ± 0.02 a,x2.30 ± 0.17 ab,xy2.03 ± 0.05 b,x2.32 ± 0.07 ab,y2.20 ± 0.04 b,x2.69 ± 0.05 b,x2.31 ± 0.0 c,x2.15 ± 0.11 c,x3.22 ± 0.36 a,x1.71 ± 0.08 d,y
DPPHmg
TE/mL
3.43 ± 0.05 a,y3.43 ± 0.11 a,y3.06 ± 0.21 a,z2.30 ± 0.17 b,y3.20 ± 0.21 a,y2.57 ± 0.14 cd,z3.26 ± 0.03 b,y4.06 ± 0.36 a,y2.36 ± 0.39 d,y3.12 ± 0.06 bc,y11.50 ± 0.14 a,x8.78 ± 0.52 b,x7.24 ± 0.10 c,x7.74 ± 0.40 c,x8.93 ± 0.31 b,x
FRAP3.52 ± 0.07 bc,y2.89 ± 0.07 c,y4.54 ± 0.22 a,y4.47 ± 0.35 a,x4.24 ± 0.40 ab,y4.71 ± 0.51 ab,x3.75 ± 0.10 c,x5.31 ± 0.68 a,x3.58 ± 0.07 c,y4.17 ± 0.10 bc,y4.20 ± 0.16 b,x3.31 ± 0.35 c,xy4.73 ± 0.57 ab,xy4.85 ± 0.07 ab,x5.01 ± 0.18 a,x
I: Instant coffee drink, G: Ground coffee drink, GSC: Spent coffee added ground coffee drink S: SCOBY, L: Lactiplantibacillus plantarum ELB90, and SL: both S and L. Different letters (a–d) indicate significant differences (p < 0.05) among the samples (day 0 and day 7, S, L, and SL fermented samples) within each coffee drink group (I, G, and GSC). Different letters (x–z) indicate significant differences (p < 0.05) among the coffee drink groups (I, G, and GSC) within S, L, and SL fermented samples. TPC: Total phenolic content, TFC: Total flavonoid content, DPPH: 2,2-Diphenyl-1- picrylhydrazyl, FRAP: Ferric reducing antioxidant power, GAE: Gallic acid equivalent, CE: Catechin equivalent, TE: Trolox equivalent, nd: Not detected.
Table 2. Phenolic constituents of whole coffee beans and non-fermented and fermented spent coffee grounds (SCG).
Samples5-CQA4-CQA3-CQATotal CQACaffeic AcidFerulic Acidp-Coumaric AcidCaffeine
FBFBFBFBFBFBFB
Coffee beans549.45 ± 9.78nd978.30 ± 5.14nd417.68 ± 4.81nd1945.43 ± 9.45ndnd213.15 ± 35.7411.74 ± 1.1925.74 ± 2.6811.98 ± 1.362.71 ± 0.681105.81 ± 32.95
Non-fermented SCGday 0195.81 ± 8.58 and233.14 ± 8.14 and105.90 ± 4.30 and534.85 ± 21.02 andnd242.23 ± 1.33 a1.52 ± 0.07 bc33.50 ± 0.78 a11.89 ± 0.51 bc3.84 ± 0.04 a271.26 ± 34.26 b
day 7130.78 ± 10.49 c147.76 ± 9.50 d72.88 ± 5.58 b351.42 ± 14.76 c198.75 ± 1.07 b0.82 ± 0.14 c25.65 ± 0.78 b10.65 ± 0.86 c2.41 ± 0.02 c366.41 ± 25.96 a
Fermented
SCG
S154.72 ± 5.93 b200.93 ± 9.35 b73.85 ± 3.24 b429.49 ± 18.52 b184.96 ± 3.54 b4.88 ± 0.17 a23.63 ± 1.69 b14.35 ± 0.41 a2.26 ± 0.20 c330.21 ± 12.22 a
L151.48 ± 2.53 b176.00 ± 12.49 c73.66 ± 1.55 b401.15 ± 16.57 bc196.97 ± 3.89 b1.96 ± 0.43 b26.45 ± 0.58 b12.51 ± 0.34 b3.27 ± 0.37 b359.00 ± 6.44 a
SL126.43 ± 7.25 c241.99 ± 2.69 a77.10 ± 2.63 b445.52 ± 12.56 b201.70 ± 19.02 b4.86 ± 0.63 a28.17 ± 3.18 b11.82 ± 0.35 bc2.63 ± 0.19 c255.67 ± 5.76 b
Results are expressed in mg/100 g dry weight. SCG separated from non-fermented GSC (Spent coffee added ground coffee drink) at day 0 and day 7, and S (SCOBY), L (Lactiplantibacillus plantarum ELB90), and SL (both S and L) fermented GSC drinks. Different letters within the same column are significantly different (p < 0.05). F: Free phenolics, B: Bound phenolics, CQA: Caffeoylquinic acid, SCG: Spent coffee grounds, nd: Not detected.
Disclaimer/Publisher’s Note: The statements, opinions and data contained in all publications are solely those of the individual author(s) and contributor(s) and not of MDPI and/or the editor(s). MDPI and/or the editor(s) disclaim responsibility for any injury to people or property resulting from any ideas, methods, instructions or products referred to in the content.

