Abstract
Coenzyme Q10 (CoQ10) has attracted widespread attention in recent years due to its momentous physiological functions. Microbial fermentation is the major method in CoQ10 industrial production, and Rhodobacter sphaeroides is the main strain for the production of CoQ10 by fermentation. Optimization of the culture medium is a popular solution to improve the metabolite production. Culture medium is the material basis for microbial growth and product synthesis, of which inorganic salts are a key ingredient. Uniform design (UD), artificial neural network (ANN), and genetic algorithm (GA) are the main research methods. Through uniform design (UD) and artificial neural network/genetic algorithm (ANN-GA) progressive optimization, an optimal formulation of the inorganic salts in fermentation medium was obtained (g·L−1): MgSO4 12, NaCl 2.5, FeSO4 1.6, KH2PO4 0.8, MnSO4 0.1, CaCl2 0.1. Ultimately, the fermentation yield of CoQ10 could reach 255.36 mg·L−1. ANN-GA exhibited a superior prediction capability compared to UD. Compared to UD, the optimization results of ANN-GA had a smaller relative error (ANN-GA 1.23%; UD 3.01%) and a higher increase rate in the fermentation level of CoQ10 (ANN-GA 4.1%; UD 2.04%). R. sphaeroides had a high demand for Mg2+.
1. Introduction
Coenzyme Q (CoQ) is a quinone compound formed by the conjugation of a redox-active benzoquinone group with a lipophilic polyisoprene chain. The number of its isoprene repeat units varies among species: CoQ6 (e.g., Saccharomyces cerevisiae), CoQ8 (e.g., Escherichia coli), CoQ9 (e.g., Mus musculus, Arabidopsis thaliana, rice), and CoQ10 (e.g., Homo sapiens, Schizosaccharomyces pombe, soybean, tomato) [1,2]. CoQ10 (Figure 1) in the human body exists predominantly as the reduced form (more than 90%) and the oxidized form, continuously transforming into each other [3]. The oxidized form of CoQ10 receives electrons from respiratory chain complexes I and II to become the reduced form, and then releases electrons at complex III to become the oxidized form. Each CoQ10 molecule undergoes approximately 5000 such redox cycles per hour, which is involved in the production of adenosine triphosphate (ATP) through electron transfer [4]. Although CoQ10 is the only lipid-soluble antioxidant synthesized endogenously, its levels gradually decline with age. It is present in a variety of foods such as meats, fish, and vegetable oils, which serve as a dietary source for human intake of CoQ10 [5,6]. Insufficient levels of CoQ10 weaken the antioxidant capacity of cells, making it challenging to detoxify reactive oxygen species (ROS) and leading to oxidative stress (OS), and CoQ10’s antioxidant properties can protect organelles and biomolecules (e.g., DNA, proteins, lipids) from OS damage [7,8]. CoQ10 supplementation can help alleviate the problem. CoQ10 is also indispensable for the skin, as it mitigates OS damage caused by UV rays, inhibits matrix metalloproteinase (MMP) and tyrosinase activity, stimulates the expression of collagen and elastin, as well as the synthesis of hyaluronic acid (HA) [9,10,11,12]. Due to its remarkable physiological functions, there is a great demand for CoQ10 in the field of medicine and cosmetics. Therefore, obtaining CoQ10 efficiently, economically, and safely has become a hotspot in biotechnology research.

Figure 1.
Comparison of the chemical structure of CoQ10 in oxidized and reduced forms.
Microbial fermentation has become the preferred method for obtaining CoQ10 due to its environmental friendliness, the availability of a wide range of inexpensive raw materials, rapid microbial growth, synthesis of biologically active all-trans configurations, and a high degree of safety of the product. Rhodobacter sphaeroides is one of the microorganisms capable of synthesizing CoQ10 naturally and has been widely applied in industrial production [13,14,15]. R. sphaeroides (alpha-proteobacterium) belongs to the purple non-sulfur bacterium (PNSB) among the photosynthetic bacteria; it exhibits high metabolic diversity and is capable of autotrophic or heterotrophic growth under aerobic, anaerobic, light, or dark conditions [16]. R. sphaeroides is a non-pathogenic Gram-negative bacterium with non-toxic lipid A in its lipopolysaccharide (LPS) [17]. It is vital to assess the biosafety of R. sphaeroides to support its widespread application. As a promising and multifunctional tool, PNSB is capable of performing various tasks including the following: (1) synthesis of high-value products (e.g., CoQ10, single-cell protein, carotenoids, H2, vitamins, plant growth-promoting substances, bacteriochlorophyll, nanoparticles, 5-aminolevulinic acid, polyhydroxyalkanoates); (2) environmental remediation and resource recovery; (3) bioelectricity generation; (4) fixation of CO2 and N2; (5) quality microbial fertilizer or feed [18,19,20].
Culture medium is the material basis for microbial growth and product synthesis, of which inorganic salt is an essential ingredient. Inorganic ions play an irreplaceable role in cellular metabolism, many of which act as cofactors for enzymes and are involved in various biochemical reactions. Mg2+ is involved in the activation of enzymes and regulation of energy metabolism, and exogenous addition of appropriate concentrations of Mg2+ can enhance the production of biomass and ATP in R. sphaeroides [21]. A considerable amount of Mg2+ binds to ATP within the cell, and rRNA/ribosomes also need Mg2+ for their biological activities [22]. Fe2+ is involved in the composition of the Fe-S cluster and can regulate its genes; it also affects the activity of dehydrogenase, and exogenous addition of appropriate concentrations of Fe2+ can also enhance the production of biomass and ATP in R. sphaeroides [23,24,25]. A certain concentration of Ca2+ can trigger OS, exerting a stressful effect on R. sphaeroides, and this may stimulate it to synthesize more CoQ10 [26]. Mn2+ is needed for the 3-octaprenyl-4-hydroxybenzoate carboxy-lyase of the CoQ10 biosynthesis pathway [27]. Phosphate regulates the synthesis of CoQ10 in R. sphaeroides; phosphorus is a nutrient required for the synthesis of phospholipids and nucleotides [28]. SO42− is commonly utilized as an inorganic sulfur source in microbial cultivation, and sulfur is a constituent element of some proteins and amino acids [29]. Additionally, K+, Na+, Mg2+, Ca2+, and Cl- are involved in bacterial cell membrane osmotic pressure regulation and electrolyte homeostasis. The aim of this research is to optimize the inorganic salts in the fermentation medium to maximize the yield of CoQ10 by R. sphaeroides.
Optimization of the culture medium is a popular solution to improve metabolite production. The maximum product yield can be attained by optimization to determine the suitable medium components and fermentation parameters. Experimental design and optimization avenues include Plackett–Burman design (PBD), Taguchi design, central composite design (CCD), Box–Behnken design, response surface methodology (RSM), artificial neural network (ANN), genetic algorithm (GA), Nelder–Mead simplex (NM), particle swarm optimization (PSO), support vector machines (SVM), and stimulated annealing (SA), etc. [30,31]. Tian et al. employed RSM to optimize the culture medium for the synthesis of CoQ10 by Rhodospirillum rubrum, elevating the titer of CoQ10 to 9.76 mg·L−1 [32]. Uniform design (UD) was originally proposed by Kaitai Fang and Yuan Wang in 1978, and its basic idea was to arrange the test points at a uniform distribution within a given scope [33]. UD can greatly reduce the number of experiments. ANN is an optimized model inspired by the information processing of the human nervous system. It is non-linear, non-limitative, non-qualitative (self-adaptive, self-organizing, self-learning ability), and non-convex [34]. GA is an optimization technique that mimics the biological evolution process and is based on the principles of natural selection (survival of the fittest) and genetics. Researchers routinely couple ANN and GA (ANN-GA) to achieve better optimization results. Bajpai et al. employed ANN-GA to optimize the culture medium for the synthesis of CoQ10 by Pseudomonas diminuta, using carrot juice as a natural precursor, raising the titer of CoQ10 to 34.4 mg·L−1 [35]. In this research, single-factor experimentation, UD, and ANN-GA optimization analysis were successively employed to obtain an optimal formulation of the inorganic salts in the fermentation medium, with the aim of achieving efficient CoQ10 fermentation by R. sphaeroides.
2. Methods and Materials
2.1. Microorganism and Culture Media Composition
The strain R. sphaeroides F3-40 was chosen in this research (stored at the College of Life Sciences, Fujian Normal University, Fuzhou, China). The agar slant culture medium included 18 g·L−1 glucose, 4.5 g·L−1 yeast extract, 20 g·L−1 agar powder, 2 g·L−1 monosodium glutamate (C5H8NO4Na), 8.75 g·L−1 MgSO4, 5.25 g·L−1 (NH4)2SO4, 4.2 g·L−1 NaCl, 1.5 g·L−1 KH2PO4, and 1.2 g·L−1 FeSO4. The seed culture medium included 18 g·L−1 glucose, 4.5 g·L−1 yeast extract, 2 g·L−1 C5H8NO4Na, 8.75 g·L−1 MgSO4, 5.25 g·L−1 (NH4)2SO4, 4.2 g·L−1 NaCl, 1.5 g·L−1 KH2PO4, and 1.2 g·L−1 FeSO4. The fermentation medium included 35.6 g·L−1 glucose, 6.39 g·L−1 corn steep powder, 7.39 g·L−1 C5H8NO4Na, 10 g·L−1 CaCO3, 10 g·L−1 MgSO4, 6.28 g·L−1 (NH4)2SO4, 3.5 g·L−1 NaCl, 1.6 g·L−1 FeSO4, 1.2 g·L−1 KH2PO4, 0.1 g·L−1 MnSO4, and 0.1 g·L−1 CaCl2.
2.2. Cultivation
A single colony of R. sphaeroides was picked from the agar plate medium and transferred into the seed culture medium (20 mL culture in a 250 mL flask), then placed in an incubator shaker at 32 °C with 220 rpm for 24 h. After cultivation, the bacterial solution was then transferred into the fermentation medium (45 mL culture in a 250 mL flask) at 10% (v/v) inoculum and incubated at 32 °C with 220 rpm for 48 h (Figure 2).
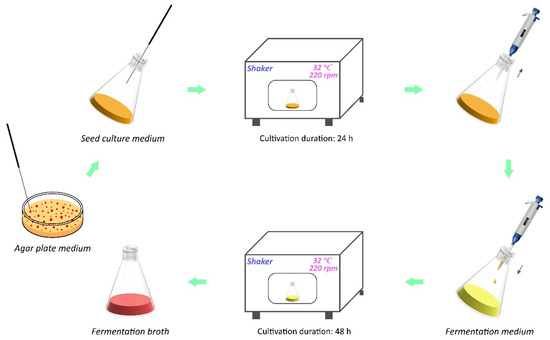
Figure 2.
Cultivation process of R. sphaeroides for CoQ10 production.
2.3. Extraction and Content Determination of CoQ10
Extraction of CoQ10 from the cells of R. sphaeroides was performed using ultrasound, and its content was determined by high-performance liquid chromatography (HPLC) [36]. First, 5 mL of the fermentation broth was mixed with 1 drop of 6 mol·L−1 hydrochloric acid and 10 mL acetone in a 50 mL brown glass volumetric flask, followed by the addition of 0.5 mL 30% H2O2 solution and 20–30 mL ethanol, and the mixture was vortexed for 1 min. Ethanol was added to dilute to 50 mL, subsequently sonicated for 45 min with the temperature controlled below 35 °C, then left to stand for 30 min. The supernatant was passed through a 0.22 μm organic filter, and the filtrate was collected for CoQ10 content determination. CoQ10 was quantified using the HPLC system equipped with a Hypersil ODS-SP C18 column (4.6 mm × 100 mm × 5 μm, Thermo Fisher Scientific, Waltham, MA, USA) and a detector (wavelength of 275 nm). Methanol/ethanol (65:35, v/v) was used as the mobile phase at a flow rate of 1.1 mL·min−1. Other detection conditions included column temperature of 30 °C, injection volume of 20 µL, and elution time of 15 min.
2.4. Single-Factor Experimentation
Six inorganic salts (MgSO4, NaCl, FeSO4, KH2PO4, MnSO4, CaCl2) in fermentation medium were selected for the research. Each inorganic salt has an examination range of the concentration as follows: MgSO4 6–22 g·L−1, NaCl 1.0–5.0 g·L−1, FeSO4 0.4–2.0 g·L−1, KH2PO4 0.8–2.4 g·L−1, MnSO4 0.02–0.10 g·L−1, CaCl2 0.02–0.10 g·L−1. The impact of each of these inorganic salts on the titer of CoQ10 at their respective five different concentrations was examined separately. The remaining five were kept at their original concentrations while probing one of the inorganic salts. Three replications of the experiment were performed. For inorganic salts whose CoQ10 yields did not fluctuate much with inorganic salt concentration, the intervals of suitable concentrations were in the full range. For the inorganic salts with large fluctuations in CoQ10 yield with changes in inorganic salt concentration, the intervals of suitable concentrations were mainly around the optimal concentration.
2.5. UD Modeling and Regression Analysis
Based on the single-factor experimentation, the six inorganic salts were taken as the participating factors (independent variables) in the UD experimental design, with five levels for each factor. The UD table U15(56) with six factors and five levels was implemented to arrange the experimental design (Table 1). Each trial was performed in triplicate. The experimental data were analyzed by quadratic polynomial stepwise regression using DPS 7.05 software (Hangzhou Refine Information Tech., Co., Ltd., Hangzhou, China), and the optimal formulation was obtained by mathematical model. The non-linear relationship between the response and the variable can be expressed as a second-order polynomial equation:
where Y is the predicted response; β0, βi, βii, βij are the regression coefficients for intercept (constant), linear, quadratic, interaction terms, respectively; Xi and Xj are the independent variables.
Y = β0 + ∑βiXi + ∑βiiXiXi + ∑βijXiXjY

Table 1.
Table of the U15(56) uniform design.
The concentration (g·L−1) of MgSO4, NaCl, FeSO4, KH2PO4, MnSO4, and CaCl2 was referred to X1, X2, X3, X4, X5, and X6. The titer of CoQ10 (mg·L−1) was referred to Y.
2.6. ANN Modeling and GA Optimization
ANN is composed of numerous neuron units and realizes the transmission and processing of information through the connections between neurons. The basic structure of an ANN includes an input layer, a hidden layer, and an output layer (Figure 3). The input layer receives the input data, the hidden layer processes the input data, and the output layer provides the results. Each neuron unit receives the input signal from the previous layer and calculates the output signal based on the corresponding weights and bias values, and passes it to the next layer. The tansig function (a hyperbolic tangent S-shaped function) was chosen as the activation function for both the hidden and output layers. Momentum gradient descent (traingdm) was selected for ANN training. It converges faster and escapes from the local optima more easily than ordinary gradient descent. A portion of the UD data was used as training samples for ANN training, and the remaining data were used as test samples to evaluate the prediction performance of the ANN model. To strengthen the learning capability, the experimental data were normalized prior to training. The mean-squared-error (MSE) is a widely applied loss function in ANNs, which measures the average squared difference between the predicted values and the true values. It is calculated by taking the mean of the squared errors over all data samples, and can be expressed as an equation:
where n is the total number of input values; yi and yi′ are the actual and predicted values, respectively.

Figure 3.
Basic structure of the ANN.
GA initially generates a set of individuals (candidate solutions) globally at random according to the actual problem, encodes them into chromosome structures (binary string format was adopted in this research) as the initial population, evaluates the fitness of all individuals in the population based on the fitness function, and then gradually evolves the population to a better solution by selection, crossover, and mutation with several iterations until certain termination conditions are met, resulting in the final solution [37,38]. If there is no mutation, there will be no new information available for evolution, and without crossover, the algorithm merely brings about local optimality [39]. Achieving global optimization relies on a proper balance between these operators. In binary GA, each gene is represented by 0 or 1.
The ANN model trained in this research was leveraged as the fitness function for GA. The input parameters of GA were set as follows: initial population = 40, generations = 100, crossover probability = 0.7, mutation probability = 0.0017, generation gap = 0.9. The maximum training epoch was set to 8000, the training goal was set to 0.005, and the learning rate was set to 0.05. The training stopped when the training goal was reached. The Matlab 2014 software was used for ANN modeling and GA optimization.
3. Results and Analysis
3.1. Single-Factor Experiment of Inorganic Salts
The titer of CoQ10 was highest when the concentrations of MgSO4, NaCl, FeSO4, KH2PO4, MnSO4, and CaCl2 were 6 g·L−1, 4 g·L−1, 1.2 g·L−1, 1.2 g·L−1, 0.1 g·L−1, and 0.1 g·L−1, respectively (Figure 4). The variations in the concentrations of MgSO4, FeSO4, and KH2PO4 could cause substantial fluctuations in the titer of CoQ10, while the impact of MnSO4 and CaCl2 was relatively minor. The differences in the titer of CoQ10 were significant at higher concentrations for MgSO4 and NaCl, and at lower concentrations for FeSO4. The differences between MnSO4 and CaCl2 at each concentration were not significant. When the concentration of KH2PO4 was 1.2 g·L−1, the titer of CoQ10 was 194.54 mg·L−1, which was the maximum value in the single-factor experimentation. The suitable concentration intervals of each inorganic salt can be ascertained as follows: MgSO4 6–14 g·L−1, NaCl 1.0–5.0 g·L−1, FeSO4 0.8–1.6 g·L−1, KH2PO4 0.8–1.6 g·L−1, MnSO4 0.02–0.10 g·L−1, and CaCl2 0.02–0.10 g·L−1.

Figure 4.
Impact of the six inorganic salts at different concentrations on CoQ10 titer of R. sphaeroides. Notes: Different letters represent significant differences between groups (p < 0.05). (a) MgSO4, (b) NaCl, (c) FeSO4, (d) KH2PO4, (e) MnSO4, (f) CaCl2.
3.2. UD Optimization of Inorganic Salts
The fermentation medium was formulated according to Table 1, and the optimization results of UD design are shown in Table 2.
Table 2.
Uniform design optimization of the six inorganic salts.
A second-order polynomial stepwise regression analysis was performed on the data, with the titer of CoQ10 as the objective. The resulting regression equation is shown below:
Y = 232.72 + 59.63 X2 + 5281.72 X6 − 324.72 X2X2 − 2605.59 X4X4 − 80,867.69 X5X5 − 541,357.42 X6X6 + 34.42 X1X3 + 1225.17 X2X4 + 6060.38 X2X5 − 7316.80 X2X6 − 16,462.54 X4X5 + 15,415.62 X4X6 + 205,555.30 X5X6
The equation was tested for the relevant indicators: R = 0.999, R2 = 0.998, p = 0.0046, F = 28,969.81. The p-value of the equation was considerably less than 0.05, indicating that the results were highly significant. Since the coefficient of determination R2 was extremely close to 1, the model has an excellent fit. The regression coefficients and t-test results for each experimental factor in the equation are shown in Table 3. The most influential independent variable was the interaction between NaCl and KH2PO4 (X2X4), followed by CaCl2 (X6). The optimal concentrations of inorganic salts for UD optimization were as follows (g·L−1): MgSO4 14, NaCl 2.6, FeSO4 1.6, KH2PO4 0.8, MnSO4 0.09, and CaCl2 0.06. The predicted maximum value of CoQ10 was 257.86 mg·L−1. Experimental validation results suggested a titer of CoQ10 at 250.32 mg·L−1.
Table 3.
Regression coefficient test for each regression term in the regression equation.
3.3. ANN-GA Optimization of Inorganic Salts
The topology of the ANN architecture in this research was 6-9-1 (Figure 5), i.e., it was made up of 6 input neurons (MgSO4, NaCl, FeSO4, KH2PO4, MnSO4, CaCl2), 9 hidden neurons, and 1 output neuron (CoQ10 titer, mg·L−1). The number of neurons in the hidden layer was determined by iterative testing. Too few hidden neurons would lower the prediction accuracy of the model, while an excessive amount would bias the model away from the real environment. When the number of hidden neurons reached 9, the training error was small and had the highest prediction accuracy.
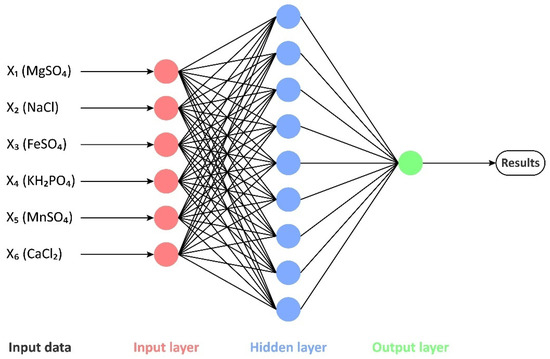
Figure 5.
Schematic representation of the (6-9-1) ANN architecture trained in this research.
The MSE illustrated a downtrend as the number of training epochs increased. The set training goal (MSE < 0.005) was reached when the ANN trained 2046 epochs (Figure 6).

Figure 6.
Training process of the ANN.
The fitting values of the training samples by ANN were basically consistent with the experimental values, with a maximum relative error of merely 0.89% (Table 4).
Table 4.
Comparison of fitted values and experimental values of training samples by ANN.
The ANN was used to predict the detection samples. The detection samples consisted of three sets of experimental data (N13, N14, N15) from the UD table. The largest relative error in the prediction results was 1.93% (Table 5).
Table 5.
Comparison of predicted values and experimental values of detection samples by ANN.
After 30 iterations of genetic algorithm optimization, the prediction tended to be stable (Figure 7). The titer of CoQ10 remained around 247.5 mg·L−1, fluctuating slightly. The gray line above depicts the change in the optimal solution, and the red line beneath describes the variation in the population mean. The maximum value of CoQ10 predicted by GA was 252.22 mg·L−1. The concentrations of six inorganic salts corresponding to this value were as follows: 12 g·L−1 MgSO4, 2.5 g·L−1 NaCl, 1.6 g·L−1 FeSO4, 0.8 g·L−1 KH2PO4, 0.1 g·L−1 MnSO4, and 0.1 g·L−1 CaCl2. The results of the verification experiment suggested that the accumulation concentration of CoQ10 was 255.36 mg·L−1.

Figure 7.
Global optimization process of GA.
4. Discussion
The primary components of the CoQ10 fermentation medium for R. sphaeroides incorporate carbon sources, nitrogen sources, and inorganic salts. Optimization of carbon and nitrogen sources has been reported by our group [40]. Through the same progressive optimization using UD and ANN-GA, an optimal carbon and nitrogen sources formulation of the fermentation medium was obtained (g·L−1): glucose 35.6, corn steep powder 6.39, C5H8NO4Na 7.39, (NH4)2SO4 6.28. The fermentation yield of CoQ10 was vastly boosted from 150 mg·L−1 to 245 mg·L−1, with an increase rate of 63.33%. This formulation has been employed in this research.
Based on carbon and nitrogen source-optimized fermentation medium, optimization of inorganic salt composition was carried out. The results for the fermentation medium inorganic salts obtained from the two optimization methods were slightly different (Table 6). Through the progressive optimization using UD and ANN-GA, the fermentation yield of CoQ10 was further increased from 245.31 mg·L−1 to 255.36 mg·L−1. They both had small relative errors and rendered strong fitting capabilities. The relative error of ANN-GA (1.23%) was smaller than that of UD (3.01%), and its potentiation of CoQ10 fermentation level (4.1%) was approximately two-fold higher than that of UD (2.04%). Although the production of CoQ10 appeared to have merely climbed by 10.05 mg·L−1, it was strongly related to the setting of the initial concentration of inorganic salts in the fermentation medium, which was already close to optimal levels for most inorganic salts, as confirmed by the before-and-after comparisons of both optimization methods. However, the optimization of inorganic salts was still meaningful. The optimal concentrations of the six inorganic salts in the fermentation medium were determined by optimization.
Table 6.
Comparison of two optimization methods.
Meanwhile, the optimization capabilities of UD and ANN-GA were also compared. Similarly, the optimization results of carbon and nitrogen sources indicate that ANN-GA has a better optimization effect than UD. The prediction error of ANN-GA optimization was only 0.82%, while that of UD was as high as 11.24%. Some researchers have also obtained analogous conclusions by comparing UD and ANN-GA [41,42].
Ample research has shown that the prediction performance of ANN-GA outperforms that of RSM [43,44,45]. In the field of bio-fermentation, ANN and GA are two important optimization tools for modeling prediction and global optimal search, respectively. ANN is a computational model that simulates the neural network of the human brain, which is able to effectively deal with non-linear relationships, has high prediction accuracy, and is able to capture the interactions among variables. GA is a meta-heuristic algorithm based on natural selection and heredity, which is able to quickly and efficiently find the global optimal solution. ANN-GA combines modeling performance and global optimal search performance, but also suffers from the complexity of needing to tune various parameters and trial and error. In contrast, RSM prediction is usually based on a fitted quadratic model with limited effectiveness. The hybrid RSM-ANN-GA is another optimization method worth exploring in the future, which has now been employed by researchers for optimization experiments.
The concentrations of FeSO4 and MnSO4 in the inorganic salt composition of the fermentation medium remained essentially unchanged before and after optimization. The results of both optimization methods pointed out that the concentrations of NaCl and KH2PO4 need to be lower, while the opposite was true for MgSO4. The Na+ in the fermentation medium was not only from NaCl. Another ingredient, C5H8NO4Na, was also soluble and provided Na+ as well. The c(Na+) of NaCl before optimization was 0.06 mol·L−1, whereas the c(Na+) of C5H8NO4Na was already 0.044 mol·L−1. A profuse c(Na+) was detrimental to the synthesis of CoQ10 by R. sphaeroides. Among these six inorganic salts, R. sphaeroides had the greatest demand for Mg2+. Taking the results of ANN-GA, the optimized c(Mg2+) of 0.1 mol·L−1 exceeded the total c(Na+) (0.086 mol·L−1) from NaCl and C5H8NO4Na after the same optimization.
5. Conclusions
The optimization results of the inorganic salts in the CoQ10 fermentation medium of R. sphaeroides demonstrated that ANN-GA exhibited a superior prediction capability to UD. Compared to UD, the optimization results of ANN-GA had a smaller relative error (ANN-GA 1.23%; UD 3.01%) and a higher increase rate in CoQ10 fermentation level (ANN-GA 4.1%; UD 2.04%). An optimal formulation of the inorganic salts in the fermentation medium was obtained (g·L−1): MgSO4 12, NaCl 2.5, FeSO4 1.6, KH2PO4 0.8, MnSO4 0.1, CaCl2 0.1. Ultimately, the fermentation yield of CoQ10 could reach 255.36 mg·L−1.
Author Contributions
Conceptualization: Y.Z. (Yi Zheng) and Y.Z. (Yong Zhou); Data curation: Y.Z. (Yong Zhou); Formal analysis: Y.X., S.T., and Y.Z. (Yong Zhou); Funding acquisition: Y.Z. (Yi Zheng); Methodology: Y.Z. (Yi Zheng) and Y.Z. (Yong Zhou); Project administration: Y.Z. (Yi Zheng); Resources: Y.Z. (Yi Zheng); Software: Y.X. and Y.Z. (Yong Zhou); Supervision: J.L. and Y.W.; Visualization: Y.X.; Writing—original draft: Y.X.; Writing—review and editing: Y.X., S.T., and Y.Z. (Yi Zheng). All authors have read and agreed to the published version of the manuscript.
Funding
This work was financially supported by the Natural Science Foundation of Fujian Province, China (No. 2015J01127).
Institutional Review Board Statement
Not applicable.
Informed Consent Statement
Not applicable.
Data Availability Statement
The experimental data provided in this article are available.
Conflicts of Interest
The authors declare no conflicts of interest.
References
- Xu, J.J.; Hu, M.; Yang, L.; Chen, X.Y. How plants synthesize coenzyme Q. Plant Commun. 2022, 3, 100341. [Google Scholar] [CrossRef] [PubMed]
- Nishida, I.; Yokomi, K.; Hosono, K.; Hayashi, K.; Matsuo, Y.; Kaino, T.; Kawamukai, M. CoQ10 production in Schizosaccharomyces pombe is increased by reduction of glucose levels or deletion of pka1. Appl. Microbial. Biotechnol. 2019, 103, 4899–4915. [Google Scholar] [CrossRef] [PubMed]
- Peng, L.; Lou, W.; Xu, Y.; Yu, S.; Liang, C.; Alloul, A.; Song, K.; Vlaeminck, S.E. Determination of the ubiquinol-10 and ubiquinone-10 (coenzyme Q10) in human serum by liquid chromatography tandem mass spectrometry to evaluate the oxidative stress. Sci. Total Environ. 2022, 822, 153489. [Google Scholar] [CrossRef]
- Mantle, D.; Dewsbury, M.; Hargreaves, I.P. The ubiquinone-ubiquinol redox cycle and its clinical consequences: An overview. Int. J. Mol. Sci. 2024, 25, 6765. [Google Scholar] [CrossRef]
- Pravst, I.; Zmitek, K.; Zmitek, J. Coenzyme Q10 contents in foods and fortification strategies. Crit. Rev. Food Sci. Nutr. 2010, 50, 269–280. [Google Scholar] [CrossRef]
- Podar, A.S.; Semeniuc, C.A.; Ionescu, S.R.; Socaciu, M.I.; Fogarasi, M.; Fărcaș, A.C.; Vodnar, D.C.; Socaci, S.A. An overview of analytical methods for quantitative determination of coenzyme Q10 in foods. Metabolites 2023, 13, 272. [Google Scholar] [CrossRef]
- Hargreaves, I.; Heaton, R.A.; Mantle, D. Disorders of human coenzyme Q10 metabolism: An overview. Int. J. Mol. Sci. 2020, 21, 6695. [Google Scholar] [CrossRef]
- Zhang, X.; Tohari, A.M.; Marcheggiani, F.; Zhou, X.; Reilly, J.; Tiano, L.; Shu, X. Therapeutic potential of co-enzyme Q10 in retinal diseases. Curr. Med. Chem. 2017, 24, 4329–4339. [Google Scholar] [CrossRef]
- Vollmer, D.L.; West, V.A.; Lephart, E.D. Enhancing skin health: By oral administration of natural compounds and minerals with implications to the dermal microbiome. Int. J. Mol. Sci. 2018, 19, 3059. [Google Scholar] [CrossRef]
- Hojerova, J. Skin health benefits of coenzyme Q10. In Bioactive Dietary Factors and Plant Extracts in Dermatology; Watson, R., Zibadi, S., Eds.; Springer Science: New York, NY, USA, 2013; pp. 197–213. [Google Scholar]
- Zhang, M.; Dang, L.; Guo, F.; Wang, X.; Zhao, W.; Zhao, R. Coenzyme Q10 enhances dermal elastin expression, inhibits IL-1α production and melanin synthesis in vitro. Int. J. Cosmet. Sci. 2012, 34, 273–279. [Google Scholar] [CrossRef] [PubMed]
- Mine, Y.; Takahashi, T.; Okamoto, T. Stimulatory effects of collagen production induced by coenzyme Q10 in cultured skin fibroblasts. J. Clin. Biochem. Nutr. 2022, 71, 29–33. [Google Scholar] [CrossRef]
- Lee, S.Q.; Tan, T.S.; Kawamukai, M.; Chen, E.S. Cellular factories for coenzyme Q10 production. Microb. Cell Fact. 2017, 16, 39. [Google Scholar] [CrossRef] [PubMed]
- Arenas-Jal, M.; Suñé-Negre, J.M.; García-Montoya, E. Coenzyme Q10 supplementation: Efficacy, safety, and formulation challenges. Compr. Rev. Food Sci. Food Saf. 2020, 19, 574–594. [Google Scholar] [CrossRef]
- Fan, J.; Xu, W.; Xu, X.; Wang, Y. Production of coenzyme Q10 by microbes: An update. World J. Microbiol. Biotechnol. 2022, 38, 194. [Google Scholar] [CrossRef]
- Lee, S.; Yu, J.; Kim, Y.H.; Min, J. Optimized Rhodobacter sphaeroides for the production of antioxidants and the pigments with antioxidant activity. Mol. Biotechnol. 2023, 65, 131–135. [Google Scholar] [CrossRef] [PubMed]
- Wada, O.Z.; Vincent, A.S.; Mackey, H.R. Single-cell protein production from purple non-sulphur bacteria-based wastewater treatment. Rev. Environ. Sci. Bio/Technol. 2022, 21, 931–956. [Google Scholar] [CrossRef]
- He, S.; Lu, H.; Zhang, G.; Ren, Z. Production of coenzyme Q10 by purple non-sulfur bacteria: Current development and future prospect. J. Clean. Prod. 2021, 307, 127326. [Google Scholar] [CrossRef]
- Sakarika, M.; Spanoghe, J.; Sui, Y.; Wambacq, E.; Grunert, O.; Haesaert, G.; Spiller, M.; Vlaeminck, S.E. Purple non-sulphur bacteria and plant production: Benefits for fertilization, stress resistance and the environment. Microb. Biotechnol. 2020, 13, 1336–1365. [Google Scholar] [CrossRef]
- Grattieri, M. Purple bacteria photo-bioelectrochemistry: Enthralling challenges and opportunities. Photochem. Photobiol. Sci. 2020, 19, 424–435. [Google Scholar] [CrossRef]
- Wu, P.; Zhang, G.; Li, J. Mg2+ improves biomass production from soybean wastewater using purple non-sulfur bacteria. J. Environ. Sci. 2015, 28, 43–46. [Google Scholar] [CrossRef]
- Bruna, R.E.; Kendra, C.G.; Pontes, M.H. Coordination of phosphate and magnesium metabolism in bacteria. Adv. Exp. Med. Biol. 2022, 1362, 135–150. [Google Scholar]
- Chen, Y.; Yang, A.; Meng, F.; Zhang, G. Additives for photosynthetic bacteria wastewater treatment: Latest developments and future prospects. Bioresour. Technol. Rep. 2019, 7, 100229. [Google Scholar] [CrossRef]
- Liu, S.; Zheng, Z.; Tie, J.; Kang, J.; Zhang, G.; Zhang, J. Impacts of Fe2+ on 5-aminolevulinic acid (ALA) biosynthesis of Rhodobacter sphaeroides in wastewater treatment by regulating nif gene expression. J. Environ. Sci. 2018, 70, 11–19. [Google Scholar] [CrossRef] [PubMed]
- Wu, P.; Zhang, G.; Li, J.; Lu, H.; Zhao, W. Effects of Fe2+ concentration on biomass accumulation and energy metabolism in photosynthetic bacteria wastewater treatment. Bioresour. Technol. 2012, 119, 55–59. [Google Scholar] [CrossRef] [PubMed]
- Chen, W.C.; Liu, T.H.; Wang, L.F.; Chien, C.C.; Chen, S.Y.; Wei, Y.H. Enhanced production and characterization of coenzyme Q10 from Rhodobacter sphaeroides using a potential fermentation strategy. J. Taiwan Inst. Chem. Eng. 2022, 137, 104201. [Google Scholar] [CrossRef]
- Leppik, R.A.; Young, I.G.; Gibson, F. Membrane-associated reactions in ubiquinone biosynthesis in Escherichia coli. 3-octaprenyl-4-hydroxybenzoate carboxy-lyase. Biochim. Biophys. Acta 1976, 436, 800–810. [Google Scholar] [CrossRef]
- Zhang, L.; Liu, L.; Wang, K.F.; Xu, L.; Zhou, L.; Wang, W.; Li, C.; Xu, Z.; Shi, T.; Chen, H.; et al. Phosphate limitation increases coenzyme Q10 production in industrial Rhodobacter sphaeroides HY01. Synth. Syst. Biotechnol. 2019, 4, 212–219. [Google Scholar] [CrossRef]
- Su, Y.Q.; Min, S.N.; Jian, X.Y.; Guo, Y.C.; He, S.H.; Huang, C.Y.; Zhang, Z.; Yuan, S.; Chen, Y.E. Bioreduction mechanisms of high-concentration hexavalent chromium using sulfur salts by photosynthetic bacteria. Chemosphere 2023, 311, 136861. [Google Scholar] [CrossRef]
- Singh, V.; Haque, S.; Niwas, R.; Srivastava, A.; Pasupuleti, M.; Tripathi, C.K.M. Strategies for fermentation medium optimization: An in-depth review. Front. Microbiol. 2017, 7, 2087. [Google Scholar] [CrossRef]
- Zhou, T.; Reji, R.; Kairon, R.S.; Chiam, K.H. A review of algorithmic approaches for cell culture media optimization. Front. Bioeng. Biotechnol. 2023, 11, 1195294. [Google Scholar] [CrossRef]
- Tian, Y.; Yue, T.; Yuan, Y.; Soma, P.K.; Lo, Y.M. Improvement of cultivation medium for enhanced production of coenzyme Q10 by photosynthetic Rhodospirillum rubrum. Biochem. Eng. J. 2010, 51, 160–166. [Google Scholar] [CrossRef]
- Fenhui, S.; He, L.; Qian, J.; Zhang, Z.; Zheng, H. Optimization of the nutritional constituents for ergosterol peroxide production by Paecilomyces cicadae based on the uniform design and mathematical model. Sci. Rep. 2022, 12, 5853. [Google Scholar] [CrossRef] [PubMed]
- Wu, Y.C.; Feng, J.W. Development and application of artificial neural network. Wirel. Pers. Commun. 2018, 102, 1645–1656. [Google Scholar] [CrossRef]
- Bajpai, S.; Singh, S.; Sinha, R.; Srivastava, P. ANN-GA hybrid methodology based optimization study for microbial production of CoQ10. Int. J. Adv. Sci. Res. 2015, 6, 100–108. [Google Scholar]
- Li, B.; Ge, Y.; Liang, J.; Zhu, Z.; Chen, B.; Li, D.; Zhuang, Y.; Wang, Z. Precise regulating the specific oxygen consumption rate to strengthen the CoQ10 biosynthesis by Rhodobater sphaeroides. Bioresour. Bioprocess. 2024, 11, 106. [Google Scholar] [CrossRef]
- Li, H.; Shi, N. Application of genetic optimization algorithm in financial portfolio problem. Comput. Intell. Neurosci. 2022, 5246309. [Google Scholar] [CrossRef] [PubMed]
- Pires, J.C.; Gonçalves, B.; Azevedo, F.G.; Carneiro, A.P.; Rego, N.; Assembleia, A.J.B.; Lima, J.F.B.; Silva, P.A.; Alves, C.; Martins, F.G. Optimization of artificial neural network models through genetic algorithms for surface ozone concentration forecasting. Environ. Sci. Pollut. Res. Int. 2012, 19, 3228–3234. [Google Scholar] [CrossRef]
- Katoch, S.; Chauhan, S.S.; Kumar, V. A review on genetic algorithm: Past, present, and future. Multimed. Tools Appl. 2021, 80, 8091–8126. [Google Scholar] [CrossRef]
- Zhou, Y.; Zheng, Y.; Song, L.D. The optimization of medium for coenzyme Q10 fermentation by artificial neural network associated with genetic algorithms. China Biotechnol. 2013, 33, 73–78. [Google Scholar]
- Peng, W.; Zhong, J.; Yang, J.; Ren, Y.; Xu, T.; Xiao, S.; Zhou, J.; Tan, H. The artificial neural network approach based on uniform design to optimize the fed-batch fermentation condition: Application to the production of iturin A. Microb. Cell Fact. 2014, 13, 54. [Google Scholar] [CrossRef]
- Cai, G.; Zheng, W.; Yang, X.; Zhang, B.; Zheng, T. Combination of uniform design with artificial neural network coupling genetic algorithm: An effective way to obtain high yield of biomass and algicidal compound of a novel HABs control actinomycete. Microb. Cell Fact. 2014, 13, 75. [Google Scholar] [CrossRef] [PubMed]
- Desai, K.M.; Survase, S.A.; Saudagar, P.S.; Lele, S.S.; Singhal, R.S. Comparison of artificial neural network (ANN) and response surface methodology (RSM) in fermentation media optimization: Case study of fermentative production of scleroglucan. Biochem. Eng. J. 2008, 41, 266–273. [Google Scholar] [CrossRef]
- Pal, M.P.; Vaidya, B.K.; Desai, K.M.; Joshi, R.M.; Nene, S.N.; Kulkarni, B.D. Media optimization for biosurfactant production by Rhodococcus erythropolis MTCC 2794: Artificial intelligence versus a statistical approach. J. Ind. Microbiol. Biotechnol. 2009, 36, 747–756. [Google Scholar] [CrossRef] [PubMed]
- Guo, Y.; Xu, J.; Zhang, Y.; Xu, H.; Yuan, Z.; Li, D. Medium optimization for ethanol production with Clostridium autoethanogenum with carbon monoxide as sole carbon source. Bioresour. Technol. 2010, 101, 8784–8789. [Google Scholar] [CrossRef]
Disclaimer/Publisher’s Note: The statements, opinions and data contained in all publications are solely those of the individual author(s) and contributor(s) and not of MDPI and/or the editor(s). MDPI and/or the editor(s) disclaim responsibility for any injury to people or property resulting from any ideas, methods, instructions or products referred to in the content. |
© 2025 by the authors. Licensee MDPI, Basel, Switzerland. This article is an open access article distributed under the terms and conditions of the Creative Commons Attribution (CC BY) license (https://creativecommons.org/licenses/by/4.0/).