Article

Functional Component Production Capabilities in Milk Fermentation of Some Featured Lactic Acid Bacteria Species for Use in Different Food Processes

by
Tuğba Kök Taş
1,*,
Fatma Ecemnur Duran
1,
Nilgün Özdemir
2 and
Ebru Çubuk Demiralay
3
1
Department of Food Engineering, Engineering Faculty, Suleyman Demirel University, Isparta 32260, Turkey
2
Department of Food Engineering, Engineering Faculty, Ondokuz Mayıs University, Samsun 55139, Turkey
3
Department of Basic Pharmaceutical Sciences, Pharmacy Faculty, Suleyman Demirel University, Isparta 32260, Turkey
*
Author to whom correspondence should be addressed.
Fermentation 2025, 11(4), 165; https://doi.org/10.3390/fermentation11040165
Submission received: 27 February 2025 / Revised: 17 March 2025 / Accepted: 18 March 2025 / Published: 24 March 2025

Abstract

This study examines the fermentation performance of featured bacteria (Lactobacillus acidophilus-ATCC-4356, Lactobacillus helveticus-ATCC-15009, Lactobacillus delbrueckii subsp. bulgaricus-ATCC-11842, Lacticaseibacillus casei-ATCC-393, Streptococcus thermophilus-ATCC-19258 (ST), and Bifidobacterium bifidum-ATCC-29521 (BB)) used in fermented dairy products and their impact on product quality. The main focus is on evaluating the metabolic activities, organic acid production, viscosity values, and sensory properties of probiotic strains such as L. acidophilus, L. bulgaricus, L. casei, L. helveticus, B. bifidum, and S. thermophilus. The strains were activated in a sterile milk medium and incubated until they reached a pH of 4.6. Then, pH, microbial enumeration, organic acid, sugar composition, vitamins A, D, E, K1, and K2 (menaquinone-7), and viscosity values were measured in the bacteria. Organic acid, sugar composition, and vitamins A, D, E, K1, and K2 (menaquinone-7) were analyzed with the HPLC method. Additionally, sensory analyses were performed, and volatile compounds were examined. L. casei demonstrated superiority in lactic acid production, while L. helveticus showed high lactose consumption. L. bulgaricus stood out in galactose metabolism. The highest viscosity was observed in products produced by B. bifidum. Differences in viscosity were attributed to exopolysaccharide (EPS) production and acid production capacity. A total of 62 volatile compounds were identified, with the highest levels of aromatic components found in products containing B. bifidum. The most preferred product, based on panel evaluations, was the fermented dairy product produced with L. acidophilus. As for aroma profiles, it was determined that the phenethyl alcohol, 3-methyl-1 butanol, and ethanol compounds are associated with B. bifidum, the hexanoic acid and 2-methylbutanal compounds are associated with the L. acidophilus, the hexanoic acid, 2-methylbutanal, 2-furanmethanol, and acetaldehyde compounds are associated with the L. bulgaricus, and the hexanoic acid, 2-methylbutanal, 2-heptanone, acetoin, and d-limonene are associated with the L. casei. On the other hand, the L. helveticus strain is associated with the hexanoic acid, 2-methylbutanal, and 2-heptanone, and the S. termophilus strain is associated with the hexanoic acid, hexanol, acetoin, 2,3-pentanedione, 1-butanol, and 3-methyl-2-butanone volatile aroma compounds. The determination of fat-soluble vitamins is particularly important for vitamin K1 and vitamin K2. In this study, the bacterial sources of these vitamins were compared for the first time. The menaquinone-7 production by L. helveticus was determined to be the highest at 0.048 µg/mL. The unique metabolic capacities of these prominent cultures have been revealed to play an important role in determining the aroma, organic acid content, viscosity, and overall quality of the products as a whole. Therefore, the findings of this study will provide the right strain selection for a fermented dairy product or a different non-dairy-based fermented product according to the desired functional properties. It also provides a preliminary guide for inoculation in the right ratios as an adjunct culture or co-culture for a desired property.

1. Introduction

Fermentation is a biochemical process that chemically transforms organic matter as a result of the enzymatic activities of microorganisms. This process, which has been used throughout history for various purposes such as food preservation, increasing nutritional value, and flavor development, has an important place in modern biotechnology and the food industry. Fermentation can be carried out by microorganisms through different metabolic pathways [1,2]. The most common types of fermentation include lactic acid, ethanol, and acetic acid fermentation. Lactic acid fermentation is characterized by the conversion of carbohydrates into lactic acid and is especially important in terms of functional effects such as food preservation, flavor development, production of bioactive compounds and probiotic properties. This process serves as a basic mechanism in the production of many foods such as yogurt, kefir, and fermented vegetables [3].
The process in which lactic acid fermentation is best observed is milk fermentation. In milk fermentation, lactic acid bacteria (LAB) convert lactose into lactic acid. In this process, by lowering the pH level of the milk, the development of pathogenic microorganisms is prevented and thus the shelf life of the products is extended [4,5,6]. LAB not only cause and protect the production of new and different foods from the basis of food durability. At the same time, they can provide functional properties that positively affect health, such as probiotic properties, antioxidant, antimicrobial and antihypertensive activities and/or exopolysaccharide (EPS) production ability and aroma compound production ability, which provide positive effects on the product from a technological perspective [7,8].
One of the most important of these features is the probiotic feature. It is known that LAB, especially Lactobacillus acidophilus and Bifidobacterium bifidum species, have probiotic properties that settle in the intestinal flora of living beings and positively support their immune systems [8,9]. Some LAB stand out with their vitamin production abilities. For example, some strains of Streptococcus thermophiles, Lactobacillus delbrueckii subsp. bulgaricus, Lactobacillus helveticus, Lacticaseibacillus rhamnosus, Loigolactobacillus coryniformis, Limosilactobacillus reuteri, Lactobacillus fermentum, Leuconostoc lactis, L. acidophilus, and B. bifidum species are known to have the ability to synthesize vitamins-B9 (folate), -B12 (cobalamin) -B7 (biotin), -B6 (pyridoxine), -B3 (nicotinic acid), or –K2 (Menaqinone-7) [10,11,12,13,14]. Altuncu et al. [14] reported that the recommended daily intake of vitamin K should be 90 µg for women and 120 µg for men. Vitamin K, obtained from the diet in its quinone form, is transferred into the bloodstream for utilization. Long-chain menaquinones, such as MK-7 and MK-10, are synthesized exclusively by bacteria. Among them, MK-7 stands out due to its extended half-life in human blood and high bioavailability and is also produced by various microorganisms. Additionally, the study examines the effects of vitamin K on energy metabolism, inflammation, and the risk of vascular calcification. On the other hand, one of the prominent functional features of some species in the LAB group is their ability to produce EPSs. These structures are polysaccharides in soluble or insoluble forms that LAB synthesize outside the cell using sugars in the fermentation medium. EPSs support the health of the final product with their properties such as antioxidant, antimicrobial, or prebiotic, while at the same time, they can change the rheology of the fermented product and improve its physical structure with their properties such as water-holding capacity and thickening. For example, some strains of Lacticaseibacillus casei and Lactobacillus plantarum species have the ability to produce EPS [15,16,17]. For example, it has been determined that EPS produced by the L. rhamnosus-ZFM231 strain has therapeutic properties, and EPS produced by the Leuconostoc citreum-BMS strain has rheological and emulsifying properties [18,19]. Another functional feature of some LAB strains is that they serve primarily or secondarily in the formation of the aroma profile of the fermented food product [20,21]. For example, a Lactobacillus kefiranofaciens strain was associated with aroma compounds; hexanol, 2-octanol, and octanal and a Lentilactobacillus kefiri strain with aroma compounds; ethyl octanoate, ethyl hexanoate, acetaldehyde, and geraniol [22]. Additionally, organic acids, fatty acids and many other compounds produced by LAB can be associated with aroma. Furthermore, it is known that some LAB strains, especially Bifidobacterum strains, have different conjugated linoleic acid (CLA)-producing ability. For example, Bifidobacterium breve strains are found to be CLA-producers. In one study [23], it was determined that the CLA-producing B. breve CCFM1025 strain had high levels of some antioxidant compounds, especially L-ascorbate, glutathione, ubiquinol-6, 3-demethylubiquinol-7, and demethylmenaquinol-7. In another study [24], the addition of Bifidobacterium animalis ssp. lactis to goat milk reduced fermentation time and significantly increased the content of functional organic acids such as acetic acid and functional long-chain unsaturated fatty acids such as linoleic acid, α-linolenic acid, and docosahexaenoic acid.
This study aimed to determine some functional properties of six strains belonging to the species S. thermophilus, L. delbrueckii subsp. bulgaricus, L. acidophilus, L. helveticus, L. Casei, and B. bifidum, which are prominent in the dairy industry, especially in terms of rarely observed fat-soluble vitamin ability, volatile aroma compound profile, organic acid and sugar profiles (fast, precise, and accurate analytical methods), and rheological properties, based on cow’s milk, which is the most common fermentation raw material for LAB species. Additionally, it expects to provide valuable insights for users in the food industry regarding the products in which these strains can be used and their intended uses by evaluating these properties. The reason for selecting these strains is their common use in the production of fermented dairy products such as yogurt, kefir, and probiotic beverages. In this context, identifying their characteristic properties and metabolites aims to serve as a reference for producers in their R&D studies for the selection of suitable strains for different fermentation products such as fermented plant dairy products.

2. Materials and Methods

2.1. Materials

In this study, the standard strains, Lactobacillus acidophilus-ATCC-4356 (LA), Lactobacillus helveticus-ATCC-15009 (LH), Lactobacillus delbrueckii subsp. bulgaricus-ATCC-11842 (LB), Lacticaseibacillus casei-ATCC-393 (LC), Streptococcus thermophilus-ATCC-19258 (ST), and Bifidobacterium bifidum-ATCC-29521 (BB) were obtained from ATCC and DSMZ (American Type Culture Collection, Manassas, VA, USA, and German Collection of Microorganisms and Cell Cultures; DSMZ, Braunschweig, Germany, respectively). UHT milk (semi skimmed; 1.5% and pH; 6.6) used as raw material was obtained from SÜTAŞ (Milk Products Inc., Aksaray, Turkey). Additionally, analytical grade chemicals and reagents were purchased from Sigma-Aldrich Co., (St. Louis, MO, USA) and Supelco Co., (Bellefonte, PA, USA), and the growth mediums were purchased from Merck Co., (Darmstadt, Germany) and Biolife Co., (Monza, Italy) for microorganisms.

2.2. Activation and Preparation of Featured Strains

These six featured strains (coded LA, LH, LB, LC, ST, and BB) were activated twice as single starter cultures. Firstly, the strains were individually inoculated at 2% of De Man, Rogosa and Sharpe (MRS) broth (Merck, Germany) media and incubated for 48 h at 32 °C under micro-anaerobic conditions (with 5% CO2) except for the BB strain. This strain incubated under anaerobic conditions (using an anaerobic jar; Anaerocult® 116275-Millipore, Merck, Germany). Then, the developing cultures were again inoculated into the same media and activated for the second time under the same conditions for 18 h. After the second activation, the resulting active cultures were centrifuged at 3600× g (Hettich Rotina380/380 R, Hettich GmbH & Co., Kirchlengern, Germany) for 15 min, and the pellets that were formed were washed with a physiological saline solution (PSS; 8.5% NaCl). The turbidity of each cell pellet was adjusted to a 0.5 McFarland value (8 log CFU L−1) to inoculate them in 10 mL PSS to the 490 mL of UHT-milk (6 log CFU L−1). So, the active suspensions of the strains were obtained to use as starter culture [22].

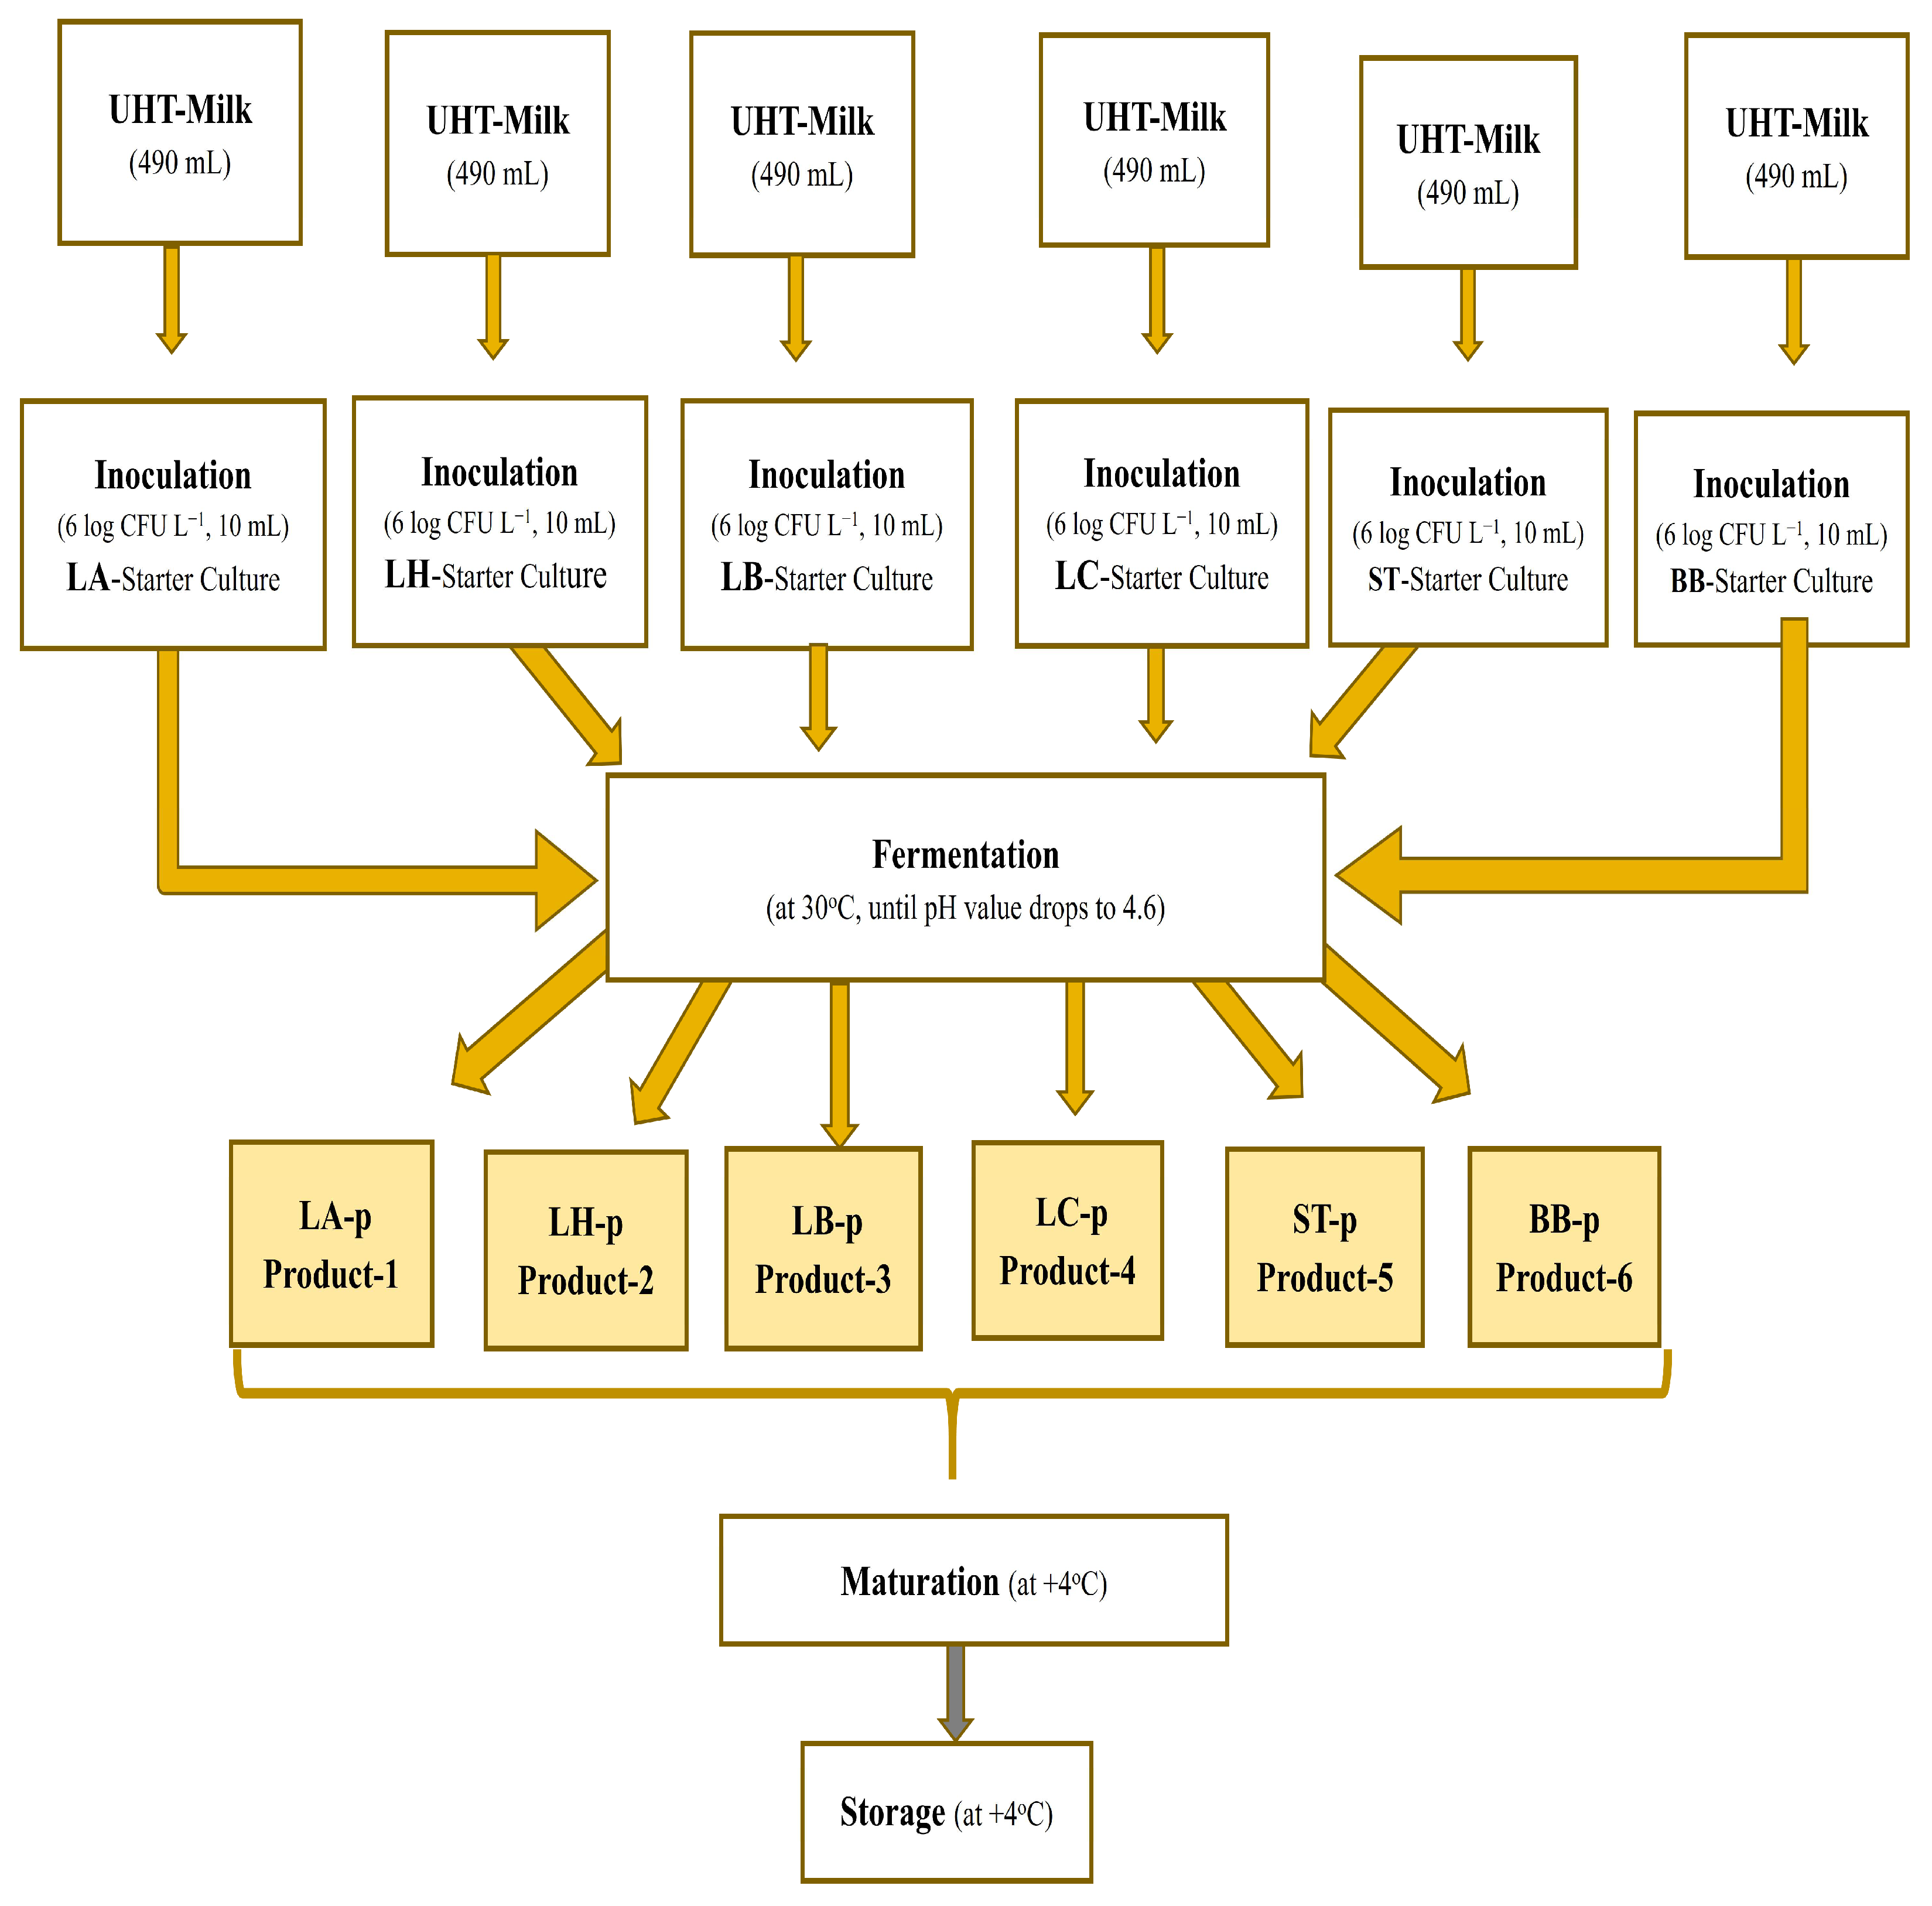
2.3. Production of Fermented Products with Six Featured Strains

Each culture was used at a 2% (v/v) inoculum level in sterile milk (1.5% fat, pH 6.6, and dry matter 10%; sourced from Sutas Dairy Products Inc., Aksaray, Turkey). The inoculated milk samples were incubated at 32 °C until the pH reached 4.6, and six fermented samples coded LA-p, LH-p, LB-p, LC-p, ST-p, and BB-p, were obtained (Figure 1). Then, the samples were matured at +4 °C for 3 h. Subsequently, microbiological and rheology analyses were performed. For other analyses, the samples were stored at −20 °C.

2.4. Lactic Acid Bacteria Count and Physicochemical Analysis

LAB contents were determined using the pour plate method, in MRS agar at 37 °C under 5% CO2 for 24–48 h [22]. For the BB-p, the incubation was performed under anaerobic conditions. On the other hand, the pH values of the samples were measured using a pH meter (Schott Instruments Lab 860, Rye Brook, NY, USA) and the acidity values were determined as a percentage (%) of lactic acid according to AOAC standard procedures. The dry matter amount of the samples was also determined using a moisture analyzer (MOC63u, SHIMADZU Corp., Kyoto, Japan).

2.5. Rheological Analysis

The rheological characteristics of the samples were evaluated using a Brookfield DV-II Pro LV viscometer (Brookfield Company, Stoughton, MA, USA) with a small sample adapter. Measurements were conducted at 25 °C (room temperature) with the spindle SC4-18. A 10 mL sample (at 4 °C) was placed into the sample chamber, and readings began at a rotational speed of 1 rpm, increasing by 6 rpm every 5 s, with a total of seven readings. Viscosity, shear stress, and deformation rate were calculated using the RHEOCALC® -RC32 v3.3 software (Brookfield Engineering Laboratories, Inc., Stoughton, MA, USA). The Power-Law model (τ = K(γ˙)n) was employed for analysis.

2.6. Organic Acid and Sugar Analysis

Two grams of each sample were diluted in double-distilled water and homogenized for 180 s at 4000 rpm. Afterward, 10 mL of the homogenate was treated with 12.5 mL of 0.01 N H2SO4, vortexed for one minute, and the upper phase was collected in an Eppendorf tube, followed by centrifugation at 10,000× g for 5 min. The supernatant was filtered using a 0.45 μm filter (Merck, Millipore, Millex-LG). This pre-extraction process was applied for both organic acid and sugar analyses.
The organic acids of the samples were quantified using high-performance liquid chromatography (HPLC), equipped with a UV–visible detector and an Inertsil ODS-3V C18 column. The mobile phase consisted of a 5 mM H2SO4 solution (pH adjusted to 3.0), flowing at 1.0 mL/min with a column temperature of 30 °C. Organic acids were monitored with a diode array detector at 210 nm, with results calculated via correlation coefficient (r values for lactic, acetic, citric, and formic acids were 0.999, 0.999, 0.999, and 0.999, respectively).
Similarly, the sugar contents of the samples, including glucose, galactose, and lactose were measured. HPLC analyses of the compounds were performed using a refractive index detector (RID-20A, Shimadzu, Kyoto, Japan). The Transgenomic CARBOSep COREGEL-87P column was used for qualitative and quantitative determination. Ultra-pure water was used as the mobile phase at a flow rate of 0.8 mL/min and a column temperature of 80 °C.
The qualitative and quantitative determinations of organic acids and sugars were carried out using the HPLC method. The retention time (tR) value of each compounds in the method was determined three times, and when the repeatability data were evaluated, the relative standard deviation percentage (%RSD) was calculated below 2%. In addition, chromatographic retention parameters were calculated to determine the compounds quantitatively. Accordingly, it was determined that the capacity factor (k) values were in the range of 1 ≤ k ≤ 10, the selectivity factor (α) was ≥1.15, and the separation factor (Rs) value was ≥1.5.

2.7. Fat-Soluble Vitamin Analysis

HPLC analysis of fat-soluble vitamins was adapted from Altuncu et al. [14]. Separation was performed on a Kinetex C18 column (250 × 4.6 mm I.D., 2.6 μm, 100 Å, Phenomenex®, Torrance, CA, USA) at 30 °C and a flow rate of 0.8 mL/min. Compounds were monitored at the same wavelengths with a diode array detector. The external calibration method was applied to determine the linearity of the developed method. Calibration lines were prepared by plotting the peak area values of the solutions with five different concentrations prepared by diluting the stock solutions of vitamins against the concentration values. Since the correlation coefficient value (r) was >0.999, it met the acceptance criteria according to ICH guidelines Q2 (R1) [25]. The limit of detection (LOD) and the limit of quantitation (LOQ) were calculated by taking the signal/noise ratios as 3.3:1 and 10:1, according to Altuncu et al. [14].
A Shimadzu HPLC instrument (Kyoto, Japan) was used for qualitative and quantitative analysis of organic acids, sugars, and fat-soluble vitamins. The liquid chromatographic instrument used consisted of a refractive index detector (RID-20A), diode array detector (SPD-M20A), pump (LC20AD), degasser (DGU-20A3), column oven (CTO-10ASVP), and manual injection.
The determinations of fat-soluble vitamins A, D, E, K1, and K2 were carried out using the HPLC method developed by Altuncu et al. [14]. The tR value of each selected vitamin in the method was determined three times, and when the repeatability data were evaluated, the %RSD was calculated below 2%. In addition, the k, α, and Rs values of the compounds were calculated in the optimum separation condition and it was concluded that the separation condition was suitable for quantitative analysis.

2.8. Preparation of Standard Solutions and Calibration Standards

The standards and solvents used for the HPLC study were supplied in analytical and HPLC purity (≥98%). Pure standards of fat-soluble vitamins to be analyzed were prepared as stocks by dissolving them in the mobile phase medium at a concentration of 100 µg/mL.
Stock solutions of organic acids such as lactic acid 3000 µg/mL, acetic acid 1500 µg/mL, formic acid 500 µg/mL, and citric acid 400 µg/mL were prepared by dissolving them in ultrapure water in the mobile phase medium analyzed, i.e., lactose 7500 µg/mL, galactose 1250 µg/mL, and glucose 1500 µg/mL. These stock solutions were stored in the dark at +4 °C.

2.9. Linearity and Sensitivity

Calibration was performed to accurately determine the concentration of the analyte in a sample. The external calibration method was applied to determine the linearity of the developed method. Peak area values were plotted against five different solution concentrations prepared by diluting the stock solutions of the studied vitamins, organic acids, and sugars to be quantitatively determined. The limit of detection (LOD) and limit of quantitation (LOQ) were calculated. These parameters were determined according to signal/to noise ratios of 3.0:1 and 10:1. The described method was linear for five compounds. The results meet the acceptance criteria according to ICH guidelines Q2 (R1), which state that the correlation coefficient value (r) must be >0.999 [23]. The slope and intercept values of the obtained linear functions were used for quantitative calculations of vitamins, organic acids, and sugars in the samples.

2.10. Volatile Compound Analysis

Volatile compounds were determined using gas chromatography–mass spectroscopy (GC-MS) with solid-phase micro-extraction (SPME). A sample of 2 g was placed in a 15 mL vial and mixed with 1 g NaCl and 2.5 µL of an internal standard (4-methyl-2-pentanol, 0.5 mL/L in distilled water). In the SPME extraction procedure, after equilibrating the sample in a water bath at 60 °C for 30 min, the SPME fiber (2 cm–50/30 mm; DVB/Carboxen/PDMS, Stable Flex Supelco, Bellefonte, PA, USA) was inserted into the vial for 30 min at 60 °C. At the end of the period, absorption of volatile components into the fiber was achieved. The fiber was then thermally desorbed at 250 °C for 10 min in the GC port. A polar Stabilwax column (60 m length × 0.32 mm i.d. × 0.25 μm thickness; Restek, Bellefonte, PA, USA) was used for separation, with helium (99.9%) as the carrier gas at a flow rate of 3 mL/min. The oven temperature was programmed to start at 40 °C for 1 min, then increased from 40 to 100 °C at a rate of 7 °C/min and held for 5 min, followed by 180 °C at a rate of 2 °C/min and held for 1 min, and finally increased to 250 °C at a rate of 15 °C/min and held for 4 min. The volatiles were quantified as μg/L by comparing peak areas to the internal standard, and their identity was confirmed by comparing mass spectra to library databases (Wiley 6 and FFNSC; Flavours and Fragrances of Natural and Synthetic Compounds).

2.11. Sensory Analysis

Descriptive sensory analysis was performed on the fermented milk samples by a trained panel consisting of eight women and seven men, aged 25 to 40 years. These panelists were students and faculty members from the food engineering department who had completed 40 h of training. These panelists were applied to sensory protocols. The analysis was performed following the guidelines of the International Organization for Standardization (ISO) [26,27]. Samples (10 mL each) were served in coded plastic cups with water and crackers for palate cleansing between samples. Sensory attributes—appearance, consistency, taste, and aroma—were rated using a 7-point hedonic scale, and the samples were ranked based on overall preference.

2.12. Statistical Analysis

All analyses were performed in triplicate. Origin v8.0 statistical software (Origin Lab Inc., Northampton, MA, USA) was used to analyze the HPLC data. Data were analyzed using a one-way ANOVA with SPSS 20.0 (SPSS Inc., Chicago, IL, USA). Duncan’s test was applied to identify significant differences between samples (p < 0.05).

3. Results and Discussion

3.1. Lactic Acid Bacteria Counts and Physicochemical Properties of Fermented Products

Some featured strains, commonly used in the dairy industry, were activated in a milk medium, and the process was terminated at pH 4.6. In these fermented productions, it is appropriate to terminate the process at pH 4.6, as this is the isoelectric point of casein, the primary protein in milk. At this pH, casein molecules lose their solubility in water, leading to denaturation and curd formation. This curd formation is crucial in many dairy products, such as cheese and yogurt, as it contributes to essential organoleptic properties. Additionally, pH 4.6 inhibits the growth of many spoilage and pathogenic microorganisms, playing a vital role in enhancing the safety and shelf life of the product. The time required for different strains to reach pH 4.6 varies, as shown in Table 1. The fundamental reason for the varying durations that different bacteria take to reach a pH of 4.6 is attributed to the differences in the metabolic rates and fermentation capacities of each bacterial species. These strains have different acid production abilities in terms of speed. These variations are influenced by several factors, including the ability of the bacteria to produce organic acids such as lactic acid during their metabolic processes, the growth rate of each bacterium, the carbon sources utilized by the bacteria, and external factors such as environmental temperature and oxygen availability. Additionally, the tolerance of the produced acids plays a significant role in these differences [28]. In this study, according to Table 1, the lowest growth was observed the LH strain with 8.58 log CFU/mL, while the highest was the LB with 9.52 log CFU/mL. The targeted pH values were achieved at the 25th and 28th hours of incubation. No statistically significant differences in the solid content of the bacteria were observed based on Table 1.
As for titratable acidity values, the highest acidity was determined in the LC-p sample with a lactic acid value of 0.98% (Table 1). This shows that the LC strain has superior lactic acid production capability. Thus, this L. casei strain can especially be recommended for use in the dairy industry alongside commonly used yogurt cultures such as S. thermophilus and L. bulgaricus to enhance acid production. Additionally, as illustrated in Table 1 and Table 2A, total organic acid levels were consistent with titratable acidity values; however, numerical equivalence was not observed. This inconsistency may be attributed to several factors, including the buffering capacity of the food matrix, the presence of weak acids that do not fully dissociate, or the potential loss of volatile organic acids during analysis. Furthermore, organic acids may form complexes with minerals, thereby reducing measurable acidity during titration.

3.2. Organic Acid Profiles of Fermented Samples

The concentrations of lactic, acetic, citric, and formic acids produced by probiotic strains are presented in Table 2A. The LC-p sample, produced using the L. casei strain, exhibited the highest lactic acid concentration (0.783 g/100 mL); also, the LA-p, produced using the L. acidophilus strain, showed a similar level (0.744 g/100 mL). These findings align with the literature emphasizing the adaptability of the L. casei strain to various fermentation conditions [29]. The titratable acidity of the LA-p and LC-p was also high, consistent with these results. Also, there are some studies in the literature regarding the lactic acid production of the strains of the species used in the current study. For example, in a study [30], it was determined that a strain of L. casei produced 0.616 g/100 mL lactic acid.
As for acetic acid, it imparts a sharp flavor to fermented products but can produce undesirable tastes in excessive amounts. Generally, acetic acid is produced in lower quantities compared to lactic acid during lactic acid bacteria fermentations. The B. bifidum produced the highest acetic acid levels (0.607 g/100 mL), attributed to its heterofermentative metabolism, which generates both lactic and acetic acids as end products [31]. This dual acid production contributes to flavor balance and extends the shelf life of fermented products. Secondly, in this study, the ST strain also produced relatively high levels of acetic acid (0.594 g/100 mL), providing a sharper flavor compared to other strains [32]. This showed that some strains of S. thermophilus with proteolytic activity can exhibit high acetic acid concentrations and the metabolites they produce cause different chemical reactions to start and different compounds to be formed [33].
In the literature, it was determined that generally, the acetic acid production by LAB is lowest as compared to other organic acids [34]. Fermentation processes carried out by Limosilactobacillus fermentum, Pediococcus pentosaceus, Weissella cibaria, and L. casei strains at 37 °C for 20 h reported an acetate production in the range of 0.0128–0.0141 mmoL/mL [35]. But it is known that the bacterial growth and its metabolites are highly dependent on medium composition. So, in a study, in anchovy infusion broth, L. acidophilus and Lactobacillus delbrueckii subspecies lactis strains showed high acetic acid production viz.; 822 mg/L and 803 mg/L, respectively. In MRS broth, LAB species L. acidophilus and L. delbrueckii do not show acetate production [34,36].
Although citric acid is not a primary metabolite of LAB, nevertheless, it plays a role in flavor enhancement and as a substrate for secondary metabolic pathways. The LB-p, BB-p, and ST-p exhibited the highest citric acid concentrations (0.166, 0.166, and 0.168 g/100 mL, respectively). This elevated citric acid production aligns with their roles in aroma development, as citric acid serves as a precursor to diacetyl, contributing to buttery flavors in fermented products [37]. However, here, the LC-p sample with low citric acid value, and therefore the L. casei strain, stands out because the acetoin amount that increases with the use of citric acid during fermentation and its decrease (data are available in the volatile aroma components section) shows that the L. casei strain produces acetoin by using the citrate present in normal milk (130–160 mg citrate per 100 mL). Thus, the determination of high amounts of acetoin in a sample with low citric acid also shows the supportive relationship between the analyses in this study. On the other hand, the acetoin amount is also second highest in the ST-p sample. Here, despite the high citric acid in the ST-p sample, this observation can be explained by the view that the S. thermophilus strain also causes the conversion of citric acid to acetoin, but the speed and amount of this conversion are slightly lower than in the L. casei strain. Similarly, in one study, it was stated that L. paracasei and S. thermophilus strains were involved in this conversion between citric acid and acetone [38].
As for formic acid, a minor organic acid in the overall profile, if it is present in excessive concentrations, an undesirable sharp taste may occur in the product. The LB-p and BB-p samples had the most high values of it (0.164 and 0.163, respectively), following the LA-p sample. This result corresponds to heterofermentative pathways where formic acid is generated as a byproduct [39]. In addition, these strains also have probiotic properties, which is the most negative aspect in terms of aroma. B. bifidum strains demonstrate strong acidification capability, highlighting its contribution to gut health. Its acid profile supports its application in synbiotic formulations [39]. When the total content of organic acids detected in this study is examined, the observation that the BB-p sample has the highest content supports this situation.
The observed organic acid profiles in this study are consistent with the existing literature on some LAB strains [29,40]. The high lactic acid levels produced by Lactobacillus casei and L. acidophilus underscore their extensive use in fermented dairy products due to their strong acidification and health-promoting properties. In a study conducted by Chramostová et al. [41], the effect of cultivation conditions on the organic acid (lactic, acetic, and formic) production of L. acidophilus, Bifidobacterium spp., and S. thermophilus strains was determined. The optimum temperature (37 °C) and incubation period (17 h) revealed total organic acid amounts of 79.47 mg/100 g for L. acidophilus, 107.10 mg/100 g for Bifidobacterium spp., and 133.50 mg/100 g for S. thermophilus.

3.3. Sugar Profiles of Fermented Samples

The glucose, lactose, and galactose contents of the products are presented in Table 2B. Glucose is one of the primary carbon sources in LAB metabolism, and its breakdown is crucial for the production of organic acids, especially lactic acid. The LA-p showed the highest glucose consumption (0.674 g/100 mL) accompanied by a significant amount of lactic acid production (0.744 g/100 mL). This observation aligns with the process by which LAB convert glucose to lactic acid through the Embden–Meyerhof pathway [42]. The LB-p also exhibits high glucose consumption (0.672 g/100 mL) and moderate lactic acid production (0.637 g/100 mL). These results reflect its ability to efficiently metabolize glucose to lactic acid and acetic acid (0.523 g/100 mL) [32].
Lactose is a critical substrate for LAB fermentation, especially in dairy products. Since the initial lactose content of the UHT milk used was between 4.0 and 4.5, the lactose amounts shown in Table 2B were interpreted as the utilization (hydrolysis) of the initial lactose. The hydrolysis of lactose into glucose and galactose provides energy for organic acid production. The LH-p showed the lowest lactose consumption (2.151 g/100 mL), along with moderate lactic acid (0.668 g/100 mL) and citric acid production (0.125 g/100 mL). This indicates that the hydrolysis of lactose plays a central role in the metabolic activity of this strain, providing a balanced organic acid profile for cheese fermentation [37]. The ST strain also hydrolysed a significant amount of lactose (2.085 g/100 mL) and produced moderate lactic acid (0.574 g/100 mL) along with higher citric acid production (0.168 g/100 mL). This is consistent with the lactose hydrolysis and citric acid metabolism in yogurt fermentation [40].
Galactose is a by-product of lactose hydrolysis and is not metabolized by all LAB strains. The LB strain produces the highest galactose concentration (0.276 g/100 mL), which is associated with moderate lactic acid (0.637 g/100 mL) and acetic acid production (0.523 g/100 mL). This suggests that the L. bulgaricus strain does not efficiently metabolize galactose but, with its heterofermentative capabilities, produces multiple acids from glucose and lactose [42]. The LC strain produced the highest lactic acid content (0.783 g/100 mL) with lower galactose consumption (0.093 g/100 mL). This indicates that L. casei strains are more efficient at converting galactose into lactic acid [29]. The B. bifidum exhibits moderate galactose consumption (0.103 g/100 mL) while producing significant amounts of lactic acid (0.722 g/100 mL) and acetic acid (0.607 g/100 mL) [31].
Formic acid, although present in small amounts, may originate from the mixed-acid fermentation pathways of LAB. B. bifidum leads in formic acid production (0.164 g/100 mL) and maintains moderate levels of glucose (0.456 g/100 mL) and lactose (1.878 g/100 mL) consumption. This is consistent with the heterofermentative nature of B. bifidum [35]. L. bulgaricus also produces high levels of formic acid (0.163 ± 0.014) and consumes significant amounts of galactose (0.276 g/100 mL). Strains like L. casei and L. acidophilus efficiently metabolize glucose and galactose to lactic acid, while B. bifidum and S. thermophilus produce a more balanced acid profile.

3.4. Vitamin A, D, E, K Contents of Fermented Samples

The qualitative and quantitative determinations of fat-soluble vitamins A, D, E, K1, and K2 were carried out using the HPLC method developed by Altuncu et al. [14]. The retention time (tR) value of each selected vitamin in the method was determined three times, and when the repeatability data were evaluated, the relative standard deviation percentage (%RSD) was calculated below 2%. In addition, chromatographic retention parameters were calculated to determine the compounds quantitatively. Accordingly, it was determined that the capacity factor (k) values were in the range of 1 ≤ k ≤ 10, the selectivity factor (α) was ≥1.15, and the separation factor (Rs) value was ≥1.5. As a result of the perfect peak symmetry and method optimization of the analyzed vitamins, an external calibration method was applied for the quantitative analysis of the compounds [14]. Calibration curves were drawn with five different concentrations of each standard, and the linear working ranges were determined. The graphs are presented in Table 3.
The developed HPLC method quantification was performed for the analysis of the samples. The determination of fat-soluble vitamins is particularly important for vitamin K1 and vitamin K2. In this study, the bacterial sources of these vitamins were compared for the first time. The production of vitamin K2, known as menaquinone-7, by L. helveticus was determined to be the highest at 0.048 µg/mL. The results obtained at different fermented samples are given in Table 2C. Altuncu et al. [14] also reported that the vitamin content in milk was 15.79 µg/100 g for vitamin A, 0.55 µg/100 g for vitamin D, 1.11 µg/100 g for vitamin E, 4.81 µg/100 g for vitamin K1, and 0.97 µg/100 g for vitamin K2 (MK-7). These values, when calculated per 100 g, can be interpreted as certain increases being attributed to bacteria.
The data presented in the table illustrate the concentrations of various vitamins (A, D, E, K1, and K2) in different fermented milk samples. These findings are crucial for evaluating the effects of specific bacterial cultures on vitamin production. The highest vitamin A content was observed in the LA-p sample (31.083 ± 0.041), suggesting that L. acidophilus may play an active role in vitamin A production. The LC-p sample (13.397 ± 0.044) exhibited the highest vitamin D level, indicating that L. casei might be more efficient in vitamin D synthesis compared to other strains. The BB-p sample (1.135 ± 0.004) contained the highest vitamin E concentration, implying that B. bifidum could have a potential role in vitamin E production. The ST-p sample had the highest values for both vitamin K1 (0.869 ± 0.003) and K2 (0.029 ± 0.008), suggesting that S. thermophilus significantly contributes to the production of K vitamins. In conclusion, the vitamin production capacities of different probiotic strains vary significantly. Therefore, selecting suitable probiotic strains based on specific vitamin requirements could be a strategic approach to enhancing the nutritional value of fermented dairy products.
In a Finnish study quantifying carotenoid concentrations in various dairy products, β-carotene contents ranged from 3.0 to 186.5 µg/100 g [43]. LC-MS and LC-MS/MS analysis of whole milk and fresh cow’s milk revealed vitamin D3 concentrations of 0.2 μg/L and 0.5–0.6 μg/L, respectively [44]. α-tocopherol contents in dairy products with different fat contents were found to be in the range of 4.5–45.5 μg/100 g [45]. In a study investigating vitamin K contents in various animal products, dairy products were found to contain K1 and MK-4 in the range of 0.2–3.0 and 0.4–10.4 mg/100 g, respectively [14,46].
As a result of the excellent peak symmetry of the compounds analyzed by HPLC and method optimization, an external calibration method was applied for the quantitative analysis of the compounds. Calibration curves were drawn with five different concentrations of each standard, and linear working ranges were determined. The graphs are presented in Table 3.

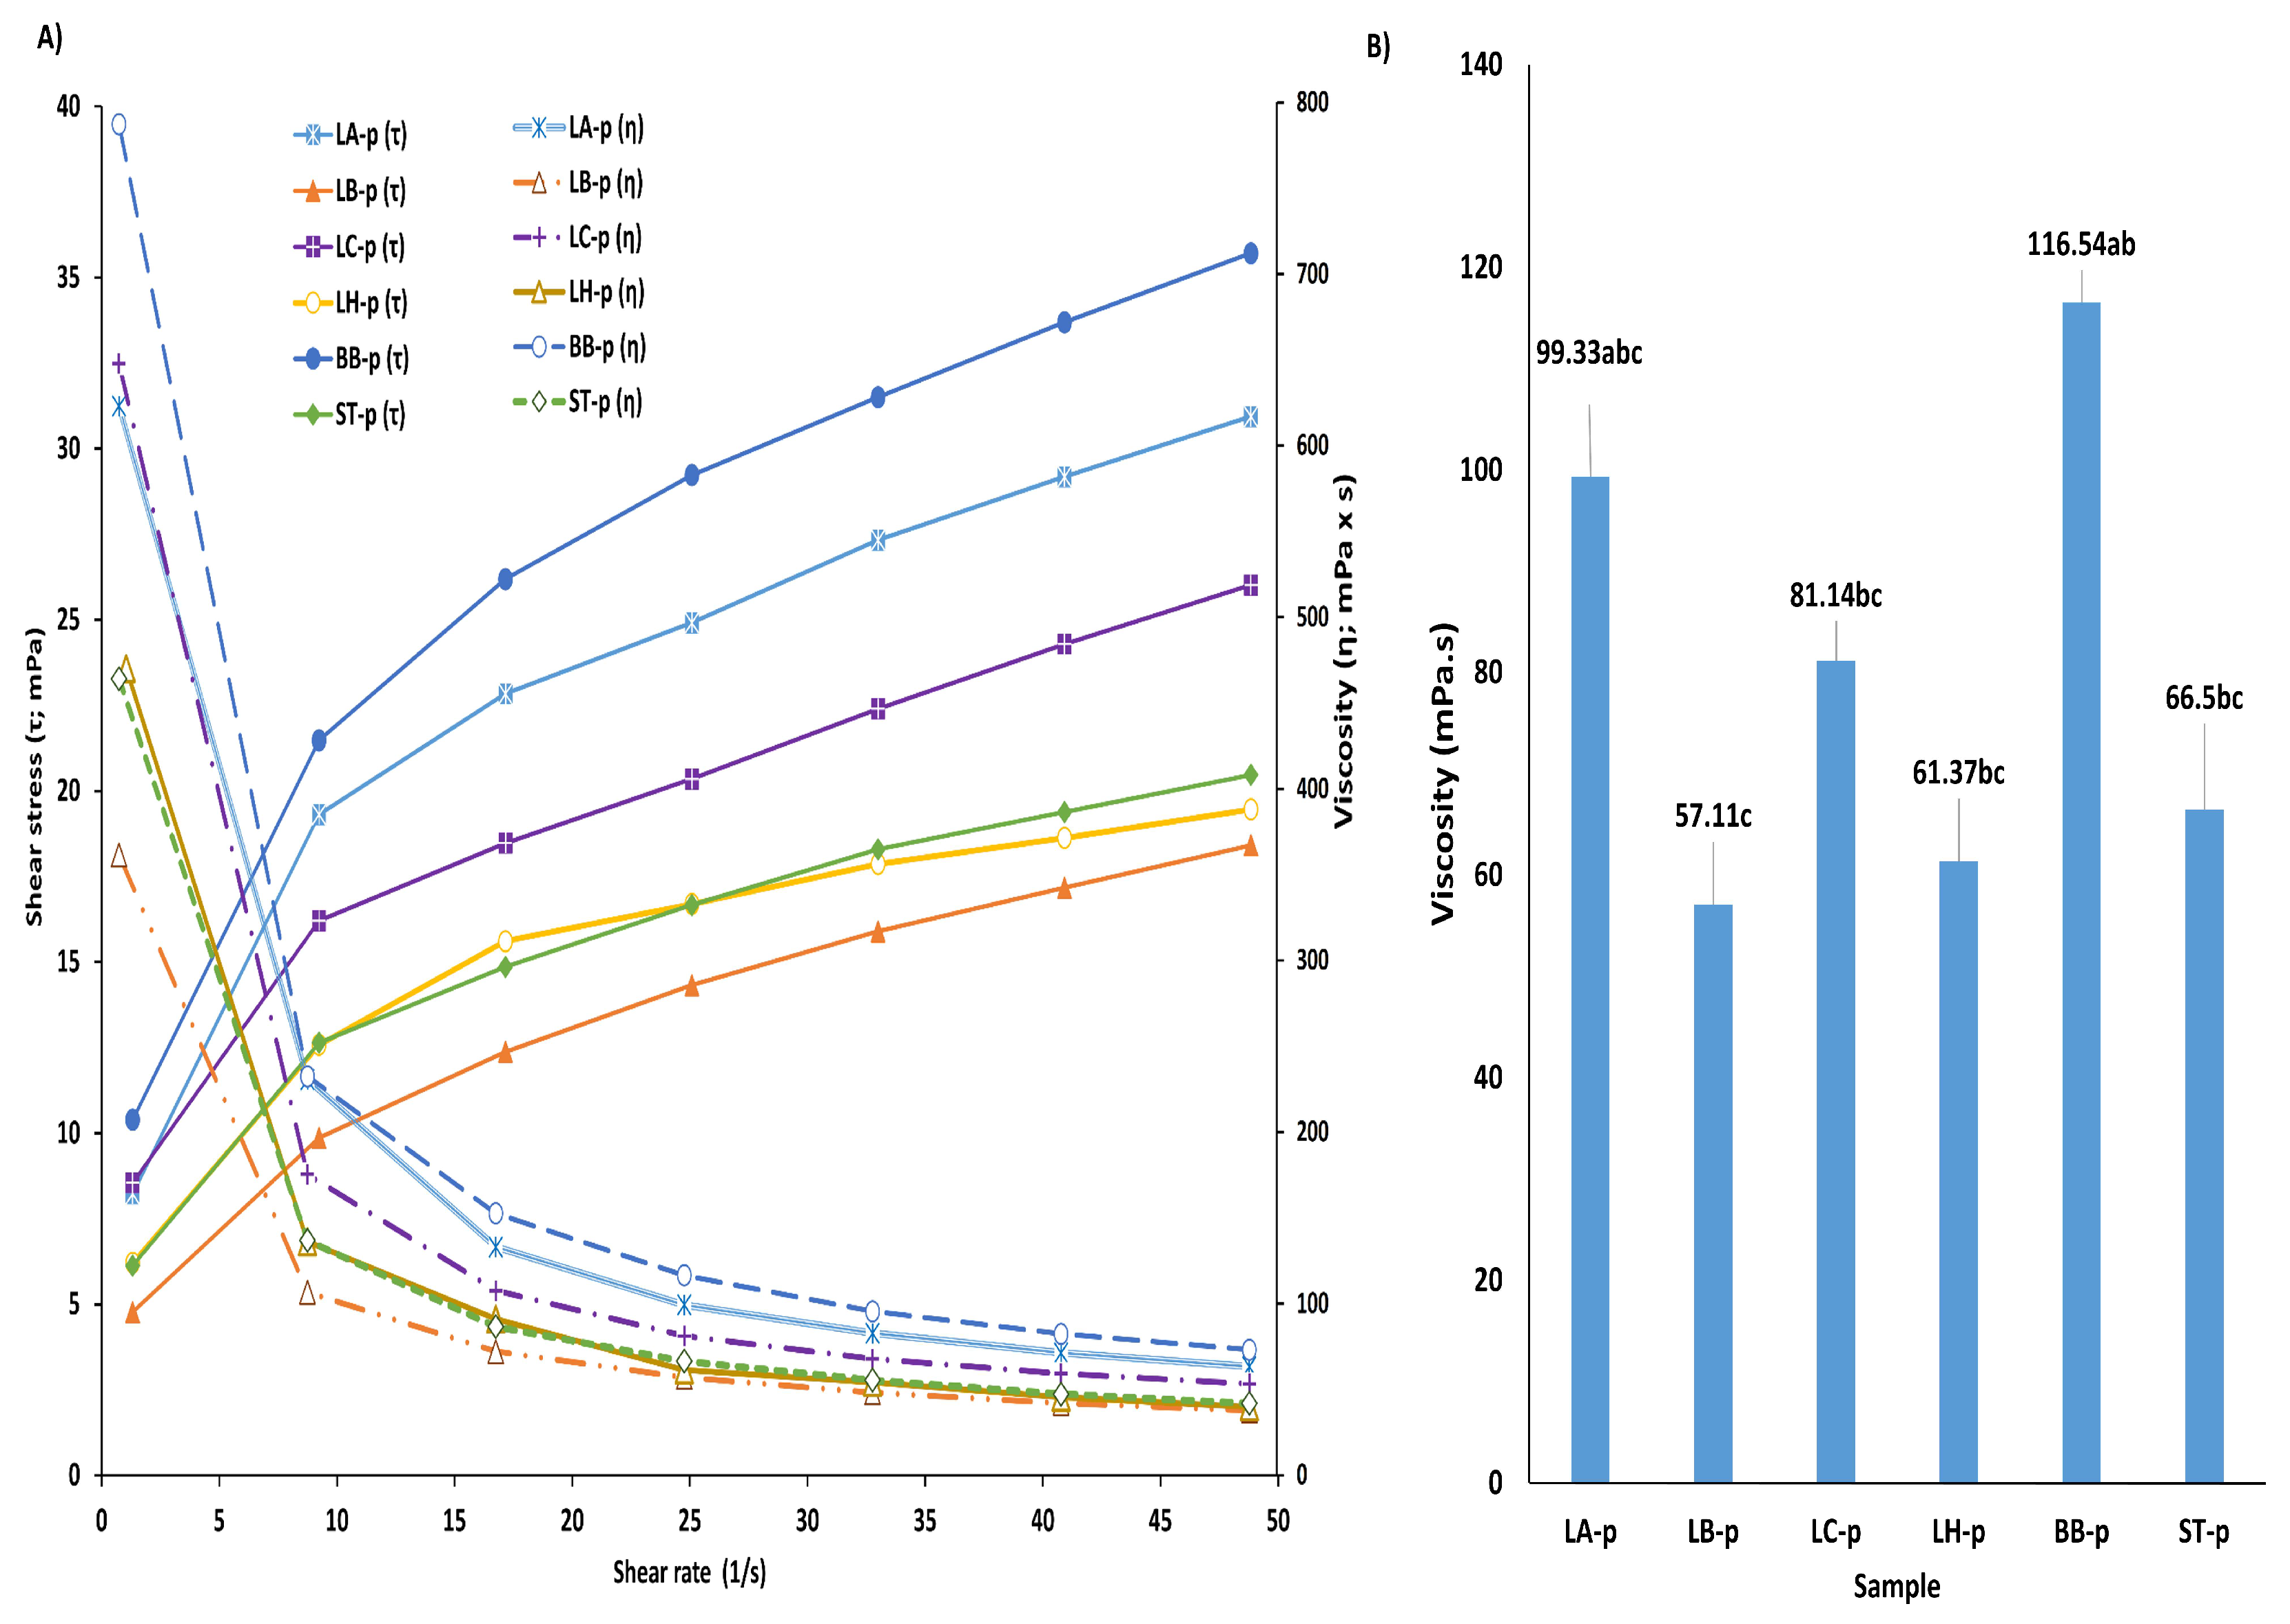
3.5. Rheological Properties of Fermented Samples

The flow behaviors of the products were determined based on shear stress and deformation velocity values. The behavior and viscosity values of the samples at 19 rpm (with a shear rate of 20 1/s) are shown in Figure 2A,B. The viscosity values of the products ranged from 57.11 to 116.54 mPa x s. The highest viscosity was observed in the BB-p product with the B. bifidum strain followed by the LA-p product with the L. acidophilus strain. This situation can be related to its production of EPS or other biopolymers, despite its low dry matter content [47,48]. A study conducted by Khedr et al. [49] also showed that the L. acidophilus strain used in this study is an EPS pro-ducer. On the other hand, the lowest viscosity value was recorded in the LB-p product with the L. bulgaricus strain. This can be attributed to the strong acid production of L. bulgaricus, which, according to the literature, does not produce EPS. The absence of EPS may lead to reduced protein aggregation and syneresis (whey separation), ultimately lowering viscosity [40]. Also, although differences in viscosity between cultures are generally attributed to EPS production, many other properties of the produced EPS, such as its unique structure, water binding ability, etc., also affect the product.
On the other hand, the LH-p (61.37 mPa s) and LC-p (81.14 mPa s) samples showed moderate viscosity levels. The L. casei strain in this study is notable for its EPS production, which significantly contributes to viscosity enhancement in fermented dairy applications [50]. However, the increase in viscosity is related to the EPS structure as mentioned above. The L. helveticus strain is primarily associated with proteolytic activity and flavor development, with a less pronounced effect on viscosity. S. thermophilus plays a crucial role in yogurt production and displayed moderate viscosity (66.5 mPa s). Its primary function during yogurt fermentation is to rapidly reduce pH, initiating protein gelation [51]. These characteristics collectively play a vital role in the development of fermented products.
In this study, the rheological properties of the samples were analyzed using the Power Law Model, due to the non-Newtonian flow behavior of the samples and the absence of yield stress [52,53]. The rheogram presented in Figure 2A illustrates the relationship between shear stress and deformation rates. According to this, all the products exhibited a pseudoplastic flow behavior in which the viscosity decreased with increasing share rates at a constant temperature (+4 °C), and it was described by a Herschel–Bulkley model. It is known that hydrodynamic forces generated during shear can lead to the breakdown of structural units and physical networks in the EPS chain structure [54]. Therefore, the shear-thinning data presented suggest that the EPS studied would be very suitable to improve the texture or palatability of food products. The order here is the same as in the viscosity evaluation.

3.6. The Volatile Compounds Related to the Aroma Profiles of the Fermented Samples

The results of the volatile aroma compounds analysis of the samples are presented in Table 4; a total of 46 volatile compounds were identified in the fermented products produced with different LAB, as commercial starter culture (Figure 3).
When examined in terms of chemical group, the BB-p sample has higher values than the other samples in the amount and diversity of alcohol and ester group compounds (p < 0.05). On the other hand, this sample has lower values than the others in terms of the amount and diversity of aldehyde, ketone, and carboxylic acid group compounds. In addition, the BB-p sample has higher values than the others in terms of the amount and diversity of ester group compounds. This situation differentiates the BB-p sample considerably from the others. When the compounds are examined separately, the first three compounds with quite high values, respectively, are phenethyl alcohol that has a fruit, honey, lilac, rose odor, ethanol, and 3-methyl-1 butanol that has a burnt, cocoa, floral, malt-type odor, followed by isobutyl alcohol that has an apple, bitter, cocoa, wine-type odor [55]. In addition, ethyl decanoate, which has a brandy, grape, pear-type odor, hexanoic acid, and acetaldehyde compounds are other compounds with high additive activity, to the BB-p aroma profile. Of all these compounds, especially the phenethyl alcohol, 3-methyl-1 butanol and ethanol compounds can be associated with the B. bifidum strain in this study.
The difference between the other samples, except the BB-p, was observed to be less. Among the other samples, the LH-p sample stands out in terms of the high aldehyde, ketone, and carboxylic acid amounts. On the other hand, in this order, the LC-p sample has ketone, carboxylic acid, and aldehyde groups, the LA-p sample has carboxylic acid group with a high value, then ketone, aldehyde groups, and alcohol groups, the LB-p sample has aldehyde, ketone, and carboxylic acid groups with an effect at an equal height level, followed by alcohol groups. Finally, the ST sample can be expressed with ketone, carboxylic acid, and alcohol groups at a similar height level. Additionally, the terpene group contributed to the differentiation of the profiles of the LC-p and the LH-p samples compared to the other samples, while the amount of pyrazine contributed to the differentiation of the profile of the LH-p sample.
As for the compounds being examined separately, in the LA-p, LB-p, LC-p, LH-p, and ST-p samples, the most important component in the LA-p sample was hexanoic acid (p < 0.05) with aroma notes of cheese, oil, pungent, and sour. Subsequent to, 2-methylbutanal, that has a natural, slight fruit-type odor, and 2-heptanone, that has a fruit and pungent-type odor were the next components; the compounds followed this order [55]. In addition, 2-nonanone that has a blue cheese, spicy, roquefort-type odor, nonyl methyl ketone that has a fresh, green, orange, and rose odor, and butanoic acid that has a cutter, cheese, and sour odor, are compounds that contributed to the aroma profile of this sample. On the other hand, ethanol, nonanal that has a fat, floral, green, and lemon-type odor, and acetone that has a pungent odor, compounds that have high values compared to other components, are among the compounds that differentiate and highlight the LA-p sample. Of these compounds, especially the hexanoic acid and 2-methylbutanal, in addition to acetone and nonanal compounds, can be associated with the L. acidophilus strain in this study. Even butanoic acid, nonyl methyl ketone, 2-heptanone, and 2-nonanone supported this profile.
In the LB-p sample, the most important component is hexanoic acid (p < 0.05). This is followed by 2-methylbutanal, 2-heptanone, and 2-nonanone. The compounds that contribute significantly to the difference and aroma profile with their high levels in this sample and low levels in the others are 2-furanmethanol that has a burnt, caramel, and cooked-type odor, and acetaldehyde that has a floral and green apple-type odor [55]. These compounds are followed by nonyl methyl ketone and butanoic acid. Of these compounds, especially the hexanoic acid, 2-methylbutanal, 2-furanmethanol, and acetaldehyde compounds can be associated with the L. bulgaricus strain in this study.
The LC-p and LH-p samples form volatile aroma compound profiles similar to the LB-p sample. So, similarly, the first three compounds that stand out with their high values in these samples (with close values (p > 0.05)) are hexanoic acid, 2-methylbutanal, and 2-heptanone. These compounds are followed by the 2-nonanone compound with a higher value in the LC-p sample than in all samples. At the same time, acetoin, d-limonene, with citrus and mint odor, and 2-pentanone, with fruit and pungent odor, compounds [55] ensured the differentiation of the LC-p sample from the other samples and made a significant contribution to its aroma profile with the high values detected (p < 0.05). In addition to these, the LH-p sample’s aroma profile differed from the LC-p sample due to the effect of the significant amount of benzaldehyde with bitter almond, burnt sugar, cherry, and malt flavor (p < 0.05). Of these compounds, especially the hexanoic acid, 2-methylbutanal, and 2-heptanone, in addition to the acetoin, d-limonene can be associated with the L. casei strain in this study. As for the L. helveticus strain, especially the hexanoic acid, 2-methylbutanal, and 2-heptanone, in addition to the benzaldehyde, can be associated with it.
As the last example, in the ST-p sample, like the other four fermented products, the compound with the highest value is hexanoic acid, followed by hexanol, which is again a high value and is not present in the others. In addition, while 2-heptanone, ethanol, 2-nonanone, and nonyl methyl ketone compounds also support the formation of the aroma profile of this product, especially acetoin and 2,3-pentanedione that impart a butter, strawberry, caramel, fruit, rum flavor, 1-butanol that has a fermented-type odor and a fruity-type flavor, and 3-methyl-2-butanone that has a creamy, dairy sweet oily, milky buttery odor, [55] compounds have high effects on the aroma of the ST-p sample, both in terms of their amounts and with significant differences (p < 0.05) from the amounts in the other samples. Of these compounds, especially the hexanoic acid, then hexanol, and in addition, the acetoin, 2,3-pentanedione, 1-butanol, and 3-methyl-2-butanone compounds can be associated with the S. termophilus strain in this study.
Some studies have been conducted on the contribution of LAB strains to aroma profiles, which has been an important topic in the literature in recent years. For example, in a study by Zareba et al. [56], two different dairy products were obtained, fermented and unfermented, after inoculation with L. casei culture, and the volatile compound profile of these samples were analyzed by headspace solid phase microextraction–gas chromatography–mass spectrometry. The peak area values of the milk sample fermented with L. casei culture on day 0 were found as 2-butanone 1.49%, 2-pentanone 4.68%, 2-heptanone 6.84%, 2-nonanone 1.45%, acetoin 0.32%, and ethanol 3.00%. In a study conducted by Dan et al. [57], volatile compounds of the fermented dairy product produced with L. bulgaricus culture were determined by SPME-GC-MS method. A total of 86 volatile flavor compounds were identified in the fermented milk product, including 17 carboxylic acids, 14 aldehydes, 13 ketones, 29 alcohols, 8 esters, and 5 aromatic hydrocarbon compounds. Various volatile flavor compounds (acetaldehyde, 3-methyl-butanal, 2-pentenal, hexanal, 2-octenal, nonanal, 2,3-butanedione, acetoin, 2-heptanone, 2-nonanone, and formic acid ethenyl ester) were identified due to their high odor activity values. On the other hand, in a study conducted by Li et al. [58], volatile components of fermented milk prepared with various culture combinations of S. thermophilus and L. plantarum or B. animalis were analyzed using SPME-GC-MS. In the fermented beverage produced with S. thermophilus culture, 2.3 butanedione was determined as 0.52%, acetylbenzene as 0.46%, benzaldehyde as 2.08%, nonanal as 0.29%, ethanol as 0.39%, 1-hexanol, 2-ethyl as 4.82%, benzylalcohol as 2.20%, 3-pentanol, 2-methyl as 0.99%, and total hydrocarbon as 3.06%. Finally, in a study conducted by Zhou et al. [47], volatile aroma compounds were determined in yogurts produced by adding L. helveticus culture using SPME-GC-MS. It was observed that yogurt with L. helveticus added had butanoic acid, 3-methylhexadecanoic acid, n-decanoic acid, propylene glycol, 1-hexanol, succindialdehyde, 2,3-butanedione, methyl isobutyl ketone, benzaldehyde, formic acid heptyl ester, delta-nonalactone, hexanediamide, and N, N′-di-benzoyloxy and its derivatives.
In the present study, according to the principal component analysis (PCA) (Figure 4), the relationship between the samples and the volatile aroma components was examined. According to these results, the BB-p sample was clearly separated from the others. As explained above, this result shows that the effect of the B. bifidum on the volatile aroma profile of the product is different from the others. In Figure 4, it is seen that the B. bifidum is correlated with the phenethyl alcohol, 3-methyl-1 butanol, and ethanol compounds. On the other hand, the LC-p sample also shows separation from the group, albeit with a small difference. It is seen that L. casei, which is effective in the production of this sample, is correlated with the compounds hexanol, 2-methylbutanal, 2-nonanone, 2-heptanone, the acetoin, and d-limonene. The hexanoic acid has a high positive correlation in all samples; however, this interaction is especially prominent in the LB and the LH samples. Therefore, this compound is most associated with the L. bulgaricus and the L. helveticus strains.
In the present study, when the PCA analysis was evaluated together with the volatile aroma profiles and the relative effect rates of the components, it was determined that the phenethyl alcohol, 3-methyl-1 butanol, and ethanol compounds were associated with the B. bifidum; the hexanoic acid and 2-methylbutanal compounds were assiciated with the L. acidophilus; the hexanoic acid, 2-methylbutanal, 2-furanmethanol, and acetaldehyde compounds were associated with the L. bulgaricus; and the hexanoic acid, 2-methylbutanal, and 2-heptanone, in addition to the acetoin and d-limonene, were assiciated with the L. casei. On the other hand, it is thought that the L. helveticus strain is associated with the hexanoic acid, 2-methylbutanal, and 2-heptanone, in addition to the benzaldehyde compounds; as for the S. termophilus strain, it is associated with the hexanoic acid, then hexanol, in addition to with the acetoin, 2,3-pentanedione, 1-butanol, and 3-methyl-2-butanone compounds.

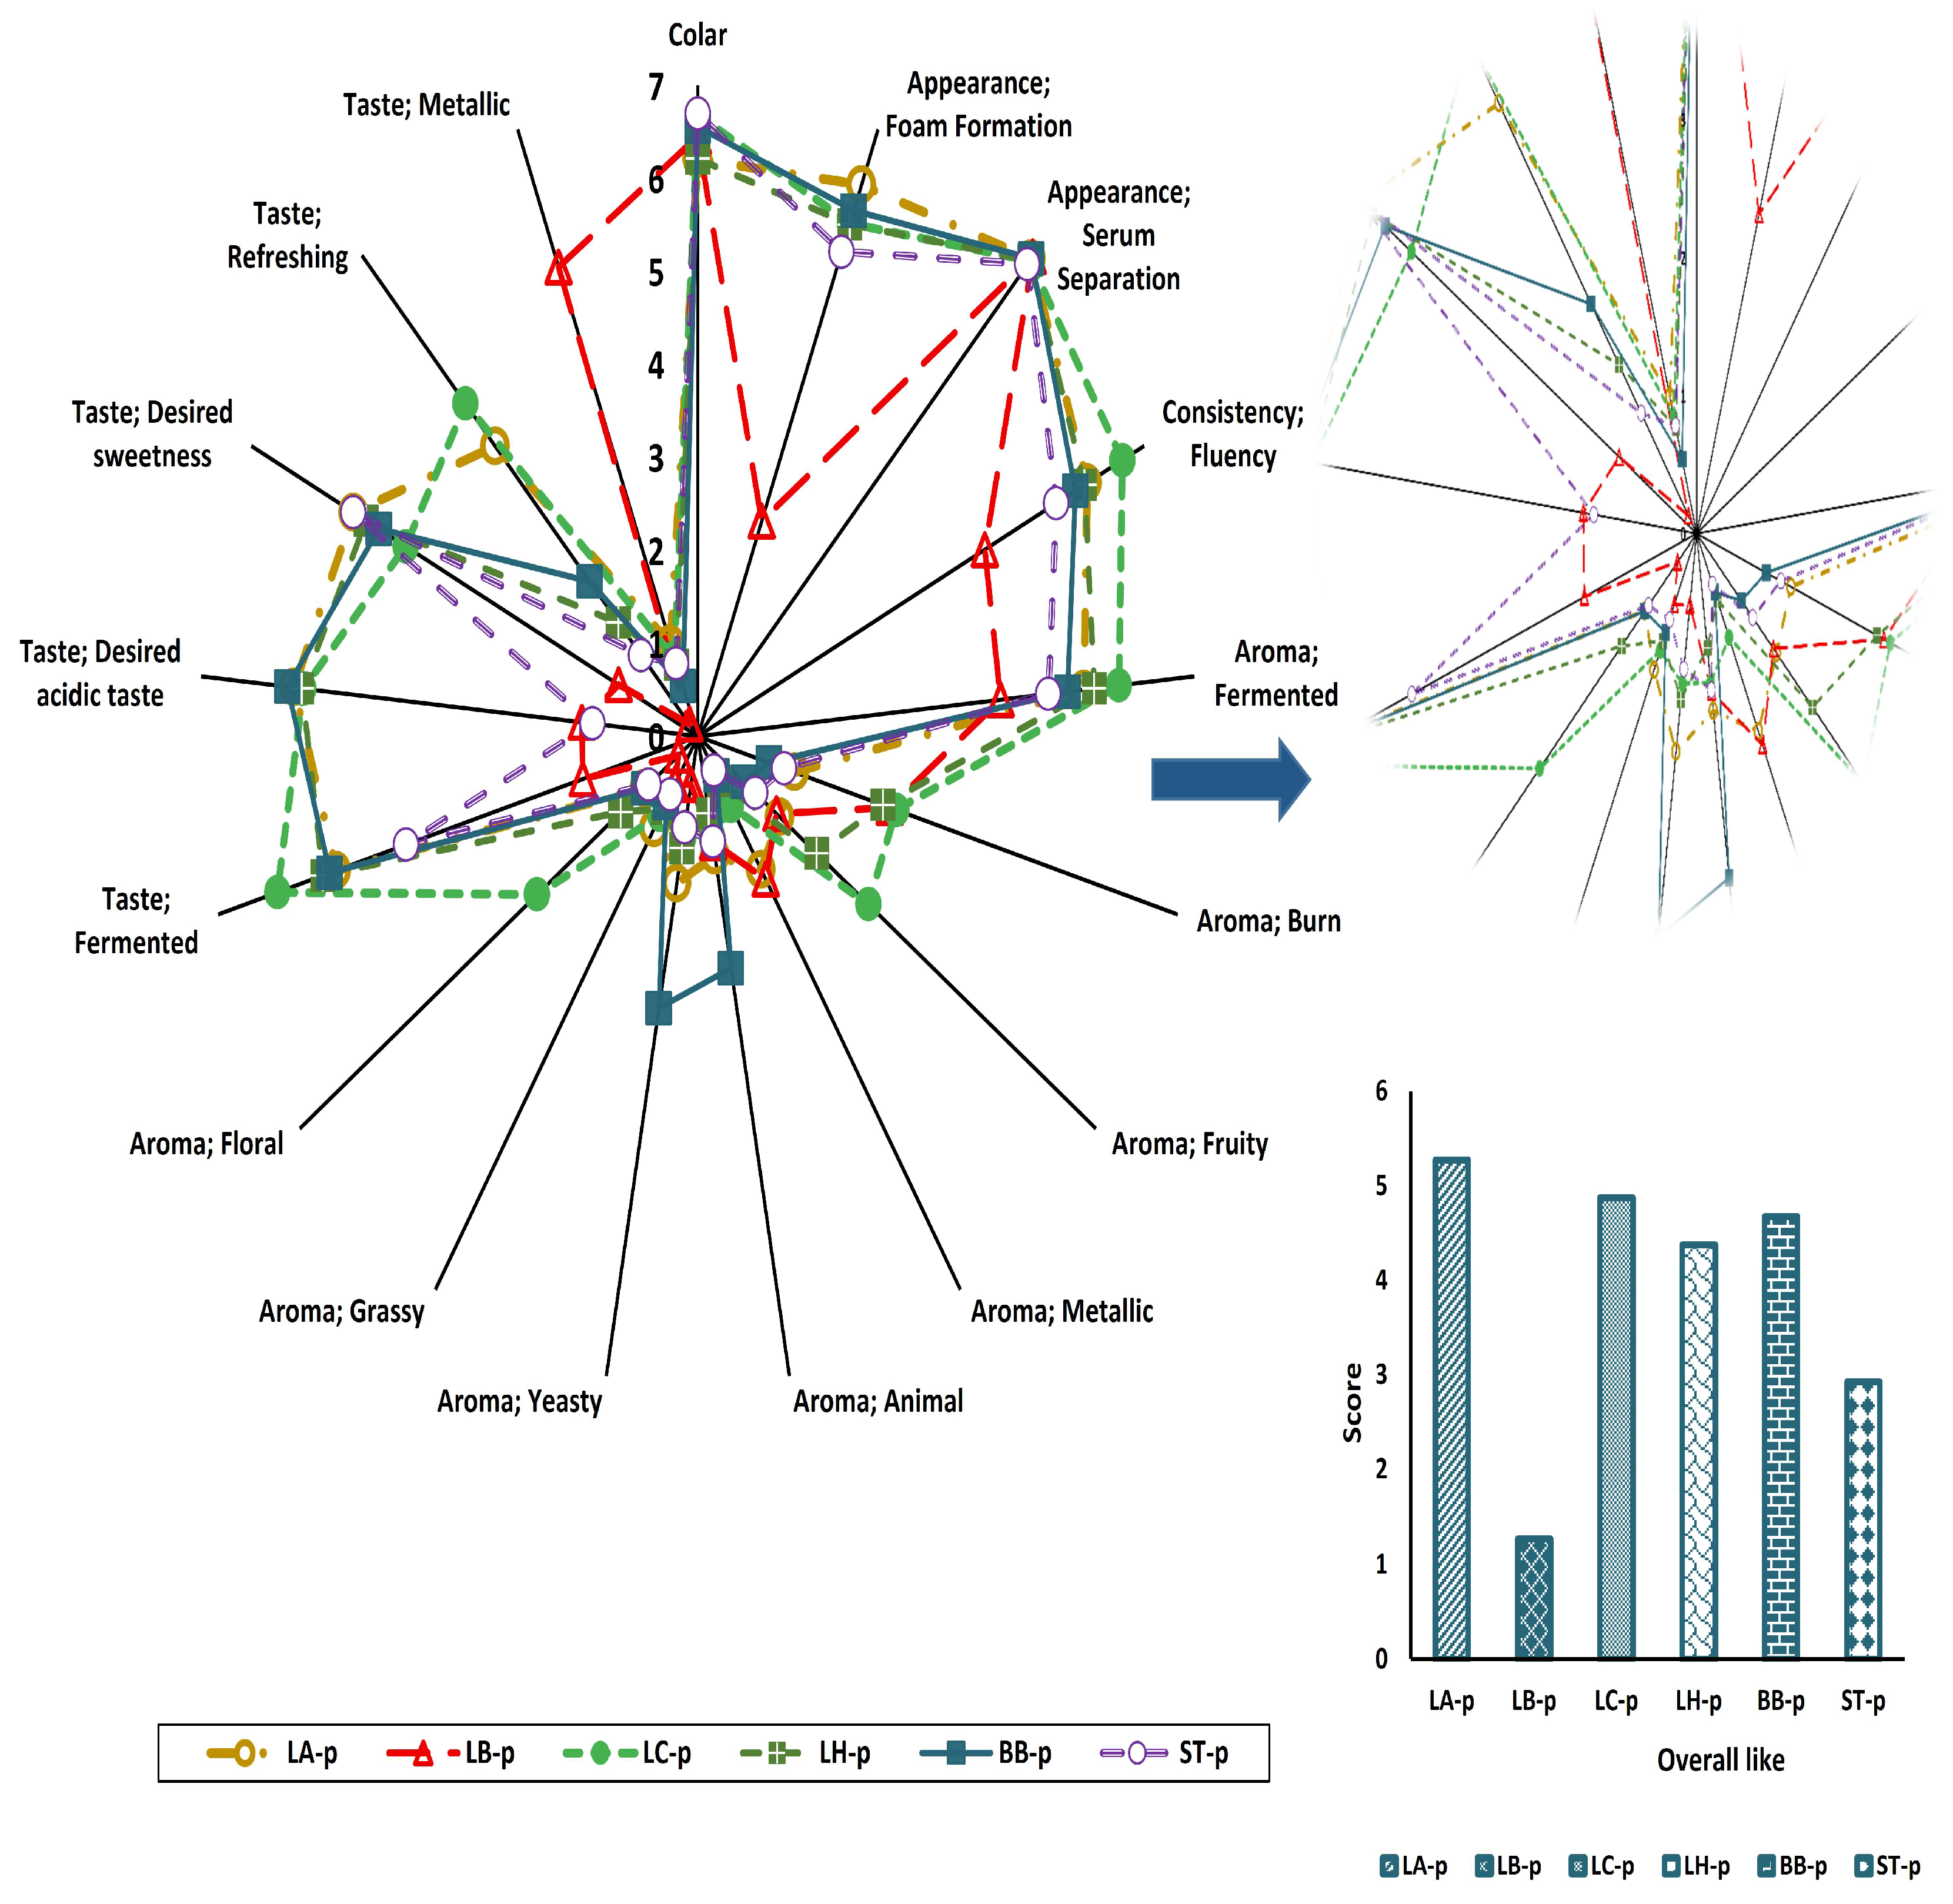
3.7. Sensory Profiles of Fermented Samples

The sensory analysis results of the samples were evaluated in terms of appearance, smell, and taste characteristics (Figure 5). There was no difference between samples in terms of color and serum separation from appearance parameters except from the LB-p sample. This sample received a significantly lower score, meaning that the L. bulgaricus strain showed poor foaming performance. Foam formation is generally associated with CO2. The low value of this strain in this category is due to factors such as the strain being a homofermentative bacterium and the strain’s slow reproduction rate. At fluency property from the consistency parameter, the LC-p received the highest score, while the LB-p received the lowest score. These results are consistent with the reological results of the LB-p product with the L. bulgaricus strain that has the low viscosity value and the LC-p product with the L. casei strain that has the high viscosity value.
When aroma attributes were evaluated, the LC-p had the highest fermented odor score, while the LB-p had a lower score, indicating that the L. casei strain produced a more intense fermented aroma. Regarding fruity aroma, the LC-p had the highest score, followed by the LH-p (p < 0.05). The BB-p and the ST-p had the lowest scores. These results are consistent with the aroma profiles of the samples. This suggests that the L. casei and L. helveticus strains are associated with fruity aroma. In terms of the desired acidic taste attribute, the LA-p, LC-p, and LH-p samples stood out, while in terms of the desired sweetness attribute, the same samples and, additionally, the ST-p sample stood out. In the refreshing taste attribute, the LC-p and ST-p samples had the highest scores. According to these results, the L. casei and S. thermophilus strains stood out for both sweetness and freshness, while the L. casei, L. helveticus, and L. acidophilus strains stood out for suitable fermented and acidic taste. On the other hand, in terms of yeasty and animalic aroma, the BB-p produced with the B. bifidum strain had a significantly higher score than the other samples (p < 0.05). This can be explained by the higher amount of 3-methyl-1-butanol detected in the aroma component profile. The burnt aroma is somewhat related to the L. acidophilus, L. helveticus, and L. casei strains due to 2-methylbutanal. This does not give a negative aroma to the product; on the contrary, it gives a slightly sweet caramel note.
According to the general sensory evaluation, the strains can be ranked as the L. acidophilus, followed by L. casei, L. helveticus, and B. bifidum. The L. bulgaricus and S. thermophilus strains were found to be the least liked.

4. Conclusions

This study provides a comprehensive evaluation of the fermentation performance of various LAB strains and their contributions to the quality of fermented products, especially fermented dairy products. The findings underscore the significant role of each strain’s unique metabolic capabilities in shaping the organoleptic, rheological, and functional characteristics of the final products. The L. acidophilus demonstrated a remarkable balance between lactic acid production and sensory acceptance, making it a prime candidate for enhancing the flavor and overall preference of fermented milk products. B. bifidum stood out for its ability to produce high viscosity, attributed to its exopolysaccharide production, and its distinctive aromatic profile. These traits highlight its potential in developing texturally rich and flavor-intense fermented products. Furthermore, the observed differences in organic acid and sugar metabolism across strains provide valuable insights into tailoring fermentation processes to achieve specific quality attributes. For instance, the high lactose consumption by the L. helveticus and its moderate rheological impact suggest its suitability in applications where enhanced textural properties are desired. As for aroma profiles, it is thought that the phenethyl alcohol, 3-methyl-1 butanol, and ethanol compounds are associated with the B. bifidum; the hexanoic acid and 2-methylbutanal compounds are associated with the L. acidophilus; the hexanoic acid, 2-methylbutanal, 2-furanmethanol, and acetaldehyde compounds are associated with the L. bulgaricus; and the hexanoic acid, 2-methylbutanal, and 2-heptanone, in addition to the acetoin and d-limonene, are associated with the L. casei. On the other hand, it is thought that the L. helveticus strain is associated with hexanoic acid, 2-methylbutanal, and 2-heptanone, as well as benzaldehyde compounds. The S. thermophilus strain is associated with hexanoic acid, hexanol, as well as acetoin, 2,3-pentanedione, 1-butanol, and 3-methyl-2-butanone compounds. Especially fruity aroma properties from aroma profiles were associated with the L. casei and the L. helveticus strains. This research also emphasizes the importance of selecting strains not only for their health-promoting attributes but also for their capacity to optimize product quality. By combining the functional benefits of these microorganisms with desirable sensory profiles, this study offers a pathway to develop innovative, consumer-preferred fermented products. The unique metabolic capacities of these prominent cultures have been revealed to play an important role in determining the aroma, organic acid content, viscosity, and overall quality of the products as a whole. Therefore, the findings of this study can provide the right strain selection for a fermented dairy product or a different non-dairy-based fermented product according to the desired functional properties. It also can provide a preliminary guide for inoculation in the right ratios as an adjunct culture or co-culture for a desired property. Limitations of this study are that the combined use of strains may produce different reactions and therefore different results, especially in terms of aroma profiles. Future research can explore the synergistic or antagonistic interactions of LAB strain combinations and their stability under different storage conditions. Additionally, investigating their effects on plant-based milk alternatives could provide insights for non-dairy fermentation. Optimizing vitamin production, bioavailability, and prebiotic interactions may further enhance the functional properties of fermented products. These studies can contribute to the development of tailored probiotic formulations for diverse food applications. These areas can provide valuable insights for optimizing LAB strains in various food production applications.

Author Contributions

Conceptualization, T.K.T.; Methodology, F.E.D. and E.Ç.D.; Validation, F.E.D.; Formal analysis, N.Ö. and E.Ç.D.; Investigation, T.K.T. and N.Ö.; Data curation, T.K.T.; Writing—original draft, T.K.T. and E.Ç.D.; Writing—review & editing, T.K.T. and N.Ö. All authors have read and agreed to the published version of the manuscript.

Funding

This research was funded by the Scientific Research Commission at Suleyman Demirel University, grant number FYL-2019-7016.

Institutional Review Board Statement

Not applicable.

Informed Consent Statement

As this study does not involve human subjects, obtaining informed consent is not required.

Data Availability Statement

The original contributions presented in this study are included in the article. Further inquiries can be directed to the corresponding author.

Conflicts of Interest

The authors declare no conflicts of interest.

References

  1. Abedin, M.M.; Chourasia, R.; Phukon, L.C.; Sarkar, P.; Ray, R.C.; Singh, S.P.; Rai, A.K. Lactic acid bacteria in the functional food industry: Biotechnological properties and potential applications. Crit. Rev. Food Sci. Nutr. 2024, 64, 10730–10748. [Google Scholar] [CrossRef] [PubMed]
  2. Sharma, R.; Garg, P.; Kumar, P.; Bhatia, S.K.; Kulshrestha, S. Microbial Fermentation and Its Role in Quality Improvement of Fermented Foods. Fermentation 2020, 6, 106. [Google Scholar] [CrossRef]
  3. Diez-Ozaeta, I.; Astiazaran, O.J. Fermented foods: An update on evidence-based health benefits and future perspectives. Food Res. Int. 2022, 156, 111133. [Google Scholar] [CrossRef]
  4. Bangar, S.P.; Tomar, M.; Singh, R.B.; Singh, P.; Kumar, M.; Chaudhary, V.; Trif, M.; Prajapati, U.; Dey, A.; Maqsood, S. Fermented dairy products: A food matrix to deliver bioactive compounds. J. Funct. Foods 2022, 89, 104906. [Google Scholar]
  5. Dopazo, V.; Musto, L.; de Melo Nazareth, T.; Lafuente, C.; Meca, G.; Luz, C. Revalorization of rice bran as a potential ingredient for reducing fungal contamination in bread by lactic acid bacterial fermentation. Food Biosci. 2024, 58, 103703. [Google Scholar] [CrossRef]
  6. Gizachew, S.; Van Beeck, W.; Spacova, I.; Dekeukeleire, M.; Alemu, A.; Woldemedhin, W.M.; Mariam, S.H.; Lebeer, S.; Engidawork, E. Antibacterial and Immunostimulatory Activity of Potential Probiotic Lactic Acid Bacteria Isolated from Ethiopian Fermented Dairy Products. Fermentation 2023, 9, 258. [Google Scholar] [CrossRef]
  7. Doo, H.; Kwak, J.; Keum, G.B.; Ryu, S.; Choi, Y.; Kang, J.; Lee, J.H. Lactic acid bacteria in Asian fermented foods and their beneficial roles in human health. Food Sci. Biotechnol. 2024, 33, 2021–2033. [Google Scholar] [CrossRef]
  8. Joshi, T.J.; Salini, S.V.; Mohan, L.; Nandagopal, P.; Arakal, J.J. Functional metabolites of probiotic lactic acid bacteria in fermented dairy products. Food Hum. 2024, 3, 100341. [Google Scholar]
  9. Li, C.; Peng, K.; Xiao, S.; Long, Y.; Yu, Q. The role of Lactobacillus in inflammatory bowel disease: From actualities to prospects. Cell Death Discov. 2023, 9, 361. [Google Scholar]
  10. Kang, M.J.; Baek, K.R.; Lee, Y.R.; Kim, G.H.; Seo, S.O. Production of vitamin K by wild-type and engineered microorganisms. Microorganisms 2022, 10, 554. [Google Scholar] [CrossRef]
  11. Khromova, N.Y.; Epishkina, J.M.; Karetkin, B.A.; Khabibulina, N.V.; Beloded, A.V.; Shakir, I.V.; Panfilov, V.I. The combination of in vitro assessment of stress tolerance ability, autoaggregation, and vitamin B-producing ability for new probiotic strain introduction. Microorganisms 2022, 10, 470. [Google Scholar] [CrossRef] [PubMed]
  12. Kumari, M.; Bhushan, B.; Kokkiligadda, A.; Kumar, V.; Behare, P.; Tomar, S.K. Vitamin B12 biofortification of soymilk through optimized fermentation with extracellular B12 producing Lactobacillus isolates of human fecal origin. Curr. Res. Food Sci. 2021, 4, 646–654. [Google Scholar]
  13. LeBlanc, J.G.; Laiño, J.E.; del Valle, M.J.; de Giori, G.S.; Sesma, F.; Taranto, M.P. B-group vitamins production by probiotic lactic acid bacteria. In Biotechnology of Lactic Acid Bacteria: Novel Applications; John Wiley & Sons: Hoboken, NJ, USA, 2015; pp. 279–296. [Google Scholar]
  14. Altuncu, V.; Kaymaz, A.; Ertekin Filiz, B.; Çubuk Demiralay, E.; Kök Taş, T. Evaluation of MENAQUINONE-7 and fat-soluble vitamin production by starter cultures during fermentation in dairy products using RPLC method. Food Sci. Nutr. 2024, 12, 9822–9833. [Google Scholar]
  15. Minari, G.D.; Piazza, R.D.; Sass, D.C.; Contiero, J. EPS Production by Lacticaseibacillus casei Using Glycerol, Glucose, and Molasses as Carbon Sources. Microorganisms 2024, 12, 1159. [Google Scholar] [CrossRef]
  16. Ali, M.S.; Darwish, A.A.; Hassan, M.A.; Hekal, S.A.; Abdel-Mobdy, A.E.; Bakry, A.M. Utilisation of Lacticaseibacillus casei ATCC 393-derived exopolysaccharide for camel milk yoghurt production and its potential anticancer and hepatoprotective properties. Int. J. Dairy Technol. 2024, 77, 792–803. [Google Scholar]
  17. Silva, L.A.; Lopes Neto, J.H.P.; Cardarelli, H.R. Exopolysaccharides produced by Lactobacillus plantarum: Technological properties, biological activity, and potential application in the food industry. Ann. Microbiol. 2019, 69, 321–328. [Google Scholar]
  18. Hu, S.M.; Zhou, J.M.; Zhou, Q.Q.; Li, P.; Xie, Y.Y.; Zhou, T.; Gu, Q. Purification, characterization and biological activities of exopolysaccharides from Lactobacillus rhamnosus ZFM231 isolated from milk. LWT 2021, 147, 111561. [Google Scholar]
  19. Abid, Y.; Azabou, S.; Blecker, C.; Gharsallaoui, A.; Corsaro, M.M.; Besbes, S.; Attia, H. Rheological and emulsifying properties of an exopolysaccharide produced by potential probiotic Leuconostoc citreum-BMS strain. Carbohydr. Polym. 2021, 256, 117523. [Google Scholar]
  20. Wen, L.; Yang, L.; Chen, C.; Li, J.; Fu, J.; Liu, G.; Cao, Y. Applications of multi-omics techniques to unravel the fermentation process and the flavor formation mechanism in fermented foods. Crit. Rev. Food Sci. Nutr. 2024, 64, 8367–8383. [Google Scholar]
  21. Kayitesi, E.; Onojakpor, O.; Moyo, S.M. Highlighting the impact of lactic-acid-bacteria-derived flavours or aromas on sensory perception of African fermented cereals. Fermentation 2023, 9, 111. [Google Scholar] [CrossRef]
  22. Duran, F.E.; Özdemir, N.; Güneşer, O.; Kök-Taş, T. Prominent strains of kefir grains in the formation of volatile compound profile in milk medium; the role of Lactobacillus kefiranofaciens subsp. kefiranofaciens, Lentilactobacillus kefiri and Lentilactobacillus parakefiri. Eur. Food Res. Technol. 2022, 248, 975–989. [Google Scholar]
  23. Gao, H.; Yang, B.; Stanton, C.; Ross, R.P.; Zhang, H.; Chen, H.; Chen, W. Linoleic acid induces different metabolic modes in two Bifidobacterium breve strains with different conjugated linoleic acid-producing abilities. LWT 2021, 142, 110974. [Google Scholar]
  24. Guo, S.; Chen, M.; Wu, T.; Liu, K.; Zhang, H.; Wang, J. Probiotic Bifidobacterium animalis ssp. lactis Probio-M8 improves the properties and organic acid metabolism of fermented goat milk. J. Dairy Sci. 2022, 105, 9426–9438. [Google Scholar] [PubMed]
  25. ICH. Validation of Analytical Procedures: Text and MethodologyQ2 (R1) Harmonized Tripartite Guideline; ICH: Geneva, Switzerland, 2005. [Google Scholar]
  26. ISO 6658; Sensory Analysis—Methodology—General Guidance. International Organization for Standardization: Geneva, Switzerland, 2017.
  27. Rezaei, A.; Alirezalu, K.; Damirchi, S.A.; Hesari, J.; Papademas, P.; Domínguez, R.; Lorenzo, J.M.; Yaghoubi, M. Effect of Pasteurization and Ripening Temperature on Chemical and Sensory Characteristics of Traditional Motal Cheese. Fermentation 2020, 6, 95. [Google Scholar] [CrossRef]
  28. Wang, Y.; Wu, J.; Lv, M.; Shao, Z.; Hungwe, M.; Wang, J.; Bai, X.; Xie, J.; Wang, Y.; Geng, W. Metabolism Characteristics of Lactic Acid Bacteria and the Expanding Applications in Food Industry. Front. Bioeng. Biotechnol. 2021, 9, 612285. [Google Scholar] [CrossRef]
  29. Shah, N.P. Functional Cultures and Health Benefits. In Probiotic Dairy Products, 2nd ed.; Tamime, A.Y., Ed.; Blackwell Publishing: Oxford, UK, 2007; pp. 27–58. [Google Scholar]
  30. Vodnar, D.C.; Paucean, A.; Dulf, F.V.; Socaciu, C. HPLC characterization of lactic acid formation and FTIR fingerprint of probiotic bacteria during fermentation processes. Not. Bot. Horti Agrobot. 2010, 38, 109–113. [Google Scholar]
  31. Rivière, A.; Selak, M.; Lantin, D.; Leroy, F.; De Vuyst, L. Bifidobacteria and Butyrate-Producing Colon Bacteria: Importance and Strategies for Their Stimulation in the Human Gut. Front. Microbiol. 2016, 7, 979. [Google Scholar]
  32. Ranadheera, R.D.; Baines, S.K.; Adams, M.C. Importance of Food in Probiotic Efficacy. Food Res. Int. 2012, 48, 356–361. [Google Scholar]
  33. Siddiqi, M.; Tarrah, A.; Chen, Z.H.; LaPointe, G. Phenotypic Differentiation of Streptococcus thermophilus and Lactobacillus delbrueckii subsp. bulgaricus Isolates Found in Yogurt Starter Cultures. Fermentation 2024, 10, 601. [Google Scholar] [CrossRef]
  34. Özcelik, S.; Kuley, E.; Özogul, F. Formation of lactic, acetic, succinic, propionic, formic and butyric acid by lactic acid bacteria. LWT 2016, 73, 536–542. [Google Scholar]
  35. Li, H.; Pajor, A.M. Functional characterization of CitM, the Mg2+-citrate transporter. J. Membr. Biol. 2002, 185, 9–16. [Google Scholar] [CrossRef] [PubMed]
  36. Bangar, S.P.; Suri, S.; Trif, M.; Ozogul, F. Organic acids production from lactic acid bacteria: A preservation approach. Food Biosci. 2022, 46, 101615. [Google Scholar]
  37. Smit, G.; Smit, B.A.; Engels, W.J.M. Flavor Formation by Lactic Acid Bacteria and Biochemical Flavor Profiling of Cheese Products. FEMS Microbiol. Rev. 2005, 29, 591–610. [Google Scholar] [CrossRef] [PubMed]
  38. Moiseenko, K.V.; Glazunova, O.A.; Savinova, O.S.; Shabaev, A.V.; Fedorova, T.V. Changes in composition of some bioactive molecules upon inclusion of Lacticaseibacillus paracasei probiotic strains into a standard yogurt starter culture. Foods 2023, 12, 4238. [Google Scholar] [CrossRef]
  39. Sánchez, B.; Delgado, S.; Blanco-Míguez, A.; Lourenço, A.; Gueimonde, M.; Margolles, A. Probiotics, Gut Microbiota, and Their Influence on Host Health and Disease. Mol. Nutr. Food Res. 2017, 61, 1600240. [Google Scholar] [CrossRef]
  40. Tamime, A.Y.; Robinson, R.K. Yoghurt: Science and Technology, 3rd ed.; Woodhead Publishing: Cambridge, UK, 2007. [Google Scholar]
  41. Chramostová, K.; Štětina, J.; Čurda, L. Effect of Cultivation Conditions on Organic Acid Production by Probiotic Strains. Czech J. Food Sci. 2014, 32, 521–526. [Google Scholar]
  42. Hemme, D.; Foucaud-Scheunemann, C. Leuconostoc: Characteristics, Use in Dairy Technology and Prospects in Functional Foods. Int. Dairy J. 2004, 14, 467–494. [Google Scholar] [CrossRef]
  43. Ollilainen, V.; Heinonen, M.; Linkola, E.; Varo, P.; Koivistoinen, P. Carotenoids and Retinoids in Finnish Foods: Dairy Products and Eggs. J. Dairy Sci. 1989, 72, 2257–2265. [Google Scholar] [CrossRef]
  44. Schmid, A.; Walther, B. Natural Vitamin D Content in Animal Products. Adv. Nutr. 2013, 4, 453–462. [Google Scholar] [CrossRef]
  45. Kaushik, S.; Wander, R.; Leonard, S.; German, B.; Traber, M.G. Removal of Fat from Cow’s Milk Decreases the Vitamin E Contents of the Resulting Dairy Products. Lipids 2001, 36, 73–78. [Google Scholar] [CrossRef]
  46. Elder, S.J.; Haytowitz, D.B.; Howe, J.; Peterson, J.W.; Booth, S.L. Vitamin K Contents of Meat, Dairy, and Fast Food in the U.S. Diet. J. Agric. Food Chem. 2006, 54, 463–467. [Google Scholar] [PubMed]
  47. Zhou, T.; Huo, R.; Kwok, L.Y.; Li, C.; Ma, Y.; Mi, Z.; Chen, Y. Effects of Applying Lactobacillus helveticus H9 as Adjunct Starter Culture in Yogurt Fermentation and Storage. J. Dairy Sci. 2019, 102, 223–235. [Google Scholar] [PubMed]
  48. Santos, A.; San Mauro, M.; Sanchez, A.; Torres, J.M.; Marquina, D. The Antimicrobial Properties of Different Strains of Lactobacillus spp. Isolated from Kefir. Syst. Appl. Microbiol. 2003, 26, 434–443. [Google Scholar] [CrossRef]
  49. Khedr, O.M.; El-Sonbaty, S.M.; Moawed, F.S.; Kandil, E.I.; Abdel-Maksoud, B.E. Lactobacillus acidophilus ATCC 4356 Exopolysaccharides Suppresses Mediators of Inflammation through the Inhibition of TLR2/STAT-3/P38-MAPK Pathway in DEN-Induced Hepatocarcinogenesis in Rats. Nutr. Cancer 2022, 74, 1037–1047. [Google Scholar] [CrossRef] [PubMed]
  50. De Vuyst, L.; Degeest, B. Heteropolysaccharides from Lactic Acid Bacteria. FEMS Microbiol. Rev. 1999, 23, 153–177. [Google Scholar]
  51. Ranadheera, C.S.; Evans, C.A.; Adams, M.C.; Baines, S.K. Probiotic Viability and Physico-Chemical and Sensory Properties of Plain and Stirred Fruit Yogurts Made from Goat’s Milk. Food Chem. 2012, 135, 1411–1418. [Google Scholar]
  52. Joyner, H.S.; Daubert, C.R. Rheological Principles for Food Analysis. In Food Analysis Laboratory Manual; Nielsen, S.S., Ed.; Springer: Cham, Switzerland, 2017; pp. 207–220. [Google Scholar]
  53. Penna, A.L.B.; Buriti, F.C.A.; de Oliveira, M.N. Rheological properties and microstructure of fat-free plain yogurt prepared with whey protein concentrate. Int. J. Dairy Technol. 2000, 53, 131–136. [Google Scholar]
  54. Zarour, K.; Llamas, M.G.; Prieto, A.; Aznar, R.; Ferrer, S.; Zúñiga, M. Rheological properties and exopolysaccharide characterization of nonropy lactic acid bacteria isolated from wine. J. Agric. Food Chem. 2013, 61, 6538–6548. [Google Scholar]
  55. FEMA. Flavor and Extract Manufacturers Association (FEMA). FEMA. 2025. Available online: https://www.femaflavor.org/ (accessed on 24 February 2025).
  56. Zareba, S.; Ziarno, M.; Obiedzinski, M.W. Volatile compound profile in fermented and unfermented milk inoculated with Lactobacillus casei. Int. Dairy J. 2014, 39, 182–189. [Google Scholar]
  57. Dan, T.; Chen, H.; Li, T.; Tian, J.; Ren, W.; Zhang, H.; Chen, W. Volatile flavor compounds profile and fermentation characteristics of milk fermented by Lactobacillus delbrueckii subsp. bulgaricus strains. Front. Microbiol. 2019, 10, 2183. [Google Scholar]
  58. Li, T.; Tian, Y.; Zhao, B.; Zhang, H.; Chen, W.; Chen, H. Comparative study of volatile compounds in fermented milk produced by Lactobacillus plantarum or Bifidobacterium animalis subsp. lactis combined with Streptococcus thermophilus. Molecules 2019, 24, 4184. [Google Scholar]
Figure 1. Production of fermented products with the six featured strains.
Fermentation 11 00165 g001
Figure 2. Rheograms of fermented samples (A), viscosity values of fermented samples at shear rate of 20 1/s (B). LA-p: was fermented with L. acidophilus, LB-p: was fermented with L. bulgaricus, LC-p: was fermented with L. casei, LH-p: was fermented with L. helveticus, BB-p: was fermented with B. bifidum, and ST-p: was fermented with S. thermophiles (A). Each parameter was evaluated separately, and there was a statistically significant difference between groups that did not have a common letter (a–c) (p < 0.05). Confidence interval of the arithmetic mean with a probability of 95% (B).
Fermentation 11 00165 g002
Figure 3. Percentage distribution of volatile aroma compounds (VACs) of fermented samples (µg/L).
Fermentation 11 00165 g003
Figure 4. Results of principal component analysis (PCA) performed on the volatile compounds profiles of the samples.
Fermentation 11 00165 g004
Figure 5. Sensory evaluation of fermented samples.
Fermentation 11 00165 g005
Table 1. Chemical and microbiological contents of the fermented samples.
Fermented
Samples
LAB
(log CFU/mL)
Solid
(%)
pHTitration Acidity (%)Incubation Time (hour)
* LA-p 9.17 ± 0.03 ab**9.70 ± 0.22 b4.62 ± 0.01 a0.90 ± 0.05 ab18
LB-p9.52 ± 0.28 a9.98 ± 0.05 a4.62 ± 0.02 a0.84 ± 0.11 b25
LC-p9.23 ± 0.09 ab9.78 ± 0.04 ab4.63 ± 0.02 a0.98 ± 0.09 a20
LH-p8.58 ± 0.15 c10.02 ± 0.04 a4.62 ± 0.03 a0.86 ± 0.07 b28
BB-p9.16 ± 0.02 ab9.66 ± 0.32 b4.61 ± 0.02 a0.82 ± 0.07 b16
ST-p9.05 ± 0.08 bc9.92 ± 0.03 a4.62 ± 0.02 a0.76 ± 0.04 c28
* LA-p: was fermented with L. acidophilus, LB-p: was fermented with L. bulgaricus, LC-p: was fermented with L. casei, LH-p: was fermented with L. helveticus, BB-p: was fermented with B. bifidum, and ST-p: was fermented with S. thermophilus. ** Each parameter was evaluated separately, and there was a statistically significant difference between groups that did not have a common letter (a–c) (p < 0.05). Confidence interval of the arithmetic mean with a probability of 95%.
Table 2. Organic acid composition (A), sugar composition (B), and vitamin A, D, E, K contents (C) of the fermented samples.
(A) Organic Acid Profiles of the Fermented Samples **  (g/100 mL)
Fermented SamplesLactic AcidAcetic AcidSitric AcidFormic Acid
* LA-p0.744 ± 0.028 ab**0.543 ± 0.065 c0.098 ± 0.035 c0.152 ± 0.015 ab
LB-p0.637 ± 0.004 bc0.523 ± 0.003 c0.166 ± 0.001 a0.163 ± 0.014 a
LC-p0.783 ± 0.066 a0.559 ± 0.032 b0.068 ± 0.001 d0.131 ± 0.011 b
LH-p0.668 ± 0.016 bc0.551 ± 0.028 b0.125 ± 0.007 b0.134 ± 0.006 b
BB-p0.722 ± 0.044 b0.607 ± 0.044 a0.166 ± 0.009 a0.164 ± 0.009 a
ST-p0.574 ± 0.044 c0.594 ± 0.004 a0.168 ± 0.012 a0.139 ± 0.008 b
(B) Sugar Profiles of the Fermented Samples **   (g/100 mL)
Fermented SamplesGlucoseLactoseGalactose
* LA-p0.674 ± 0.098 a1.963 ± 0.322 ab0.124 ± 0.008 bc
LB-p0.672 ± 0.333 a1.867 ± 0.617 b0.276 ± 0.069 a
LC-p0.453 ± 0.222 c1.704 ± 0.351 b0.093 ± 0.003 c
LH-p0.453 ± 0.180 c2.151 ± 0.393 a0.118 ± 0.007 bc
BB-p0.456 ± 0.207 c1.878 ± 0.361 b0.103 ± 0.004 c
ST-p0.592 ± 0.258 b2.085 ± 0.610 ab0.184 ± 0.028 b
(C) Vitamin A, D, E, K1, and K2 Contents of the Fermented Samples **  (µg/mL)
Fermented
Samples
Vitamin AVitamin DVitamin EVitamin K1Vitamin K2
* LA-p31.083 ± 0.041 ax3.723 ± 0.043 e1.009 ± 0.006 b0.232 ± 0.002 d0.070 ± 0.008 a
LB-p16.326 ± 0.013 d5.070 ± 0.012 c0.949 ± 0.002 c0.704 ± 0.009 b0.030 ± 0.003 c
LC-p23.893 ± 0.009 b7.073 ± 0.044 a1.087 ± 0.005 b0.803 ± 0.006 a0.014 ± 0.006 d
LH-p16.549 ± 0.054 d3.854 ± 0.008 e0.976 ± 0.002 c0.644 ± 0.011 c0.048 ± 0.001 b
BB-p20.119 ± 0.014 c4.667 ± 0.102 d1.135 ± 0.004 a0.805 ± 0.015 a0.028 ± 0.006 c
ST-p13.253 ± 0.066 e6.448 ± 0.017 b0.972 ± 0.007 c0.869 ± 0.003 a0.029 ± 0.008 c
* LA-p: was fermented with L. acidophilus, LB-p: was fermented with L. bulgaricus, LC-p: was fermented with L. casei, LH-p: was fermented with L. helveticus, BB-p: was fermented with B. bifidum, and ST-p: was fermented with S. thermophilus. ** Each parameter was evaluated separately, and there was a statistically significant difference between groups that did not have a common letter (a–e) (p < 0.05). x Confidence interval of the arithmetic mean with a probability of 95%.
Table 3. Calibration data of studied compounds.
Calibration DataLinearity Range (μg/mL)Slope (μg/mL)Intercept (μg/mL) rLOD (μg/mL)LOQ (μg/mL)
Compounds
Vitamin A1.0–5012,78913,9130.9990.2690.977
Vitamin D0.5–1544,4231567.70.9990.0900.300
Vitamin E0.25–7.548,61154,3280.9990.0620.208
Vitamin K10.15–5.023,001−21110.9990.0400.132
Vitamin K2
(MK-7)
0.02–0.5111,582−1804.30.9990.0030.011
Lactic Acid500–3000574.30−35,6010.999374.8341249.450
Acetic Acid250–1250547.015814.70.99921.02370.077
Sitric Acid50–3001416.30−40,2740.99910.13933.798
Formic Acid100–500908.21−2836.500.99918.90763.023
Glucose100–25001255.40−60,9240.99925.26384.543
Lactose500–75001755.30−79,3110.99976.322254.407
Galactose100–12502237.50−252,4600.99912.14340.477
Table 4. Volatile aroma compounds (VACs) of the fermented samples (µg/L).
Chemical NamesSample
  • Aldehyde
BB-pLA-pLB-pLC-pLH-pST-p
Acetaldehyde1.64 ± 0.08 a*0.21 ± 0.09 c1.28 ± 0.49 an.d.0.60 ± 0.11 b0.40 ± 0.06 bc
Benzaldehyden.d.0.23 ± 0.080.13 ± 0.18n.d.2.68 ± 1.92 a0.15 ± 0.21 c
2-Methylbutanal0.76 ± 0.04 f2.24 ± 0.15 d5.06 ± 0.18 c6.10 ± 0.18 b7.39 ± 0.38 a1.26 ± 0.21 e
3-Methylbutanal0.24 ± 0.02 bn.d.0.19 ± 0.07 cn.d.0.20 ± 0.09 c0.36 ± 0.03 a
Nonanal0.11 ± 0.15 c0.50 ± 0.71 a0.29 ± 0.05 bn.d.0.50 ± 0.21 a0.15 ± 0.02 c
Octanaln.d.n.d.0.11 ± 0.04n.d.n.d.n.d.
Total2.743.187.066.1011.372.32
  • Ketone
BB-pLA-pLB-pLC-pLH-pST-p
2(5H)-Furanonen.d.n.d.0.11 ± 0.05n.d.n.d.n.d.
Diacetyl0.14 ± 0.02 bn.d.n.d.n.d.n.d.0.54 ± 0.07 a
Acetoin1.10 ± 0.36 b0.15 ± 0.21 b0.29 ± 0.01 c2.35 ± 0.25 a0.05 ± 0.071.17 ± 0.04 b
3-Methyl-2-butanonen.d.0.25 ± 0.03 c0.32 ± 0.06 bn.d.n.d.0.50 ± 0.07 a
2-Heptanone0.49 ± 0.09 c1.31 ± 0.05 b1.46 ± 0.16 b3.37 ± 0.713.47 ± 1.53 a1.57 ± 0.21 b
2-Nonanone0.50 ± 0.07 e1.00 ± 0.08 d1.71 ± 0.18 c6.27 ± 0.55 a3.58 ± 1.55 b1.41 ± 0.09 cd
2-Nonen-4-onen.d.n.d.0.44 ± 0.04n.d.n.d.n.d.
2-Pentanonen.d.0.11 ± 0.15 cn.d.0.72 ± 0.11 a0.34 ± 0.17 bn.d.
Acetonen.d.0.44 ± 0.02 b0.34 ± 0.13 bc0.27 ± 0.07 c0.59 ± 0.04 a0.30 ± 0.09 c
2-Tridecanonen.d.n.d.0.09 ± 0.130.24 ± 0.04n.d.n.d.
3-Undecen-2-onen.d.n.d.n.d.0.27 ± 0.09n.d.n.d.
2,3-Pentanedionen.d.n.d.n.d.n.d.n.d.0.71 ± 0.02
Methyl undecyl ketonen.d.0.27 ± 0.08 b0.12 ± 0.07 c0.14 ± 0.02 c0.39 ± 0.05 a0.40 ± 0.06 a
Nonyl methyl ketone0.26 ± 0.07 d0.87 ± 0.05 c0.71 ± 0.18 c1.20 ± 0.22 b1.16 ± 0.68 a1.07 ± 0.52 b
Total2.524.435.5214.919.657.76
  • Alcohol
BB-pLA-pLB-pLC-pLH-pST-p
1-Butanoln.d.n.d.n.d.n.d.n.d.0.66 ± 0.03 a
3-Methyl-1-butanol44.42 ± 3.15n.d.n.d.n.d.n.d.n.d.
1-Propanoln.d.n.d.n.d.n.d.n.d.0.45 ± 0.09
Isobutyl alcohol4.20 ± 2.94n.d.n.d.n.d.n.d.n.d.
2-Furanmethanoln.d.0.10 ± 0.15 d1.84 ± 0.90 a0.10 ± 0.14 b0.60 ± 0.02 cn.d.
Phenethyl alcohol77.68 ± 3.04n.d.n.d.n.d.n.d.n.d.
Capryl alcohol0.34 ± 0.08n.d.n.d.n.d.n.d.n.d.
Ethanol64.07 ± 5.23 a0.58 ± 0.27 c0.24 ± 0.08 d0.12 ± 0.07 e0.46 ± 0.07 c1.30 ± 0.14 b
Hexanol0.76 ± 0.07n.d.n.d.n.d.n.d.3.64 ± 0.08
Lauryl alcoholn.d.0.18 ± 0.05n.d.n.d.n.d.n.d.
Nonan-2-oln.d.n.d.0.32 ± 0.01n.d.n.d.n.d.
Total191.470.862.400.221.066.05
  • Carboxylic Acid
BB-pLA-pLB-pLC-pLH-pST-p
Acetic acidn.d.1.02 ± 0.44 a0.55 ± 0.06 bn.d.n.d.0.67 ± 0.05 b
Butanoic acid2.96 ± 0.18 d10.46 ± 1.58 a6.41 ± 0.81 c8.14 ± 1.01 b11.14 ± 6.25 a7.09 ± 2.25 b
Total2.9611.476.968.1411.147.76
  • Ester
BB-pLA-pLB-pLC-pLH-pST-p
Isoamyl acetate0.67 ± 0.94n.d.n.d.n.d.n.d.n.d.
(Z)-5-Dodecenyl acetaten.d.n.d.n.d.0.19 ± 0.270.22 ± 0.02n.d.
Acetic acid, 2-phenylethyl ester1.21 ± 0.71n.d.n.d.n.d.n.d.n.d.
Ethyl butyrate1.51 ± 0.13n.d.n.d.n.d.n.d.n.d.
Ethyl decanoate2.10 ± 0.98n.d.n.d.n.d.n.d.n.d.
Ethyl Octanoate1.27 ± 0.80n.d.n.d.n.d.n.d.n.d.
Total6.760.000.000.190.220.00
  • Terpene
BB-pLA-pLB-pLC-pLH-pST-p
β-Myrcenen.d.n.d.0.19 ± 0.04 b0.29 ± 0.09 a0.31 ± 0.06 an.d.
D-Limonenen.d.n.d.0.14 ± 0.08 c0.77 ± 0.03 a0.46 ± 0.07 b0.17 ± 0.03 c
Total0.000.000.331.060.770.17
  • Pyrazine
BB-pLA-pLB-pLC-pLH-pST-p
2,5-Dimethylpyrazinen.d.n.d.0.25 ± 0.01 b0.21 ± 0.07 b0.35 ± 0.04 an.d.
Methylpyrazinen.d.n.d.0.32 ± 0.01 b0.21 ± 0.09 c0.42 ± 0.02 an.d.
Total000.570.420.770
* LA-p: was fermented with L. acidophilus, LB-p: was fermented with L.s bulgaricus, LC-p: was fermented with L. casei, LH-p: was fermented with L. helveticus, BB-p: was fermented with B. bifidum, and ST-p: was fermented with S. thermophilus. a–f: there is a statistically significant difference between groups without common letters (p < 0.05). n.d.: not detected.
Disclaimer/Publisher’s Note: The statements, opinions and data contained in all publications are solely those of the individual author(s) and contributor(s) and not of MDPI and/or the editor(s). MDPI and/or the editor(s) disclaim responsibility for any injury to people or property resulting from any ideas, methods, instructions or products referred to in the content.

