2. Introduction
China is the world’s largest producer of traditional agricultural products, producing more than 800 million tons of plant straws annually, which account for nearly one-third of the global output, including up to 280 million tons of corn straws [
1]. Straw can meet the energy requirements of ruminants reared, but effective strategies are needed to improve straw utilization in the bodies of animals. Corn straws are rich in carbohydrates such as cellulose and hemicellulose, which are good sources of energy for ruminants. Many studies have reported on how straw fermentation can lead to the degradation of lignin, promote rumen digestion, improve microbial nitrogen synthesis efficiency, and reduce methane emissions [
2,
3,
4].
Corn can be processed into a variety of foods, providing us with energy and nutrition. In the livestock industry, corn is a high-quality energy feed, and appropriately reducing its dosage is very important to reduce livestock costs. Therefore, it is necessary to reduce the corn content in ruminant diets without affecting feed intake or energy content. In recent years, an increasing number of researchers have evaluated the effects of replacing corn with different raw materials in animal feed. In one study, when the percentage of cassava residue that replaced corn meal was 25% or less, there was no negative effect on the rumen fermentation characteristics of cows in vitro during mid-lactation [
5]. In another study, the replacement of corn with beet meal decreased starch intake, increased the rumen pH 4 h after feeding, and increased the feed conversion efficiency of milk, thus increasing milk yield [
6]. Dried citrus pulp can replace extruded corn and improve rumen fermentation efficiency [
7]. In a total mixed diet (TMR), using rice as a substitute for corn has no negative effect on rumen fermentation characteristics in vitro, and rice can be used as a suitable alternative energy source for beef cattle in the early fattening period [
8]. Replacing corn with jujube kernels can change the fermentation characteristics of SCFAs and produce more C3 and less C2 compounds, and replacing corn with 50% jujube kernels in ruminants can stabilize the rumen pH, thus preventing further deficiency of the rumen buffering ability caused by high-fermented grain diets [
9].
Fermented corn straw has a high fiber content. It can be used as roughage for ruminants and provide energy for ruminants after digestion and absorption in the rumen. The commonly used pretreatment method for lignocellulose is alkali treatment, but the palatability of alkali-treated corn straws is bad [
10,
11]. Other pretreatment methods generally produce by-products that are harmful to animals [
12], so it is necessary to find a simple and convenient pretreatment method suitable for feed utilization. Probiotic fermentation of alkali-treated corn straws may be a solution to the problem. We hypothesized that substituting fermented corn straws for corn would impact animal growth and metabolism. Therefore, in this study, we systematically evaluated the effects of replacing corn with fermented corn straw on the carcass index, organ index, calcium and phosphorus contents in each tissue, serum biochemical parameters, nutrient digestibility, rumen epithelium, and intestinal development, rumen fermentation, and microbial enzyme activity of the rumen contents of Yichang white goats. Based on microbial 16S amplicon analysis of the rumen fluid and colon contents and nontargeted metabolome analysis, the feasibility of replacing corn with fermented corn straw in ruminant feed was evaluated with the aim of providing a basis for replacing corn with fermented corn straw as an unconventional feed for ruminants.
3. Materials and Methods
3.1. Analysis of Organic Acids and Enzymatically Hydrolyzed Sugars in Fermented Straw and Dry Straw
A total of 0.5 g of dried straw sample was added to 50 mL of enzyme buffer and enzymolyzed for 72 h. A blank group without straw was set for each enzymolysis to eliminate the influence of sugar brought by cellulase. The enzymolysis sugar content was detected by HPLC. The preparation method of the enzyme buffer was as follows: 4 mL of β-glucanase (12311103, SUNSON, Cangzhou, China) and 4 mL of xylanase (12312037, SUNSON, Cangzhou, China) were added to 25 mL of 2M acetic acid–sodium acetate buffer (A875409 and S817983, Macklin, Shanghai, China). The pH of the buffer was 4.8. Moreover, 0.1 g of ampicillin sodium (A800429, Macklin, Shanghai, China) was added. After mixing well, the volume was adjusted to 1 L with distilled water.
3.2. Animals, Diets, and Experimental Design
All animal operations were performed in accordance with the Guide for the Care and Use of Laboratory Animals of Huazhong Agricultural University, and the animal experimental protocol was approved by the Science Ethics Committee of Huazhong Agricultural University (HAZUGO-2024-0005, Wuhan, China). A total of 16 Yichang white male goats, each with an initial body weight (BW) of 21.07 ± 0.87 kg (mean ± SD) and 5 months of age, were randomly assigned to one of two dietary treatments (n = 8 per group), that is, (1) a grain-based diet with dry corn straw (DS) or (2) fermented corn straw (FS). The ingredient compositions and nutritive values of experimental feeds are shown in
Table 1. All the goats were gradually adapted to the experimental diets for 21 d by replacing 100 g/kg of their previous diet every 3 d. After that, the experimental diet was fed for 125 d using restricted feeding. Residual feed was collected daily throughout the experiment to calculate dry matter intake, and goats’ body weights were recorded once a week. The animals had access to clean fresh water ad libitum throughout the day. The dried straw and fermented straw were produced by Sichuan Runge Biotechnology Co., Ltd. (Sichuan, China) according to the predetermined pretreatment and fermentation processes. The fermented corn straw was pretreated with calcium hydroxide and then solid-state fermented was pretreated with corn flour and lactic acid bacteria.
3.3. Feed Analysis and Feed Digestibility
The daily feed amount and amount of feed remaining were recorded. The rumen digesta and stool were collected on days 90–95 of the trial for the digestion tests. Acid insoluble ash (AIA) was used as the internal standard for the determination of feed digestibility. The total intestinal apparent digestibility was calculated as follows: nutrient digestibility =100 – 100 × (AIA in feed × nutrient content in stool)/(AIA in stool × nutrient content in feed). Rumen digestibility was calculated as follows: nutrient digestibility = 100 – 100 × (AIA in feed × nutrient content in rumen)/(AIA in rumen content × nutrient content in feed) [
13]. Approximately 100 g (as is) of feed was collected per week, mixed well, and stored at −20 °C. The feed samples were dried in a 55 °C oven (Thermo Scientific Heratherm Advanced Protocol Ovens model 51028115, Fisher Scientific, Waltham, MA, USA) for 24 h and then ground. The ash content was determined by burning at 500 °C at Sybron Thermolyne FA1730, Fisher Scientific, Waltham, MA, for 12 h. The dry matter (DM), organic matter (OM), crude protein (CP), and AIA contents were analyzed according to the AOAC [
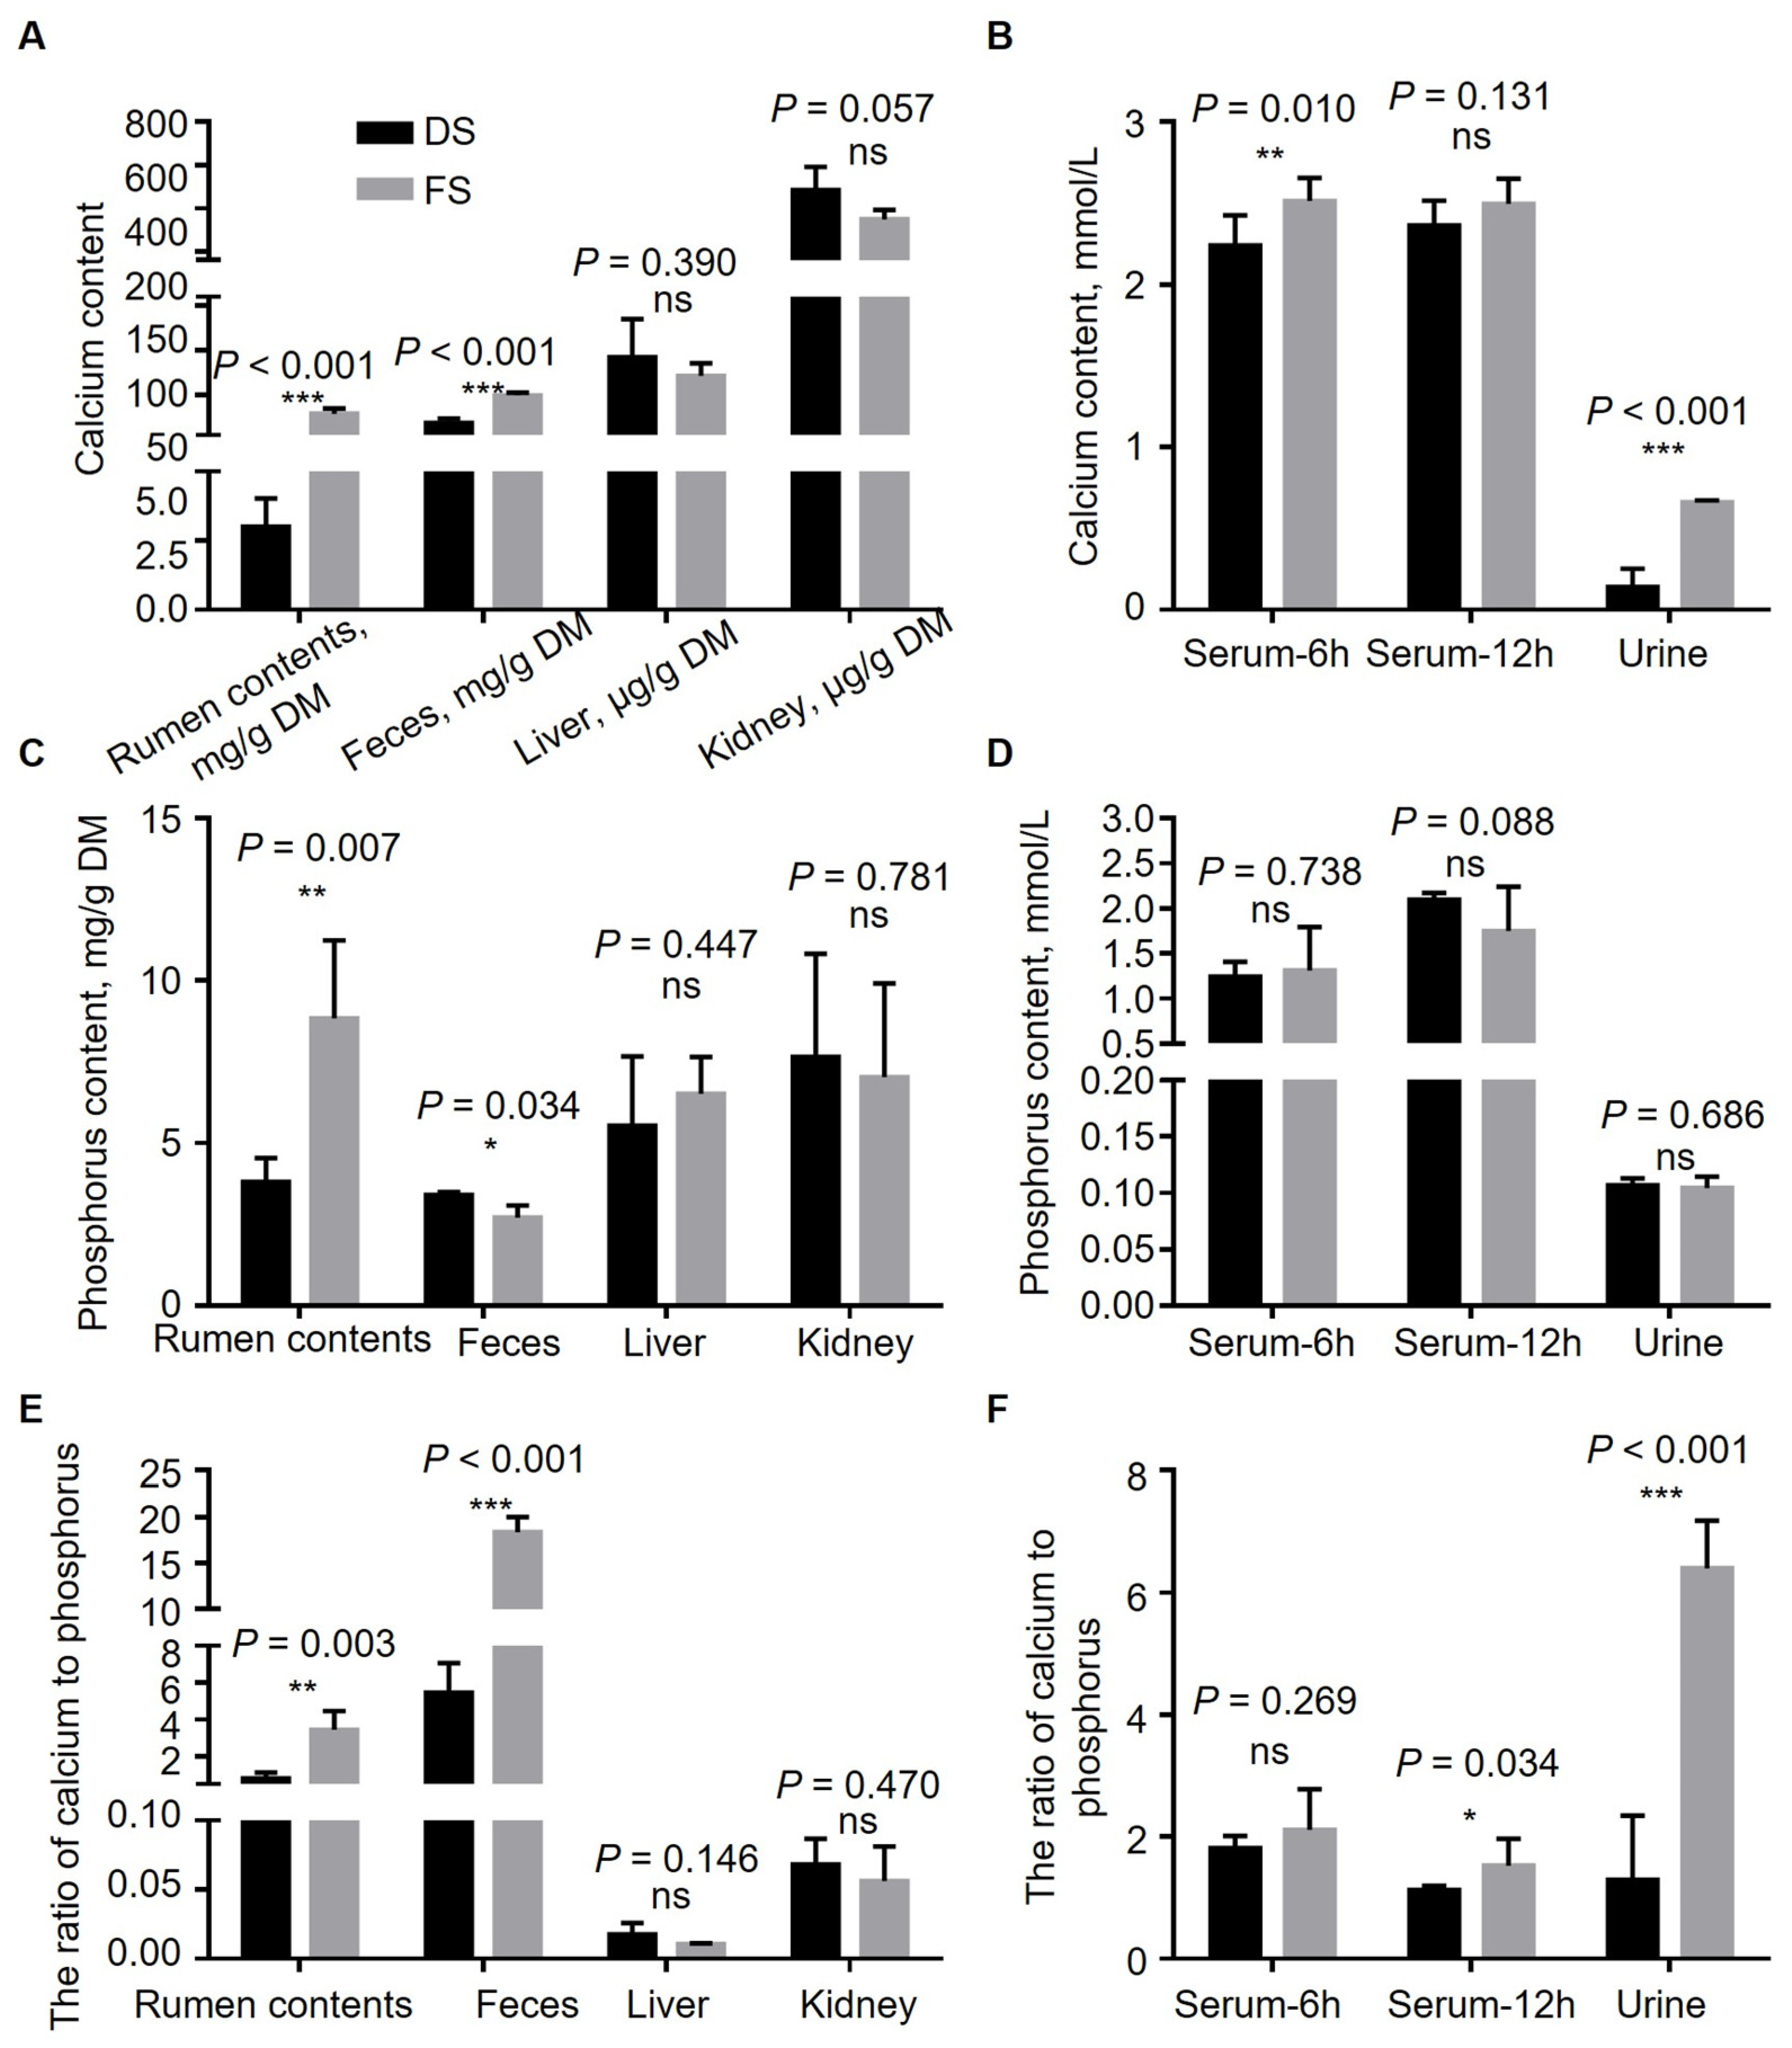
13]. Neutral detergent fiber (NDF) and acid detergent fiber (ADF) contents were determined via an ANKOM200i fiber analyzer (ANKOM Technologies, Inc., Fairport, NY, USA) via an ANKOM filter bag technology. ADF analysis of the residues was performed in the 2 L beaker; 72% sulfuric acid was added, and the mixture was stirred on a shaking platform (Flask Dancer Boekel Scientific, Feasterville-Trevose, PA, USA) for 3 h to obtain the acidic washing lignin concentration. Cellulose = ADF-ADL, hemicellulose = NDF-ADF. The Ca content was determined via a flame atomic absorption analyzer, and the total P content was determined via the molybdenum yellow method.
3.4. Slaughter and Sampling
The rumen digesta was collected at the end of the feeding trial (i.e., after 130 d) and after 6 h, 12 h, 24 h, 48 h of fasting. After the goats were fasted for 12 h, blood was collected from the jugular vein of all the animals, and the blood was placed on the inclined plane for 30 min. The samples were subsequently centrifuged at 4 °C at 1500× g for 10 min, and the serum was separated and frozen at −80 °C. Goat live weight before slaughter was recorded and 4 goats whose body weight was close to the average were selected from each group. In accordance with the experimental animal care and use guidelines of Huazhong Agricultural University, the goats were euthanized via intravenous injection of barbiturates. After the goats lost their toe and leg retraction reflexes, they were killed by bloodletting. The fur, gut, head, and hooves were removed, the carcass was weighed, and the carcass index was calculated. The heart, liver, spleen, and kidney were weighed and recorded, while the organ weight index was calculated based on the ratio of the organ weight to its body weight. Samples of the rumen ventral capsule, jejunum, and colon, each approximately 2 cm long, were collected, immediately washed with precooled normal saline, fixed with 4% paraformaldehyde, and stored in a refrigerator at 4 °C for H&E staining. Samples of rumen chyme, colonic chyme, and colonic mucosa were collected and stored at −80 °C until analysis.
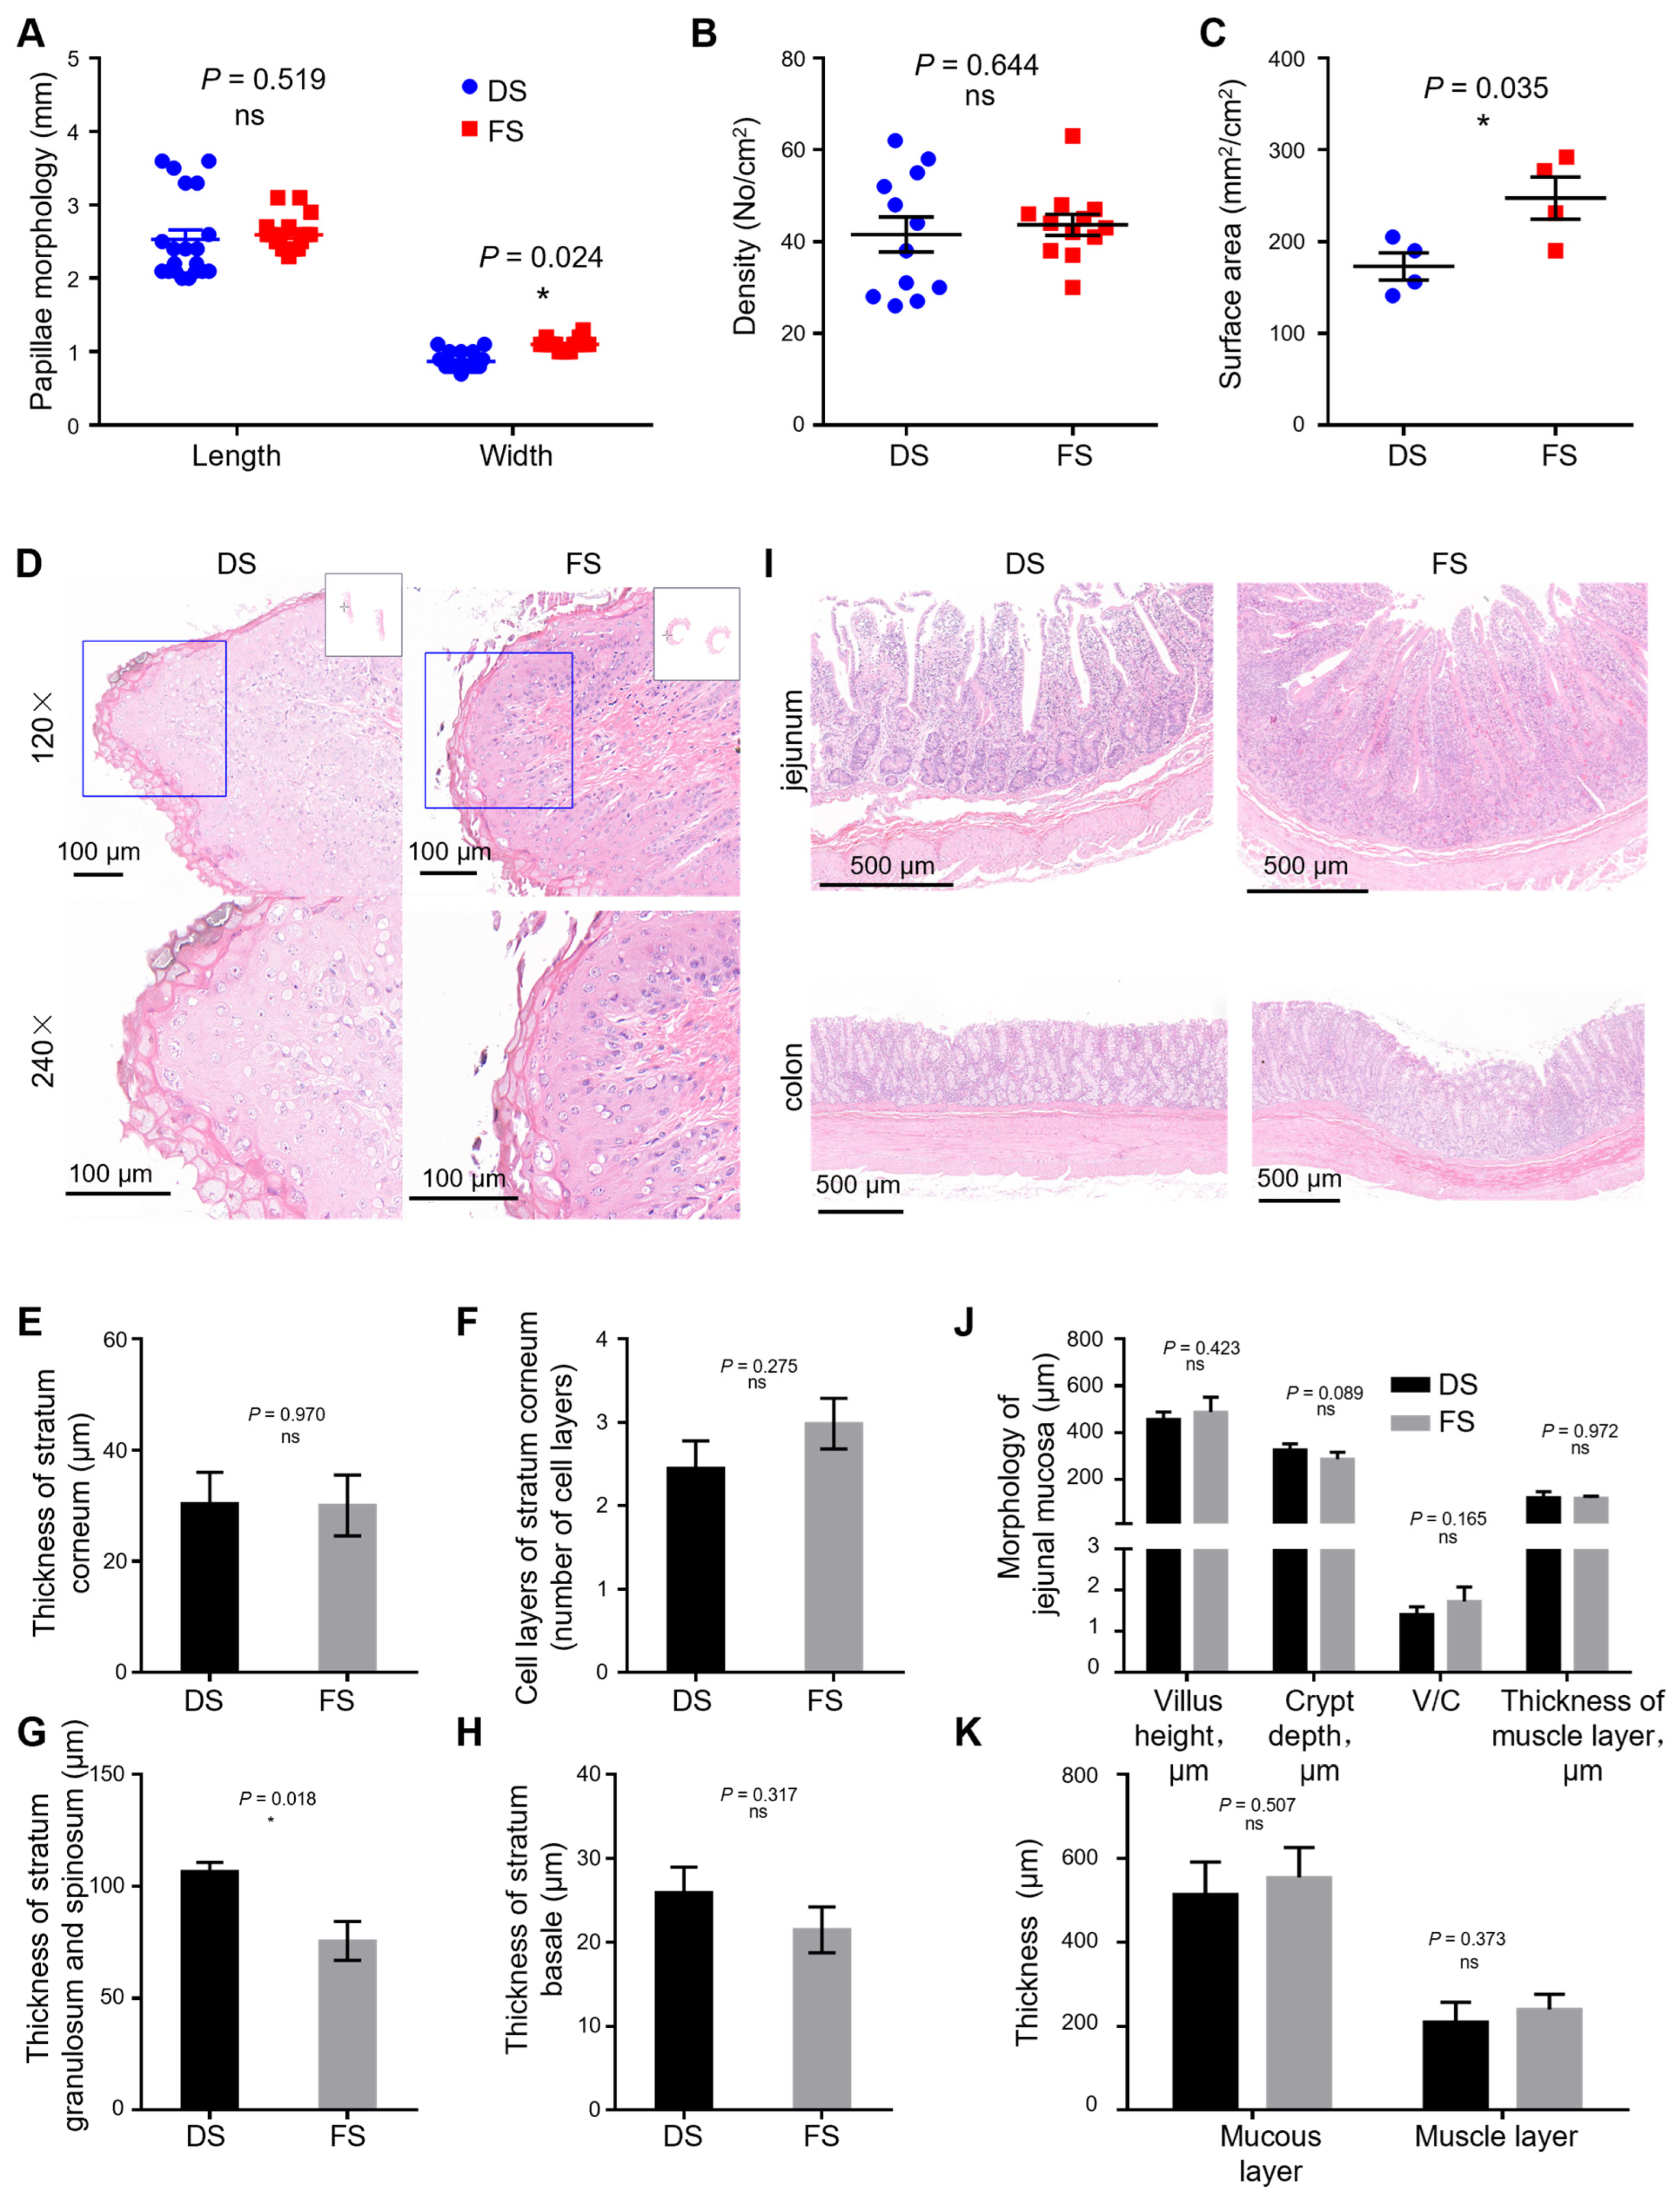
3.5. Morphometry of the Ruminal Papillae, Jejunum, and Colon
Four goats whose body weights were close to the mean value were collected from each group. After slaughter, three 1 × 1 cm rumen abdominal sac samples were collected to determine rumen papillae density. Fifteen rumen papillae were randomly selected from each epithelial tissue sample, and the length and width of the papillae were measured via Vernier calipers [
14]. Papillae length is defined as the distance from the papillae tip to the papillae base, and papillae width is defined as the average width of the papillae base, middle, and tip. The papillae density (1 cm × 1 cm) was measured with a magnifying glass (MG3B-1A, Shanghai, China). The total papilla surface area per unit area (mm
2/cm
2) = length × width × 2 × papilla density (number of papillae/cm
2).
Immediately after slaughter and removal of the abdominal organs, tissue samples (2–3 cm2) were collected from the rumen ventral sac, jejunum, and colon, and fixed in 4% paraformaldehyde. Tissue samples fixed with paraformaldehyde were dehydrated in a series of ethanol solutions ranging from 50% to 100% and removed with xylene. The samples were embedded in paraffin, sliced with an automatic microtome at a thickness of 5 µm, and stained with hematoxylin–eosin. After H&E staining, the rumen epithelia were placed under a white light microscope for scanning (GDP2201, Servicebio, Wuhan, China), and CaseViewer was used for image scaling and clippings. Image Pro Plus 6.0 was used to measure the average optical density and calculate the thickness of the corneum, granular layer, spinous layer, and basal layer of the rumen papillae.
3.6. Determination of Serum Biochemical Indicators
After the serum rested on an inclined plane for 30 min, it was separated via centrifugation at 4 °C at 1500× g for 10 min, and the serum was separated via an automatic biochemical analyzer (BX-4000, Sysmex, Shanghai, China). Glucose, ALT, AST, TG, TC, TP, ALB, UREA, and calcium contents were measured.
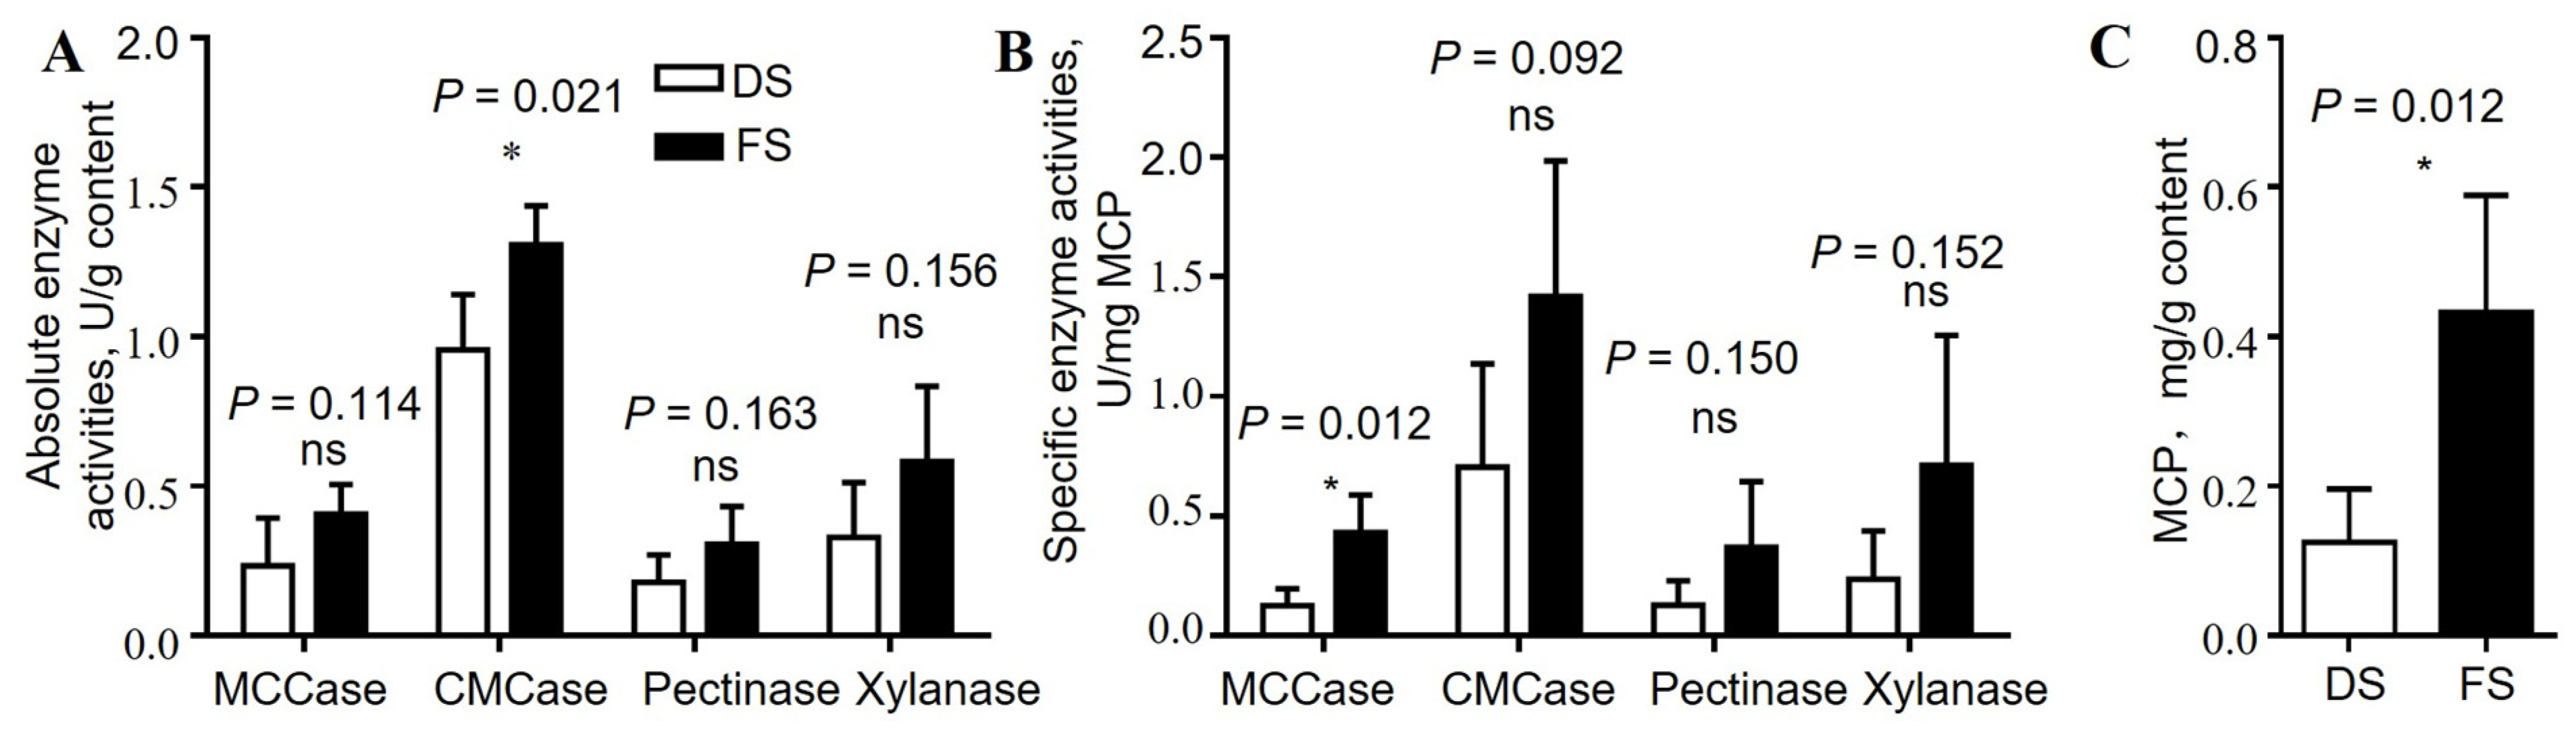
3.7. Determination of Microbial Protein Content and Microbial Enzyme Activity
The rumen contents were freeze-dried and ground using Labconco FreeZone, Beckman, America. A 0.1 g freeze-dried sample was added to 1 mL of precooled sterile PBS buffer (pH = 7), mixed by stirring, and centrifuged at 4 °C and 408× g for 5 min, after which the supernatant was collected. The supernatant (0.5 mL) was removed and centrifuged at 4 °C and 25,000× g for 40 min. The supernatant was discarded, and the cells were collected. Then, 1.5 mL of 0.25 M NaOH was added, the mixture was mixed thoroughly, and the mixture was boiled in water for 10 min. The purpose of this step was to caustically lyse the cells. The mixture was centrifuged at 4 °C and 25,000× g for 60 min, the supernatant was considered the microbial protein mixture, and the protein content was quantified with a BCA protein quantification kit (PA115, TIANGEN, Beijing, China).
The 0.5 g samples of freeze-dried rumen contents were added to 5 mL of precooled sterile PBS buffer (pH = 7) and thoroughly mixed. The samples were crushed on ice with an ultrasonic cell mill (Scientz-IID, SCIENTZ, Ningbo, China) at 30% strength for 3 s at intervals of 5 s for 5 min. The samples were then centrifuged at 12,000× g for 10 min, and the supernatant was taken as the crude enzyme mixture and stored at 4 °C for subsequent determination of microbial enzyme activity. To determine the activities of carboxymethyl cellulase, microcrystalline cellulase, xylanase, and pectinase in the rumen contents, 0.2 mL of substrate (sodium carboxymethyl cellulose/microcrystalline cellulose/xylanase and pectin solution, respectively), 0.6 mL of PBS buffer (pH = 7) and 0.2 mL of crude enzyme solution were successively added to a 2 mL centrifuge tube. The mixture was incubated in a water bath at 39 °C for 30 min, 0.4 mL of DNS solution was added, the mixture was boiled in a water bath for 5 min, and the absorbance at 540 nm was determined. D-glucose, D-xylose, and D-galacturonic acid were used to calculate the activity of the corresponding microbial enzymes according to the amount of reducing sugars released in the system.
3.8. Determination of SCFA Levels
The concentration of SCFAs was determined via gas chromatography (7890A, Agilent, Santa Clara, CA, USA) [
15]. The rumen contents were freeze-dried using Labconco FreeZone (Beckman, Brea, CA, USA). A 0.1 g freeze-dried sample was mixed with 1.5 mL of aseptic deionized water and shaken at 16 °C for 30 min at 200 r/min. The supernatant was centrifuged at 7000×
g for 10 min. A total of 0.9 mL of the centrifuged supernatant was removed, and 0.1 mL of 10% HCl was added, mixed, and incubated for 2 h at 4 °C and 13,000 r/min, after which it was centrifuged at 4 °C for 10 min. The supernatant was filtered through a 0.22 µm filter membrane, and the contents of short-chain fatty acids were determined via gas chromatography. A J&WDB-FFAP gas chromatography column (122-3232, Agilent, Beijing, China) was used with 1 µL samples without diversion, and the inlet heater temperature was 250 °C. Column temperature box conditions were 100 °C for 0 min, increased to 150 °C at a rate of 8 °C/min, maintained at 150 °C for 2 min, and then 210 °C for 4 min.
3.9. 16S rDNA Amplicon Sequencing and Untargeted Metabolomics of Rumen Fluid and Colon Contents
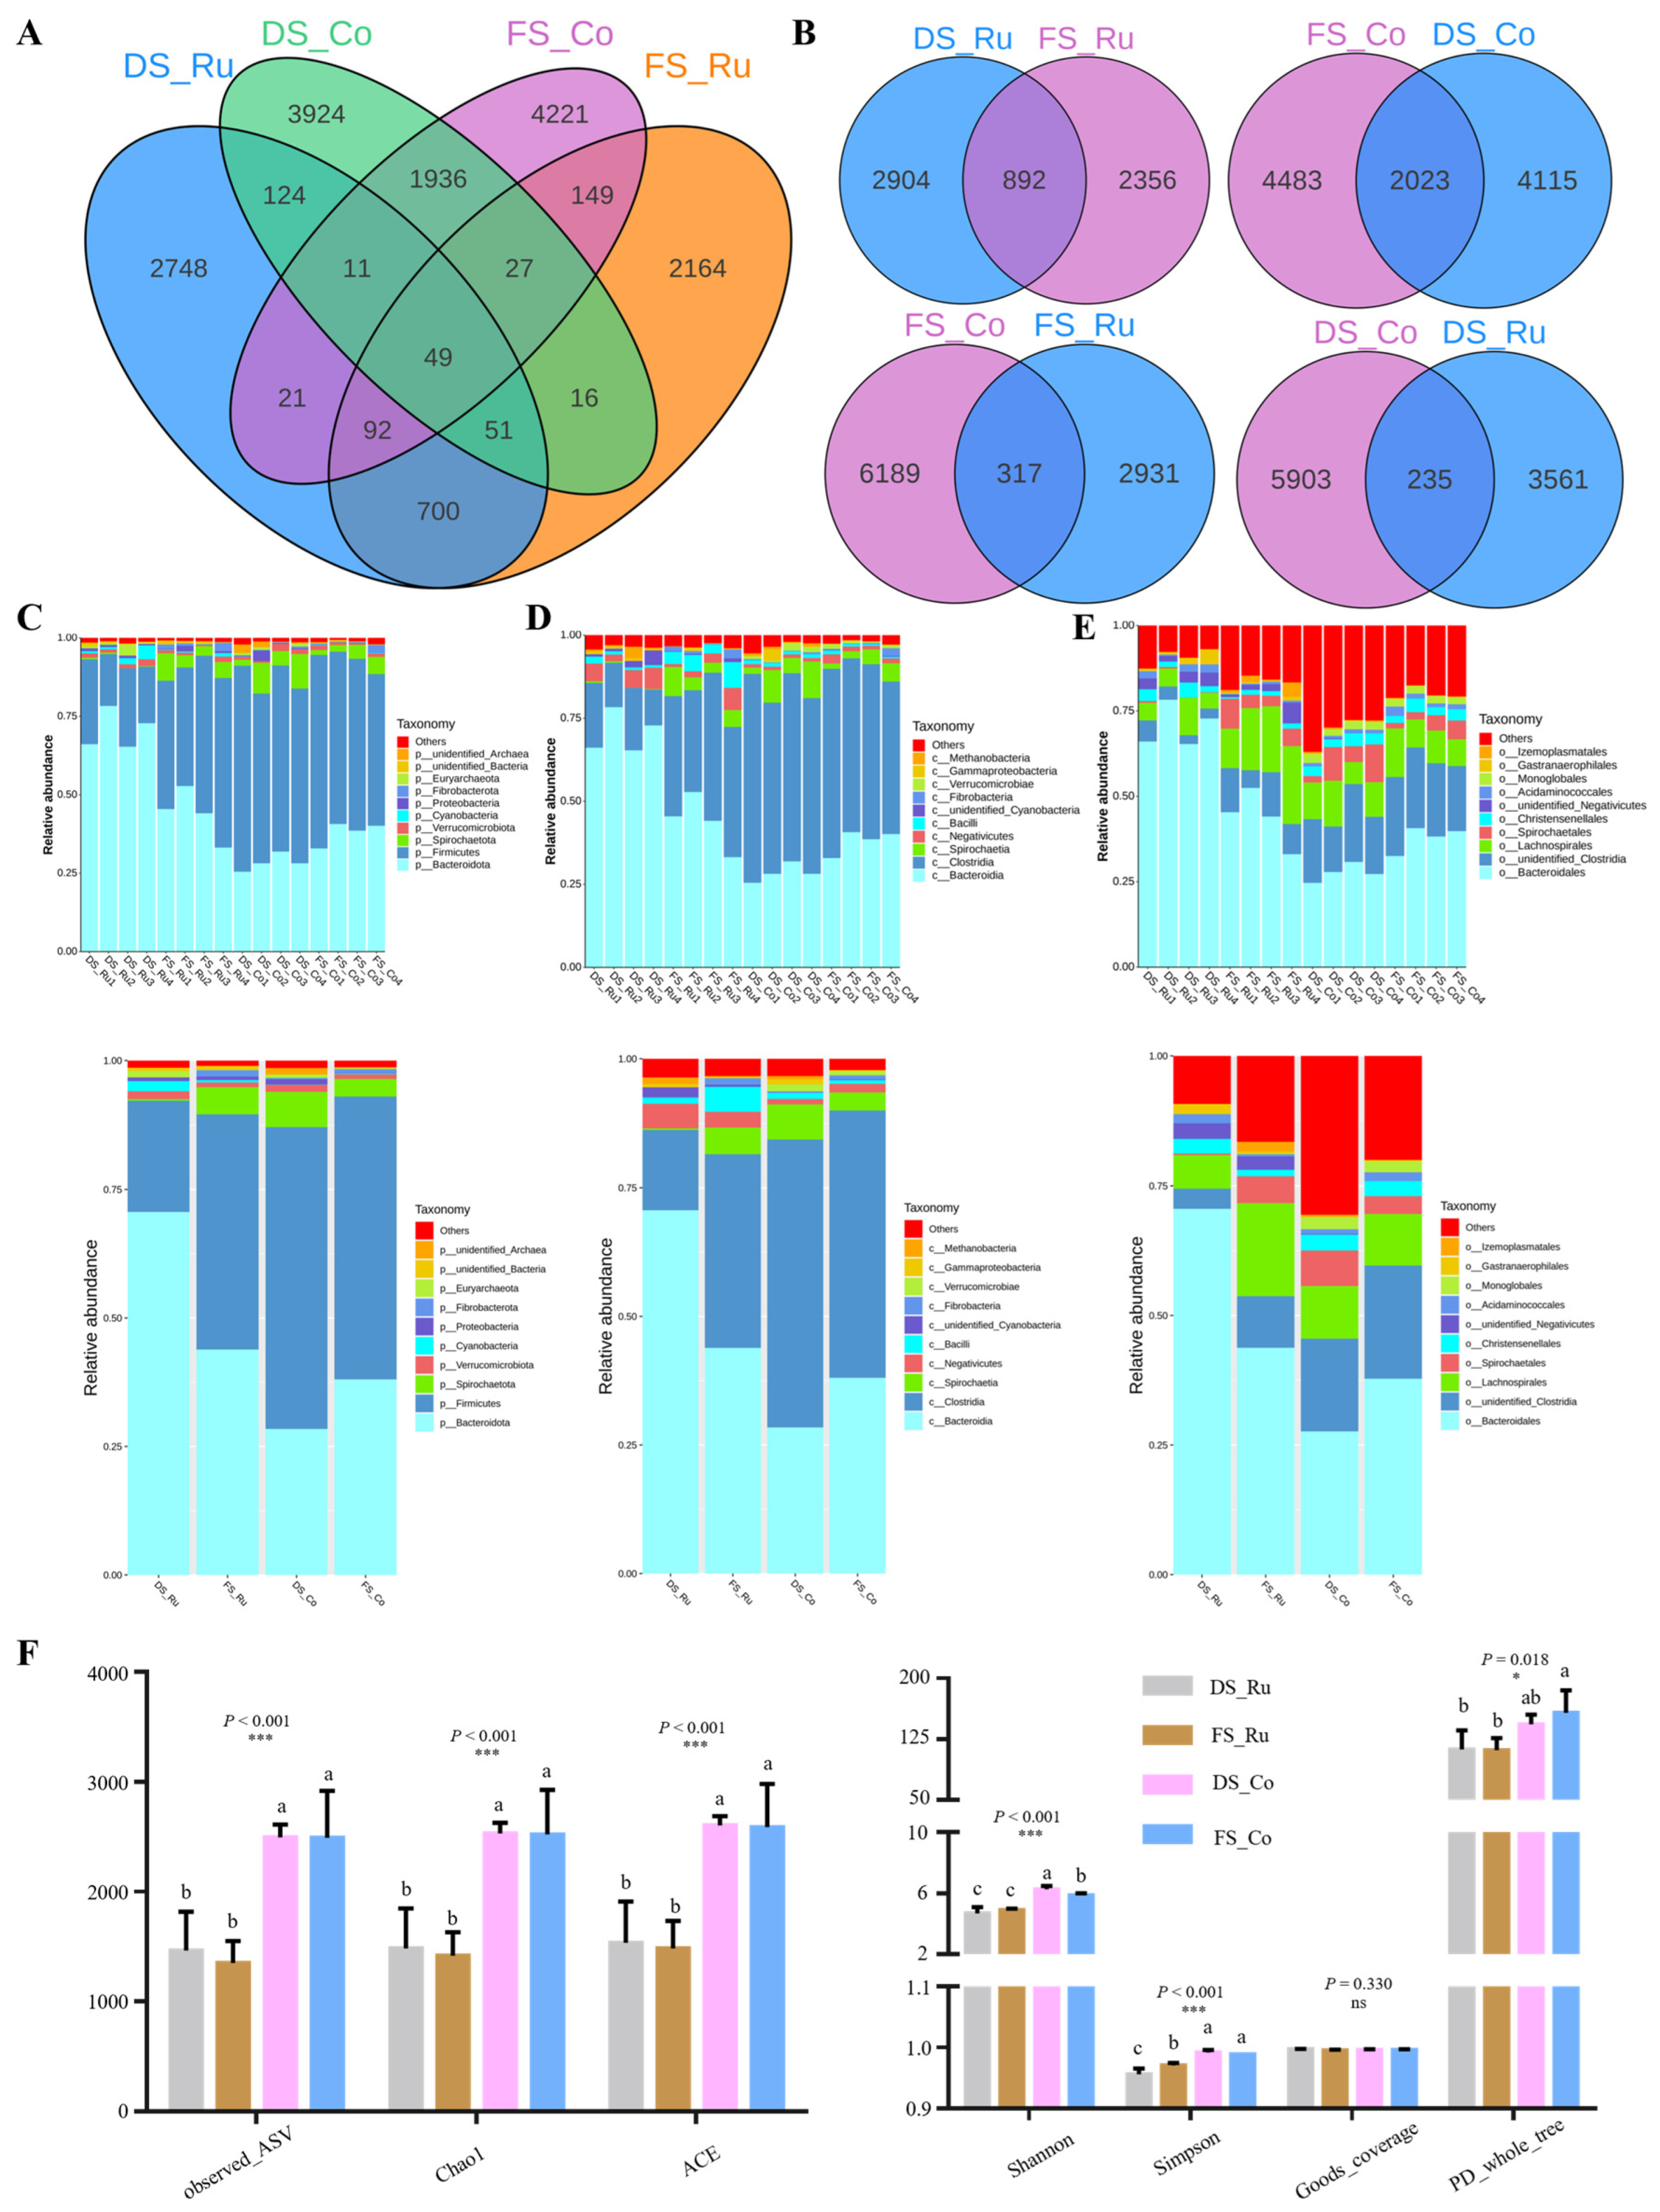
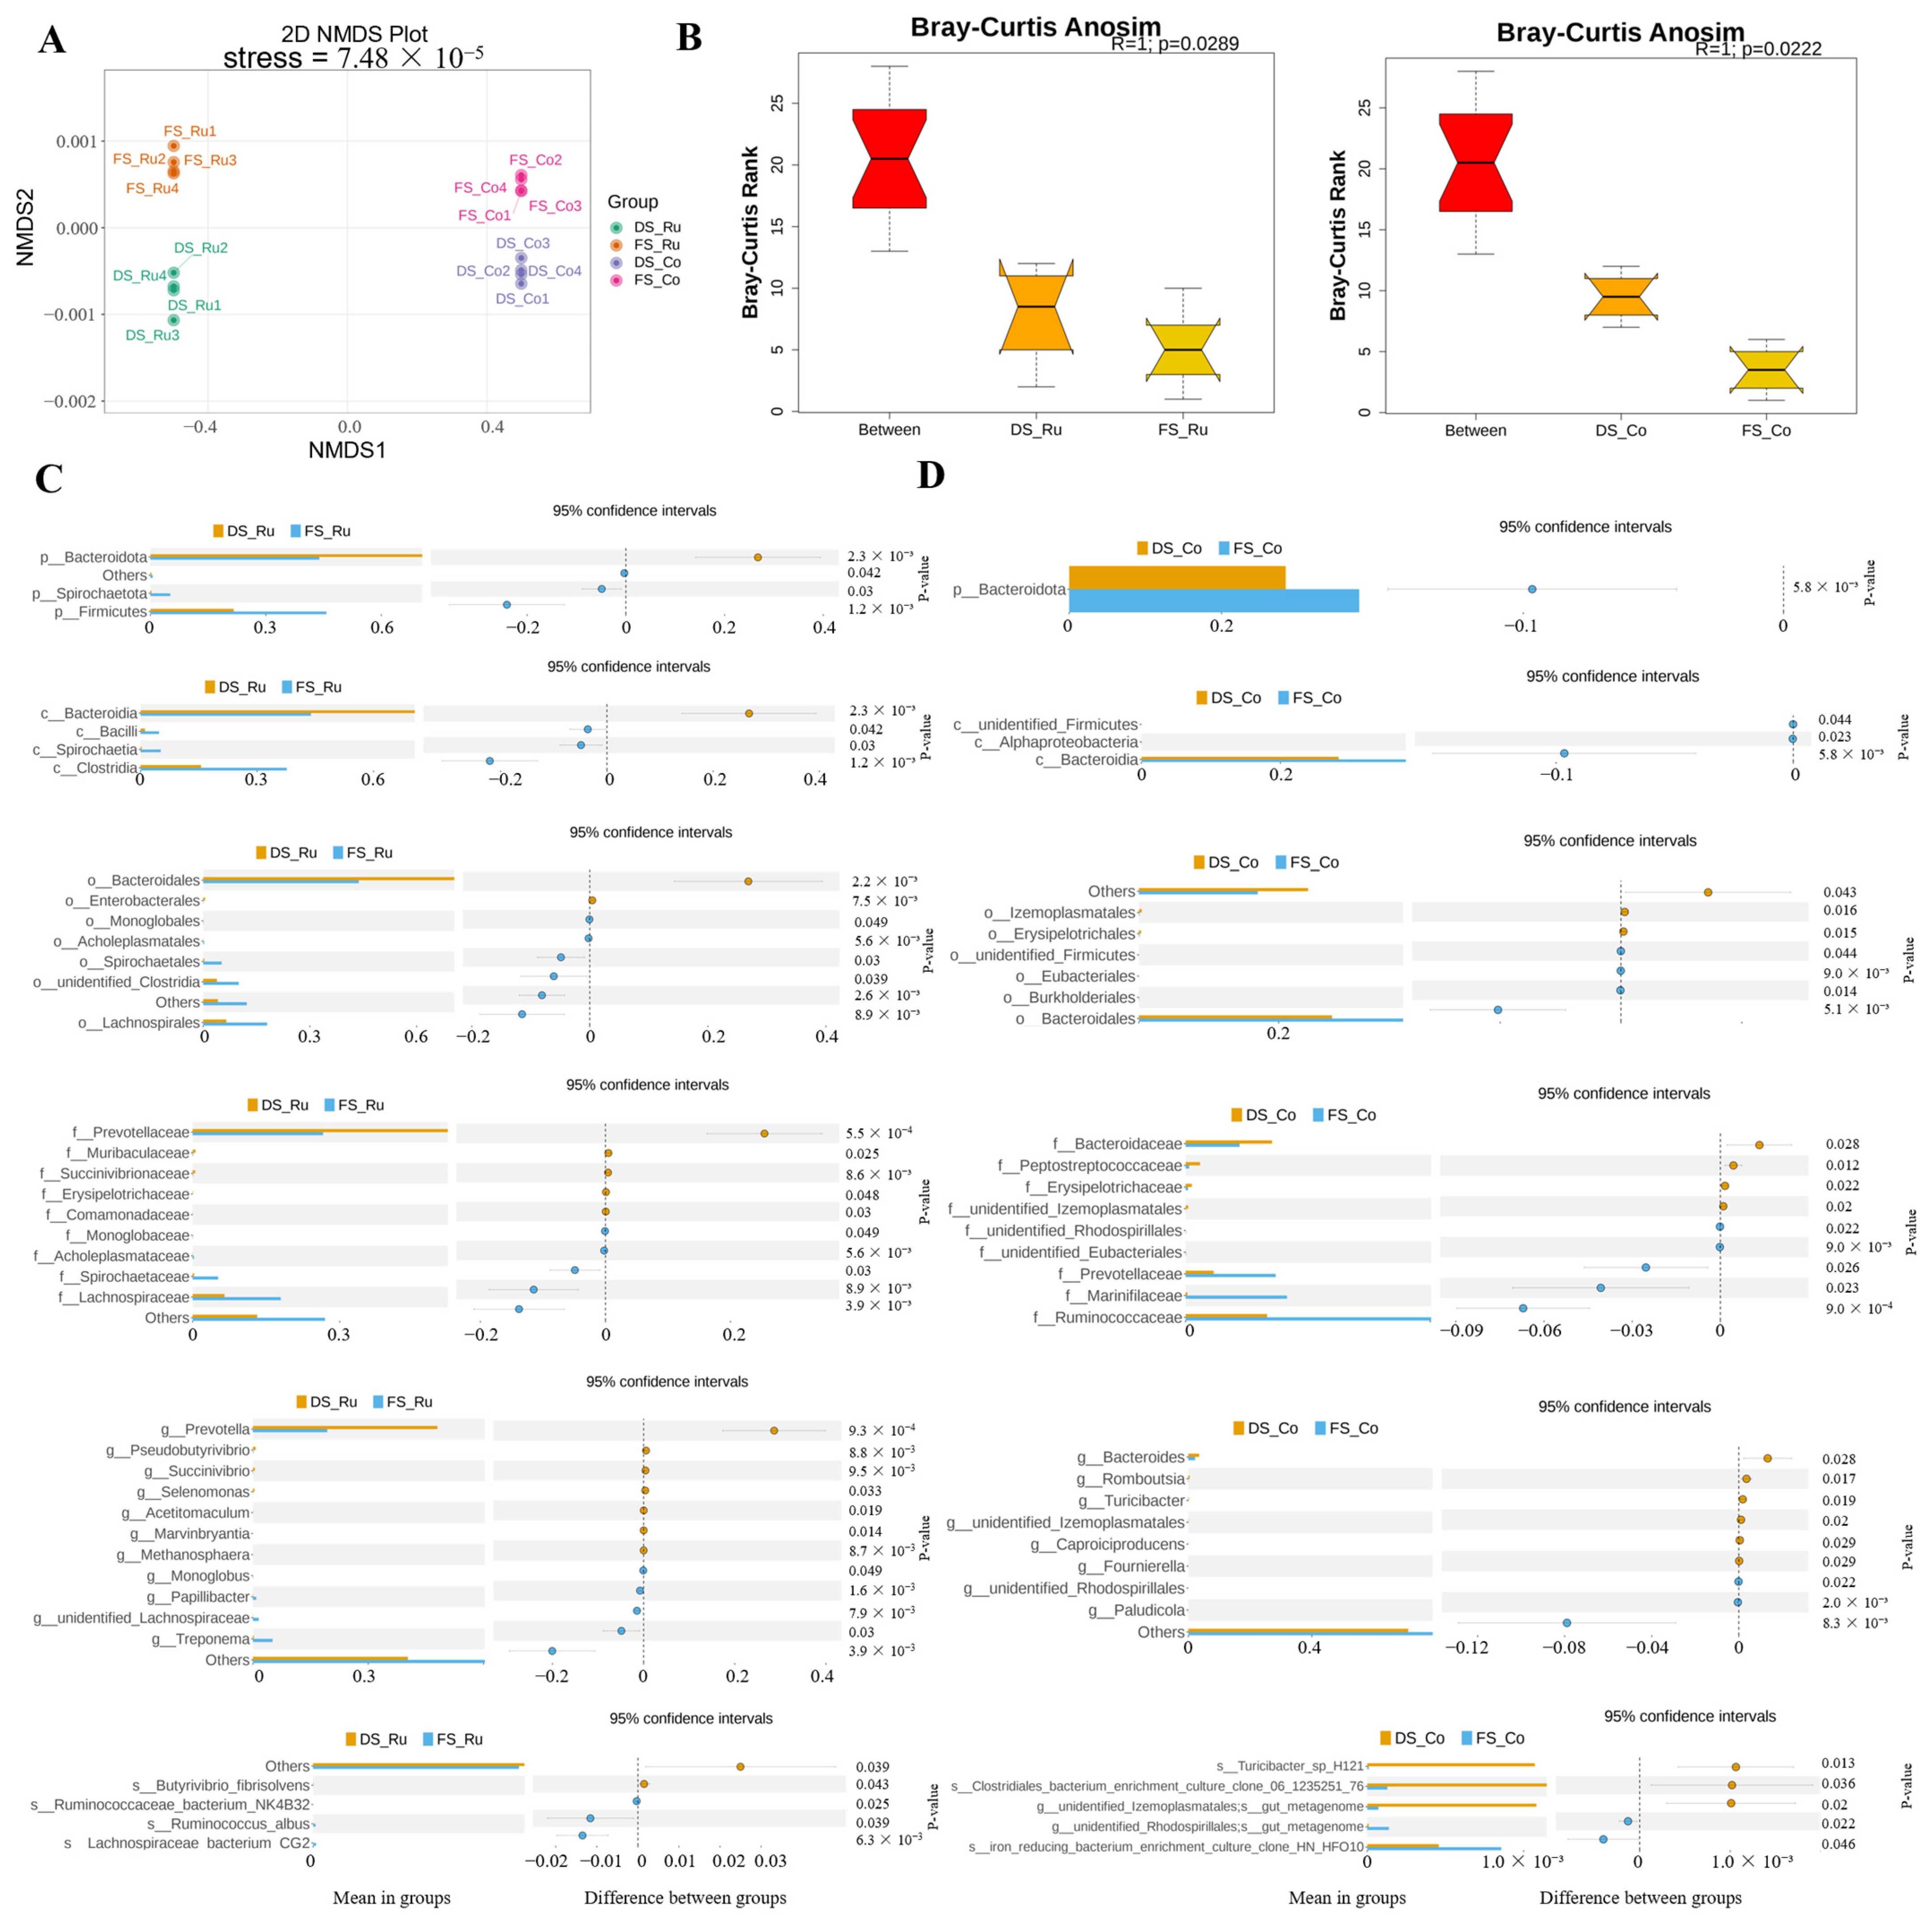
The genomic DNA of the samples was extracted via CTAB, and bacterial diversity was determined via 16SV4 primers (515F and 806R). After the PCR products were mixed and purified, a library was constructed and computer-sequenced. Using a noise reduction method, ASVs were obtained, the ASVs that were common or unique among different samples (groups) were analyzed, and a Venn graph was constructed. The 10 species with the greatest abundance in each sample or group at each classification level (phylum, class, order) were selected to generate a histogram of the relative abundance of the species. NMDS (non-metric multidimensional scaling) is a nonlinear model based on Bray–Curtis distance analysis; the information is visualized via points on a two-dimensional plane according to the species information contained in the sample. ANOSIM analysis was performed via the R vegan ANOSIM function, and we tested the significance of differences across groups based on the ranks of Bray–Curtis distance values.
Metabolite content data were analyzed via unit variance (UV) scaling standardized processing via the R software Complex Heatmap package to draw heat diagrams and determine metabolites among different samples via hierarchical cluster analysis (HCA). When OPLS-DA is used, the X matrix information is decomposed into two types of information (related to Y and not related to Y); the variable information related to Y is the predictive principal component, and the variable information unrelated to Y is the orthogonal principal component. Metabolome data were analyzed according to the OPLS-DA model, and score charts for each group were constructed to further show the differences among the groups [
16]. Differentially abundant metabolites with VIP > 1 and
p-value < 0.05 (Student’s test) were screened out. After qualitative and quantitative analysis of the detected metabolites, differences in the quantitative results of the metabolites in different groups were calculated. Among the differentially abundant metabolites identified on the basis of screening criteria, the top 10 metabolites with the largest absolute values of log
2FC were selected for radar mapping. The KEGG annotation information of differentially abundant metabolites identified according to the screening criteria was used to select 5 significantly enriched KEGG metabolic pathways, and cluster analysis was performed on all the differentially abundant metabolites in these pathways to better study the trends in substance content in different groups of potentially important metabolic pathways. If there were fewer than 5 differentially abundant metabolites in a pathway, the path was not displayed. According to the results of the analysis of differentially abundant metabolites, KEGG pathway enrichment analysis was performed, in which the Rich factor was the ratio of the number of differentially abundant metabolites in the corresponding pathway to the total number of metabolites annotated by the pathway; the greater the value, the greater the degree of enrichment. Using the KEGG annotation information of the differentially abundant metabolites identified according to the screening criteria, 3–4 significantly enriched KEGG metabolic pathways were selected for cluster analysis of all the differentially abundant metabolites in these pathways to better study the changes in substance content in different groups of potentially important metabolic pathways.
3.10. Statistical Analysis
GraphPad Prism 9 was used to organize the plots, and IBM SPSS Statistics (v.22.0) was used to analyze the significance of the data. Univariate analysis of variance and Duncan’s multiple range test were used, p < 0.05 was considered to indicate a significant difference, p < 0.01 was considered to indicate an extremely significant difference, and the results are expressed as the means, with standard errors of means (SEMs).
5. Discussion
The purpose of our study was to replace feed grain with fermented straw. To determine the potential of fermented straw, we conducted an anaerobic fermentation experiment to produce biogas. The results showed that the glucose equivalent of the digestible energy of pretreated straw increased from about 30% to nearly 50%, which is equivalent to saving 0.2 kg of corn by feeding 1 kg of fermented straw compared to dry straw. As eating more roughage will limit feed intake, we designed a feed intake experiment and found that the ratio of the experimental group to the control group was 1.1:1, and 1.3 kg of fermented straw could replace 1.0 kg of straw plus 0.3 kg of corn. The in vitro biogas production of pretreated straw reached 80%, and our process destroyed the firm structure of straw fiber and improved the utilization rate of fiber. In our study, fermented straw occupied a large proportion of the feed formula; meanwhile, the probiotics and prebiotics produced by the high bacterial count during straw fermentation were also helpful for nutrient digestion and absorption and the health of the animal organism. The above-mentioned reasons caused the higher apparent digestibility rates in the FS group. The increase in the digestion rate of fermented straw means a shorter residence time in the rumen; it was found that ruminants ate fermented straw faster than dry straw. The dry matter concentration of fermented straw in the rumen could be higher. Feeding fermented straw could increase the crude-to-concentrate ratio of the diet; more fermented straw can be added to the diet to save more feed grain compared with dry straw.
The liver is the most metabolically active organ in the body and plays an important role in maintaining the homeostasis of energy metabolism [
17]. The heart is a very important organ in the body, and its main role is to promote blood circulation [
18]. Although fermented corn straw increased the heart and liver weight indexes of the FS group, they were all within the normal range. It can be inferred that adding fermented corn straw to the diet has no adverse effect on the development of the internal organs of Yichang white goats. Fermented straw significantly increased the rumen calcium content, fecal calcium content, and rumen phosphorus content, and significantly increased the rumen content, urine calcium–phosphorus ratio, and fecal calcium–phosphorus ratio, indicating that more calcium was consumed and excreted. The fecal phosphorus content in the FS group decreased, whereas the urine phosphorus content was not affected, indicating that excess calcium may promote phosphorus absorption. The fermented straw did not affect the calcium or phosphorus content in the liver or kidneys, indicating that excess calcium did not cause damage to the liver or kidneys. Although the serum calcium content increased at 6 h, it recovered to the same level as that in the control group after 12 h, indicating that excessive calcium consumption would increase the serum calcium content; however, as the calcium in the body was removed through feces and urine, the serum calcium content gradually recovered to the same level as that in the control group. According to routine urinary indicators, excess calcium did not have harmful effects on goat body health.
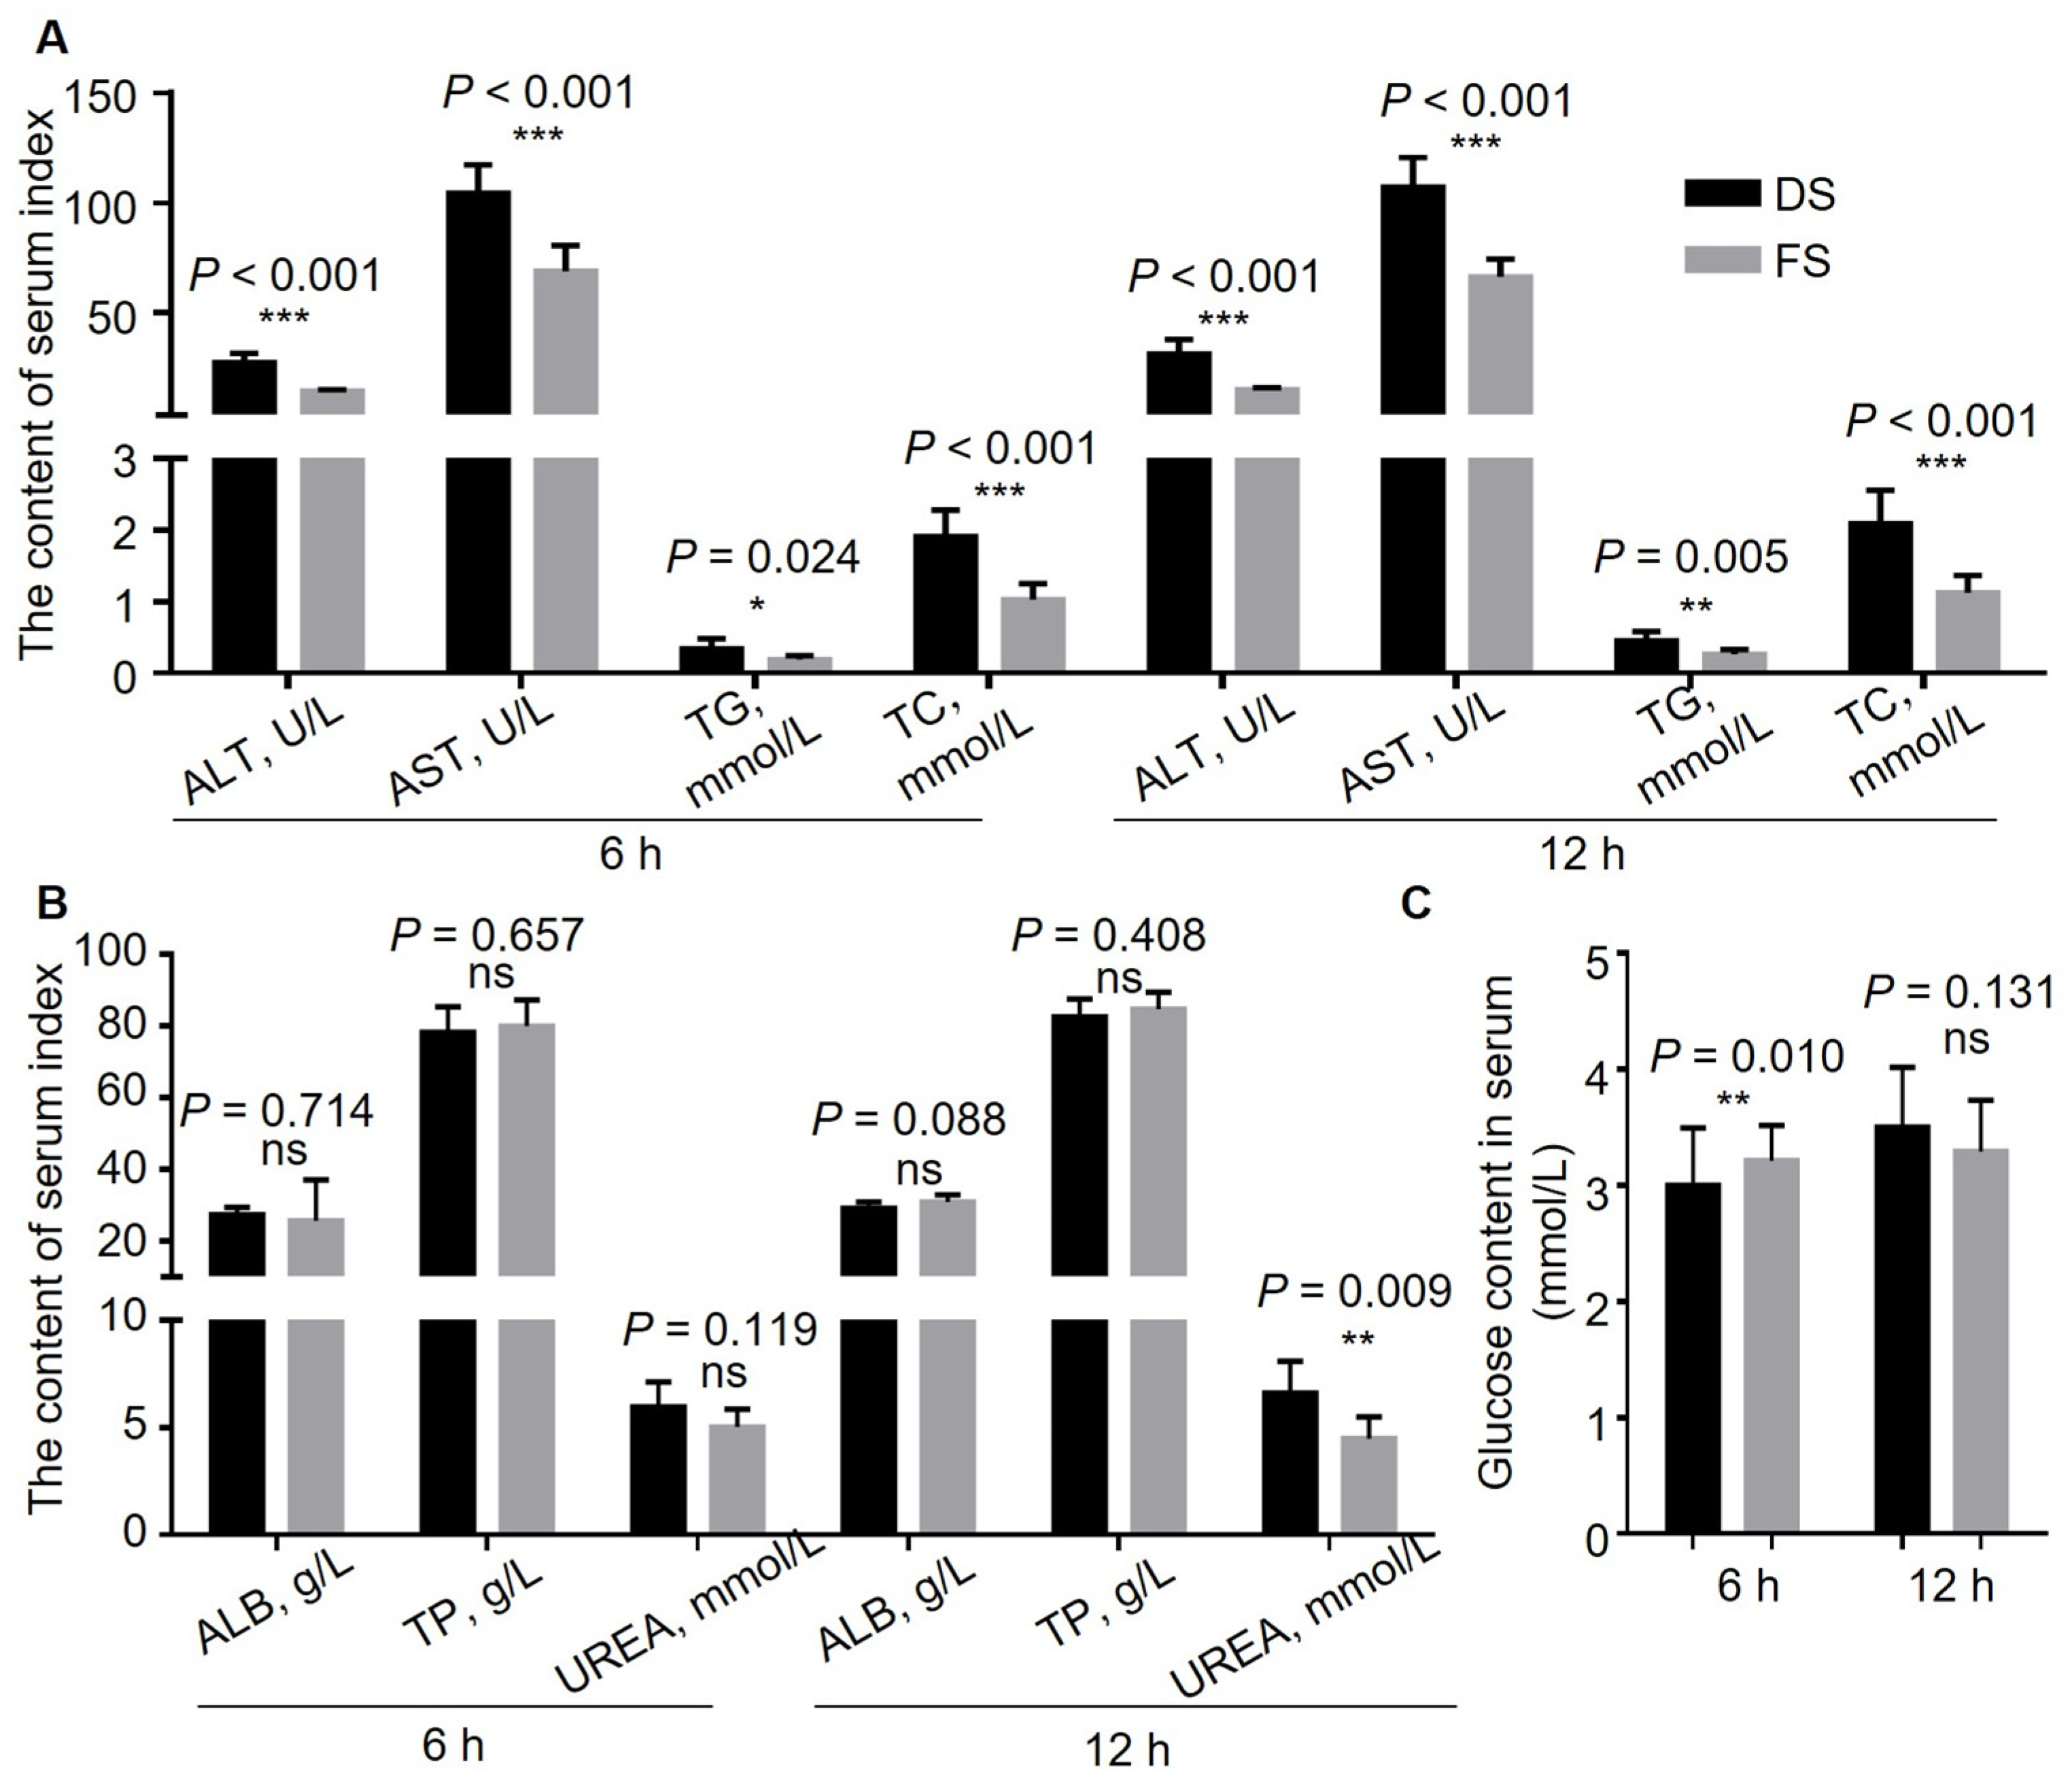
Transaminase is an enzyme in the liver that is released into the blood when liver cells are damaged, increasing the level of transaminase in the blood. Therefore, we can determine the degree of liver damage on the basis of the contents of alanine transaminase and glutamic oxaloacetic transaminase [
19]. The alanine transaminase, aspartate transaminase, triglyceride, and total cholesterol contents in the serum of the fermented straw group were significantly lower than those in the control group at both 6 h and 12 h, indicating that fermented straw can improve the liver health of goats. The contents of albumin, total protein, and urea can reflect the level of protein absorption and metabolism. The results revealed that there was no significant difference in the contents of albumin or total protein between the two groups, indicating that fermented straw did not affect the absorption or metabolism of protein. The urea content of the experimental group at 12 h was significantly lower than that of the control group, possibly because the protein content of corn was higher than that of fermented straw, and the replacement of corn with straw resulted in lower protein content in the whole diet, which ultimately led to a reduction in the serum urea content. The blood glucose concentration in the FS group was significantly greater than that in the DS group at 6 h (
p = 0.010), and there was no significant difference between the two groups at 12 h. This may have occurred as the digestion rate of straw is slower than corn; for the goats in the control group, the available nutrients were almost completely absorbed at 6 h after fasting, whereas in the bodies of the goats in the FS group, some straw remained and provided nutrients.
The width and surface areas of the rumen epithelial papillae increased in the FS group, whereas the length (
p = 0.519) and density of the rumen epithelial papillae were not different, indicating that fermented corn straw increased the surface area of the rumen epithelial papillae by increasing the width of the rumen epithelial papillae. Studies have shown that the enlargement of rumen epithelial papillae can promote the absorption of SCFAs [
20]. Moreover, the ability of SCFA absorption and transport in ruminants at high altitudes is significantly correlated with an increase in the width of the rumen papillae [
21,
22]. In this study, the increase in the width of the rumen papillae suggested that fermented straw might improve the ability of Yichang white goats to absorb SCFAs.
The differences in the SCFA content and molar proportions in the rumen contents of goats in the DS group and FS group indicated that the different feed ratios altered the SCFA composition. The contents of acetic acid and butyric acid produced by fermented straw in the rumen contents were significantly lower than those produced by corn, and the total SCFA content in the rumen fluid in the first 12 h was not significantly different between the two groups, indicating that the total energy provided by the FS group was lower than that provided by the DS group. However, from the point of view of the total SCFA content after fasting for 12 h, it was found that the energy needs of the animal body were met. According to the literature, we inferred that the main reason for the different ratios of acetic acid, propionic acid, and butyrate in the rumen fluid was the catabolic metabolism of different bacteria. The composition of SCFAs in the rumen fluid differed significantly between the two groups, indicating that fermented straw changed the microbial composition of the rumen of Yichang white goats, and the results of microbial 16S diversity analysis also supported the above conclusions.
The feed of herbivorous mammals contains complex structural carbohydrates (such as cellulose and hemicellulose), pectin, starch, monosaccharides, lipids, proteins, lignin, minerals, and other nutrients. The mammals cannot synthesize the enzymes required to degrade these nutrients in their bodies. Instead, the animals rely on the microorganisms (such as bacteria, protozoa, and fungi) living in their digestive tracts to ferment structural carbohydrates such as cellulose, hemicellulose, and pectin to generate nutrients, such as volatile fatty acids (such as acetic acid, propionic acid, and butyrate), to provide energy for the animal bodies [
23,
24,
25]. Therefore, we determined the pH, short-chain fatty acid content, and activity of fiber-degrading enzymes (carboxymethyl cellulase, microcrystalline cellulase, xylanase, and pectinase) in the rumen contents of the goats to clarify the effects of fermented straw on the degradation of structural carbohydrates in the animal body. The increase in the microbial protein content in the rumen contents of the FS group indicated that fermented straw may help increase the amount of bacterial flora that degrades structural carbohydrates, thus increasing the microbial protein levels in the rumen contents.
The differences in microbial composition between different parts of the group were greater than those between the same parts of the groups, indicating that the differences in microbial composition between the rumen fluid and colon contents were greater than the effect of FS on the gastrointestinal microbial composition. The differences in the microbial composition of the rumen fluid between the groups were greater than those of the colon contents, indicating that fermented straw had a greater effect on the microbial composition of the rumen fluid than on the intestinal contents. The differences in microbial composition in different parts of the DS group were greater than those in the FS group, indicating that fermented straw reduced the differences in microbial composition in the rumen fluid and colon contents. In a previous study, the addition of allicin-free garlic (AFG) to the diet reversed the intestinal microbiome confusion caused by the high-fat diet and reduced the number of f-
Lachnospiraceae in the feces of mice [
26]. Lactobacillus paracasei (JS-3) restored microbial diversity and function in quails with hyperuricemia through the enrichment of SCFA-producing bacteria such as f-
Lachnospiraceae [
27]. Enteromorpha prolifera polysaccharide (EPP) alleviates hyperglycemia and aging symptoms of senescence-associated diabetes by increasing the abundance of beneficial bacteria such as c_
Bacilli in the gut of aging diabetic mice [
28]. Oral magnetic natural lipid nanoparticles regulate microbial metabolism by increasing the abundance of beneficial bacteria such as c_
Bacilli in the treatment of colorectal cancer [
29]. The increase in the abundance of beneficial bacteria such as
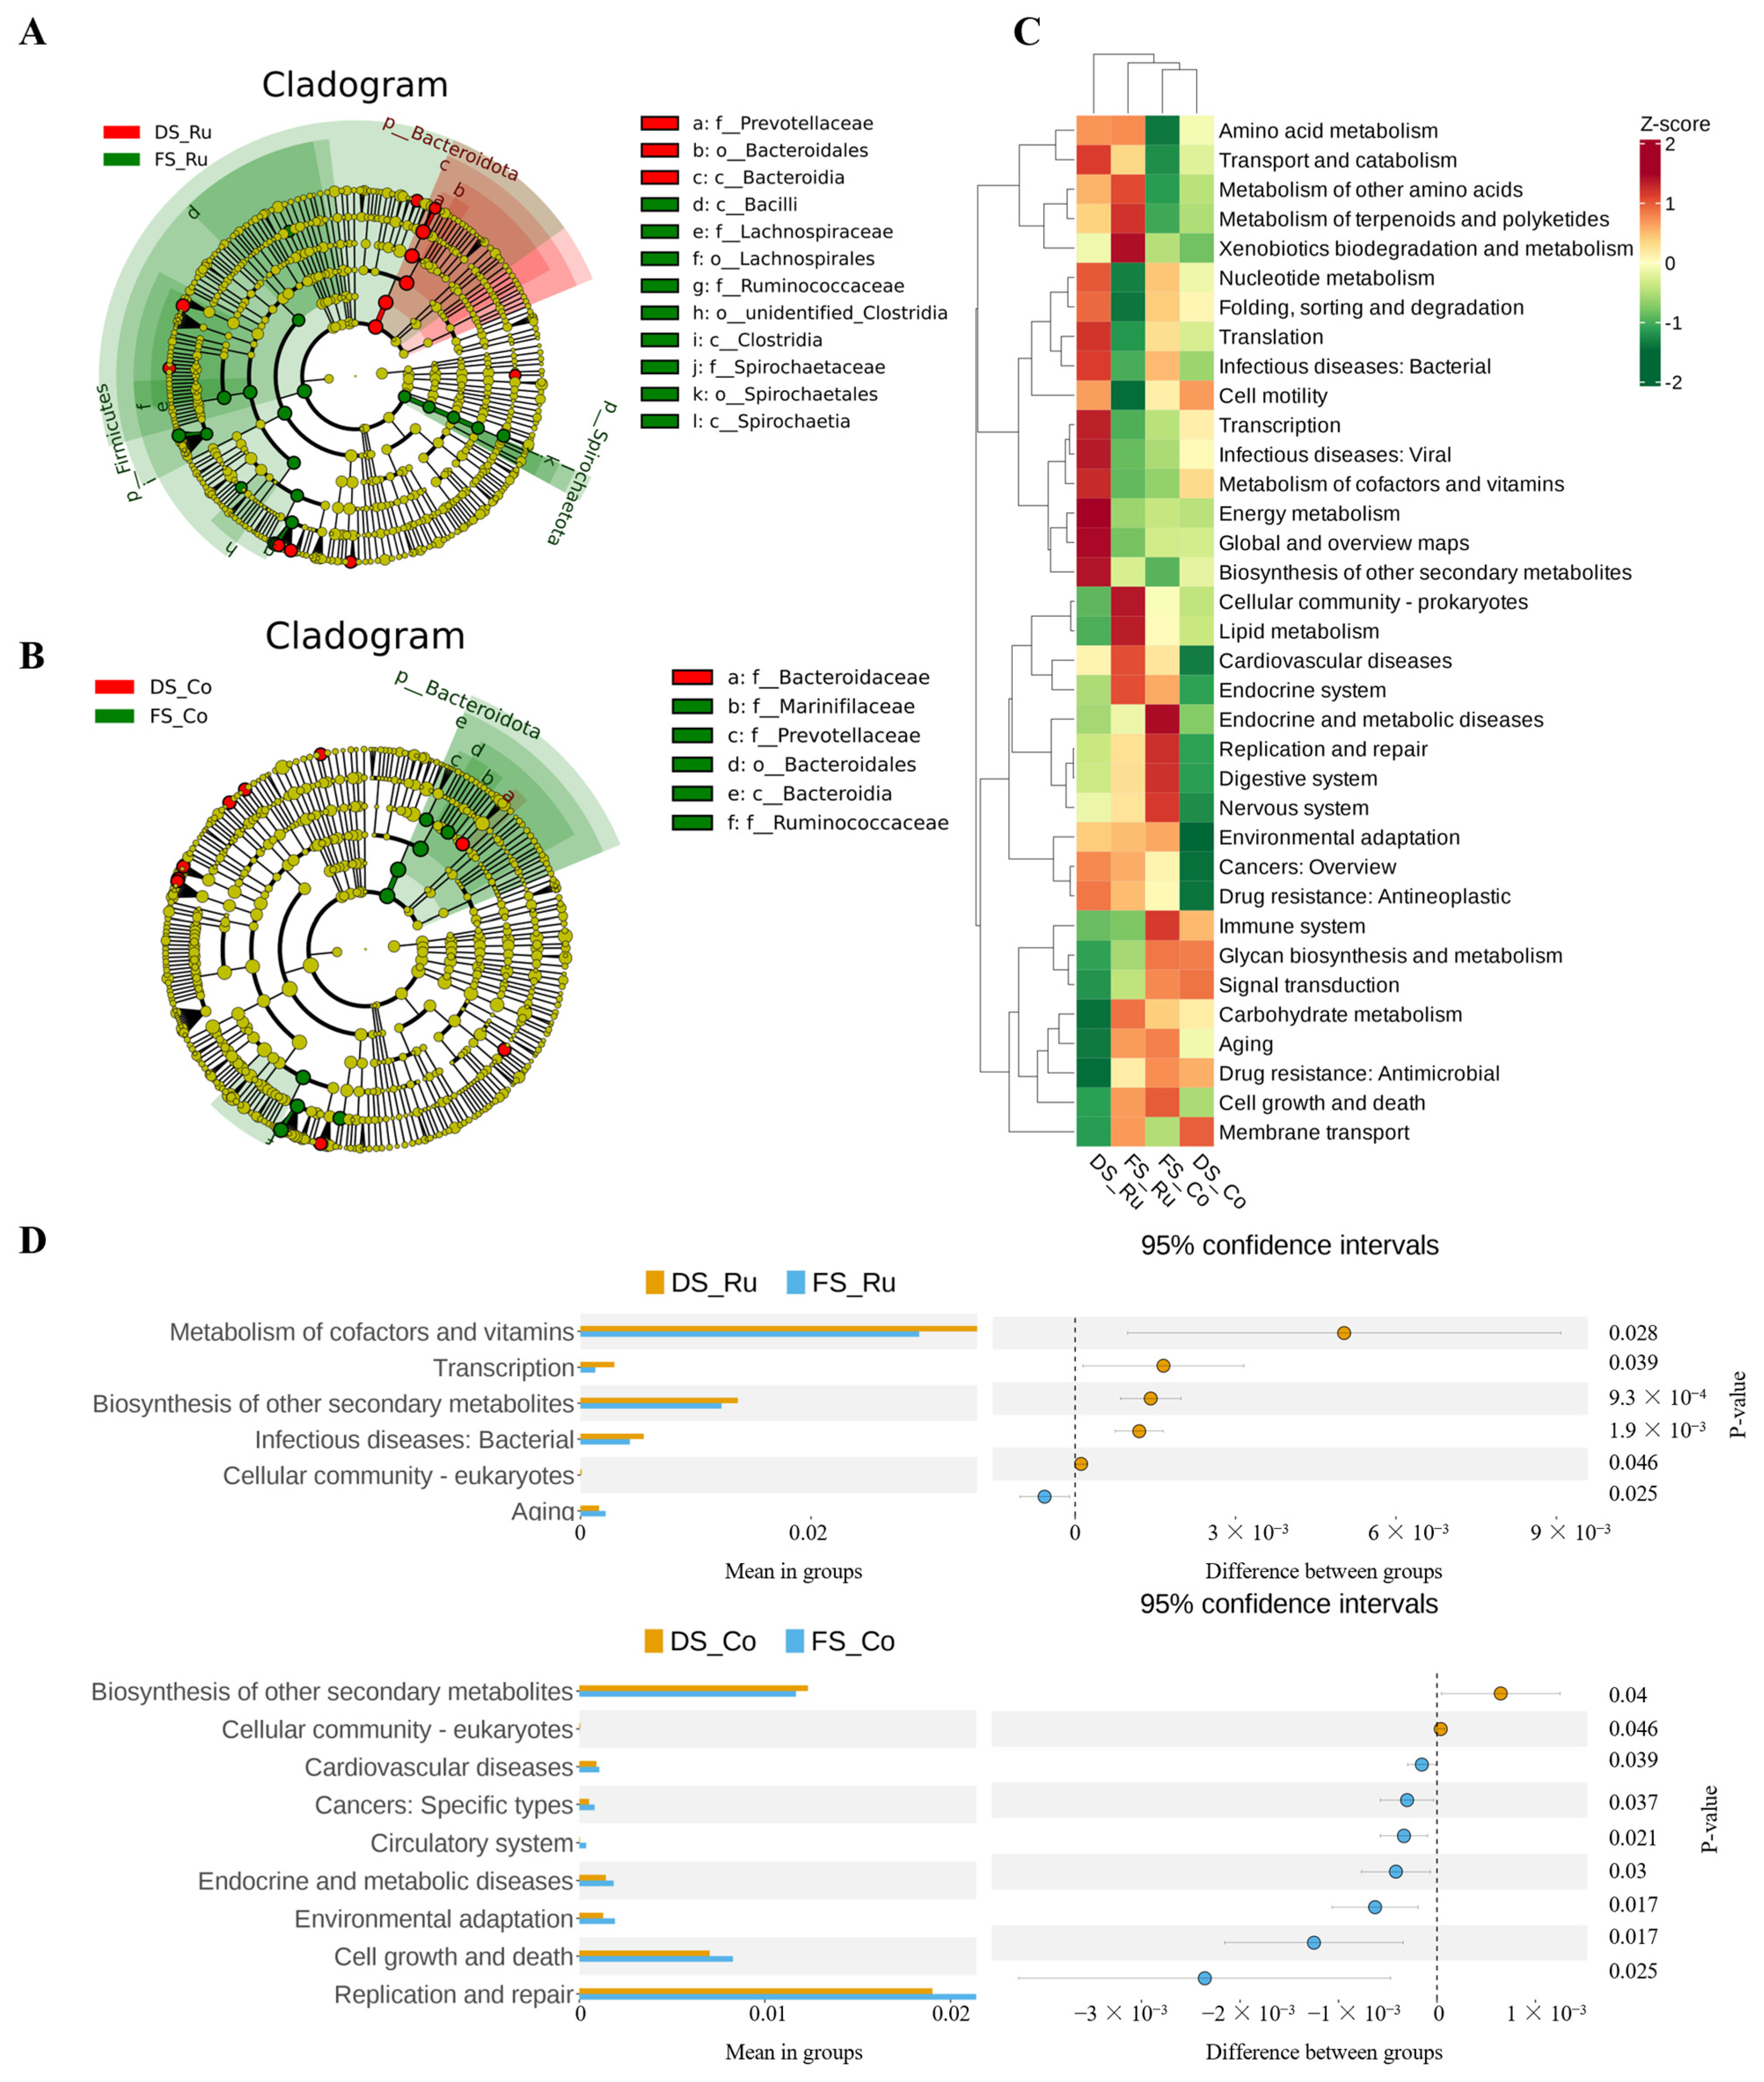
Lachnospiraceae and c_
Bacilli in the FS group indicated that fermented straw could regulate the homeostasis of the gastrointestinal flora. The addition of sulfidated nanoscale zero-valent iron (S-nZVI) to the anaerobic system enriched species such as
Prevotella, which are associated with biological hydrogen production [
30]. g_
Prevotella, which has a high acidogenesis capability, plays an important role in the acidogenic fermentation of organic solid waste and contributes significantly to the production of volatile fatty acids (VFAs) [
31].
Prevotella, a bacterium associated with acid production, was found to be less abundant in the rumen fluid and more abundant in the colon contents in the FS group.
Kudingcha (KDC) alleviates DSS-induced colitis in mice by reducing the abundance of potentially harmful bacteria such as s_
Turicibacter [
32].


 ,
, 


