Article

Effect of Co-Digestion Ratios and Temperature on Biomethane Production in Anaerobic Co-Digestion of Cheese Whey and Tomato Waste

1
Department of Civil and Environmental Engineering, College of Engineering, Qatar University, Doha P.O. Box 2713, Qatar
2
Algal Technologies Program, Center for Sustainable Development, College of Arts and Sciences, Qatar University, Doha P.O. Box 2713, Qatar
3
Center of Advanced Materials, Qatar University, Doha P.O. Box 2713, Qatar
4
College of Education and Arts, Lusail University, Lusail P.O. Box 9717, Qatar
*
Author to whom correspondence should be addressed.
Fermentation 2025, 11(12), 659; https://doi.org/10.3390/fermentation11120659
Submission received: 2 November 2025 / Revised: 20 November 2025 / Accepted: 21 November 2025 / Published: 25 November 2025
(This article belongs to the Section Industrial Fermentation)

Abstract

Tomato processing and dairy industries generate significant effluents worldwide, contributing to environmental pollution and nutrient loss. Anaerobic digestion (AD) offers a sustainable solution by treating these effluents while recovering nutrients and producing biomethane. Substrate composition and temperature play a key role in AD efficiency. This study investigates the batch co-digestion of tomato waste (TW) and cheese whey (CW) under mesophilic (37 °C) and thermophilic (55 °C) conditions over 20 days. Fresh cow manure (CM) served as the inoculum, maintaining a substrate-to-inoculum ratio of 1 (S/I = 1) across all digesters. The co-digestion ratios (CDRs), expressed as CW/TW (gVS/gVS), were set at 4.6, 1.7, 0.8 and 0.3. Co-digestion of TW with CW produced 2.5 times higher methane yield than mono-digestion of TW in both temperature conditions. Similarly, among all digesters set under both temperature conditions, digester 2 (CDR = 4.6) exhibited the highest performance, producing 44 mL/gVS-added cumulative methane under mesophilic conditions and 182.5 mL/gVS-added under thermophilic conditions. Across all CDRs, thermophilic digesters outperformed mesophilic ones, generating three times more biomethane. The modified Gompertz model effectively described the experimental data, achieving R2 values between 0.97 and 1, confirming an excellent fit.

1. Introduction

Anaerobic digestion (AD) is a sustainable process for producing renewable energy by treating organic waste. In Europe alone, there are about 17,400 AD plants, with Germany (~11,000 plants) and Italy among the leading countries in this regard [1]. This process involves various archaeal communities that react with organic waste in the absence of oxygen. AD includes four main stages: hydrolysis, acidogenesis, acetogenesis and methanogenesis [2]. During hydrolysis, complex polymers are broken down into simpler monomers, which are then further converted into volatile fatty acids (VFAs) during acidogenesis [3]. In acetogenesis, these acids are converted into acetate and acetic acid [4]. Finally, in methanogenesis, the products of acetogenesis are converted to methane, carbon dioxide and a small amount of hydrogen sulfide (H2S) [5]. When compared to alternatives like composting, incineration and landfilling, AD is both economical and environmentally friendly [6]. It reduces pollution, generates biogas and produces digestate that can be used as fertilizer [7]. AD supports United Nations Sustainability Goals such as Goal 1 (No Poverty), Goal 13 (Climate Action), Goal 7 (Clean and affordable energy) and Goal 8 (Decent Work and Economic Growth) [7]. This technology can treat various organic wastes, including agricultural and dairy processing wastes, as well as kitchen and dining food waste and many more [8,9]. AD is employed globally, from small domestic setups to large commercial facilities, especially in developed regions like Europe [10]. Many factors affect AD, including substrate and inoculum type, temperature, pH, hydraulic retention time, etc.
Among various organic wastes that can be used in AD, agricultural waste like tomato waste (TW) has unique opportunities when considered as a substrate for this process. Each year, the tomato processing industry produces 8 million tons of waste (3–5% of total tomato production) [11], consisting of peels, seeds and pulp, collectively known as tomato waste. Generally, it consists of 94–95% water content, 0.9–1.7% proteins, 0.2–0.5% fats and 3.9–5.96% carbohydrate content [12]. TW production is a challenging issue in the global tomato processing industry [13,14]. This waste comes from tomatoes unsuitable for making pastes, juices and sauces due to their maturity, color or shape. Similarly, overproduction in peak demand can also result in a surplus amount of tomato products, ultimately thrown away as waste. Similarly, surplus amounts of tomatoes overproduced due to high demand are also thrown away as waste. When thrown on bare ground, such waste can pose significant environmental risks if not properly managed [13,15].
Likewise, another organic waste from dairy effluents, cheese whey (CW), has also been considered as a promising substrate for AD. Around the world, CW is produced in the amount of 190 billion kgs per year [16]. It is a liquid that is produced during cheese production. For every 1 kg of cheese production, approximately 9L of CW is extracted. Generally, its pH is around 6, and it contains 50% of milk content, like lactose and proteins. Typically, CW consists of water (93–94%), 0.7–0.9% proteins (β-lactoglobulin and α-lactalbumin), 4–5% lactose, 0.7–0.9% minerals and a small amount of fats [17]. It has high energy content, hence, vulnerable if disposed of in the environment. It can be utilized for microbial fermentation, health-related drinks, biofuels and vinegar [18]. Several lab-scale and pilot-scale experiments have been conducted so far using CW as a feedstock [19,20]. On one hand, it can produce energy and be a way for resource recovery; however, if left untreated, it can pollute the environment [21].
Despite the potential of TW and CW as substrates in AD, they pose significant challenges when digested individually. For instance, TW has a naturally lower pH, which can hinder the activity of methanogens if the process is not properly managed [22]. Methanogens require a stable pH range of 6.5–7.5 to function efficiently. Additionally, TW has a low buffering capacity due to its low alkalinity, which limits its ability to neutralize volatile fatty acids (VFAs) produced during digestion. As a result, accumulation of these acids leads to further pH reduction that inhibits methanogenic activity and reduces methane yield. However, the accumulated VFAs, which are versatile biochemical intermediates, are becoming relevant in fields of bioplastic, solvent or biofuel production, an alternative valorization pathway highlighted in recent studies [23]. TW has a high percentage of structural cell wall components, which are difficult to degrade, causing lower biogas production in AD [24]. Similarly, CW mono-digestion can also lead to acidic pH and early acidification due to its increased biodegradability and lower alkalinity. Such conditions can easily reach high VFAs accumulations and, hence, process failure [25]. Moreover, the higher protein content and rapid degradability of CW also cause foam and scum formation, which makes it difficult for gas to escape from the substrate; this phenomenon also lowers mixing efficiency and creates dead zones [26].
Co-digesting TW with other organic wastes has proven to be a highly efficient method; for example, improvement in methane yield was observed when CM and corn stover were co-digested with TW in amounts of 12–40% of total VS added [27]. In the study of Gil et al., improved methane production was observed when TW had around a 50% share of total VS added [28]. Similarly, co-digesting CW has also shown promising results with other substrates like sludge, cattle manure and agricultural wastes. According to Hallaji et al., co-digestion can increase the efficiency of CW AD by 31–180% [29]. Additionally, the efficiency of CW AD in methane production can be increased by 30% when co-digested with sludge and fruit waste [26].
Challenges associated with AD of CW and TW, when treated separately, can be mitigated through their combined treatment. For instance, the low degradability and C/N ratio of TW can be offset by the high biodegradability and C/N ratio of CW, creating synergistic effects on methane production efficiency [30,31,32]. This study aims to evaluate anaerobic co-digestion performance of TW and CW under both different temperature conditions (mesophilic—37 °C, thermophilic—55 °C) and different co-digestion ratios (CW/TW = 4.6, 1.7, 0.8, 0.3 gVS/gVS), in order to determine their impact on methane yield, biodegradation kinetics and process stability. This is carried out under fixed substrate-to-inoculum ratio of 1.0. To our knowledge, this study is first of its kind that evaluates the influence of co-digestion ratio and temperature on CW–TW mixtures simultaneously and utilizes the modified Gompertz model to quantify kinetic parameters (Pmax, Rmax, λ) for each operational condition. Overall, this approach and the obtained results provide novel insights into assessing the potential of synergistic behavior and kinetic response for agro-industrial wastes during AD.

2. Materials and Methods

2.1. Substrate and Inoculum

For TW, tomatoes were purchased from a local market, crushed using a laboratory grinder (IKA MF 10 Basic, IKA Werke GmbH & Co. KG, Staufen, Germany), and passed through an ASTM E11 No. 6 sieve (Gilson Company Inc., Middleton, WI, USA) with an aperture size of 3.35 mm. CW was extracted from coagulating fresh milk using acetic acid. The whey was carefully separated from the curd manually. Both TW and CW were kept for short-term refrigeration at 4 °C, as this would preserve the substrate’s original characteristics, so realistic handling can be simulated prior to subjection to digestion. Freeze and thaw could alter matrix structure and composition. Regarding the selection of inoculum in an anaerobic system, it is important as it can affect the overall system performance in terms of stability and efficiency in biogas production. For this study, fresh cow manure (CM), collected from a cow farm in Umm-salal, Doha, Qatar, was used as inoculum. Many studies have mentioned CM to have the potential for using it as an inoculum because it is a major source of methanogens like Methanomicrobiales, Methanococcus, Methanosaetaceae, Methanosarcinaceae, etc. [33,34]. Total solids (TSs), volatile solids (VSs) and VFAs of the substrates and inoculum were measured using the standard methods [35]. Detailed properties of the substrate and inoculum are shown in Table 1, and further details on the analytical methods can be found in Section 2.2.

2.2. Analytical Methods

TS and VS were measured using an analytical balance (OHAUS, model AX224/E, Parsippany, NJ, USA), a drying oven (105 °C) and a muffle furnace (550 °C) [35]. pH was measured using a Benchtop pH Meter (Model PH-3110, Xylem Analytics Germany GmbH D-82362, Weilheim, Germany) after calibration. VFAs (mg/L) were monitored throughout the digestion process following methods followed in litrature [35]. Potentiometric titration of the digestate supernatant was carried out using 0.1 M HCl and 0.1 M NaOH solutions. The titration curve established between pH 3.5 and 7.0 was used to determine volatile acids’ concentrations. Titrations were performed using a pH Meter (Model PH-3110, Xylem Analytics Germany GmbH D-82362, Weilheim, Germany).
Methane volume and composition were measured using the Automatic Methane Potential Test System (AMPTS II Light, BPC Instruments AB, Lund, Sweden, measurement precision ±1% (CV)). Biogas was passed through a 5 M NaOH absorption unit where a thymolphthalein indicator was placed to remove CO2. This allows only CH4 to reach the gas-volume measuring device, which works on the liquid-displacement and buoyancy principle.
Total organic carbon (TOC) and total nitrogen (TN) were measured using a TOC/TN Analyzer (TOC-L CSH, Shimadzu, Kyoto, Japan), according to ASTM procedures [36]. Fiber fractions (cellulose, hemicellulose, lignin) were measured following Van Soest NDF/ADF/ADL procedure [37]. All the measurements were carried out in triplicate.

2.3. Experimental Program

Automatic Methane Potential Test System (Automatic Methane Potential Test System (AMPTS II Light, Bioprocess Control AB, Lund, Sweden) (Figure 1), a batch experimental setup of “Bioprocess control”, was employed for this study [38,39]. Batch digestion was chosen to identify the biodegradability and subsequent methane potential of CW and TW mixtures under strict conditions. This strategy allows genuine comparison of co-digestion ratios with temperature effects. This setup consists of four units, i.e., a sample incubation unit (Figure 1a), a CO2 capturing unit (CCU) (Figure 1b), a gas measuring unit (Figure 1c), and a computer (Figure 1d). The sample incubation unit has six digesters, surrounded by distilled water, which keeps the digesters at a constant temperature. Each digester has a 2000 mL volume (1800 mL working and 200 mL head space). The head of each digester has two ports, one for intermittent sample collection for further analysis and the other for biogas collection from head space. The mixing mechanism is also mounted on top of each digester, having ON-OFF buttons and adjustable speed options. Biogas produced in the digester is then transferred through the pipes to the CCU, which consists of six containers connected to each digester correspondingly. Each container in CCU has an indicator solution, made of a standard solution of 5 M NaOH with a thymolphthalein indicator. This captures acidic fractions like CO2 and H2S and allows only biomethane to gas measuring units. When the solution reaches its capacity, the blue color indicator turns colorless. The gas measuring unit has wet flow meters, principally working on buoyancy and liquid displacement. These flow meters send digital signals through the device, and finally, data is sent to a computer where data acquisition systems record, analyze and display graphs.
Before preparing the digester solution, firstly, CW and CM were diluted with distilled water to ensure S/I = 1 (gVS/gVS) for all digesters. For digester solution preparation, substrates and inoculum were mixed in volumes as shown in Table 2, such that co-digestion ratios (CDRs), i.e., CW/TW (gVS/gVS), become 4.6, 1.7, 0.8 and 0.3, designated with D2, D3, D4 and D5, respectively. Similarly, digesters named D1 and D6 were kept as controls, having CW and TW alone, respectively. CDRs were selected such that there is a gradual transition from CW-dominant to TW-dominant digesters, i.e., D1 to D6, respectively, to systematically evaluate their synergistic and inhibitory effects. Moreover, the choice of such CDRs facilitated equal volume distribution of CW and TW across digesters for ease of handling. Three blank digesters having only inoculum were run for the same duration, for each temperature condition. The amount of inoculum was kept constant in all digestors. TS was kept around 5% for all digesters. All other properties of digester solutions are shown in Table 2. Initially, the samples were tested in mesophilic conditions (37 °C) and then in thermophilic conditions (55 °C), each for 20 days. Mixing speed (80 RPM) was kept constant for all digesters with alternate on and off cycles (5 min on and 1 min off). All the tests were carried out in duplicate trials. To compare end-products, VFA concentrations measured in mgL−1 (acetic-acid equivalents) were converted to their COD equivalents by applying the stoichiometric factor 1.067 g COD g−1 acetic acid [40], further converted to methane equivalents by applying AD relationship of 1 g COD = 350 mL CH4 at STP [41], expressed as mL CH4 g−1 VS-added. It was calculated using Equation (1):
VFA C H 4   eq .   ( mL   g 1   VS ) = VFA   ( mg   L 1 ) 1000 × 350 VS sub
The percentage distribution was made through Equation (2)
% C H 4 = Methane Methane + VFA C H 4   eq . × 100 , % VFAs = 100 % C H 4

2.4. Kinetic Modeling

The modified Gompertz model is generally employed to study the kinetic behavior of the cumulative methane production vs. time graph. This model has shown excellent performance as compared to other models, like first-order kinetics, in terms of fitting accuracy while showing a correlation with experimental graphs [42,43]. Such graphs usually exhibit sigmoidal trends having three stages, namely, the lag phase, the exponential phase and the plateau [44]. The corresponding three parameters are λ (lambda), Pmax and Rmax. In this study, Python libraries like SciPy. Optimize (version 1.11.4) was used to apply the model to the experimental curves. The general form of the Gompertz model is given as follows in Equation (3):
P t = P m a x . e x p e x p R m a x . e P m a x . ( λ t ) + 1
where P(t) is cumulative methane production in mL, Pmax is the maximum cumulative methane value in mL, λ is the lag phase in days, t is time in days, Rmax is the maximum methane rate in mL/day, and e is Euler’s constant. Differences in Pmax among co-digestion ratios under each temperature regime were evaluated using two-way ANOVA based on duplicate reactors per condition, with significance set at p < 0.05.
The modified Gompertz model is the preferred kinetic evaluation model for methane production in batch AD due to its empirical fit and prediction of key curve features. Unlike the first-order model, which is unable to compare initial latency or a symmetric logistic function, the Gompertz model incorporates a lag phase (λ) followed by a sigmoidal rise and maximum production rate (Rmax) [45], highly simulating typical BMP curves that follow pattern of slow start-up, rapid biogas evolution, and, eventually, a plateau. Multifarious studies reported high goodness-of-fit (high R2 and low error) when compared to first-order and logistic models [46]. Gompertz-based fits often explain >99% variance in complete methane data, performing better than other models, especially when a lag phase is present [47]. Hence, it is widely used for BMP modelling due to improved efficacy and accurate interpretation (e.g., lag time, max rate) [46]. However, a mechanistic flow is present in the Gompertz equation. Its parameters do not directly explain substrate or microbial dynamics, limiting its predictive insight and making it sensitive to dataset variability [48]. Besides, it also does not describe multi-phase digestion when gas production deviates from a sigmoidal shape (e.g., biphasic feeds or toxic shocks). This necessitates either model extensions or combining multiple Gompertz components. In short, Gompertz model can capture lag and rate of methane production, often giving better fit performance than first-order or logistic models in batch tests [49].

3. Results and Discussion

3.1. Cumulative Methane Production

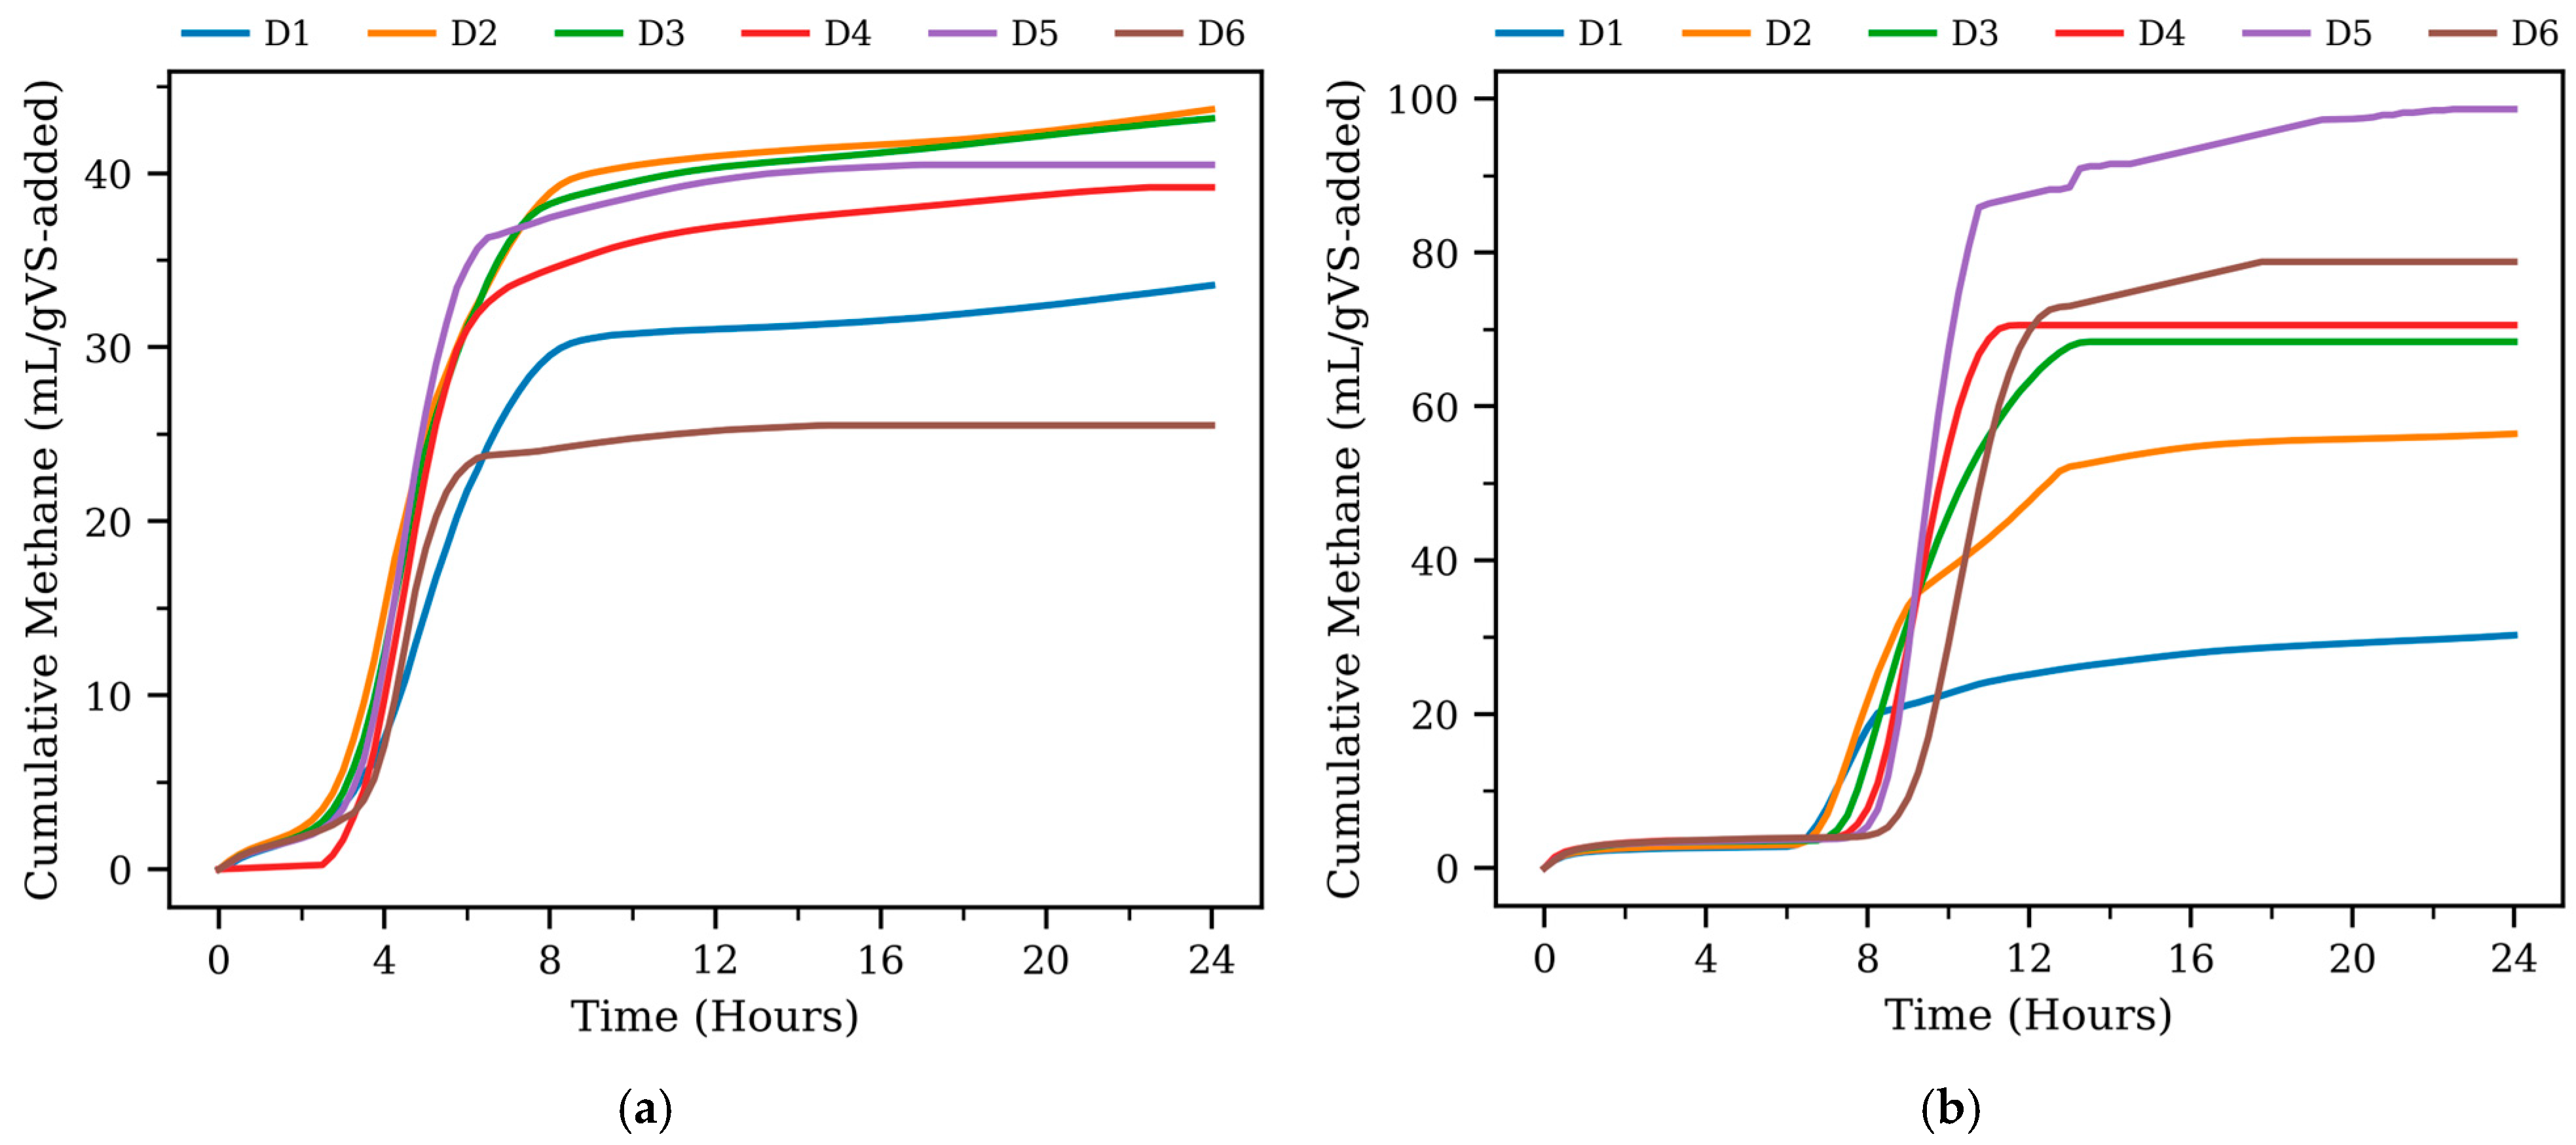
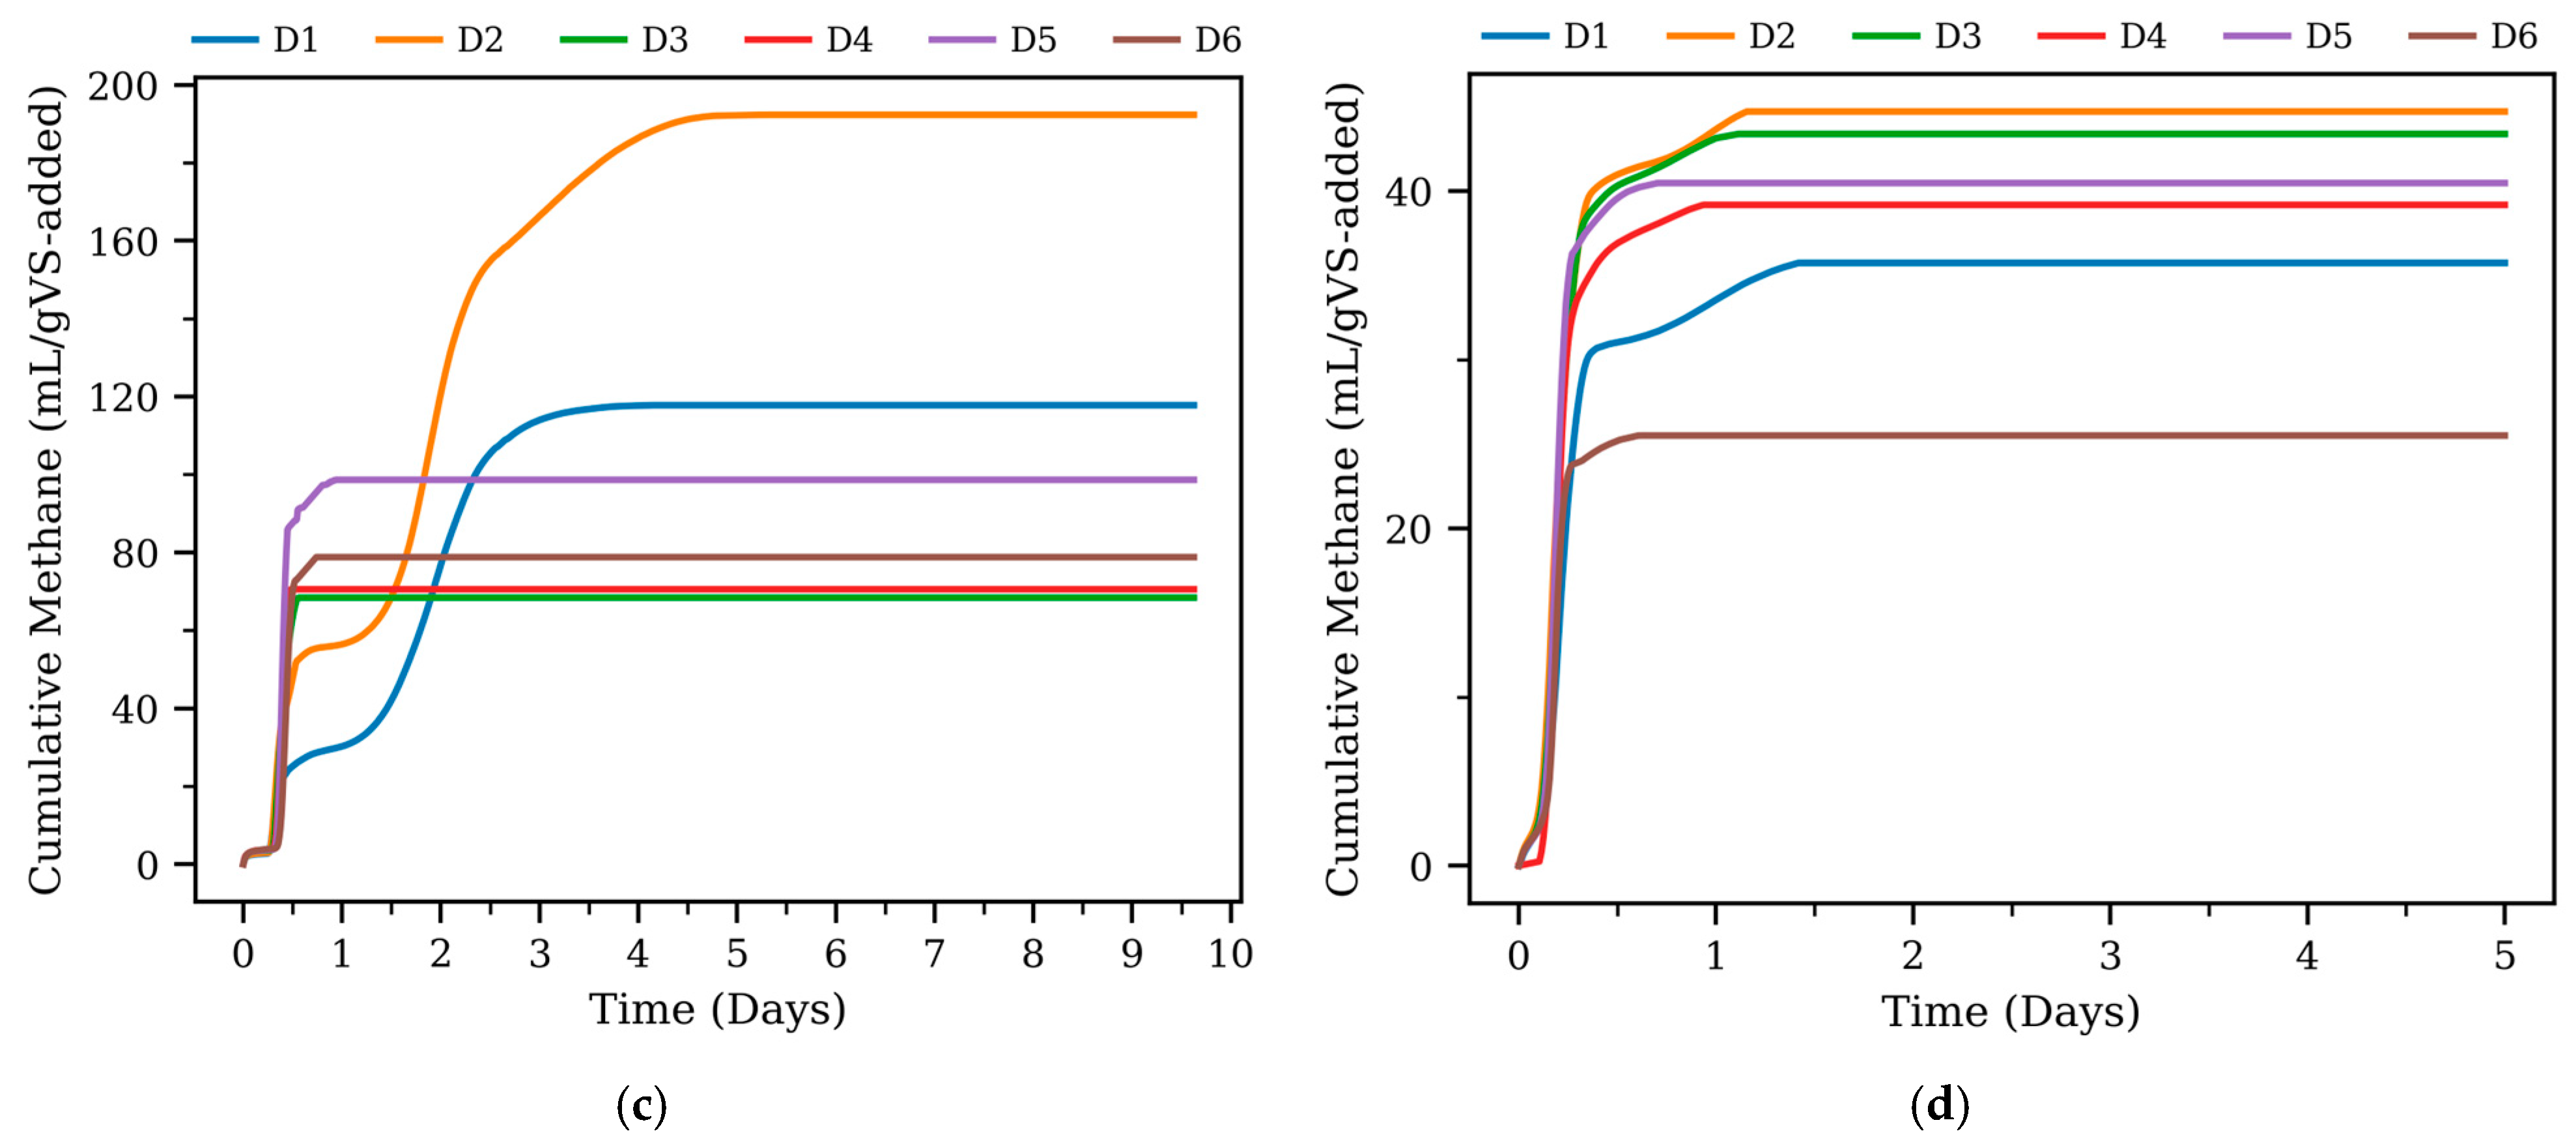
The critical role of various CDRs and temperature conditions on the efficiency of the AD process in producing methane with time is illustrated in Figure 2a–d. For a broader view of the entire process, Figure 2c,d display data in days. On the other hand, Figure 2a,b focus exclusively on the first 24 h, as all three kinetic phases of anaerobic digestion are clear in these graphs. Methane production during AD normally follows three kinetic phases: lag phase, exponential phase and plateau phase that reflects the overall methane production profile. The initial lag phase deals with hydrolysis of complex polymers with limited acidogenesis, which is considered a rate-limiting step as hydrolytic enzymes and microbial consortia respond to substrate. In the exponential phase, rapid methane production is achieved via readily degradable compounds that are converted into VFAs, fatty acids, acetate and hydrogen in the stages of active acidogenesis and acetogenesis. Lastly, in the plateau phase substrates are depleted and inhibitory intermediates accumulate, i.e., methanogenesis which results in stabilizing methane yields.
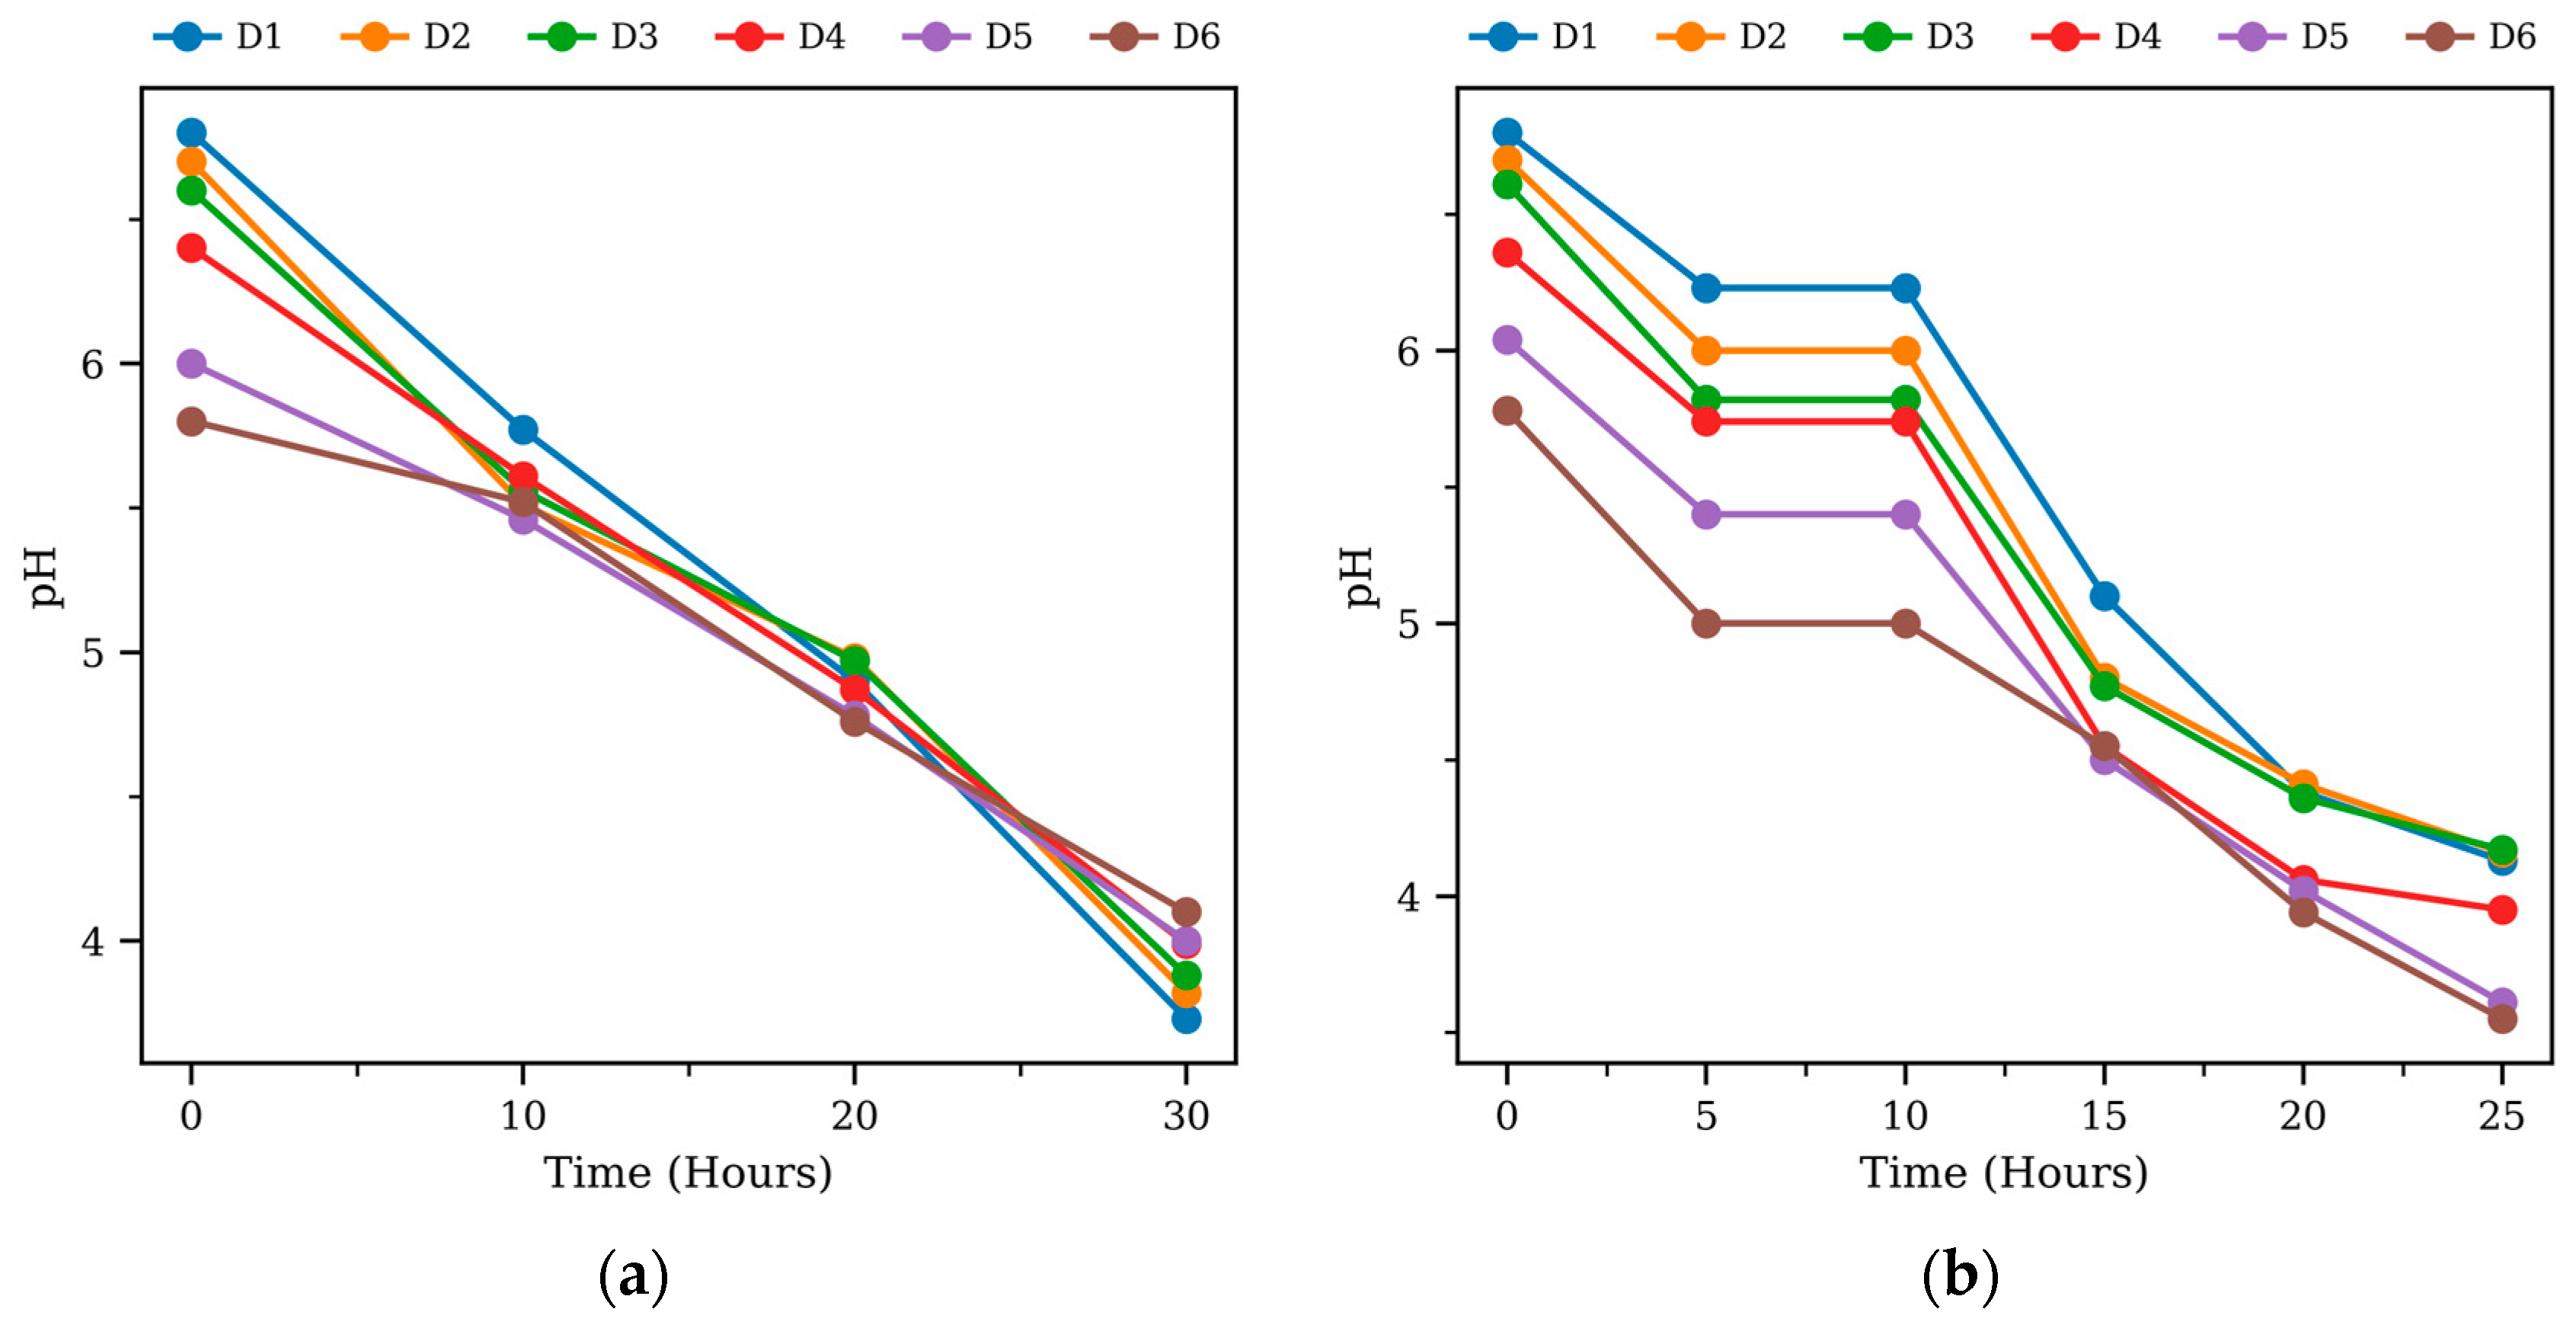
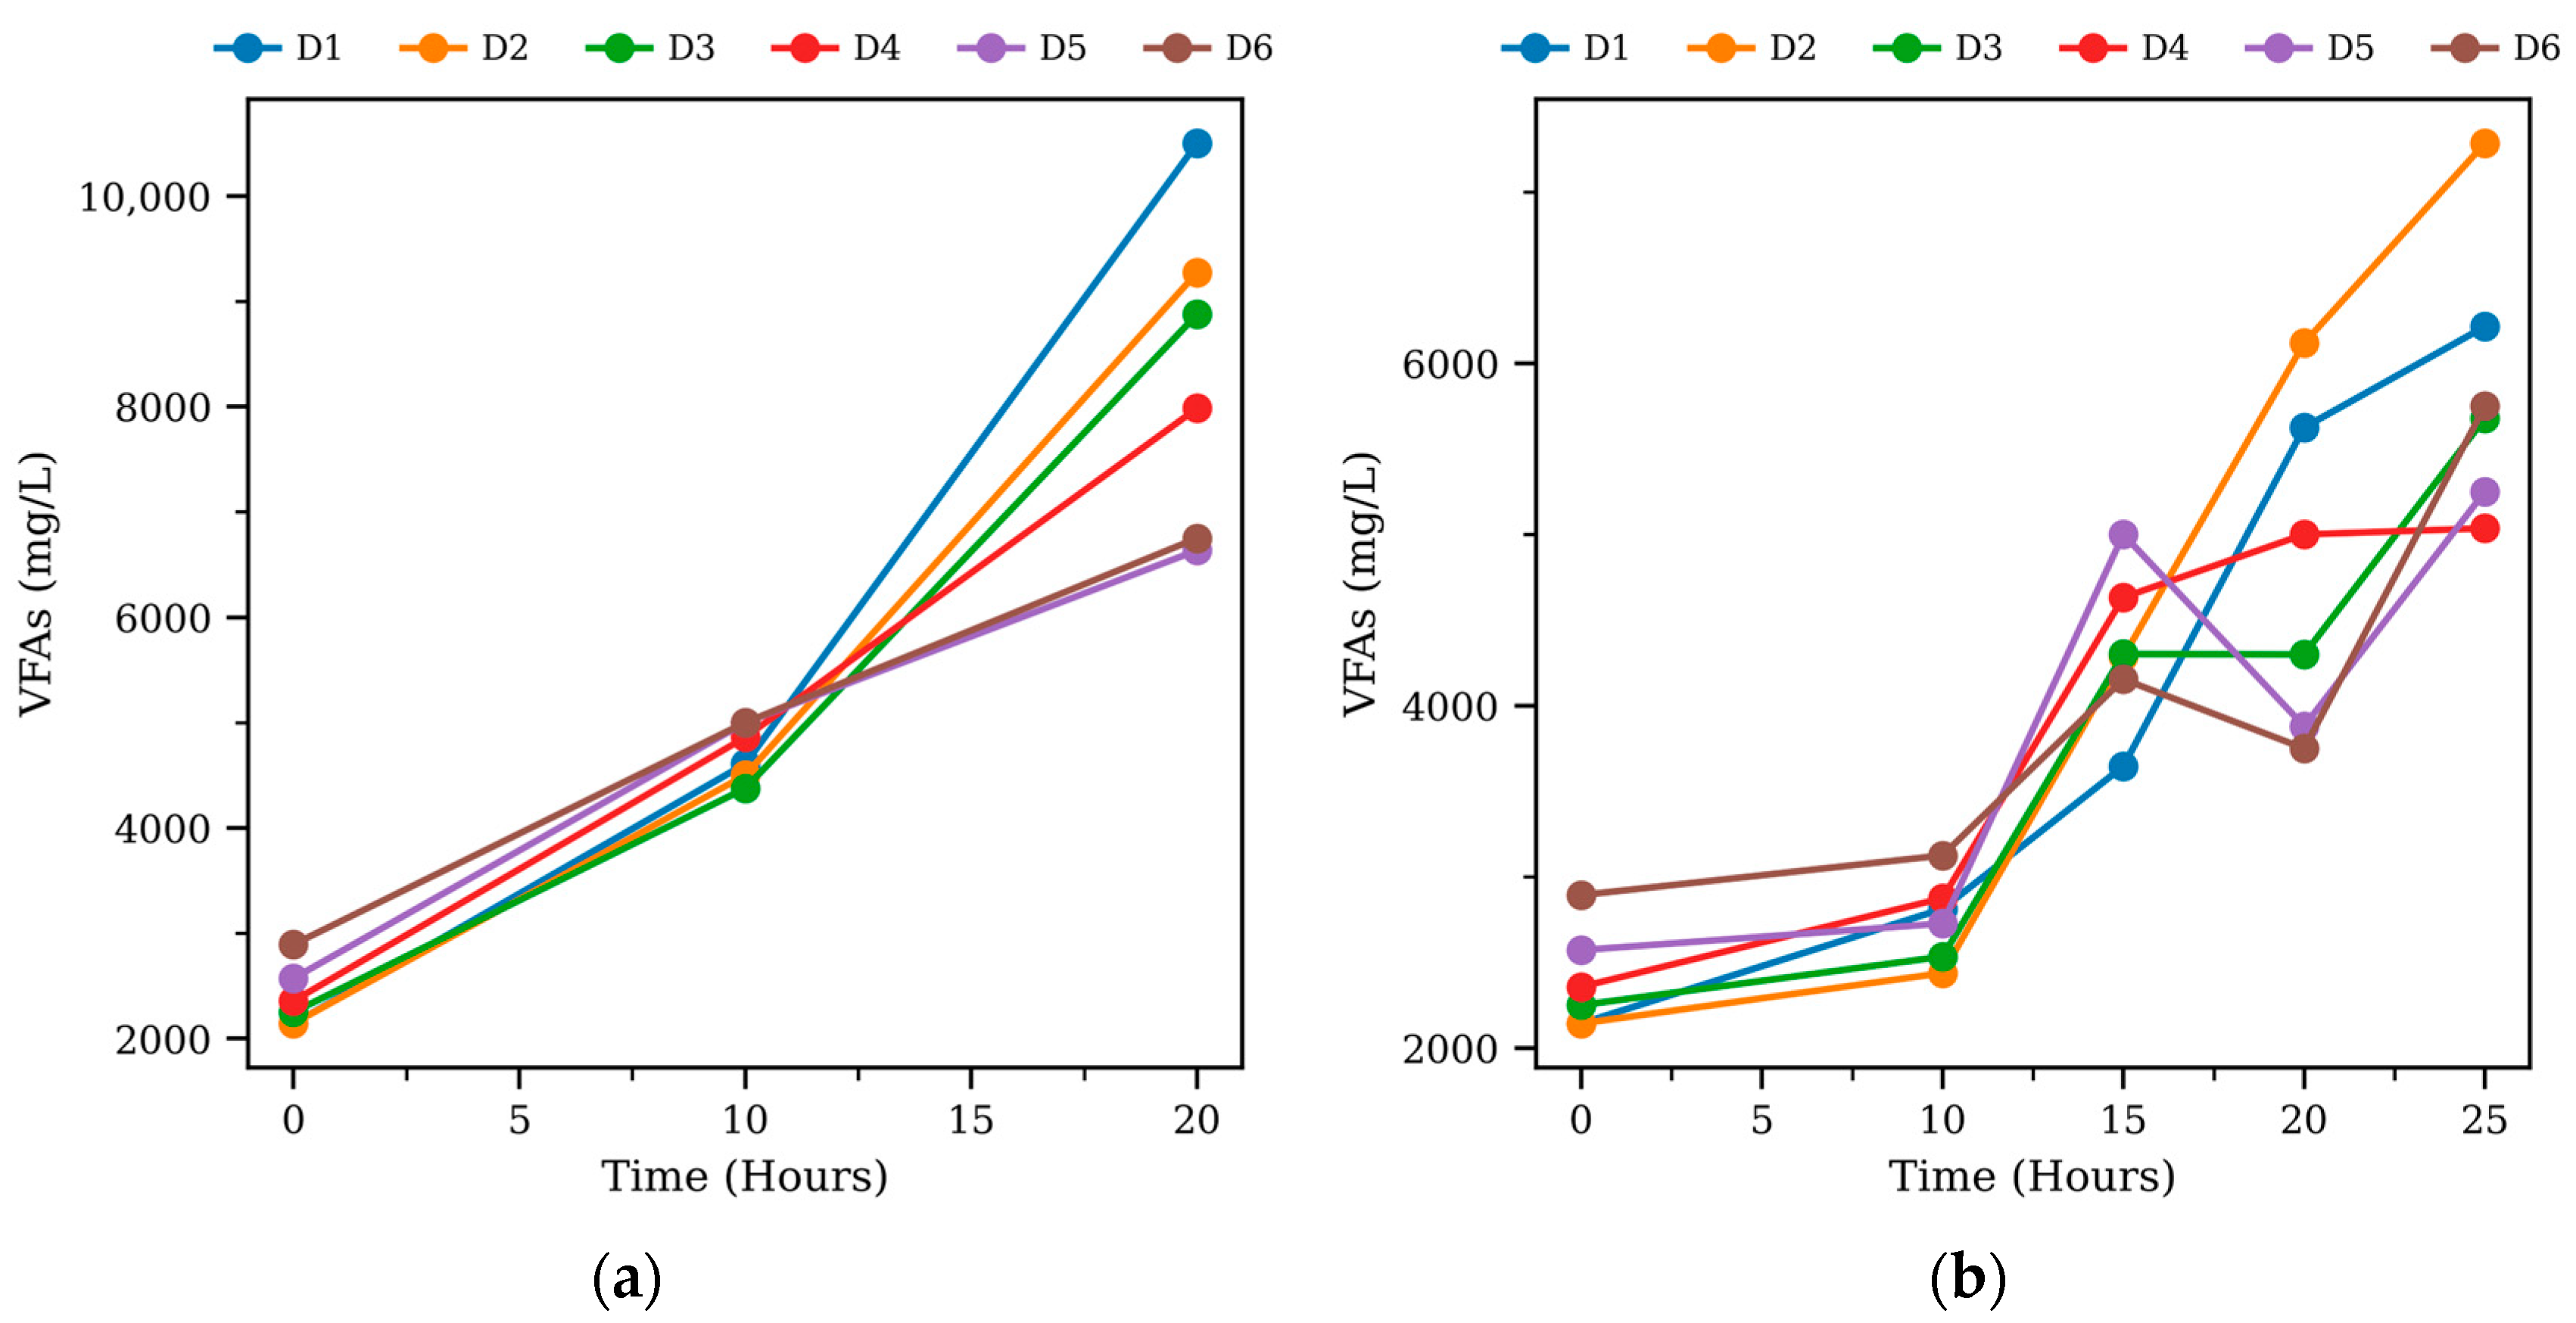
Methane production efficiency is highly dependent on process stability, which is linked to maintaining optimum pH and controlled VFAs accumulation [50]. During the experiments, these stability indicators were monitored during key time intervals to the time beyond which there was slight methane production observed. Graphs of pH and VFAs are shown in Figure 3a,b and Figure 4a,b, respectively.
In mesophilic conditions (see Figure 2a,c), all digesters exhibited a lag phase of 2–3 h, suggesting readily available substrate and rapid acclimatization of microbial consortia to the anaerobic environment, indicating efficient hydrolysis and metabolic adaptation. The lag phase was followed by the exponential increase in methane accumulation from 3 to 9 h. This increase can be attributed to the stable pH range (6–7) and lower VFAs accumulation (2000–3000 mg/L) at the beginning, which facilitated high microbial activity. From 9 h onwards, negligible methane production was observed (reaching a plateau), corresponding to a high accumulation of VFAs, which reached around 7000 mg/L at 10 h, thus causing a pH drop to the 4–5 range. Under acidic conditions (pH < 6), the methanogenic activity is suppressed due to prevalence of microbial community by acidogenic bacteria. Excessive production of VFAs, especially acetic acid, during acetogenesis permeates cell membrane of methanogens, forming H+ and CH3COO within cytoplasm, which lowers intracellular pH and inhibits vital metabolic enzymes. Meanwhile, high substrate degradation increases internal hydrogen partial pressure that destabilizes syntrophic acetate oxidation, leading to constraining methane formation. These synergistic effects shift the process towards acid accumulation instead of methane production, as explained in the literature [51]. The system did not recover till the experiment ended, as the VFAs accumulated (nearly) 10,000 mg/L, overwhelming the system’s buffering capacity. This pattern of rapid acidification and inhibition due to uncontrolled VFA accumulation aligns with the findings in the literature [52,53,54].
Under thermophilic conditions (see Figure 2b,d), the lag phase of all digesters lasted between 6 and 8 h, almost double the duration observed in mesophilic conditions. The longer lag phase indicates that microbial consortia take longer to acclimate to high temperatures. In the next 5 h, because of the stable pH range (5–7) and low VFA accumulation of less than 3000 mg/L, all digesters produced a high amount of methane at an exponential rate. Following this phase, a plateau was achieved at the 12th hour, as VFA accumulation reached 4000 to 5000 mg/L (reducing pH below 5) (except D1 and D2). However, approaching the 24th hour, D1 and D2 recovered and started methane production exponentially till day 3 and day 4 (reaching the plateau phase). The quick recovery and prolonged methanogenic activity of these digesters correspond to the higher buffering capacity, which is attributed to the increased alkalinity of these digesters [55]. Furthermore, by 25 h, the accumulation of VFAs reached around 7000 mg/L, further dropping the pH to 4, making digester recovery further (even) difficult to recover until the experiment concluded on day 20.
Under both temperature conditions, D6 yielded the lowest methane among all digesters, i.e., 25.47 mL/gVS-added in mesophilic conditions and 66.66 mL/gVS-added in thermophilic conditions. However, when co-digested with CW, methane production increased by 2.5 times in both conditions, as observed in D2. Generally, digesters with high concentrations of CW (D1, D2 and D3) produced higher cumulative methane as compared to others [56]. Among them, D2 (CDR 4.6), characterized by maximum CW concentrations, exhibited the highest peak cumulative methane of 182.5 mL/gVS-added in thermophilic conditions and 44 mL/gVS-added in mesophilic conditions. High temperature helped in the disruption of recalcitrant cell wall components in TW, as well as the denaturing of protein content in CW, thus making a less viscous solution, having readily available organic matter for degradation.
Better performance of digesters having a high amount of CW, i.e., D2, is mainly attributed to a more balanced organic composition. TW has a higher amount of cell wall components like cellulose, hemicellulose, lignin and ash (See Table 1). These components are hard to degrade, which creates a staggered hydrolysis pattern with easily biodegradable contents in CW, i.e., lactose and soluble proteins [56]. Therefore, in the case of D2, VFAs produced by CW in hydrolysis and acidogenesis are converted more efficiently by methanogens, without causing acidification, thus producing sustained methane comparatively. Similarly, lower lignin content (compared to high TW digesters) minimizes enzymatic inhibition, while CW promotes microbial adoption and high extracellular enzymatic activity.
Similarly, enhanced performance of D2 also corresponds to balanced C/N. Such conditions ensure the optimal supply of carbon for energy and nitrogen for microbial growth, which helps in preventing inhibition of the AD process. C/N values lower than the optimum in the case of digesters having high TW concentrations, excess nitrogen might have caused ammonia accumulation, which hinders the activity of microbes, particularly methanogens. This becomes the dominant pathway, hydrogeophilic methanogens and syntrophic acetate-oxidizing [57]. Ammonia stresses cause metabolic shifts, i.e., from the acetoclastic pathway, which is effective in acetate to methane, to a hydrogenotrophic pathway, which is less efficient. In this shift, oxidizing bacteria can be found in high numbers. Furthermore, ammonia inhibition corresponds to Methanosaeta and Methanosarcina, which serve as microbial inhibition indicators [58].
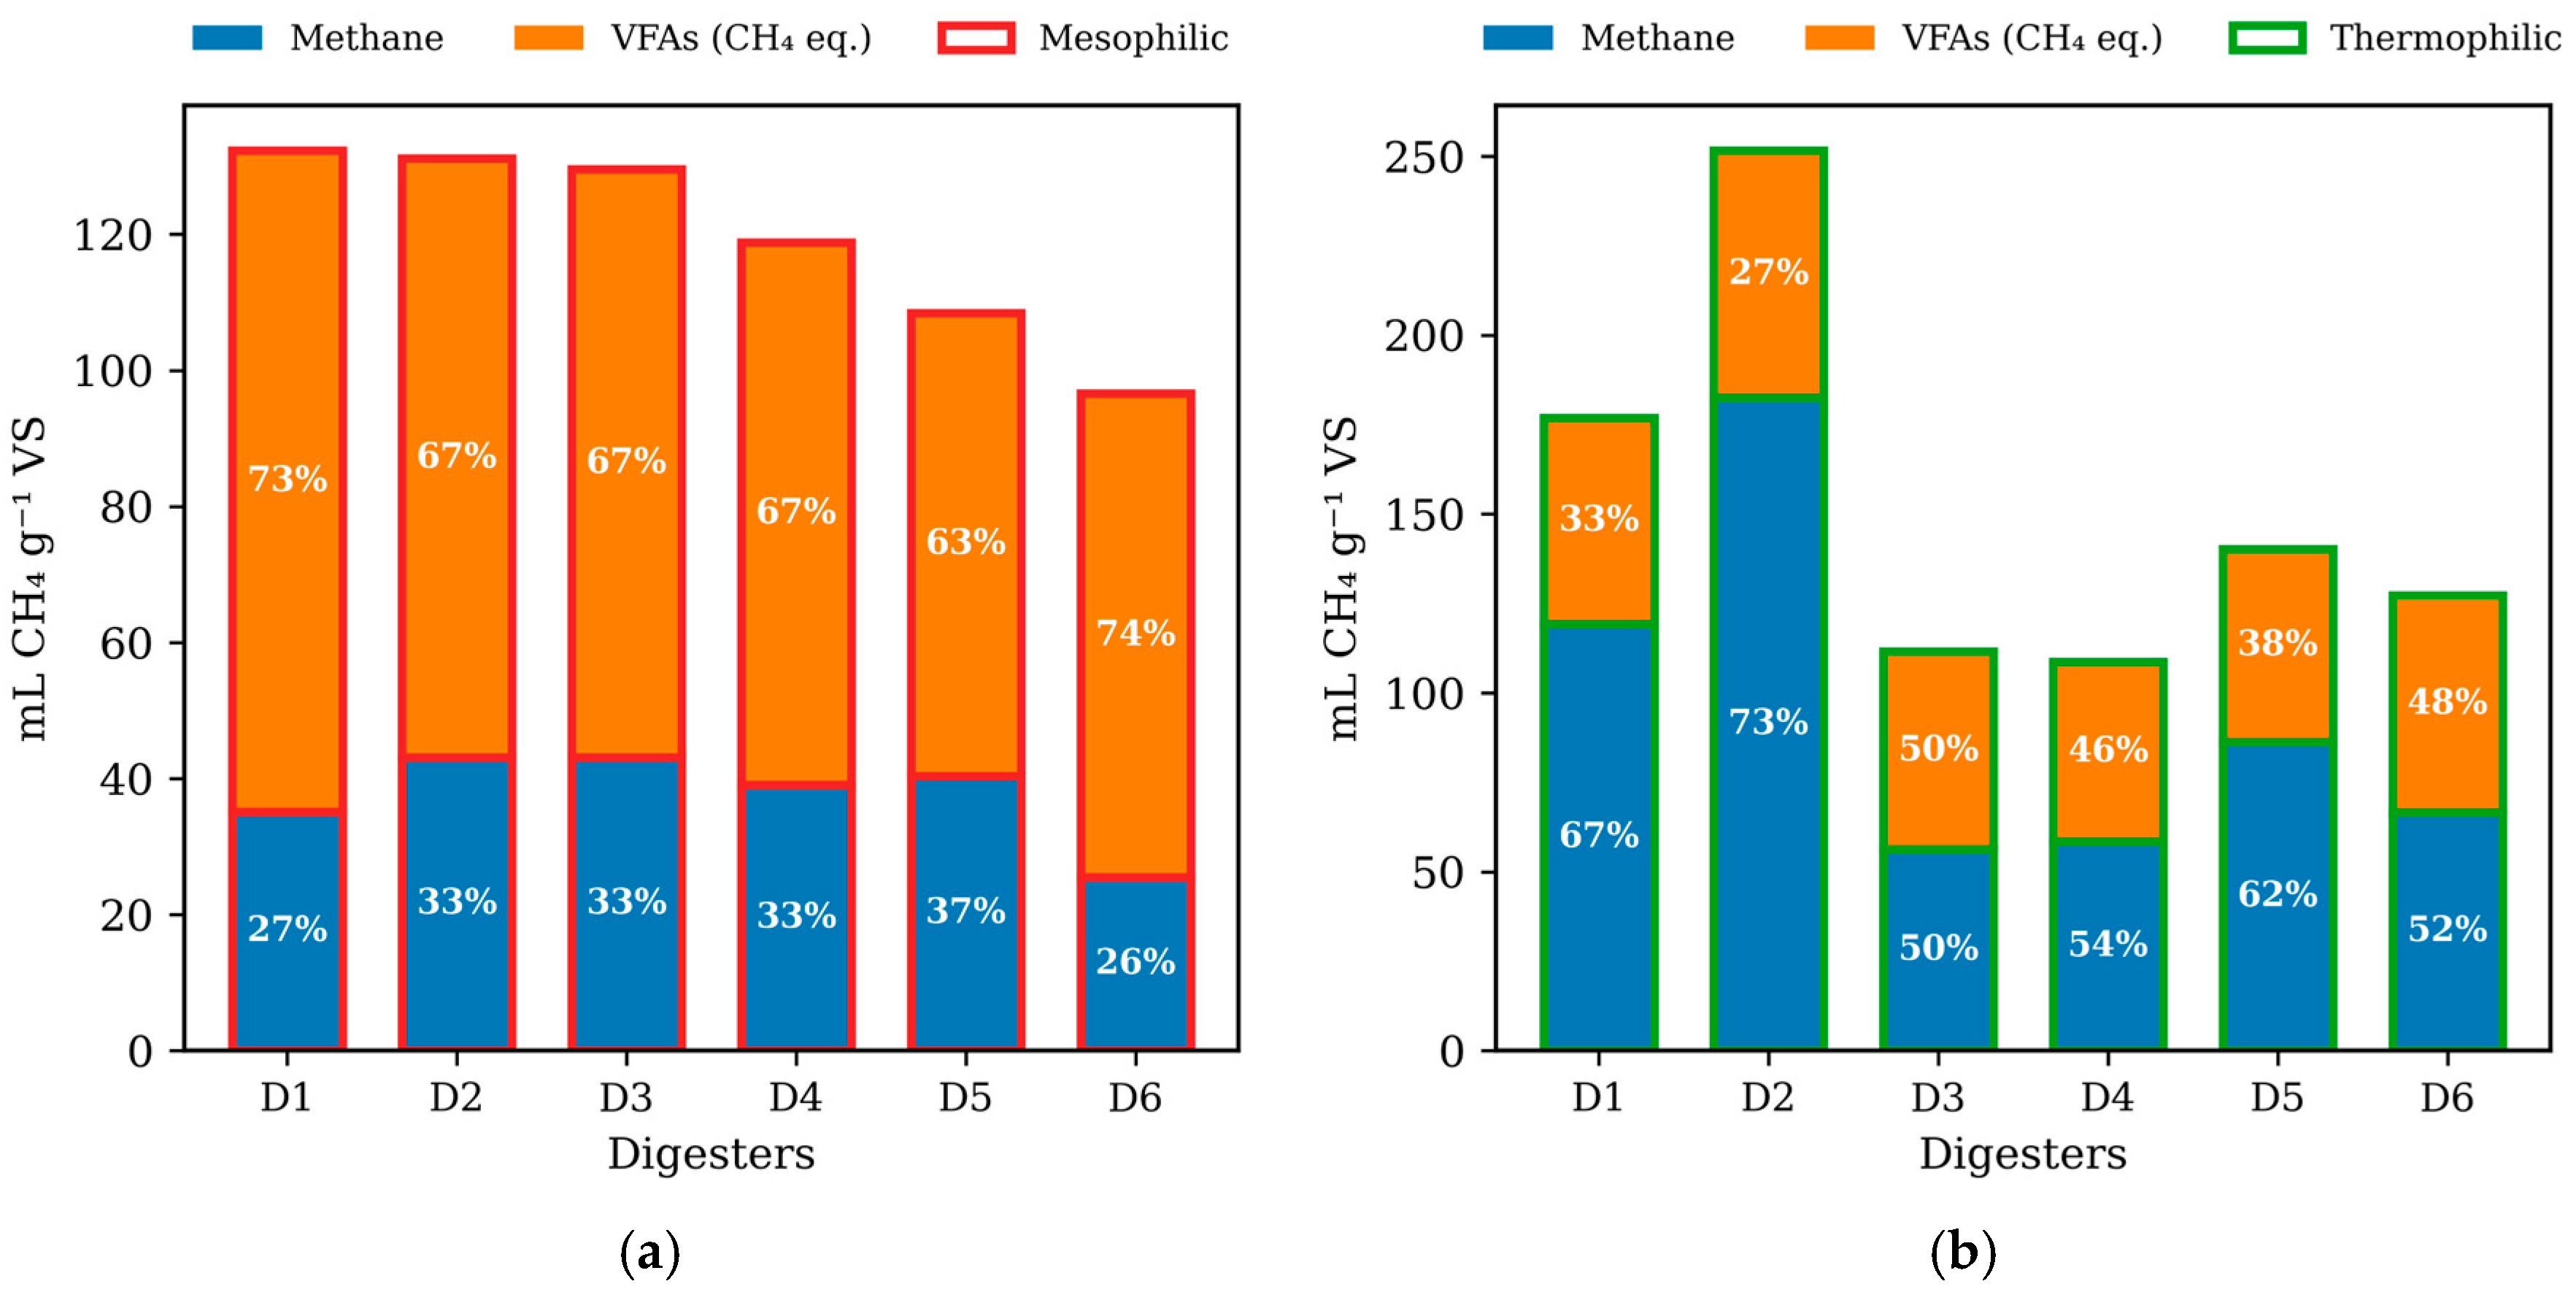
A higher proportion of methane for thermophilic digesters in comparison to VFAs (55–75%), whereas mesophilic digesters showed higher VFAs accumulation (60–75%), suggesting a stronger carbon conversion capability under thermophilic conditions and inhibition-driven VFA accumulation under mesophilic conditions (see Figure 5a,b).
Methane production potential of TW, CW and similar substrates shows significant variation (12 mL CH4/gVS-added to 440 mL CH4/gVS-added) across the literature, as shown in Table 3. For example Saranda and Nand conducted TW AD by stepwise addition for 10–12 weeks. Their results showed a good start-up condition and produced 597 mL/gVS of biogas, having 72% methane content [59]. Eslami et al. conducted a batch experiment that yielded around 280 mL/gVS methane, comprising 50% of the total biogas produced [14]. Another study shows that biogas generated from tomato processing waste was 140 mL/gVS, in which the percentage of methane was around 60% [60]. Additionally, Saev et al. conducted semicontinuous co-digestion of TW and cow manure in mesophilic conditions, resulting in 220 mL/gVS-added, for a co-digestion ratio (CDR) of 80:20 (manure:tomato waste) [61]. This variation in gas production arises from several operational and substrate-related factors, i.e., type of digesters, temperature conditions, inoculum type, pre-acclimation, substrate-to-inoculum ratio and physicochemical properties of the substrates, etc. CW methane production potential varies from 320 to 550 mL/gVS-added [62,63]. Similarly, another study finds that biogas from CW AD ranges from 171 to 280 mL/gVS-added, among which methane is around 60% [25,64].

3.2. Kinetic Modeling

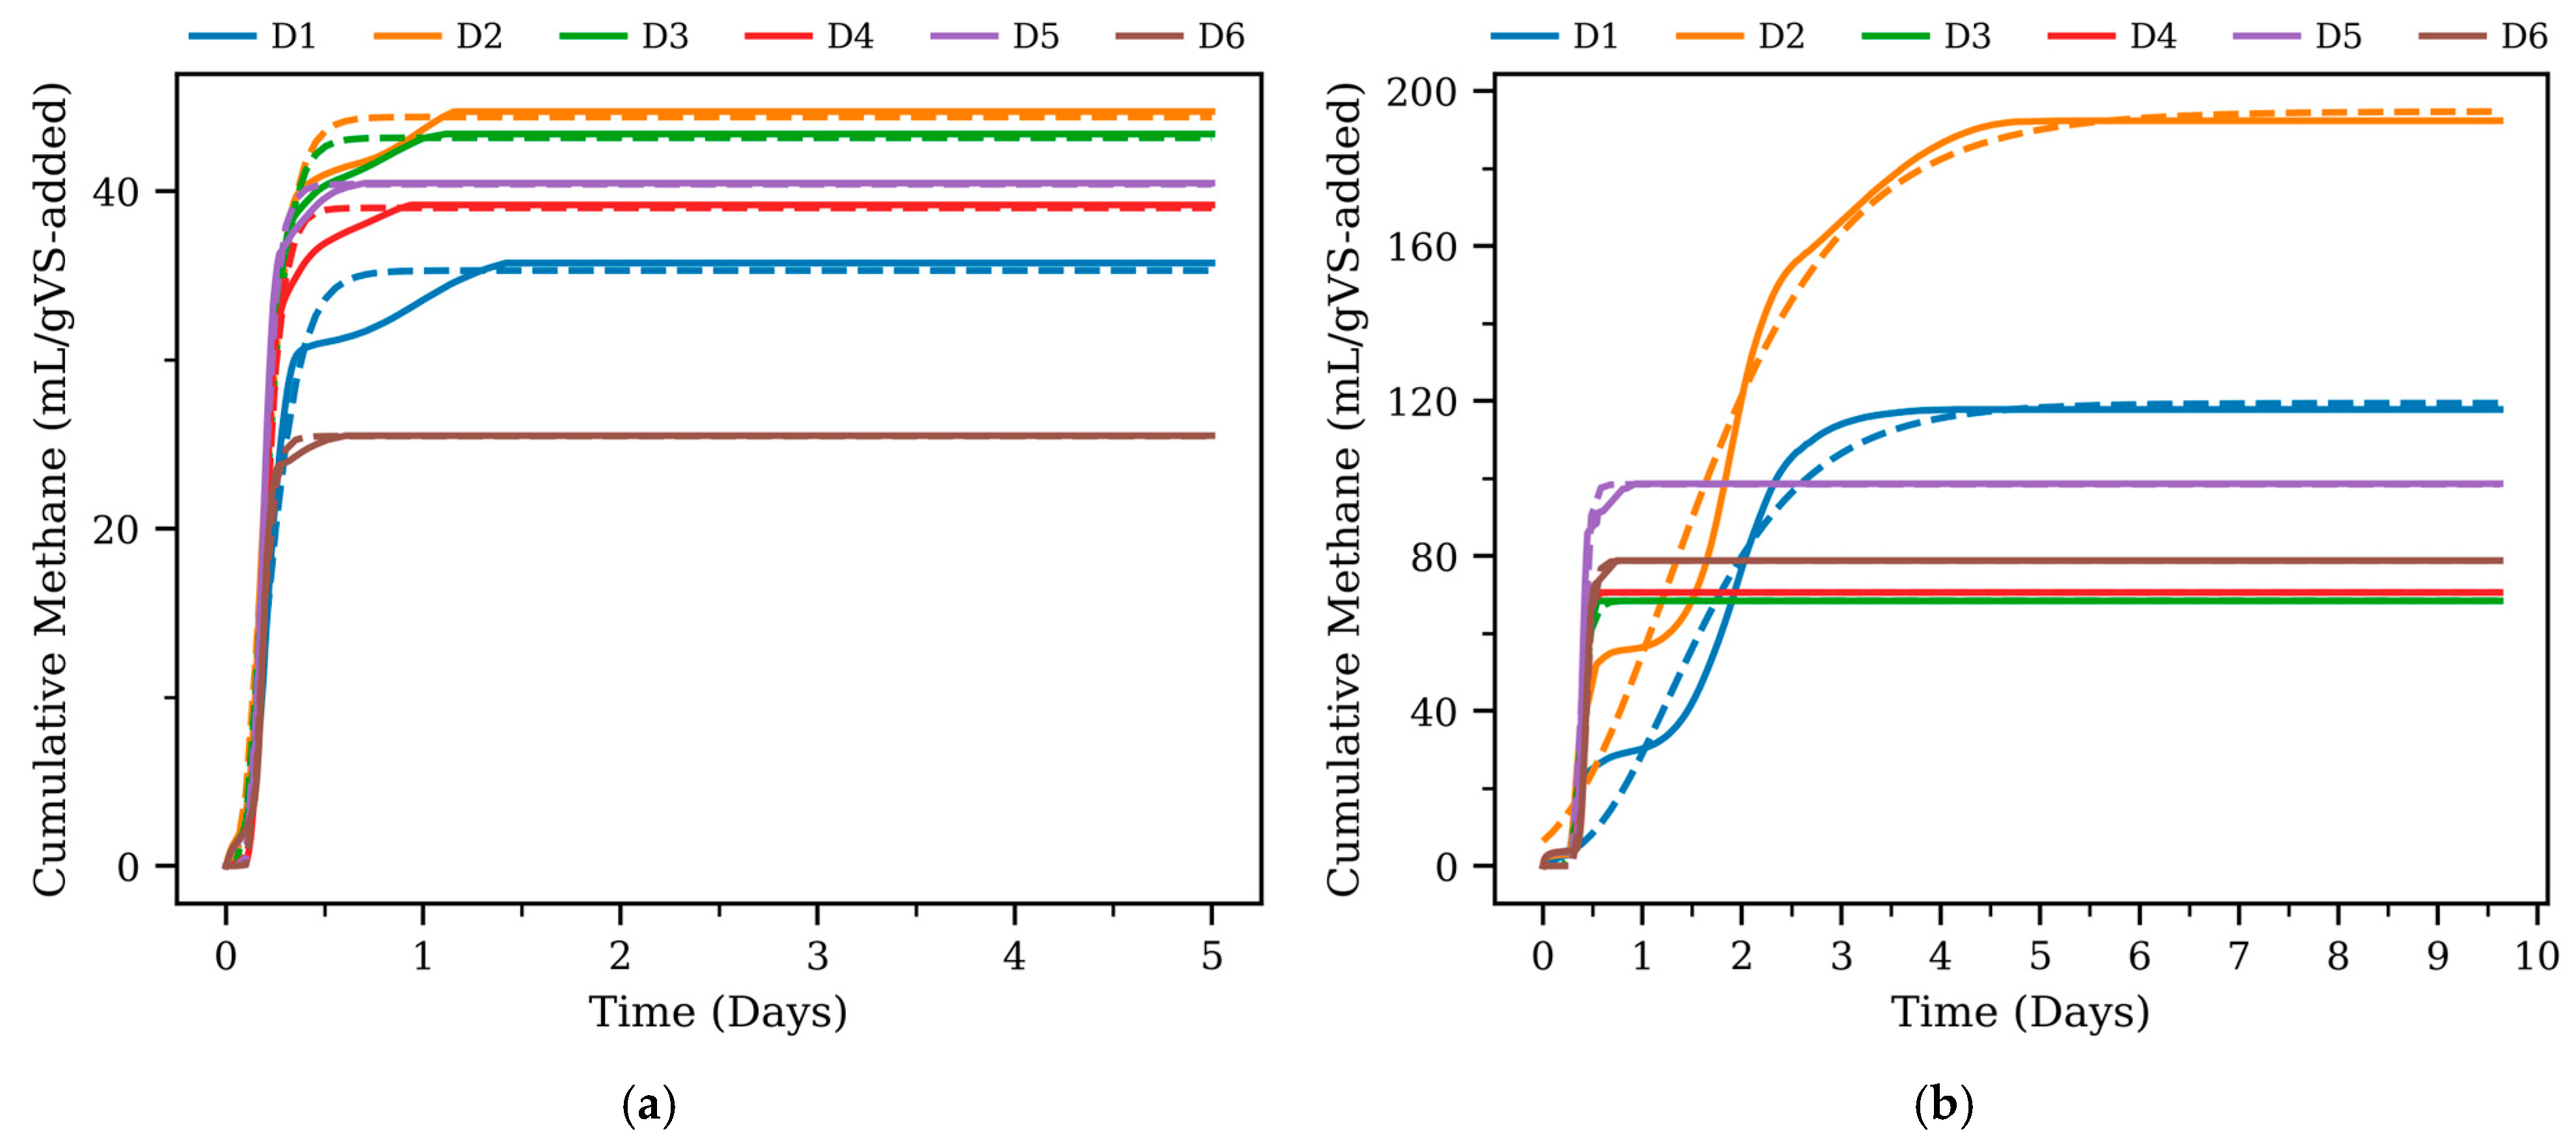
To study more rigorous quantitative analysis and to apply it to large-scale biogas production, finding key kinetic parameters using a modified Gompertz model for AD is essential. Although this model has been employed in various AD studies, its application to such novel substrate co-digestion has not been explored. The study provides insights into the methane production, lag phase and degradation rates to understand the biodegradation behavior of the substrates. The modified Gompertz model fitted well (Figure 6a,b) with the experimental data (R2 = 0.97–1) (Table 4). Results show a high impact of temperature conditions and substrate characteristics on Pmax, Rmax and λ values (Table 4). During thermophilic conditions, D2 showed the highest Pmax of 182.5 mL/gVS-added, indicating synergetic effect of substrate composition and balanced C/N among all the other digesters, as well as high-temperature effects on substrate degradation and microbial activities. On the contrary, lower Pmax values can be seen for D3 and D4, 56.29 mL/gVS-added and 58.44 mL/gVS-added, respectively, showing a suboptimal C/N ratio, hence, lower performance comparatively. Similarly, in mesophilic conditions, the digestor shows lower performance as compared to high-temperature conditions owing to decreased microbial activity; nevertheless, among all digesters, D2 performed well, having a high Pmax of 43.16 mL/gVS-added, while D6 showed the lowest performance, having Pmax values of 25.47 mL/gVS-added. These trends were statistically supported, as Pmax differed significantly across co-digestion ratios under both mesophilic and thermophilic conditions (p < 0.05).
Production rates in thermophilic conditions were comparatively higher. Among thermophilic digesters, D5 and D6 showed the highest Rmax of 1161 mL/h and 1030 mL/h, respectively. Similarly, in mesophilic digesters D4 and D5 showed the highest degradation rate of 352 mL/h and 429 mL/h, respectively. The λ values vary widely among different temperature conditions. Overall, thermophilic digesters took longer than mesophilic digesters. Among the thermophilic digesters, D2 has a lower λ (6 h) owing to high concentrations of readily degradable CW organic content. On the other hand, among mesophilic digesters, similar behavior was observed, i.e., D1–D3 had the lowest λ (2 h). These findings indicate the importance of substrate composition and C/N balance on AD kinetics. Utilizing this model, one can find the effects of different parameters on peak production, microbial adaptation (lag phase) and production rate. These parameters can be utilized to optimize and predict methane production for different experimental conditions.

4. Study Limitations and Perspective

Although the present study provides useful insights into the impact of synergistic effects of temperature and co-digestion ratio on the AD of CW and TW, certain limitations need to be addressed. The experiments conducted in batch scale only provide information on substrate biodegradability and kinetic behavior, but do not provide information regarding steady state kinetics, feed irregularities and microbial adaptation that is observed in semi-continuous or continuous digesters. Additionally, microbial community or enzymatic analyses were not included, which could have otherwise clarified the functional role of specific microbial consortia under different temperature conditions (mesophilic and thermophilic regimes). Therefore, future work should focus on validating these findings under semi-continuous operation and integrating microbial community profiling (e.g., 16S rRNA sequencing, qPCR) to simulate structure–function relationships during co-digestion.
Furthermore, a promising strategy of microbial community engineering or inoculum enrichment to enhance methane production is not practically approachable on a large-scale production as it requires techno-economic consideration. More importantly, to increase methane production, complex operation handling due to engineered or genetically optimized strains, biosafety requirements and management costs, becomes an economic burden. Therefore, practically, optimizing the operational framework (organic loading rate, feeding regime and co-substrate ratio) may require a more cost-effective approach.

5. Conclusions

A batch system was employed to co-digest cheese whey and tomato waste in different co-digestion ratios (CDRs). Cow manure was used as inoculum and digesters were kept in mesophilic and thermophilic conditions for 20 days. After comprehensive data analysis, we concluded that co-digestion of TW with CW produced 2.5 times higher methane yield than mono-digestion of TW in both temperature conditions. Thermophilic digesters outperformed threefold (300%) than mesophilic digesters in methane production. Among all digesters under both temperate conditions, D2 (having a high amount of cheese whey), owing to balanced organic composition and C/N, produced higher cumulative methane, i.e., 182 mL/gVS-added in the case of thermophilic conditions. In mesophilic conditions, the methane production stopped after the initial 5 h due to VFAs accumulation, which caused a pH drop (3–4). However, in thermophilic conditions, the digesters were relatively stable (5–7) in this period and, therefore, performed better comparatively. Modified Gompertz model accurately predicted the kinetics of the process, having R2 values in the range of 0.97–1, indicating an excellent fit.

Author Contributions

Conceptualization, A.H.H., M.A.A., I.U., P.D., M.A.-E. and S.B.; methodology, A.H.H. and M.A.A.; formal analysis, I.U. and M.T.; data curation, I.U. and M.T.; writing—original draft preparation, I.U., A.H.H. and M.A.A.; writing—review and editing, A.H.H., M.A.A., M.T., P.D., M.A.-E. and S.B.; supervision, A.H.H. and M.A.A. All authors have read and agreed to the published version of the manuscript.

Funding

This research was funded by Qatar Research Development and Innovation (QRDI), grant number MME04-0501-230001. In addition, one of the authors would like to thank Qatar University for the sponsorship provided through the Graduate Assistantship program.

Institutional Review Board Statement

Not applicable.

Informed Consent Statement

Not applicable.

Data Availability Statement

The original contributions presented in this study are included in the article. Further inquiries can be directed to the corresponding author.

Acknowledgments

The authors extend their gratitude to the Environmental Science Center (ESC) for conducting the TN and TC analysis. The statements made herein are solely the responsibility of the authors.

Conflicts of Interest

The authors declare no conflicts of interest.

Abbreviations

The following abbreviations are used in this manuscript:
ADAnaerobic Digestion
TWTomato Waste
CWCheese Whey
CMCow Manure
CDRCo-Digestion Ratio
S/ISubstrate-to-Inoculum Ratio
TSTotal Solid
VSVolatile Solid
VFAVolatile Fatty Acid
TOCTotal Organic Carbon
TNTotal Nitrogen
C/NCarbon-to-Nitrogen Ratio
pHPotential of Hydrogen
AMPTS IIAutomatic Methane Potential Test System II
CCUCarbon Capturing Unit
RmaxMaximum Methane Production Rate
PmaxMaximum Cumulative Methane Production
λLag Phase
R2Coefficient of Determination
ASTMAmerican Society for Testing and Materials
APHAAmerican Public Health Association
NDFNeutral Detergent Fiber
WWTPWastewater Treatment Plant
CSTRContinuous Stirred Tank Reactor
H2SHydrogen Sulfide
CH4Methane
CO2Carbon Dioxide
HRTHydraulic Retention Time
BMPBiochemical Methane Potential
QRDIQatar Research, Development, and Innovation Council
ESCEnvironmental Science Center

References

  1. Scarlat; Dallemand, J.; Fahl, F. Biogas: Developments and perspectives in Europe. Renew. Energy 2018, 129, 457–472. [Google Scholar] [CrossRef]
  2. Vats, N.; Khan, A.A.; Ahmad, K. Effect of substrate ratio on biogas yield for anaerobic co-digestion of fruit vegetable waste & sugarcane bagasse. Environ. Technol. Innov. 2019, 13, 331–339. [Google Scholar] [CrossRef]
  3. Kim, M.; Gomec, C.Y.; Ahn, Y.; Speece, R.E. Hydrolysis and acidogenesis of particulate organic material in mesophi lic and thermophilic anaerobic digestion. Environ. Technol. 2003, 24, 1183–1190. [Google Scholar] [CrossRef]
  4. Pan, X.; Zhao, L.; Li, C.; Angelidaki, I.; Lv, N.; Ning, J.; Cai, G.; Zhu, G. Deep insights into the network of acetate metabolism in anaerobic digestion: Focusing on syntrophic acetate oxidation and homoacetogenesis. Water Res. 2021, 190, 116774. [Google Scholar] [CrossRef] [PubMed]
  5. Bajpai, P. Basics of Anaerobic Digestion Process; Springer: Singapore, 2017. [Google Scholar] [CrossRef]
  6. Evangelisti, S.; Lettieri, P.; Borello, D.; Clift, R. Life cycle assessment of energy from waste via anaerobic digestion: A. Waste Manag. 2014, 34, 226–237. [Google Scholar] [CrossRef] [PubMed]
  7. Piadeh, F.; Offie, I.; Behzadian, K.; Rizzuto, J.P.; Bywater, A.; Córdoba-Pachón, J.-R.; Walker, M. A critical review for the impact of anaerobic digestion on the sustainable development goals. J. Environ. Manag. 2023, 349, 119458. [Google Scholar] [CrossRef]
  8. Karagiannidis, A.; Perkoulidis, G. A multi-criteria ranking of different technologies for the anaerobic digestion for energy recovery of the organic fraction of municipal solid wastes. Bioresour. Technol. 2009, 100, 2355–2360. [Google Scholar] [CrossRef]
  9. Sevillano, C.A.; Pesantes, A.A.; Carpio, E.P.; Martínez, E.J.; Gómez, X. Anaerobic Digestion for Producing Renewable Energy—The Evolution of Th is Technology in a New Uncertain Scenario. Entropy 2021, 23, 145. [Google Scholar] [CrossRef]
  10. Vasco-Correa, J.; Khanal, S.; Manandhar, A.; Shah, A. Anaerobic digestion for bioenergy production: Global status, environme ntal and techno-economic implications, and government policies. Bioresour. Technol. 2018, 247, 1015–1026. [Google Scholar] [CrossRef]
  11. Lu, Z.; Wang, J.; Gao, R.; Ye, F.; Zhao, G. Sustainable valorisation of tomato pomace: A comprehensive review. Trends Food Sci. Technol. 2019, 86, 172–187. [Google Scholar] [CrossRef]
  12. Ali, M.Y.; Ibn Sina, A.A.I.; Khandker, S.S.; Neesa, L.; Tanvir, E.M.; Kabir, A.; Khalil, M.I.; Gan, S.H. Nutritional Composition and Bioactive Compounds in Tomatoes and Their Impact on Human Health and Disease: A Review. Foods 2020, 10, 142. [Google Scholar] [CrossRef] [PubMed]
  13. Trombino, S.; Cassano, R.; Procopio, D.; Di Gioia, M.L.; Barone, E. Valorization of Tomato Waste as a Source of Carotenoids. Molecules 2021, 26, 5062. [Google Scholar] [CrossRef]
  14. Eslami, E.; Carpentieri, S.; Pataro, G.; Ferrari, G. A Comprehensive Overview of Tomato Processing By-Product Valorization by Conventional Methods versus Emerging Technologies. Foods 2022, 12, 166. [Google Scholar] [CrossRef]
  15. Al-Wandawi, H.; Abdul-Rahman, M.; Al-Shaikhly, K. Tomato processing wastes as essential raw materials source. J. Agric. Food Chem. 1985, 33, 804–807. [Google Scholar] [CrossRef]
  16. Asunis, F.; De Gioannis, G.; Dessì, P.; Isipato, M.; Lens, P.N.; Muntoni, A.; Polettini, A.; Pomi, R.; Rossi, A.; Spiga, D. The dairy biorefinery: Integrating treatment processes for cheese whey valorisation. J. Environ. Manag. 2020, 276, 111240. [Google Scholar] [CrossRef]
  17. Lappa, I.K.; Papadaki, A.; Kachrimanidou, V.; Terpou, A.; Koulougliotis, D.; Eriotou, E.; Kopsahelis, N. Cheese Whey Processing: Integrated Biorefinery Concepts and Emerging Food Applications. Foods 2019, 8, 347. [Google Scholar] [CrossRef]
  18. Zotta, T.; Solieri, L.; Iacumin, L.; Picozzi, C.; Gullo, M. Valorization of cheese whey using microbial fermentations. Appl. Microbiol. Biotechnol. 2020, 104, 2749–2764. [Google Scholar] [CrossRef] [PubMed]
  19. Bezerra, R.A.; Rodrigues, J.A.D.; Ratusznei, S.M.; Zaiat, M.; Foresti, E. Whey treatment by AnSBBR with circulation: Effects of organic loading, shock loads, and alkalinity supplementation. Appl. Biochem. Biotechnol. 2007, 143, 257–275. [Google Scholar] [CrossRef]
  20. Charalambous, P.; Shin, J.; Shin, S.G.; Vyrides, I. Anaerobic digestion of industrial dairy wastewater and cheese whey: Performance of internal circulation bioreactor and laboratory batch test at pH 5-6. Renew. Energy 2020, 147, 1–10. [Google Scholar] [CrossRef]
  21. Kataki, S.; West, H.; Clarke, M.; Baruah, D. Phosphorus recovery as struvite from farm, municipal and industrial waste: Feedstock suitability, methods and pre-treatments. Waste Manag. 2016, 49, 437–454. [Google Scholar] [CrossRef] [PubMed]
  22. Alvarado-Vallejo, A.; Marín-Peña, O.; Rosas-Mendoza, E.S.; Méndez-Contreras, J.M.; Alvarado-Lassman, A. The Valorization of Fruit and Vegetable Wastes Using an Anaerobic Fixed Biofilm Reactor: A Case of Discarded Tomatoes from a Traditional Market. Processes 2024, 12, 1923. [Google Scholar] [CrossRef]
  23. Marchetti, A.; Salvatori, G.; Astolfi, M.L.; Fabiani, M.; Fradinho, J.; Reis, M.A.M.; Gianico, A.; Bolzonella, D.; Villano, M. Evaluation of the acidogenic fermentation potential of food industry by-products. Biochem. Eng. J. 2023, 199, 109029. [Google Scholar] [CrossRef]
  24. Zhu, Z.; Keesman, K.J.; Yogev, U.; Gross, A. Onsite anaerobic treatment of tomato plant waste as a renewable source of energy and biofertilizer under desert conditions. Bioresour. Technol. Rep. 2022, 20, 101274. [Google Scholar] [CrossRef]
  25. Escalante, H.; Castro, L.; Amaya, M.P.; Jaimes, L.; Jaimes-Estévez, J. Anaerobic digestion of cheese whey: Energetic and nutritional potential for the dairy sector in developing countries. Waste Manag. 2018, 71, 711–718. [Google Scholar] [CrossRef]
  26. Gonzalez-Piedra, S.; Hernández-García, H.; Perez-Morales, J.M.; Acosta-Domínguez, L.; Bastidas-Oyanedel, J.-R.; Hernandez-Martinez, E. A Study on the Feasibility of Anaerobic Co-Digestion of Raw Cheese Whey with Coffee Pulp Residues. Energies 2021, 14, 3611. [Google Scholar] [CrossRef]
  27. Li, Y.; Xu, F.; Li, Y.; Lu, J.; Li, S.; Shah, A.; Zhang, X.; Zhang, H.; Gong, X.; Li, G. Reactor performance and energy analysis of solid state anaerobic co-digestion of dairy manure with corn stover and tomato residues. Waste Manag. 2017, 73, 130–139. [Google Scholar] [CrossRef]
  28. Gil, A.; Siles, J.Á.; Serrano, A.; Martín, M.Á. Mixture optimization of anaerobic co-digestion of tomato and cucumber waste. Environ. Technol. 2015, 36, 2628–2636. [Google Scholar] [CrossRef] [PubMed]
  29. Hallaji, S.M.; Kuroshkarim, M.; Moussavi, S.P. Enhancing methane production using anaerobic co-digestion of waste activated sludge with combined fruit waste and cheese whey. BMC Biotechnol. 2019, 19, 19. [Google Scholar] [CrossRef]
  30. David, A.; Govil, T.; Tripathi, A.K.; McGeary, J.; Farrar, K.; Sani, R.K. Thermophilic Anaerobic Digestion: Enhanced and Sustainable Methane Production from Co-Digestion of Food and Lignocellulosic Wastes. Energies 2018, 11, 2058. [Google Scholar] [CrossRef]
  31. Kulcu, R. Composting of Greenhouse Tomato Plant Residues, Wheat Straw, and Separated Dairy Manure, and the Effect of Free Air Space on the Process. Pol. J. Environ. Stud. 2014, 23, 1341–1346. [Google Scholar]
  32. Şevik, F.; Tosun, I.; Ekinci, K. The effect of FAS and C/N ratios on co-composting of sewage sludge, dairy manure and tomato stalks. Waste Manag. 2018, 80, 450–456. [Google Scholar] [CrossRef]
  33. Oladejo, O.S.; Dahunsi, S.O.; Adesulu-Dahunsi, A.T.; Ojo, S.O.; Lawal, A.I.; Idowu, E.O.; Olanipekun, A.A.; Ibikunle, R.A.; Osueke, C.O.; Ajayi, O.E.; et al. Energy generation from anaerobic co-digestion of food waste, cow dung and piggery dung. Bioresour. Technol. 2020, 313, 123694. [Google Scholar] [CrossRef]
  34. Chen, J.L.; Ortiz, R.; Steele, T.W.; Stuckey, D.C. Toxicants inhibiting anaerobic digestion: A review. Biotechnol. Adv. 2014, 32, 1523–1534. [Google Scholar] [CrossRef]
  35. APHA. 2005. Available online: https://www.standardmethods.org/doi/book/10.2105/smww.2882 (accessed on 15 January 2025).
  36. Method 9060A–Total Organic Carbon, EPA. 2004. Available online: https://www.epa.gov/hw-sw846/sw-846-test-method-9060a-total-organic-carbon (accessed on 15 January 2025).
  37. Van Soest, P.J.; Robertson, J.B.; Lewis, B.A. Methods for Dietary Fiber, Neutral Detergent Fiber, and Nonstarch Polysaccharides in Relation to Animal Nutrition. J. Dairy Sci. 1991, 74, 3583–3597. [Google Scholar] [CrossRef] [PubMed]
  38. Gallipoli, A.; Braguglia, C.M.; Gianico, A.; Montecchio, D.; Pagliaccia, P. Kitchen waste valorization through a mild-temperature pretreatment to enhance biogas production and fermentability: Kinetics study in mesophilic and thermophilic regimen. J. Environ. Sci. 2020, 89, 167–179. [Google Scholar] [CrossRef]
  39. Raposo, F.; Banks, C.; Siegert, I.; Heaven, S.; Borja, R. Influence of inoculum to substrate ratio on the biochemical methane potential of maize in batch tests. Process Biochem. 2006, 41, 1444–1450. [Google Scholar] [CrossRef]
  40. Atasoy, M.; Eyice, O.; Cetecioglu, Z. A Comprehensive Study of Volatile Fatty Acids Production from Batch Reactor to Anaerobic Sequencing Batch Reactor Using Cheese Processing Wastewater. Bioresour. Technol. 2020, 311, 123529. [Google Scholar] [CrossRef]
  41. Astals, S.; Koch, K.; Weinrich, S.; Hafner, S.D.; Tait, S.; Peces, M. Impact of Storage Conditions on the Methanogenic Activity of Anaerobic Digestion Inocula. Water 2020, 12, 1321. [Google Scholar] [CrossRef]
  42. Syaichurrozi, B.I.; Sumardiono, S. Kinetic Model of Biogas Yield Production from Vinasse at Various Initial pH: Comparison between Modified Gompertz Model and First Order Kinetic Model. Res. J. Appl. Sci. Eng. Technol. 2014, 7, 2798–2805. [Google Scholar] [CrossRef]
  43. Cioabla, A.E.; Dumitrel, G.A.; Ionel, I. Evaluation by Kinetic Models of Anaerobe Digestion Performances for Various Substrates and Co-substrates. Rev. De Chim. 2017, 68, 2614–2617. [Google Scholar] [CrossRef]
  44. Yong-sheng, W. Application of Modified Gompertz Model to Study on Anaerobic Digestion of Organic Fraction of Municipal Solid Waste. Environ. Sci. 2011, 32, 8. [Google Scholar]
  45. Lower, L.; Qiu, Y.; Sartor, R.C.; Sagues, W.J.; Cheng, J.J. Kinetic Modeling of Thermophilic Anaerobic Digestion of Lemnaceae for Biogas Production. BioEnergy Res. 2025, 18, 23. [Google Scholar] [CrossRef]
  46. Pramanik, S.K.; Suja, F.B.; Porhemmat, M.; Pramanik, B.K. Performance and Kinetic Model of a Single-Stage Anaerobic Digestion System Operated at Different Successive Operating Stages for the Treatment of Food Waste. Processes 2019, 7, 600. [Google Scholar] [CrossRef]
  47. Filer, J.; Ding, H.H.; Chang, S. Biochemical Methane Potential (BMP) Assay Method for Anaerobic Digestion Research. Water 2019, 11, 921. [Google Scholar] [CrossRef]
  48. Mohammadianroshanfekr, M.; Pazoki, M.; Pejman, M.B.; Ghasemzadeh, R.; Pazoki, A. Kinetic modeling and optimization of biogas production from food waste and cow manure co-digestion. Results Eng. 2024, 24, 103477. [Google Scholar] [CrossRef]
  49. Tian, Y.; Yang, K.; Zheng, L.; Han, X.; Xu, Y.; Li, Y.; Li, S.; Xu, X.; Zhang, H.; Zhao, L. Modelling Biogas Production Kinetics of Various Heavy Metals Exposed Anaerobic Fermentation Process Using Sigmoidal Growth Functions. Waste Biomass Valorization 2020, 11, 4837–4848. [Google Scholar] [CrossRef]
  50. Lu, Y.; Zhang, Q.; Wang, X.; Zhou, X.; Zhu, J. Effect of pH on volatile fatty acid production from anaerobic digestion of potato peel waste. Bioresour. Technol. 2020, 316, 123851. [Google Scholar] [CrossRef]
  51. Marchetti, A.; Palhas, M.; Villano, M.; Reis, M.A.; Fradinho, J. Unlocking the potential of food industry by-products: Sustainable volatile fatty acids production via mixed culture acidogenic fermentation of reground pasta. J. Clean. Prod. 2025, 526, 146633. [Google Scholar] [CrossRef]
  52. Koch, K.; Hafner, S.D.; Weinrich, S.; Astals, S. Identification of Critical Problems in Biochemical Methane Potential (BMP) Tests From Methane Production Curves. Front. Environ. Sci. 2019, 7, 178. [Google Scholar] [CrossRef]
  53. Xing, B.-S.; Cao, S.; Han, Y.; Wen, J.; Zhang, K.; Wang, X.C. Stable and high-rate anaerobic co-digestion of food waste and cow manure: Optimisation of start-up conditions. Bioresour. Technol. 2020, 307, 123195. [Google Scholar] [CrossRef]
  54. Girotto, F.; Lavagnolo, M.C.; Acar, G.; Piazza, L. Bio-methane production from tomato pomace: Preliminary evaluation of process intensification through ultrasound pre-treatment. J. Mater. Cycles Waste Manag. 2020, 23, 416–422. [Google Scholar] [CrossRef]
  55. Yangin-Gomec, C.; Agnihotri, S.; Ylitervo, P.; Horváth, I.S. Assessment of Microbial Diversity during Thermophilic Anaerobic Co-Digestion for an Effective Valorization of Food Waste and Wheat Straw. Energies 2023, 16, 55. [Google Scholar] [CrossRef]
  56. Papirio, S.; Matassa, S.; Pirozzi, F.; Esposito, G. Anaerobic Co-Digestion of Cheese Whey and Industrial Hemp Residues Opens New Perspectives for the Valorization of Agri-Food Waste. Energies 2020, 13, 2820. [Google Scholar] [CrossRef]
  57. Peng, X.; Zhang, S.; Li, L.; Zhao, X.; Ma, Y.; Shi, D. Long-term high-solids anaerobic digestion of food waste: Effects of ammonia on process performance and microbial community. Bioresour. Technol. 2018, 262, 148–158. [Google Scholar] [CrossRef]
  58. Peng, X.; Zhang, S.; Li, L.; Zhao, X.; Ma, Y.; Shi, D. The effects of C/N (10-25) on the relationship of substrates, metabolites, and microorganisms in “inhibited steady-state” of anaerobic digestion. Water Res. 2020, 188, 116466. [Google Scholar] [CrossRef]
  59. Sarada, R.; Nand, K. Start-up of anaerobic digestion of tomato-processing wastes for methane generation. Biol. Wastes 1989, 30, 231–237. [Google Scholar] [CrossRef]
  60. Saghouri, M.; Mansoori, Y.; Rohani, A.; Khodaparast, M.H.H.; Sheikhdavoodi, M.J. Modelling and evaluation of anaerobic digestion process of tomato processing wastes for biogas generation. J. Mater. Cycles Waste Manag. 2018, 20, 561–567. [Google Scholar] [CrossRef]
  61. Saev, M.; Koumanova, B.; Simeonov, I.V. Anaerobic co-digestion of wasted tomatoes and cattle dung for biogas production. J. Univ. Chem. Technol. Metall. 2009, 44, 55–60. [Google Scholar]
  62. Dreschke, G.; Probst, M.; Walter, A.; Pümpel, T.; Walde, J.; Insam, H. Lactic acid and methane: Improved exploitation of biowaste potential. Bioresour. Technol. 2015, 176, 47–55. [Google Scholar] [CrossRef] [PubMed]
  63. Labatut, R.A.; Angenent, L.T.; Scott, N.R. Biochemical methane potential and biodegradability of complex organic substrates. Bioresour. Technol. 2011, 102, 2255–2264. [Google Scholar] [CrossRef]
  64. Abdallah, M.; Greige, S.; Beyenal, H.; Harb, M.; Wazne, M. Investigating microbial dynamics and potential advantages of anaerobic co-digestion of cheese whey and poultry slaughterhouse wastewaters. Sci. Rep. 2022, 12, 10529. [Google Scholar] [CrossRef]
  65. Almeida, P.V.; Rodrigues, R.P.; Teixeira, L.M.; Santos, A.F.; Martins, R.C.; Quina, M.J. Bioenergy Production through Mono and Co-Digestion of Tomato Residues. Energies 2021, 14, 5563. [Google Scholar] [CrossRef]
  66. Belhadj, S.; Joute, Y.; El Bari, H.; Serrano, A.; Gil, A.; Siles, J.Á.; Chica, A.F.; Martín, M.Á. Evaluation of the anaerobic co-digestion of sewage sludge and tomato waste at mesophilic temperature. Appl. Biochem. Biotechnol. 2014, 172, 3862–3874. [Google Scholar] [CrossRef]
  67. Kovačić, Đ.; Kralik, D.; Jovičić, D.; Spajić, R. An Assessment of Anaerobic Thermophilic Co-Digestion of Dairy Cattle Manure and Separated Tomato Greenhouse Waste in Lab-Scale Reactors. Acta Technol. Agric. 2019, 22, 38–42. [Google Scholar] [CrossRef]
  68. Wang, Y.; Li, Y.; Yao, L.; Fu, L.; Liu, Z. The Biogas Production Potential and Community Structure Characteristics of the Co-Digestion of Dairy Manure and Tomato Residues. Agronomy 2024, 14, 881. [Google Scholar] [CrossRef]
  69. Ruiz-Aguilar, G.M.L.; Martínez-Martínez, J.H.; Costilla-Salazar, R.; Camarena-Martínez, S. Using Central Composite Design to Improve Methane Production from Anaerobic Digestion of Tomato Plant Waste. Energies 2023, 16, 5412. [Google Scholar] [CrossRef]
  70. Zhang, H.; An, D.; Cao, Y.; Tian, Y.; He, J. Modeling the Methane Production Kinetics of Anaerobic Co-Digestion of Agricultural Wastes Using Sigmoidal Functions. Energies 2021, 14, 258. [Google Scholar] [CrossRef]
  71. de la Cueva, S.C.; Balagurusamy, N.; Pérez-Vega, S.B.; Pérez-Reyes, I.; Vázquez-Castillo, J.A.; de la Serna, F.Z.D.; Salmerón-Ochoa, I. Effects of different nitrogen sources on methane production, free ammonium and hydrogen sulfide in anaerobic digestion of cheese whey with cow manure. Rev. Mex. De Ing. Química 2021, 20, Bio2566. [Google Scholar] [CrossRef]
  72. Casallas-Ojeda, M.; Perez-Esteban, N.; Cabeza, I.; Cobo, M.; Olaya-Rincon, M.; Caicedo-Concha, D.M.; Astals, S. Understanding the acidification risk of cheese whey anaerobic digestion under psychrophilic and mesophilic conditions. Heliyon 2024, 10, e26476. [Google Scholar] [CrossRef]
  73. La Mantia, M.C.; Calì, M.; Rossi, E.; Scalella, R.; Signorini, A.; Santangelo, E.; Chiariotti, A. Metagenomic Analysis during Co-Digestion Buffalo Sludge and Tomato Pomace Post Thermal Stress: A Case Study. J. Buffalo Sci. 2024, 13, 104–115. [Google Scholar] [CrossRef]
  74. Dareioti, M.A.; Vavouraki, A.I.; Tsigkou, K.; Kornaros, M. Assessment of Single- vs. Two-Stage Process for the Anaerobic Digestion of Liquid Cow Manure and Cheese Whey. Energies 2021, 14, 5423. [Google Scholar] [CrossRef]
  75. Ergüder, T.; Tezel, U.; Güven, E.; Demirer, G. Anaerobic biotransformation and methane generation potential of cheese whey in batch and UASB reactors. Waste Manag. 2001, 21, 643–650. [Google Scholar] [CrossRef] [PubMed]
  76. Lahbab, A.; Djaafri, M.; Kalloum, S.; Benatiallah, A.; Atelge, M.; Atabani, A. Co-digestion of vegetable peel with cow dung without external inoculum for biogas production: Experimental and a new modelling test in a batch mode. Fuel 2021, 306, 121627. [Google Scholar] [CrossRef]
  77. Yan, Y.; Du, Z.; Zhang, L.; Feng, L.; Sun, D.; Dang, Y.; Holmes, D.E.; Smith, J.A. Identification of parameters needed for optimal anaerobic co-digestion of chicken manure and corn stover. RSC Adv. 2019, 9, 29609–29618. [Google Scholar] [CrossRef] [PubMed]
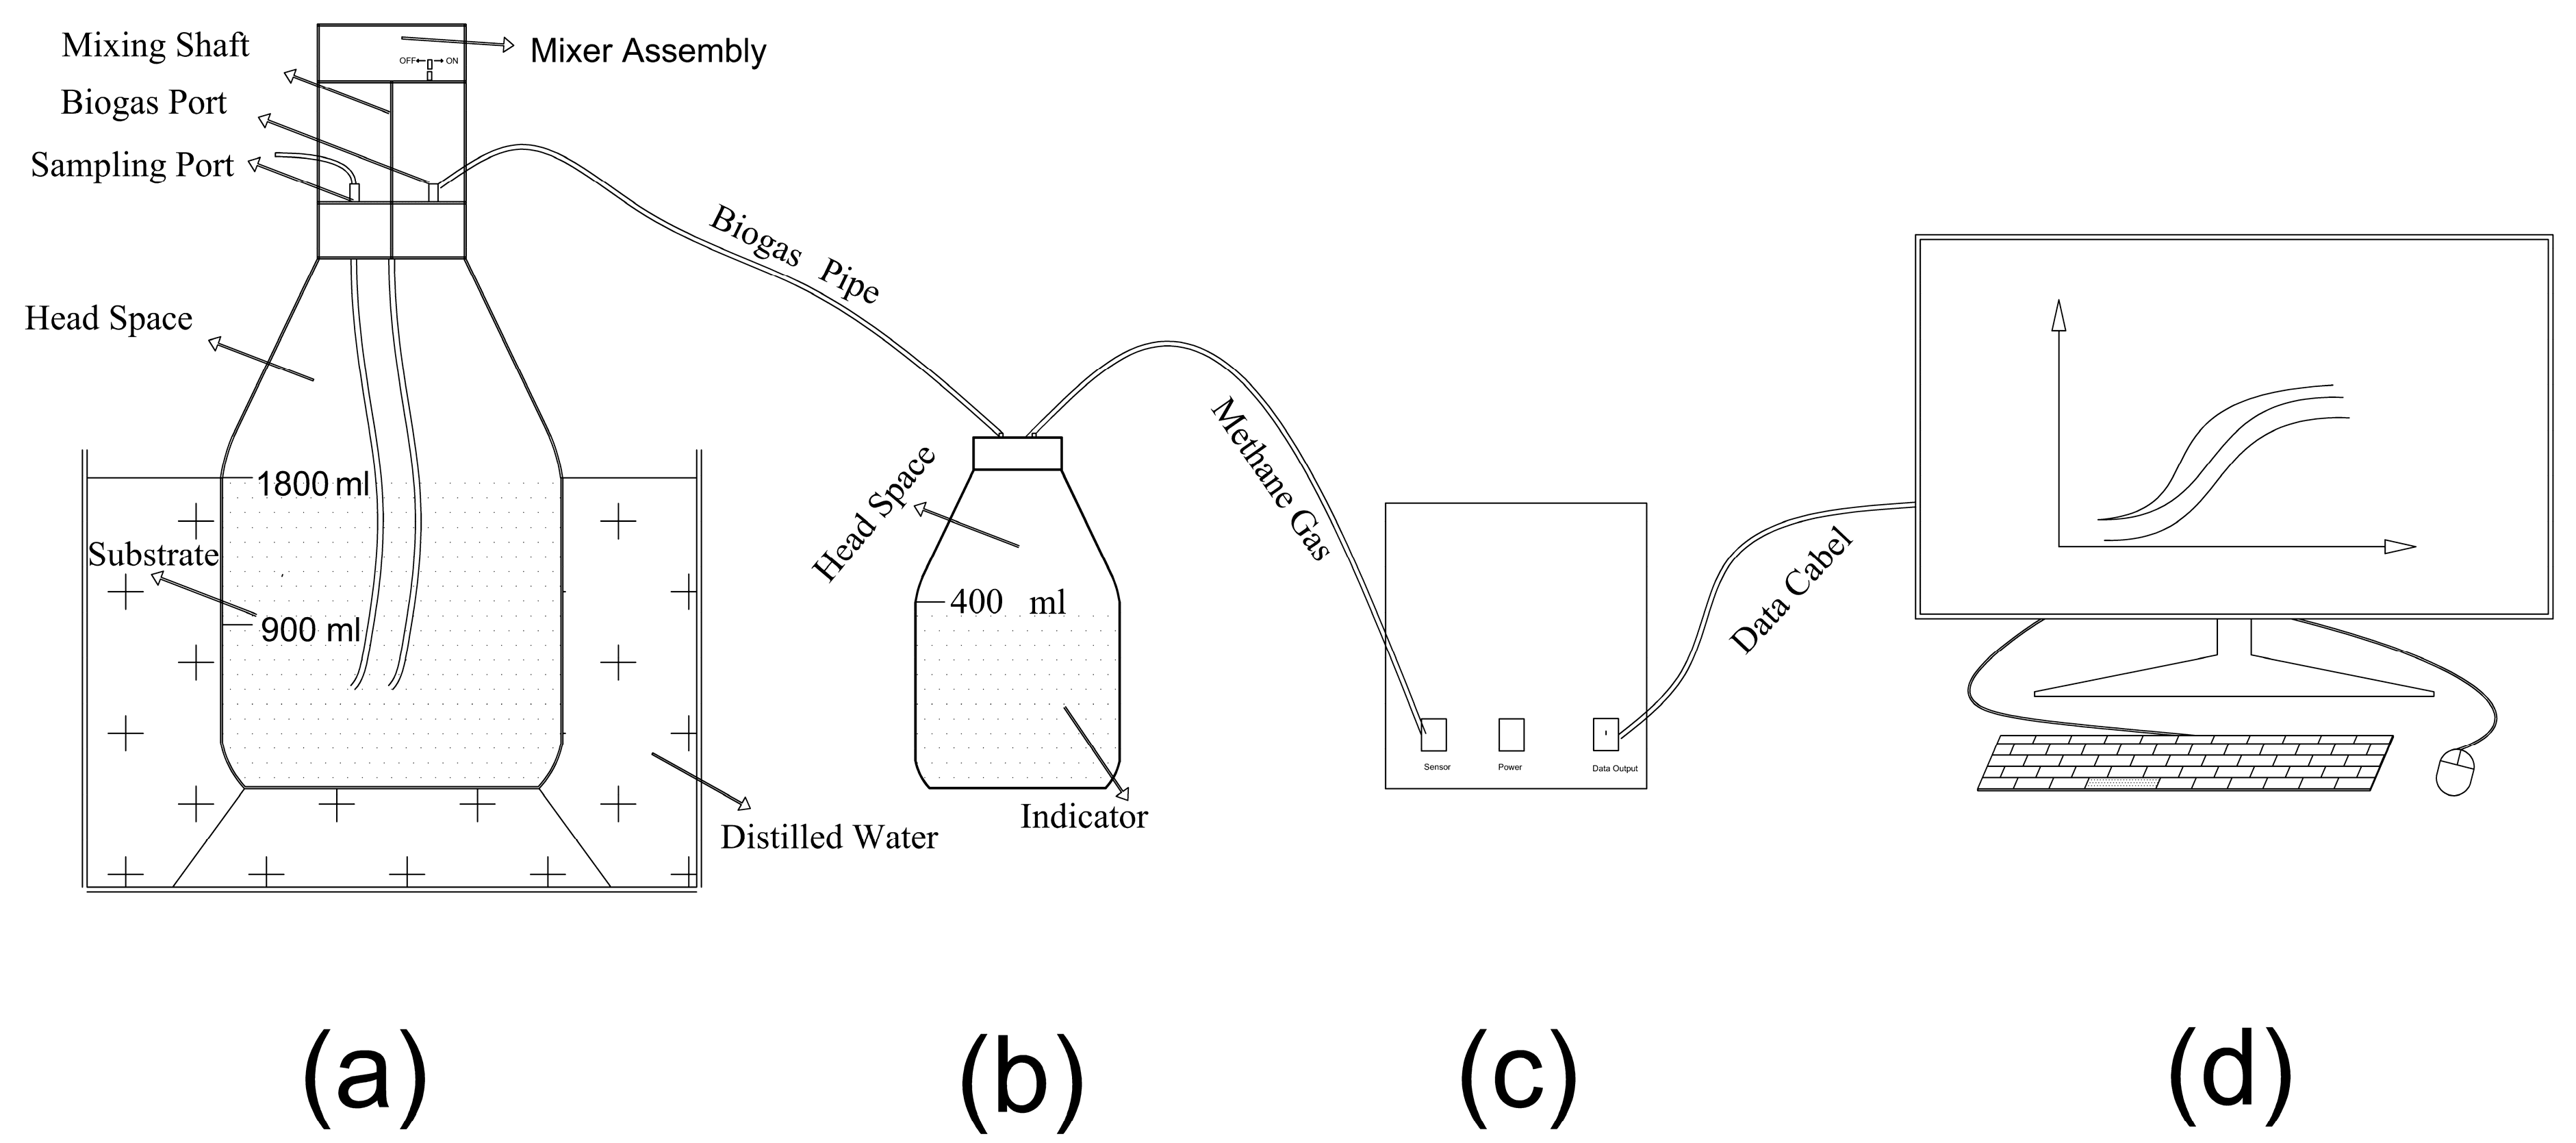
Figure 1. Schematic of the batch anaerobic digestion setup used in this study. (a) Digesters where substrates are mixed and methane is produced, (b) carbon capturing units (CCUs) to remove CO2 and H2S, (c) gas meters for measuring bio-methane flow rate and (d) data acquisition system for recording and analyzing gas production over time.
Fermentation 11 00659 g001
Figure 2. Cumulative methane vs. time graphs for mesophilic and thermophilic conditions. (a) Cumulative methane vs. time for the first 24 h under mesophilic conditions. (b) Cumulative methane vs. time for the first 24 h under thermophilic conditions. (c) Cumulative methane vs. time in days under mesophilic conditions. (d) Cumulative methane vs. time in days under thermophilic conditions.
Fermentation 11 00659 g002aFermentation 11 00659 g002b
Figure 3. pH vs. time graphs for (a) mesophilic and (b) thermophilic conditions.
Fermentation 11 00659 g003
Figure 4. VFAs vs. time graphs for mesophilic (a) and thermophilic (b) conditions.
Fermentation 11 00659 g004
Figure 5. (a) Stacked bar chart of methane and VFA-derived methane equivalents for digesters D1–D6 operated under mesophilic conditions (37 °C; red bar outlines). (b) Corresponding results for thermophilic conditions (55 °C; green bar outlines). Each stacked bar represents methane (blue) and VFAs expressed as CH4-equivalents (orange), with percentage labels indicating the contribution of each fraction to the total methane-potential output.
Fermentation 11 00659 g005
Figure 6. Experimental and modified Gompertz model fitted graphs for (a) mesophilic and (b) thermophilic conditions. The experimental values are presented in solid lines while the Gompertz fitted curves are shown in dashed lines.
Fermentation 11 00659 g006
Table 1. Substrate and inoculum properties.
ParameterCWTWInoculum
pH5.074.278.5
TS (%)5.14.654.8
TS (g/L)50.742.2547
VS (g/L)4536.940
VS (% of TS)888785
C/N3014.113
TC (%) *2.436.836.2
TN (%) *0.082.62.9
Cellulose + Hemicellulose + Lignin + Ash<1%14.5%-
* Percentage is based on dry weight (w/w).
Table 2. Substrate proportions and properties in digesters.
DigesterCDRs (gVS/gVS)CW (mL)TW (mL)CM (mL)CW (VSg/L)TW (VS g/L)S/IpH
D1Control900090037.800.0016.8
D24.672018090030.246.6416.7
D31.754036090022.6813.2816.61
D40.836054090015.1219.9316.36
D50.31807209007.5626.5716.04
D6Control09009000.0033.2115.78
BlankBlank0090000-8.5
Table 3. Comparison of methane production from CW, TW and similar substrates in anaerobic digestion.
Digestion TypeSubstrate(s)InoculumKey Influencing FactorsMethane Yield (mL CH4/g VS-Added)References
Co-digestionTomato residues + cow manureAnaerobic digester sludge (municipal WWTP)Mesophilic (35 °C), Batch12–75[65]
Mono-digestionTomato residuesAnaerobic digester sludge (municipal WWTP)Mesophilic (35 °C), Batch324[65]
Co-digestionTomato waste + sewage sludgeAnaerobic digester sludge (municipal WWTP)Mesophilic (35 °C), Batch159[66]
Co-digestionTomato residues + cow manureFresh cow manureThermophilic (55 °C), Batch~200[67]
Co-digestionTomato residuesAnaerobic digestate from dairy manure digesterMesophilic (35 °C), Batch30[68]
Mono-digestionTomato plant waste (stems, leaves, etc.)Anaerobic digestate from dairy manure digesterMesophilic (40 °C), Batch210.8[69]
Co-digestionTomato leaves + cow manureFresh cow manureMesophilic (35 °C), Batch30–35[70]
Mono-digestionCheese wheyFresh cow manureMesophilic (35 °C), Batch7–400[71]
Mono-digestionCheese whey (dairy effluent)Anaerobic digester sludge (municipal WWTP)Psychrophilic (20 °C) vs. Mesophilic (35 °C), Batch389–436[72]
Co-digestionRaw cheese whey + coffee pulpAnaerobic sludge pre-acclimated to cheese wheyMesophilic (35 °C), Batch71[26]
Co-digestionTomato pomace + buffalo manureFresh buffalo manureMesophilic (35 °C), Thermophilic (55 °C), Batch50–300[36,73]
Co-digestionCheese whey + liquid cow manureLab CSTRs seeded with acclimated anaerobic consortiaMesophilic (35 °C), Two-phase AD (acidogenic + methanogenic)290[74]
Mono-digestionCheese whey + supplementationDigestate from farm dairy manure digesterMesophilic (35 °C), Batch424[75]
Co-digestionFood waste + cow manureFresh cow manureMesophilic (35 °C), Batch130–170[76]
Co-digestionchicken manure + corn stoverMesophilic digester effluentMesophilic (35 °C), Batch160–230[77]
Co-digestionFood waste + cow/pig manureFresh cow/pig manureMesophilic (35 °C), Batch14–30[33]
Co-digestionTomato waste + cheese wheyFresh cow manureMesophilic (35 °C), Thermophilic (55 °C), Batch25–182.5This Study
Table 4. The Gompertz model estimated parameters and R2 values.
Type Digester Pmax (mL/gVS-Added) Rmax (mL/h) Lag Phase (h) R2
Thermophilic D1 119.3 75.8 12 0.97
D2 182.5 97.3 6 0.98
D3 56.29 591.1 7 0.99
D4 58.44 1030.2 8 0.99
D5 86.33 1161.0 8 0.99
D6 66.63 852.9 9 0.99
Mesophilic D1 35.11 173.5 2 0.97
D2 43.16 268.5 2 0.99
D3 43.15 296.4 2 0.99
D4 39.1 352.4 3 0.99
D5 40.41 429.4 3 0.99
D6 25.47 334.2 3 0.99
Disclaimer/Publisher’s Note: The statements, opinions and data contained in all publications are solely those of the individual author(s) and contributor(s) and not of MDPI and/or the editor(s). MDPI and/or the editor(s) disclaim responsibility for any injury to people or property resulting from any ideas, methods, instructions or products referred to in the content.