Article

Determining Fermentation Conditions to Enhance Antioxidant Properties and Nutritional Value of Basil Seeds Using Lactobacillus plantarum

by
Sima Maleki
1,2,3,
Seyed Hadi Razavi
1,*,
Hariom Yadav
2,3,
Zeinab E. Mousavi
1 and
Shalini Jain
2,3,*
1
Bioprocess Engineering Laboratory (BPEL), Department of Food Science, Engineering and Technology, College of Agriculture and Natural Resource, University of Tehran, Karaj 3158777871, Iran
2
USF Center for Microbiome Research, Microbiomes Institute, University of South Florida, Tampa, FL 33612, USA
3
Department of Neurosurgery and Brain Repair, University of South Florida, Tampa, FL 33612, USA
*
Authors to whom correspondence should be addressed.
Fermentation 2024, 10(9), 467; https://doi.org/10.3390/fermentation10090467
Submission received: 8 August 2024 / Revised: 31 August 2024 / Accepted: 2 September 2024 / Published: 9 September 2024

Abstract

:
Fermented seeds and their bioactive compounds have captivated global interest due to their functional properties. Basil seeds are used worldwide in the food, cosmetic, and pharmaceutical industries, but their functional and nutritional properties after fermentation are not known. The aim of this study was to optimize the effect of fermentation on the improvement in the functional properties of basil seeds by Lactobacillus plantarum. Basil seed samples were categorized into seven water volumes (named A–G) and fermented for 24, 48, 72, and 96 h with L. Plantarum. The results show that the pH and total microbial content (TMC) significantly changed after 24 h of fermentation (p < 0.05). Fermentation significantly increased the antioxidant properties and niacin content of basil seeds compared with non-fermented control samples (p < 0.05). Fermented samples G-24, G-48, and G-72 (samples with a ratio of 1 g (basil):10 mL (water) fermented for 24,48 and 72 h), exhibited the highest DPPH and ABTS scavenging activity. The total polyphenol content (TPC) was most prominent in the samples G-72, G-24, and G-48, respectively. Sample G-48 showed the highest antioxidant activity. Notably, sample G-24 showed a significant increase in niacin content (64 µg/mL). These results underscore that varying moisture levels and fermentation durations have a significant impact on the nutritional/functional value of basil seeds. Overall, fermenting basil seeds with L. plantarum increased their functional properties with greater antioxidant and TPC activities as well as increased nutritional value.

1. Introduction

Over time, the interest in the relationship between food and health has increased, and the purpose of food has evolved to enhance human health through added functionality known as functional food [1]. While there is no universally accepted definition, functional food is generally understood to be food supplemented with additional ingredients such as vitamins, proteins, fibers, probiotic bacteria, or other food additives [2]. A recent strategy to achieve functional food involves using fermentation with probiotic bacteria as “food additives” [1,2].
Fermentation is a traditional method that imparts a unique aroma, flavor, and texture to food, enhances digestibility and water-soluble vitamin contents, degrades anti-nutritional factors, converts phytochemicals such as polyphenols into more bioactive and bioavailable forms, produces antioxidant components that are able to decrease/eliminate reactive oxygen species (ROS) and oxidative stress, and enriches the nutritional quality of food [3,4]. ROS and oxidative stress are key chemical processes that can increase the production of oxygen radicals [4,5]. These radicals can cause damage to proteins and DNA and activate intracellular matrix metalloproteinases (MMPs) [6]. Water-soluble vitamins such as niacin/nicotinamide (B3) enhance moisture content, fortify the skin barrier function, and prevent skin damage and scarring [7,8,9]. Lactic acid bacteria (LAB), particularly probiotics, can contribute to the proliferation of nutritional quality (e.g., increasing vitamin levels) and show a positive effect on addressing oxygen radicals during the fermentation process [10,11,12]. This is why interest in using fermented foods has surged in recent decades [13,14,15,16]. A biologically safe method that is conducted on a solid substrate without free moisture but with sufficient water content is one fermentation method [17,18,19]. The environmental conditions, such as the water content and fermentation time, are crucial in determining the final properties of fermented products [15,20,21].
One of the medicinal plants rich in high dietary fiber and protein is basil seeds (Ocimum basilicum L.), which belong to the Lamiaceae family and are increasingly common in Asian and Central American countries [22]. They are recognized for their antioxidant, antimicrobial, anti-inflammatory, and antidepressant properties and their role in preventing type 2 diabetes [22,23]. They are used in different ways, e.g., in food, pharmaceuticals, and cosmetics [24]. The healthy properties of basil can be enhanced through fermentation [22,25]. The influence of optimizing fermentation variables, including moisture and time, on basil seeds’ antioxidant properties, phenolic compounds, and nutritional value, such as niacin content, has not yet been reported.
Therefore, this research aimed to optimize the environmental conditions of basil seed fermentation, including varying the amounts of inoculum water and fermentation times. The hypothesis was that fermenting and optimizing basil seed fermentation can result in a functional diet enriched with antioxidant components and enhanced nutritional value, thereby promoting health.

2. Materials and Methods

2.1. Chemical and Reagents

Basil seeds (O. basilicum) were purchased from Spicy World Company (Stafford, TX, USA). 1,1-diphenyl-2-picrylhydrazyl (DPPH) and 2,2′-Azino-bis (3-ethylbenzothiazoline-6-sulfonic acid (ABTS) were obtained from Sigma-Aldrich (Sigma–Aldrich, St. Louis, MO, USA) and Fischer Scientific for evaluating antioxidative characteristics. Folin and Ciocalteu’s phenol reagent, sodium carbonate, and gallic acid for measuring TPC were purchased from Sigma-Aldrich Company (Sigma–Aldrich, St. Louis, MO, USA). The lyophilized culture of L. planetarum was activated from the lab’s microbial collection (University of South Florida, USA). De Man–Ragosa–Sharpe agar (MRSA), chloroform (99.0–99.4% CHCl3), methanol (>99.0%), potassium persulfate (K2O8), and niacin standard (>99.0%, C6H5NO2) were purchased from Sigma-Aldrich (Sigma–Aldrich, St. Louis, MO, USA).

2.2. Sample Preparation

To optimize the fermentation of the basil seeds, we considered various fermentation durations and water volumes to determine the best conditions. Table 1 presents the descriptions of the samples of fermented and unfermented basil. The basil samples were prepared at 7 levels of moisture with ratios including 1:4, 1:5, 1:6, 1:7, 1:8, 1:9, and 1:10 based on the weight of the meshed basil powder samples (g) and volume of water (mL) (this amount of water was chosen based on the physical properties and water-holding capacity of the basil seeds). After adding the appropriate volume of water, each mixture was autoclaved at 121 °C for 15 min and then cooled to room temperature (28 °C). After inoculating 5% (mL/mL) of activated L. planetarum into the sterilized basil media for the final bacterial concentration of approximately 1 × 10⁸ cfu/mL, the samples were incubated at 37 °C for 24 h, 48h, 72 h, and 96 h [26].
To activate L. planetarum, 1 mL of bacterial culture were inoculated into 9 mL of MRS medium for 16 h at 37 °C. The activated bacteria were centrifuged at 4300 rpm/4 °C. The supernatant was discarded, and the pellet was washed with saline. This process was repeated. The pellet was diluted by water to reach an OD of 1.6 at a 600 nm wavelength using a Microplate Reader (Perkin Elmer; Waltham, MA, USA) [10,27].
After incubating the basil samples with the L. planetarum for 24 h, 48 h, 72 h, and 96 h, the pH values and microbial counts were measured. Subsequently, the samples were dried at 40 °C for 16 h [24]. The dried fermented basil seeds were blended, meshed, and stored at −80 °C for further analysis. The procedure for the preparation of the fermented basil samples is shown in Figure 1.

2.3. Moisture, pH, and Microbiological Quality Measurement

The moisture contents of the unfermented basil samples with different volumes of water were determined according to procedures of the Association of Official Agricultural Chemists, with some modifications [28]. Approximately 0.1 g of each sample was dried at 105 °C until a consistent weight was achieved. A sensitive balance was used to measure the weights of the samples before and after drying to determine their moisture contents.
The pH of all the basil samples (fermented and unfermented samples) was measured using a high-precision pH meter (Optional Ub-5 Meter, 115 VAC, Cole-Parmer, Chicago, IL, USA) after 24 h, 48 h, 72 h, and 96 h of fermentation. The pH meter was primarily calibrated using commercial pH 4 and 7 standards.
The microbiological quality of the fermented samples was verified by determining the cell counts of L. palntarum in the MRS agar. For this reason, after 24 h, 48 h, 72 h, and 96 h of fermentation, 0.1 g of each fermented sample was added to 0.9 mL of saline and then plated on MRS agar by preparing a serial dilution. Each sample’s colony-forming units (CFUs) were enumerated after incubation at 37 °C for 48 h. Data were expressed as log CFU/mL [10,11,24].

2.4. Antioxidant Properties

2.4.1. Extracting Basil Samples

To measure the antioxidant properties, three tests were examined. Additionally, selecting the extraction solvents and methods was critical for determining the antioxidant properties/polyphenols. In this study, pure methanol was used to extract the fermented basil seeds.
To prepare the basil extract samples, 2.5 mL of pure methanol was added to 250 mg of dried and meshed basil samples. They were completely mixed for 1 min and then kept in a dark place for 2 h. After 2 h, the samples were remixed and centrifuged at 1500× g for 10 min. The supernatants were filtered at 0.45 µm, and the samples were stored at 4 °C for further chemical analysis.

2.4.2. DPPH and ABTS Scavenging Assay

An amount of 60 µL of each extracted sample was mixed with 1.5 mL of 2,2-diphenyl-1-picrylhydrazyl (DPPH) and kept at room temperature for 30 min. The absorbance of the samples was read at 513 nm using a Microplate Reader (Perkin Elmer; Waltham, MA, USA). The percentage of DPPH free radical inhibition was calculated by Equation (1):
DPPH scavenging activity (%) = (Acontrol 513 − Bextract513) × 100/Acontrol 513
Acontrol: Pure methanol + DPPH read at ‘0’ min/513 nm; Bextract: Extract of samples + DPPH.
The ABTS scavenging ability of the sample extracts was measured according to the method described by Silveira Coelho et al., with some modifications [29]. ABTS was prepared by reacting an ABTS aqueous solution (7 mM) with potassium persulfate (2.45 mM, final concentration) in a dark place for 16 h. Then, ethanol was used to adjust its concentration to around 0.700 at Abs 734 nm. Then, 50 µL of each sample extract was added to 150 µL of the ABTS solution, and the absorbance was measured at 734 nm after 6 min of incubation at room temperature. Gallic acid was used as a standard, and the gallic acid equivalent antioxidant capacity (GAEAC) was subsequently calculated based on the standard curve [30]. The free radical scavenging ability was expressed as gallic acid equivalents in mg per mg of basil mass.
ABTS   radical   scavenging   activity   ( % ) = ( C o n t r o l   A b s S a m p l e   A b s C o n t r o l   A b s ) × 100
Control Abs: ABTS + solvent (pure methanol), Samples Abs: ABTS + Extract of sample.

2.4.3. Total Polyphenol Components (TPCs)

Total Polyphenol concentration (TPC) was determined according to the Folin–Ciocalteu method of Shirvani et al. (2016) with a slight modification [31]. An amount of 25 µL of each extracted sample was mixed with 125 µL of Folin–Ciocalteu’s reagent (1:10, diluted with distilled water) and 100 µL of a 7.5% sodium carbonate solution. The samples were incubated at 45 °C for 15 min. After reaching room temperature, the absorbance was determined at 765 nm using a Microplate Reader (Perkin Elmer, Waltham, MA, USA). A calibration curve was prepared using a standard solution of gallic acid (>0.99). The result was expressed as ug of gallic acid equivalents (GAEs) per 100 g of the sample.

2.5. The Extraction Procedure for Nicotinamide (Niacin)

We followed Hämmerle et al.’s method to measure niacin with some modifications [32]. An amount of 100 mg of each of the top three samples in terms of antioxidant properties was extracted with 10 mL of methanol, using a H2O–solvent volume ratio of 80:20 (%) with the same procedure mentioned in Section 2.3. To optimize the GC measurements, the sample extracts were dissolved in chloroform with a ratio of 1:1 (500 µL:500 µL) by vortexing for 3 min and transferred into GC vials for analysis (1.00 μL injection). Standards and each replicate sample were run twice in the GC vials for the best extractants. The calibration curve for the niacin standard was in the range of 0.5–10 μg/mL, and 1.00 μL of each sample was injected directly into the GC vials [32].

Detection, Quantification, and Confirmation of Nicotinamide Content by Gas Chromatography (GC-FID)

The samples in chloroform were analyzed using a GC-2023 gas chromatograph (Shimadzu) controlled via GC Real-Time Analysis Software (Shimadzu, Kyoto, Japan), equipped with an AOC-30 i auto-injector (Shimadzu, Kyoto, Japan) and a flame ionization detector (FID). A BPX-5 capillary column (30 m × 0.25 mm I.D. 0.25 μm) was used with the following temperature parameters: the injector was at 330 °C; the column at 120–280 °C at 15 °C/min with a 2 min hold at the final temperature; and the detector at 280 °C. Helium served as the carrier gas at a flow rate of 15 mL/min. The extracted samples (1 μL) were automatically injected in spitless mode (2:1). For all samples, the full-scan mass was obtained by scanning from m/z 78 to 122. The niacin content in each sample was identified by comparing the retention time with the standard and quantified by the peak area integration using the GC PostRun Software (Shimadzu, Kyoto, Japan) [32].

2.6. Statistical Analysis

The analytical procedures were performed using R software 4.4.1. The results are presented as means ± the standard error of the means (SEMs; n = 3). The Shapiro–Wilk test and outlier test were used to assess the normality of the data distribution and the homogeneity of variance, respectively. The samples were analyzed using a one-way analysis of variance (ANOVA) at a significance level of p < 0.05. All experiments were conducted in triplicate. The figures were created using GraphPad Prism 8.0.

3. Results

3.1. Moisture Content, Changes in Colony Count (log CFU/mL), and pH

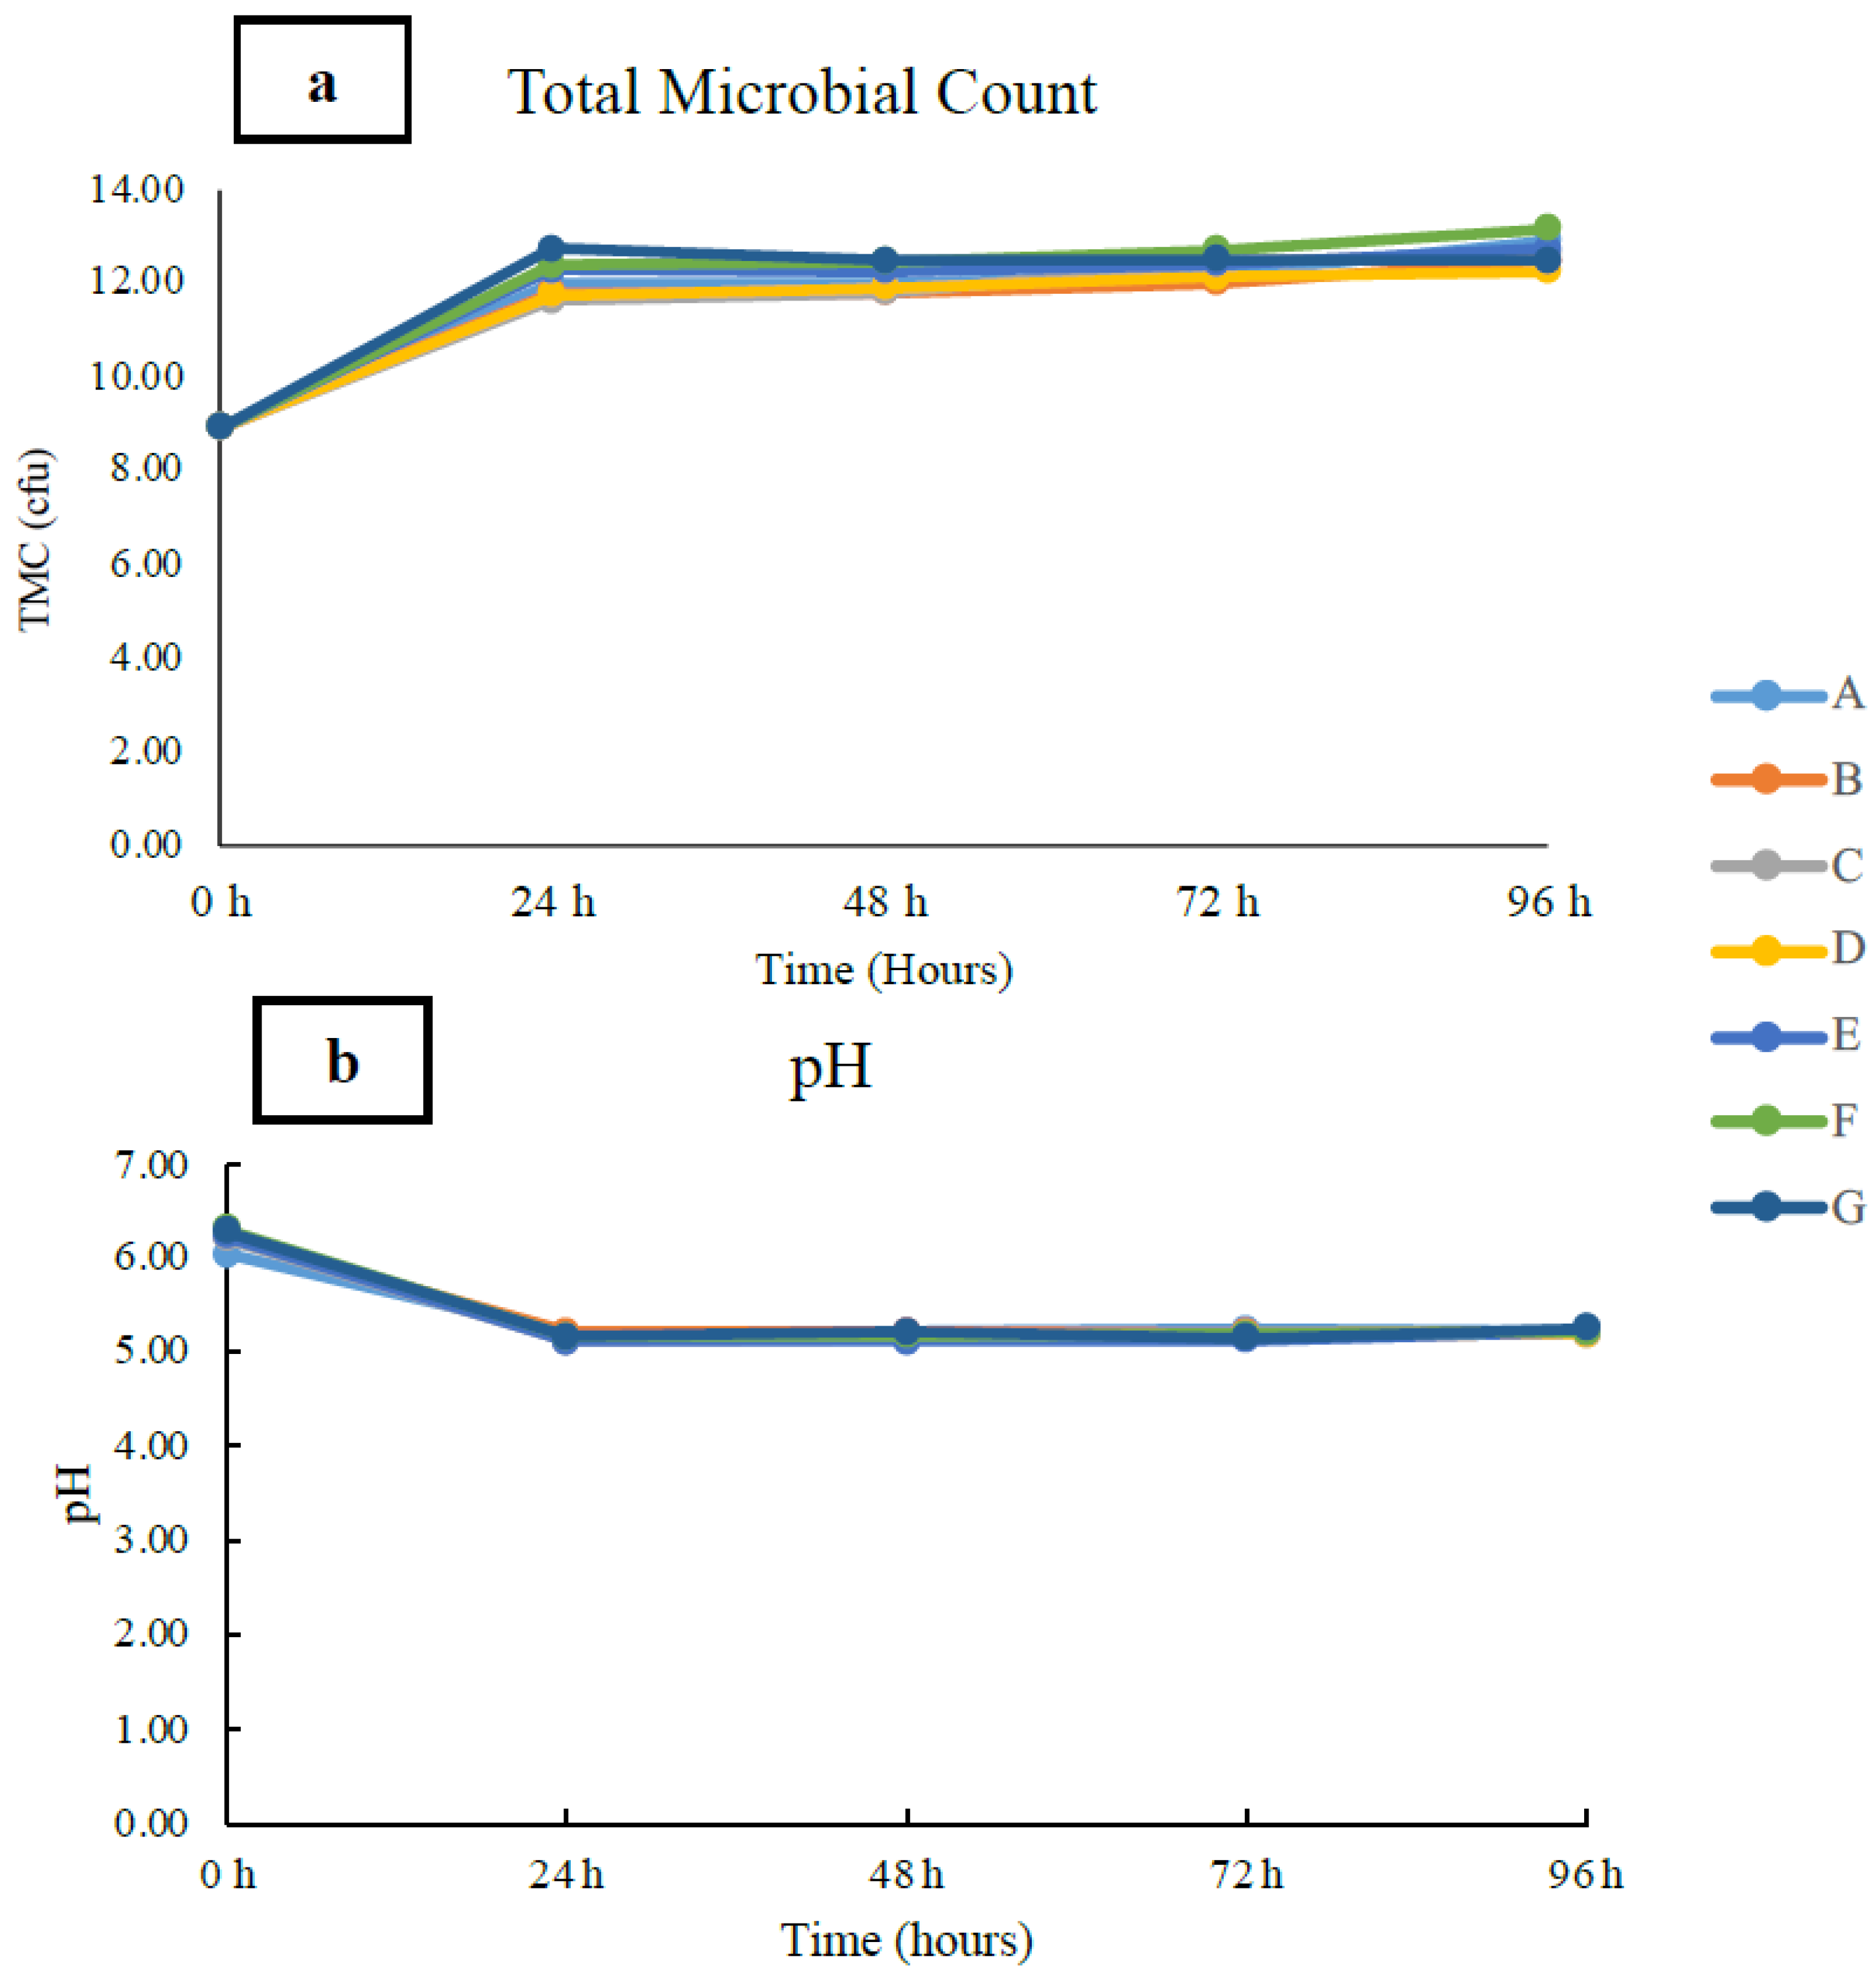
The moisture contents of the samples ranged from 79% to 91% (Table 2). Increasing moisture can affect other health properties and optimizing it can improve the fermentation quality. The initial pH of the basil seeds was near neutral and then decreased over time as the number of bacteria grew. At the beginning of fermentation (T0), all the samples had the same microbial concentration (8.9 log CFU g−1) since they were obtained from the same preparation bulk. Most samples showed a rapid increase in microbial concentration after 24 h, reaching the highest total microbial count (TMC) after 96 h of fermentation (Figure 2a). However, the highest TMC of sample G was observed after 24 h (approximately 12 log CFU/g), which then slightly decreased after 96 h. The highest TMC was observed in sample F (13.1 log CFU g−1) after 96 h. The highest increase after 24 h was seen in samples E, F, and G (12.26 log CFU g−1, 12.38 log CFU g−1, and 12.73 log CFU g−1, respectively). However, there were no significant differences between the samples at 24, 48, 72, and 96 h of fermentation.
To understand how the pH of basil changes during fermentation, measurements were taken for all treatments at 0, 24 h, 48 h, 72 h, and 96 h after adding L. plantarum. Figure 2b shows that the pH dropped significantly after 24 h of incubation, reaching a range of 5.2–5.11 for all samples. After that, the change in pH was moderate and did not significantly differ at 48 h, 72 h, and 96 h. Sample E exhibited the lowest pH (5.11), while sample G had the highest pH after 96 h (5.26). The changes in pH and TMC are shown in Table 3.

3.2. Impacts of Different Fermentation Conditions on Antioxidant Properties of Basil Seeds

Antioxidant and polyphenolic compounds can enhance the health benefits of seeds through several mechanisms, such as scavenging free radicals, complexing with pro-oxidants, and quenching singlet oxygen [7,25,33].

3.2.1. DPPH and ABTS Scavenging Ability

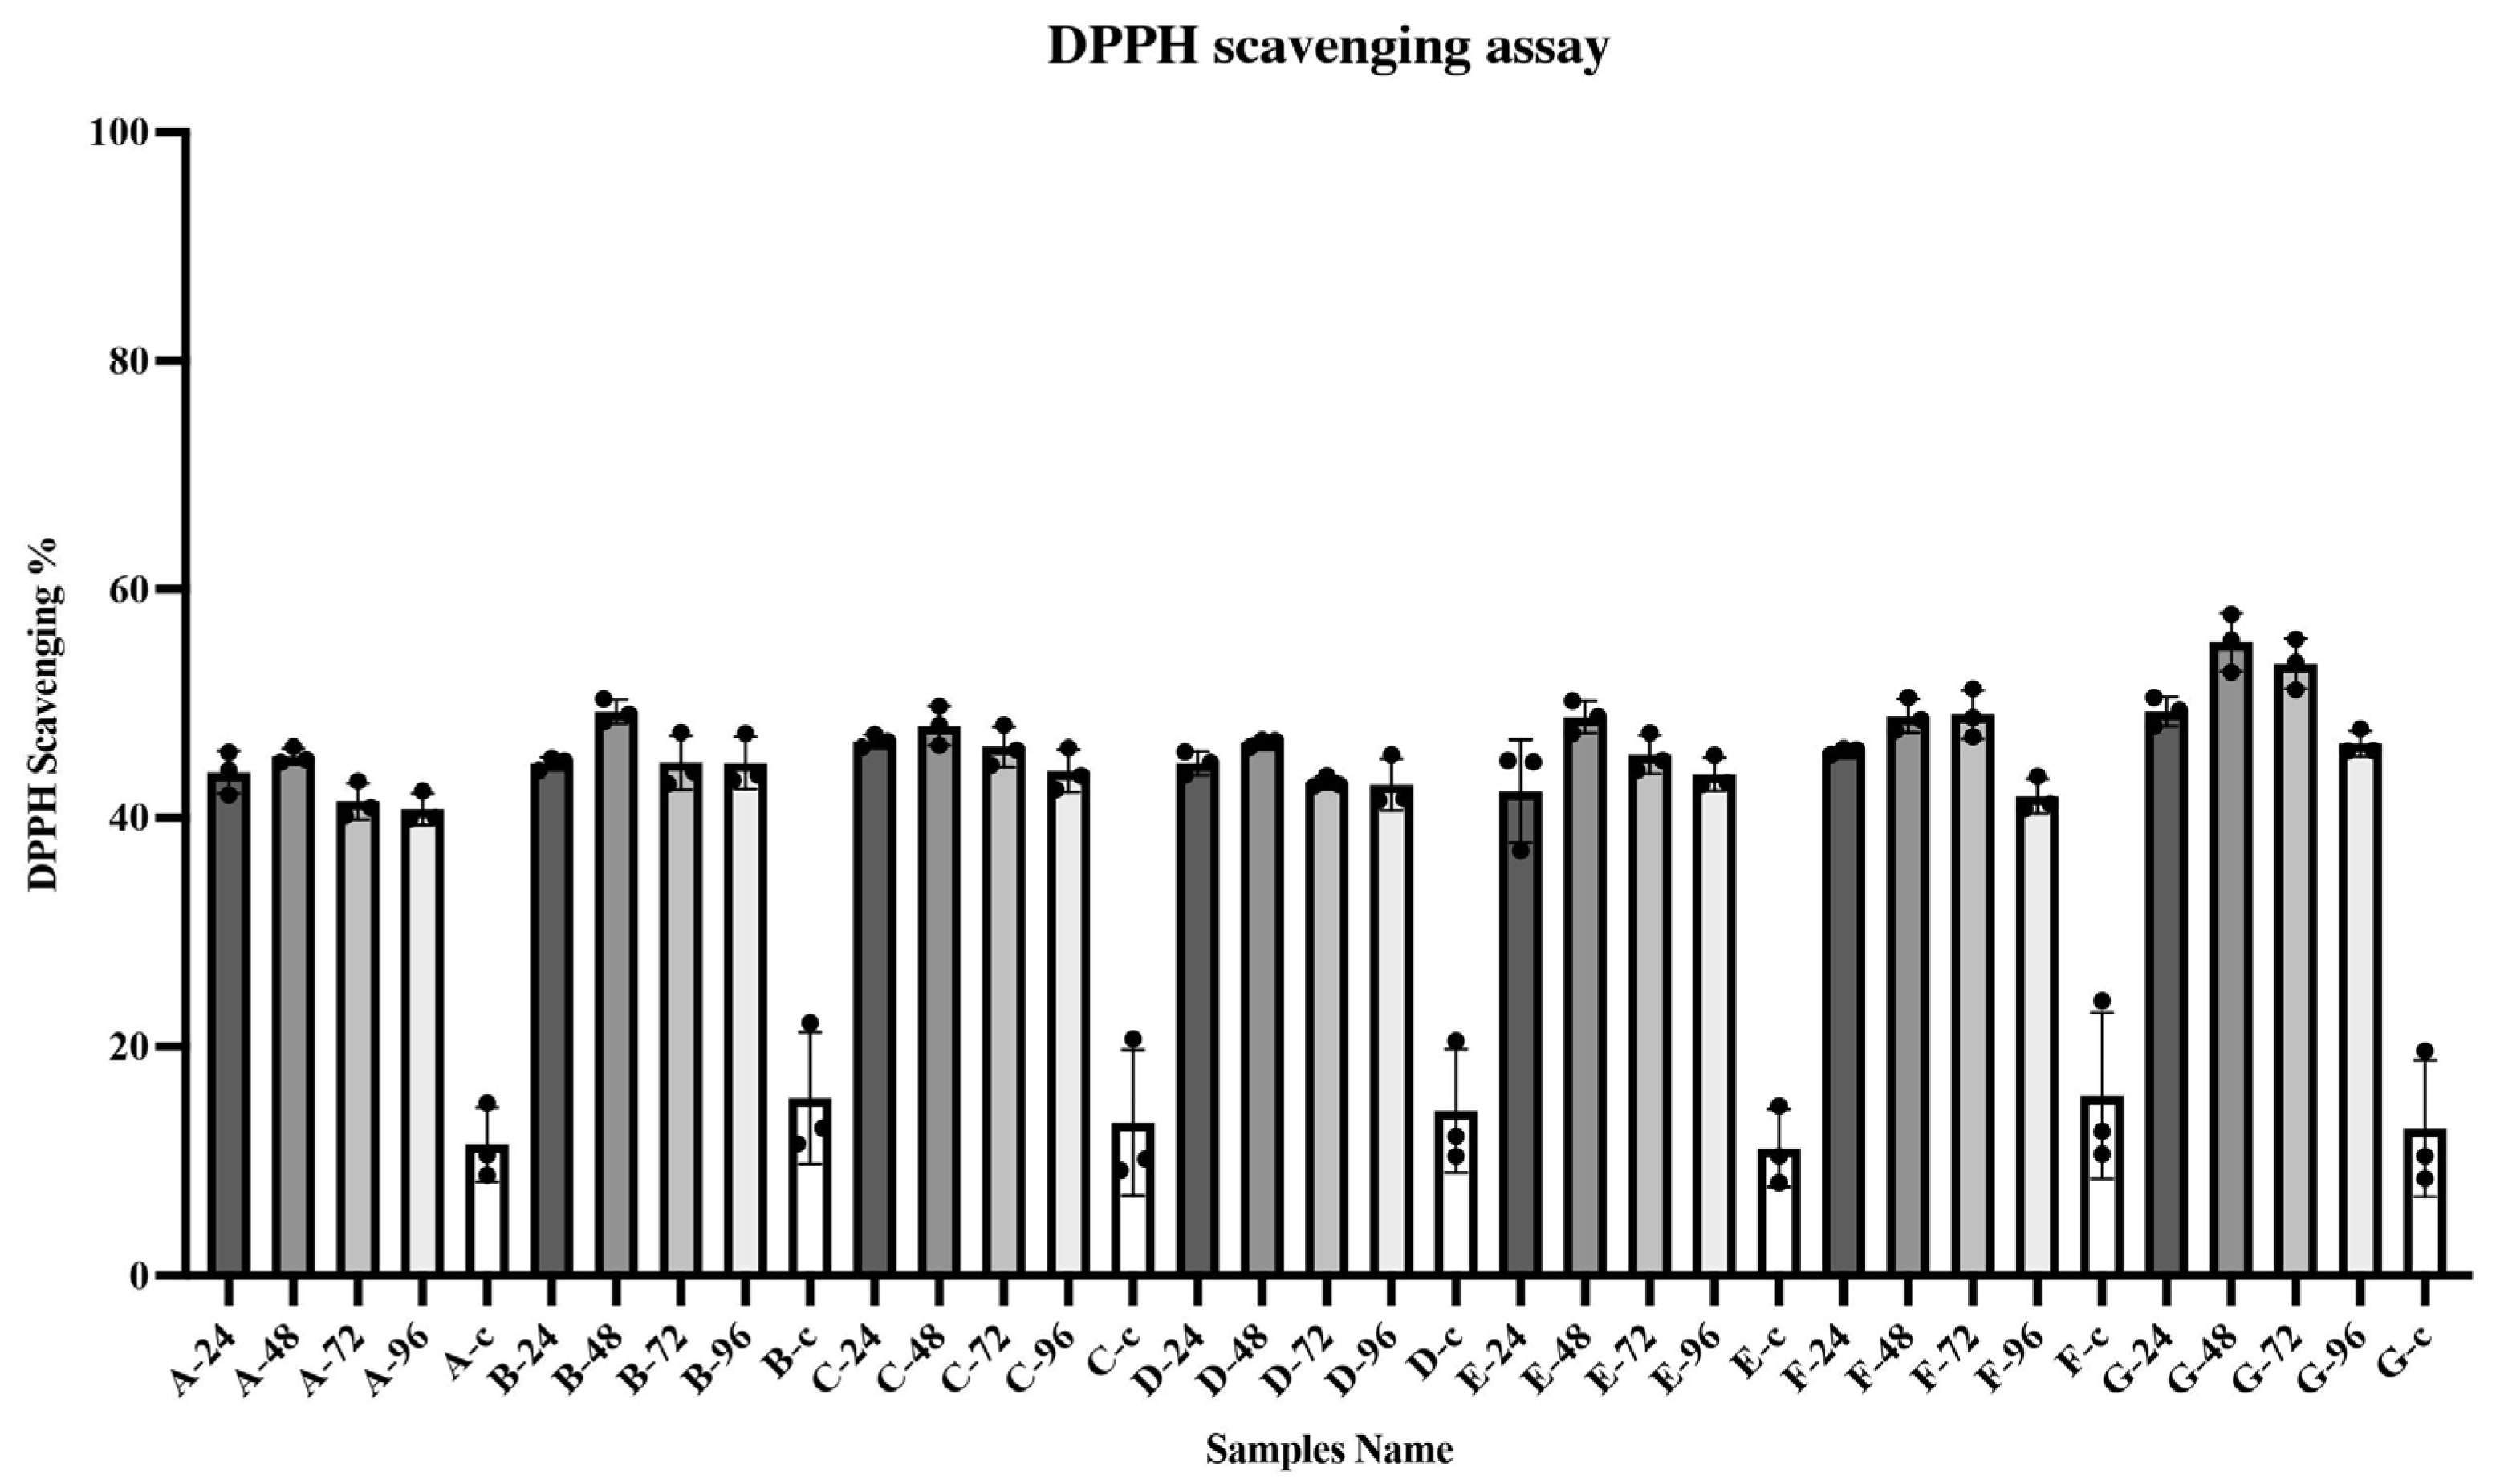
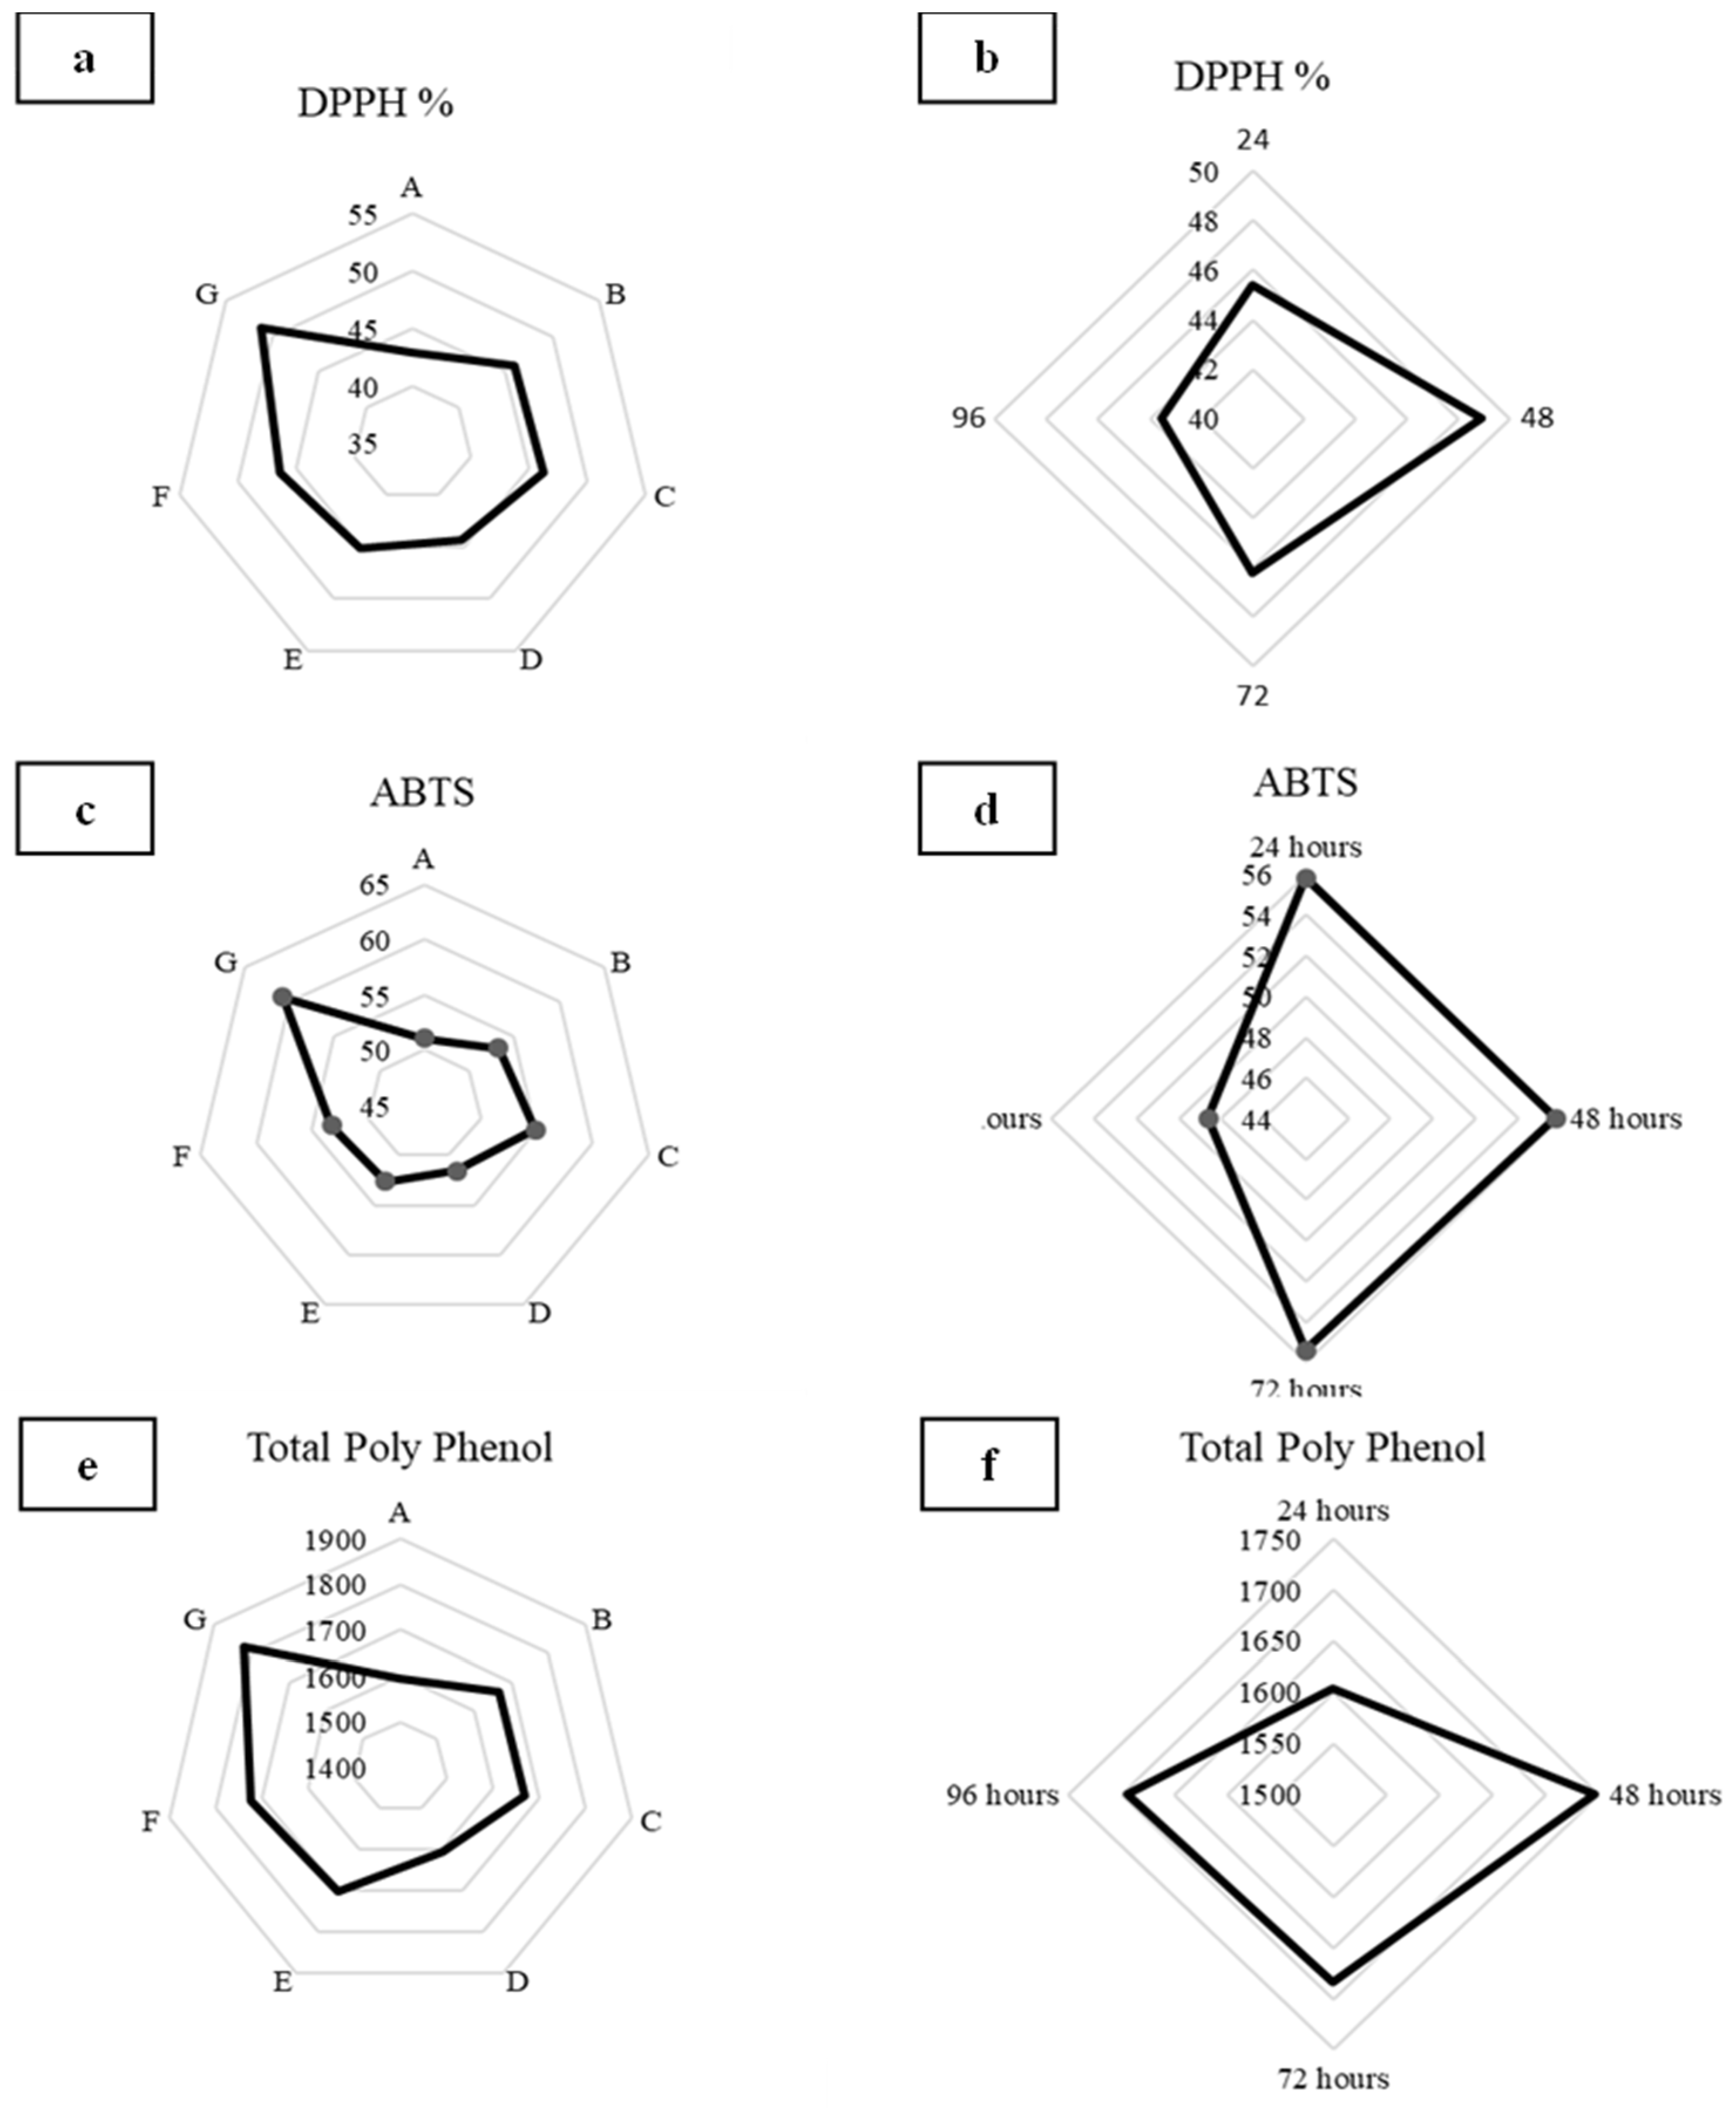
The DPPH scavenging assay revealed that basil fermentation significantly affected antioxidant properties (p < 0.05) (Figure 3). The DPPH scavenging activity percentage ranged from 11 to 55%. All control samples (unfermented) showed the lowest antioxidant properties. Samples G-48 and G-24 exhibited the highest antioxidant activity, with 55.38% and 49.32%, respectively. These values were significantly different from the control sample (G-0) (p < 0.05) but not significantly different from the other G samples, including G-24, G-72, and G-96 (49.32%, 53.49%, and 46.52%, respectively). Considering the average of samples with the same water content (A, B, C, D, E, F, and G), sample G (1 g of basil powder in 10 mL of water) had the highest average (51%) compared with the other samples (A (43%), B (46%), C (46%), D (44%), E (45%), and F (46%)) (Figure 4a). Regarding the fermentation time, the 48 h fermentation showed the highest antioxidant properties (49%) compared with 24, 72, and 96 h (45%, 46%, and 44%, respectively) (Figure 4b).
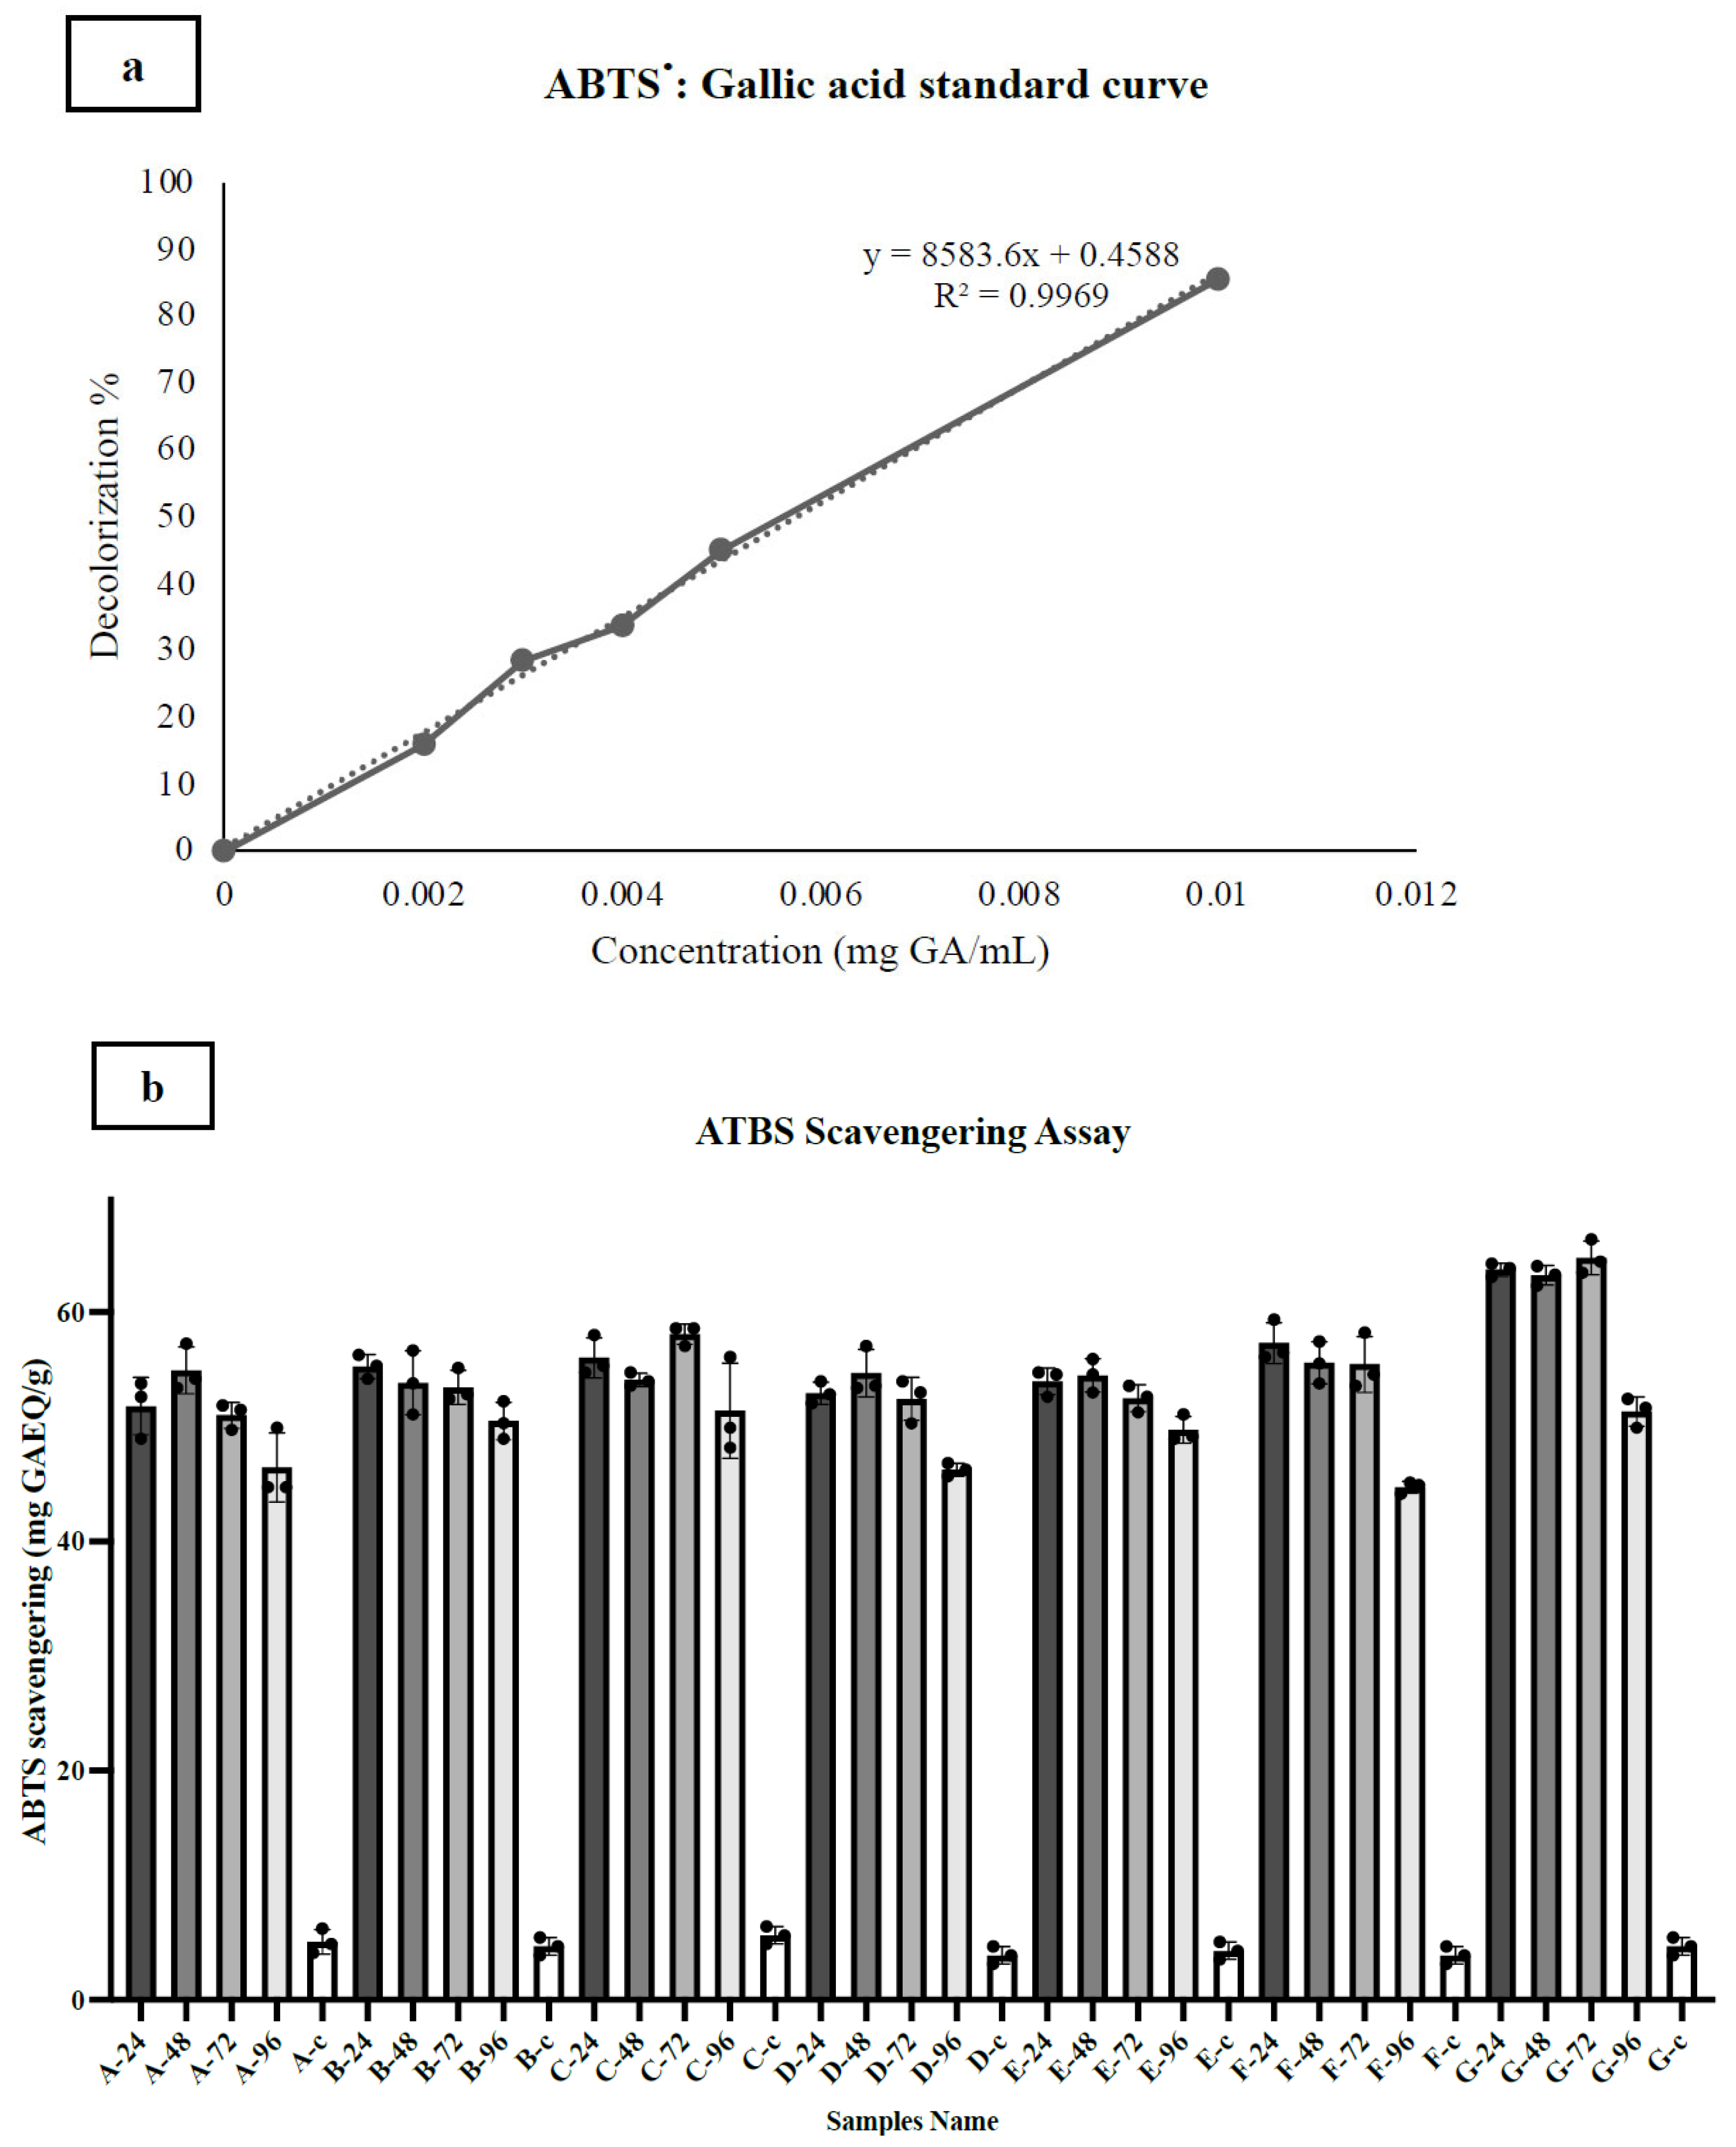
The second measure of antioxidant potential, the ABTS scavenging test was assessed using the standard curve of gallic acid, ranging from 0.01 to 0.5 mg GA/mL (Figure 5a). The ABTS antioxidant capacity of the fermented samples was significantly higher than that of the unfermented samples (p < 0.05) (Figure 5b). Among the fermented samples, sample G-72 had the highest ABTS radical disappearance (64.68 mg GA/g), followed by G-24 (63.65 mg GA/g) and G-48 (63.14 mg GA/g). On average, sample G had significantly higher values than samples A, B, C, D, E, and F, with averages of 51.04, 53.25, 54.89, 51.57, 52.66, and 53.25 mg GA/g, respectively (Figure 4c). However, the average antioxidant capacity of all fermented samples during 24 h, 48 h, and 72 h (55.84, 55.81, and 55.36 mg GA/g) was not significantly different, but all values were higher than those at 96 h (48.62 mg GA/g) (Figure 4d).

3.2.2. Total Polyphenol Concentration (TPC)

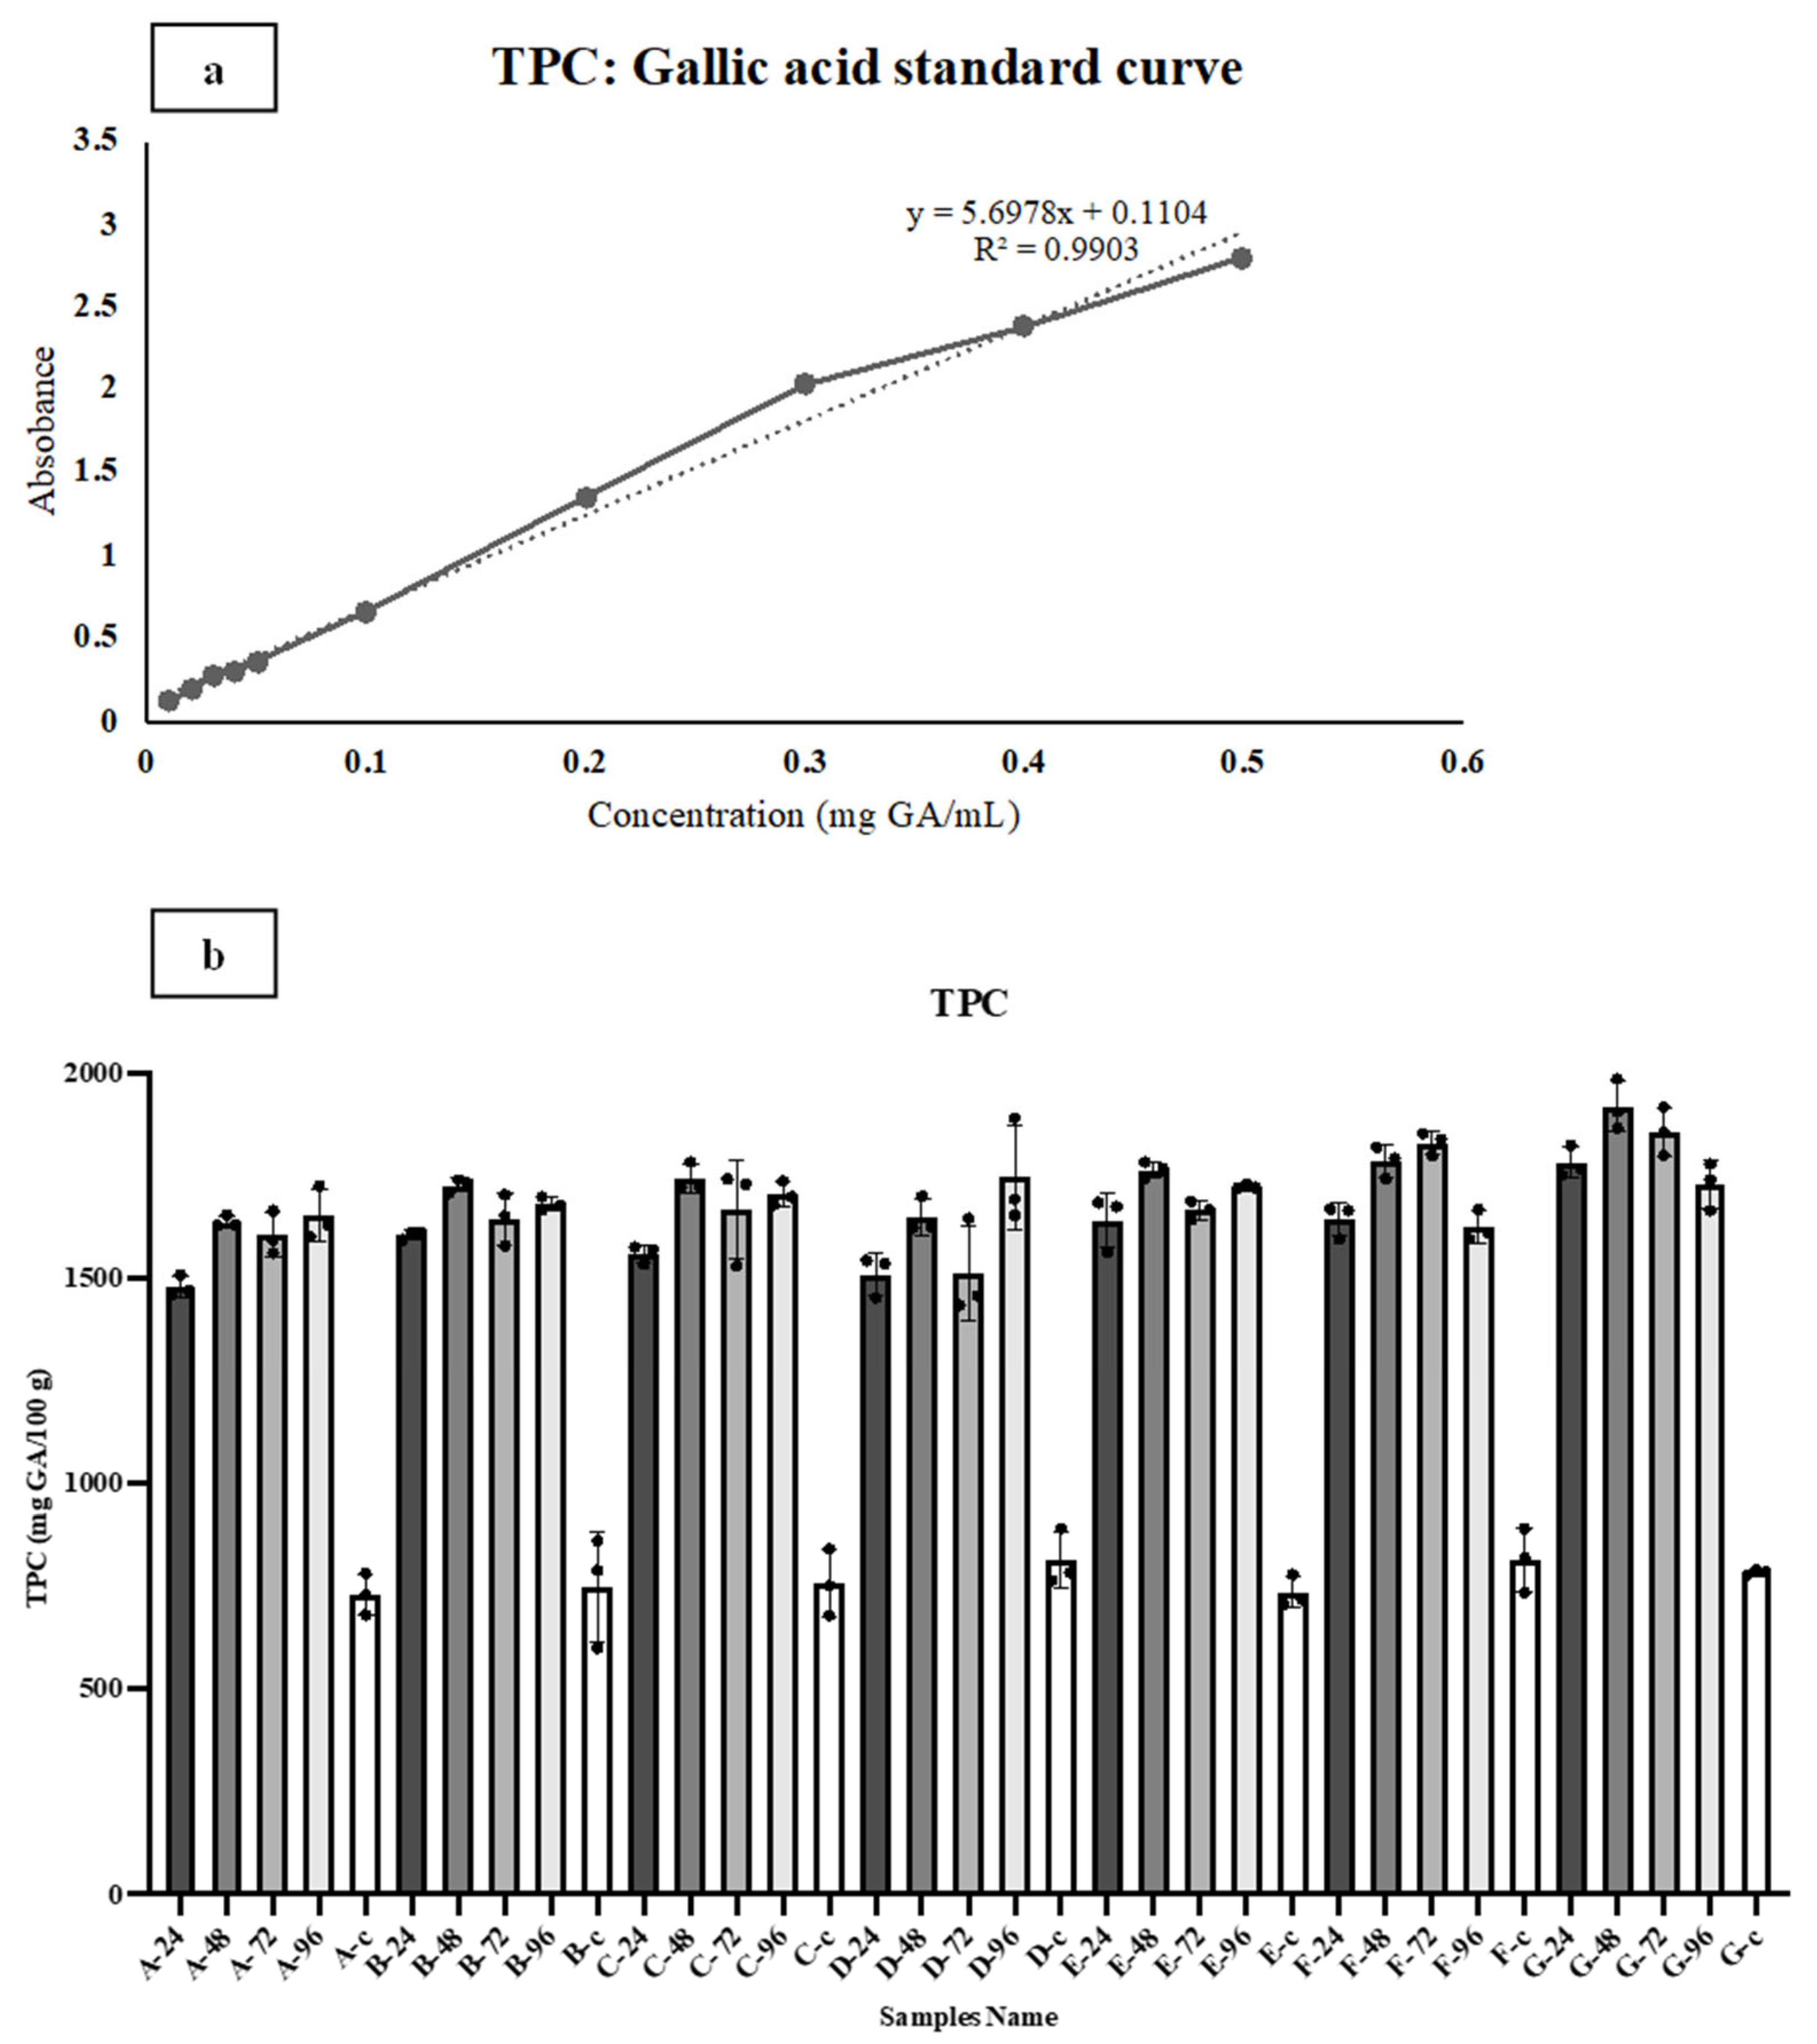
The total polyphenol concentration was the third antioxidant property tested, measured using the standard curve of gallic acid in the range of 0.01 to 0.5 mg GA/mL (Figure 6a). The fermented samples showed a significant difference in the TPC compared with the control samples (p < 0.005) (Figure 6b). The range of TPCs among the fermented samples was from 1423.09 mg/100 g to 2994.58 mg/100 g. Samples G-48, G-72, and G-24 showed the highest TPCs (1919.74, 1858.0, and 1781.97 mg/100 g, respectively) which were significantly different from that of G-0 (785.68 mg/100 g). Among the other fermentation conditions, the average of the G-samples (2865.367 mg/100 g) showed the highest TPC compared with samples A, B, C, D, E, and F (2564.3, 2658.1, 2663.4, 2578.4, and 2702.9 mg/100 g, respectively), regardless of the time (Figure 4e). In terms of the fermentation time, the average TPC after 48 h (2766.3 mg/100 g) was higher than that after 24, 72, and 96 h (2576.4, 2682.7, and 2697.3 mg/100 g, respectively) (Figure 4f).

3.3. Impacts of Different Fermentation Conditions on Nicotinamide (Niacin) Content of Basil Seeds

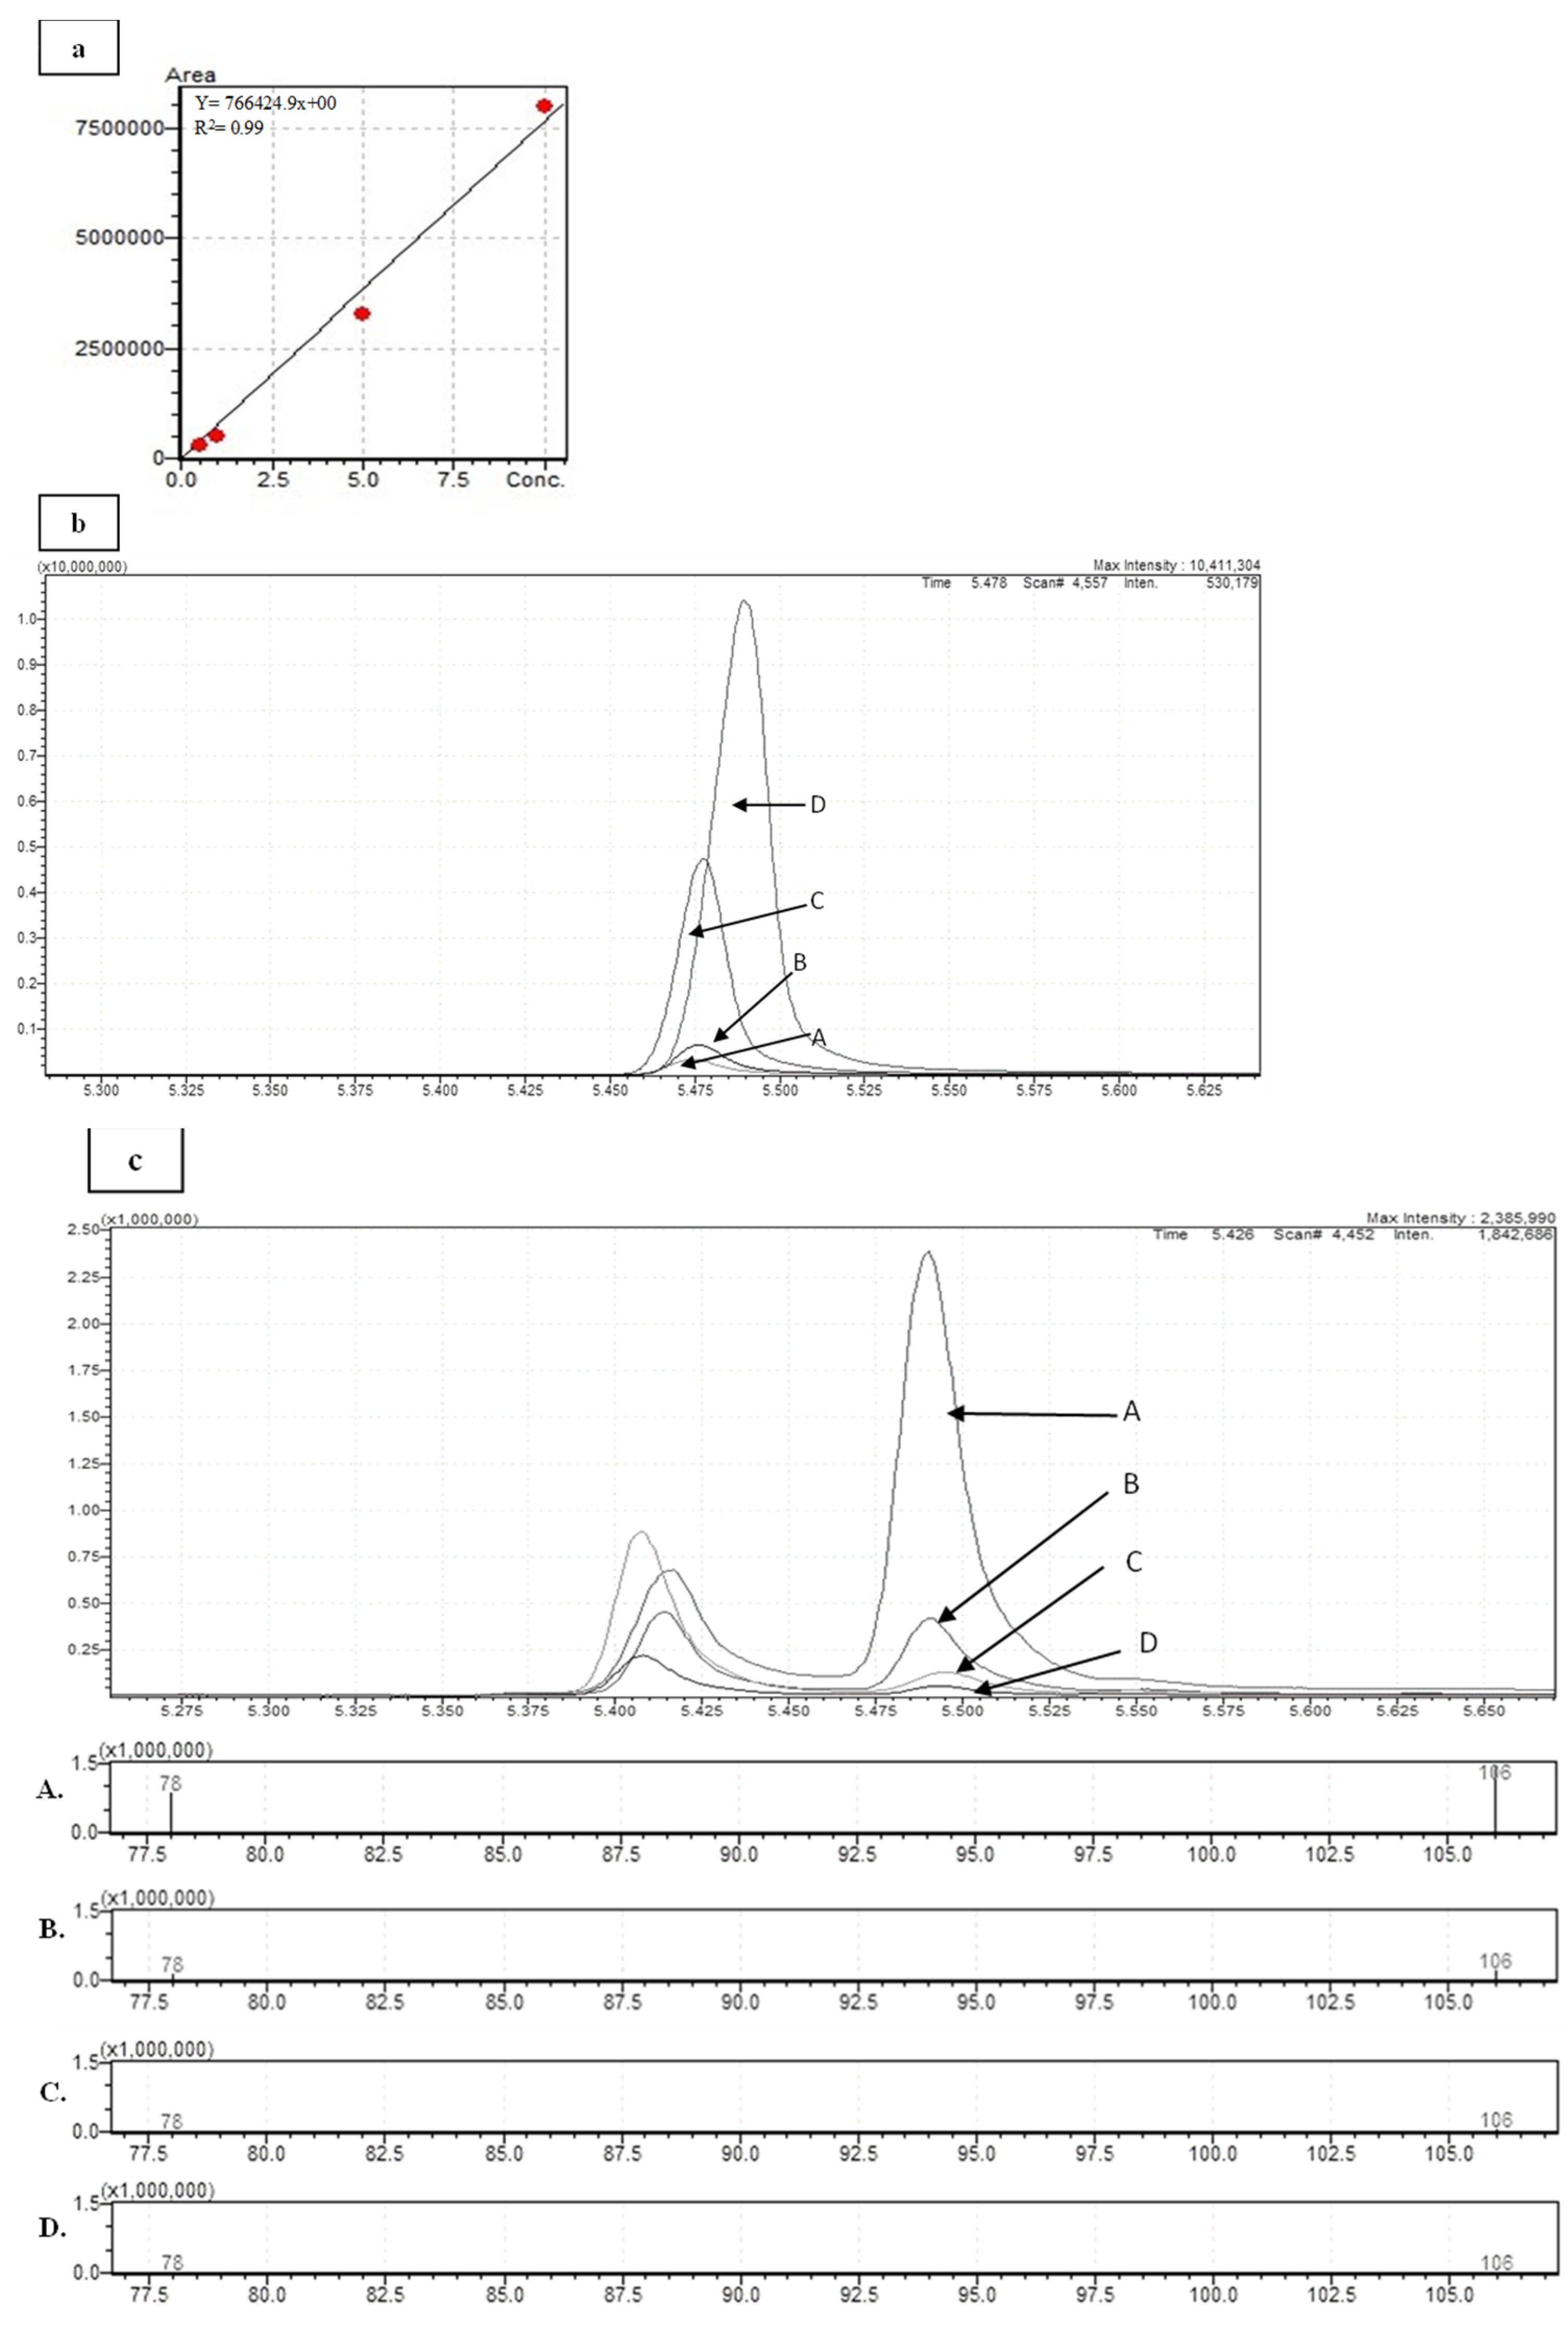
To investigate the effects of various basil fermentation conditions on the niacin content, the top three fermented samples were selected based on their antioxidant properties and TPCs (G-24, G-48, and G-72). Their niacin contents were then measured using the GC-MS multiple reaction monitoring (MRM) scan mode. MRM is a powerful method for eliminating matrix interference during GC assays, thereby increasing sensitivity and selectivity by the mass filtering of the precursor and product ions by altering the collision energy. In this study, the MRM parameters were optimized to set the precursor ion and collision energy with a scanning frequency ranging from 78 and 106 m/z. For the niacin content assay of the basil samples, the standard curve was created with pure niacin concentrations from 0.5 to 10 µg/mL (Figure 7a,b). The retention time was 5.480 min. Our results show that the niacin content increased by fermentation (p < 0.05). Samples G-24 (63.97 μg/mL), G-48 h (9.85 μg/mL), and G-72 (5.4 μg/mL) showed increased niacin contents by 63, 9, and 5 times, respectively, compared with unfermented samples (1.14 μg/mL).

4. Discussion

Generally, the efficiency and effectiveness of fermentation are governed by multiple variables, such as microbial culture, time, and percentage of moisture [27,34,35,36]. Additionally, the ability of microbial cultures (LAB) to produce antioxidant properties, TPC, and healthy components such as niacin varies according to the species, strains of bacteria, and fermentation conditions, including temperature, pH, moisture, and time [10,37,38,39]. pH plays an important role in fermentation as it can affect the production and solubility of certain substances [10,19,40]. In our study, the most significant changes in pH and TMC occurred during the first 24 h of fermentation. The significant increase in the number of bacteria within 24 h caused the drop in the pH. Our results are consistent with those of Tangüler et al., who showed that the most significant change in L. plantarum during fermentation occurred within 24 h [41]. Vatansever et al. also reported that the pH of vegetables significantly decreased during fermentation, reaching 5 after 24 h [42]. In some samples, the pH increase did not persist throughout the fermentation processes, slightly rising after 96 h. Based on scientific research, pH increases during fermentation because microorganisms initially consume nutrients and produce organic acids. As fermentation progresses and nutrients become scarce, the microorganisms start consuming the organic acids as a nutrient source, leading to an increase in pH [10,33,43,44]. Our results are consistent with those of Yuan et al., who showed that the pH initially decreased under neutral conditions and then increased throughout the fermentation process [43]. Laaksonen et al., also demonstrated that the pH decreased from 5.9 at the start of fermentation with LAB to values below pH 5 within 24 h and then slightly increased after 48 h [10]. The changes in the pH and TPC during fermentation are shown in Table 3.
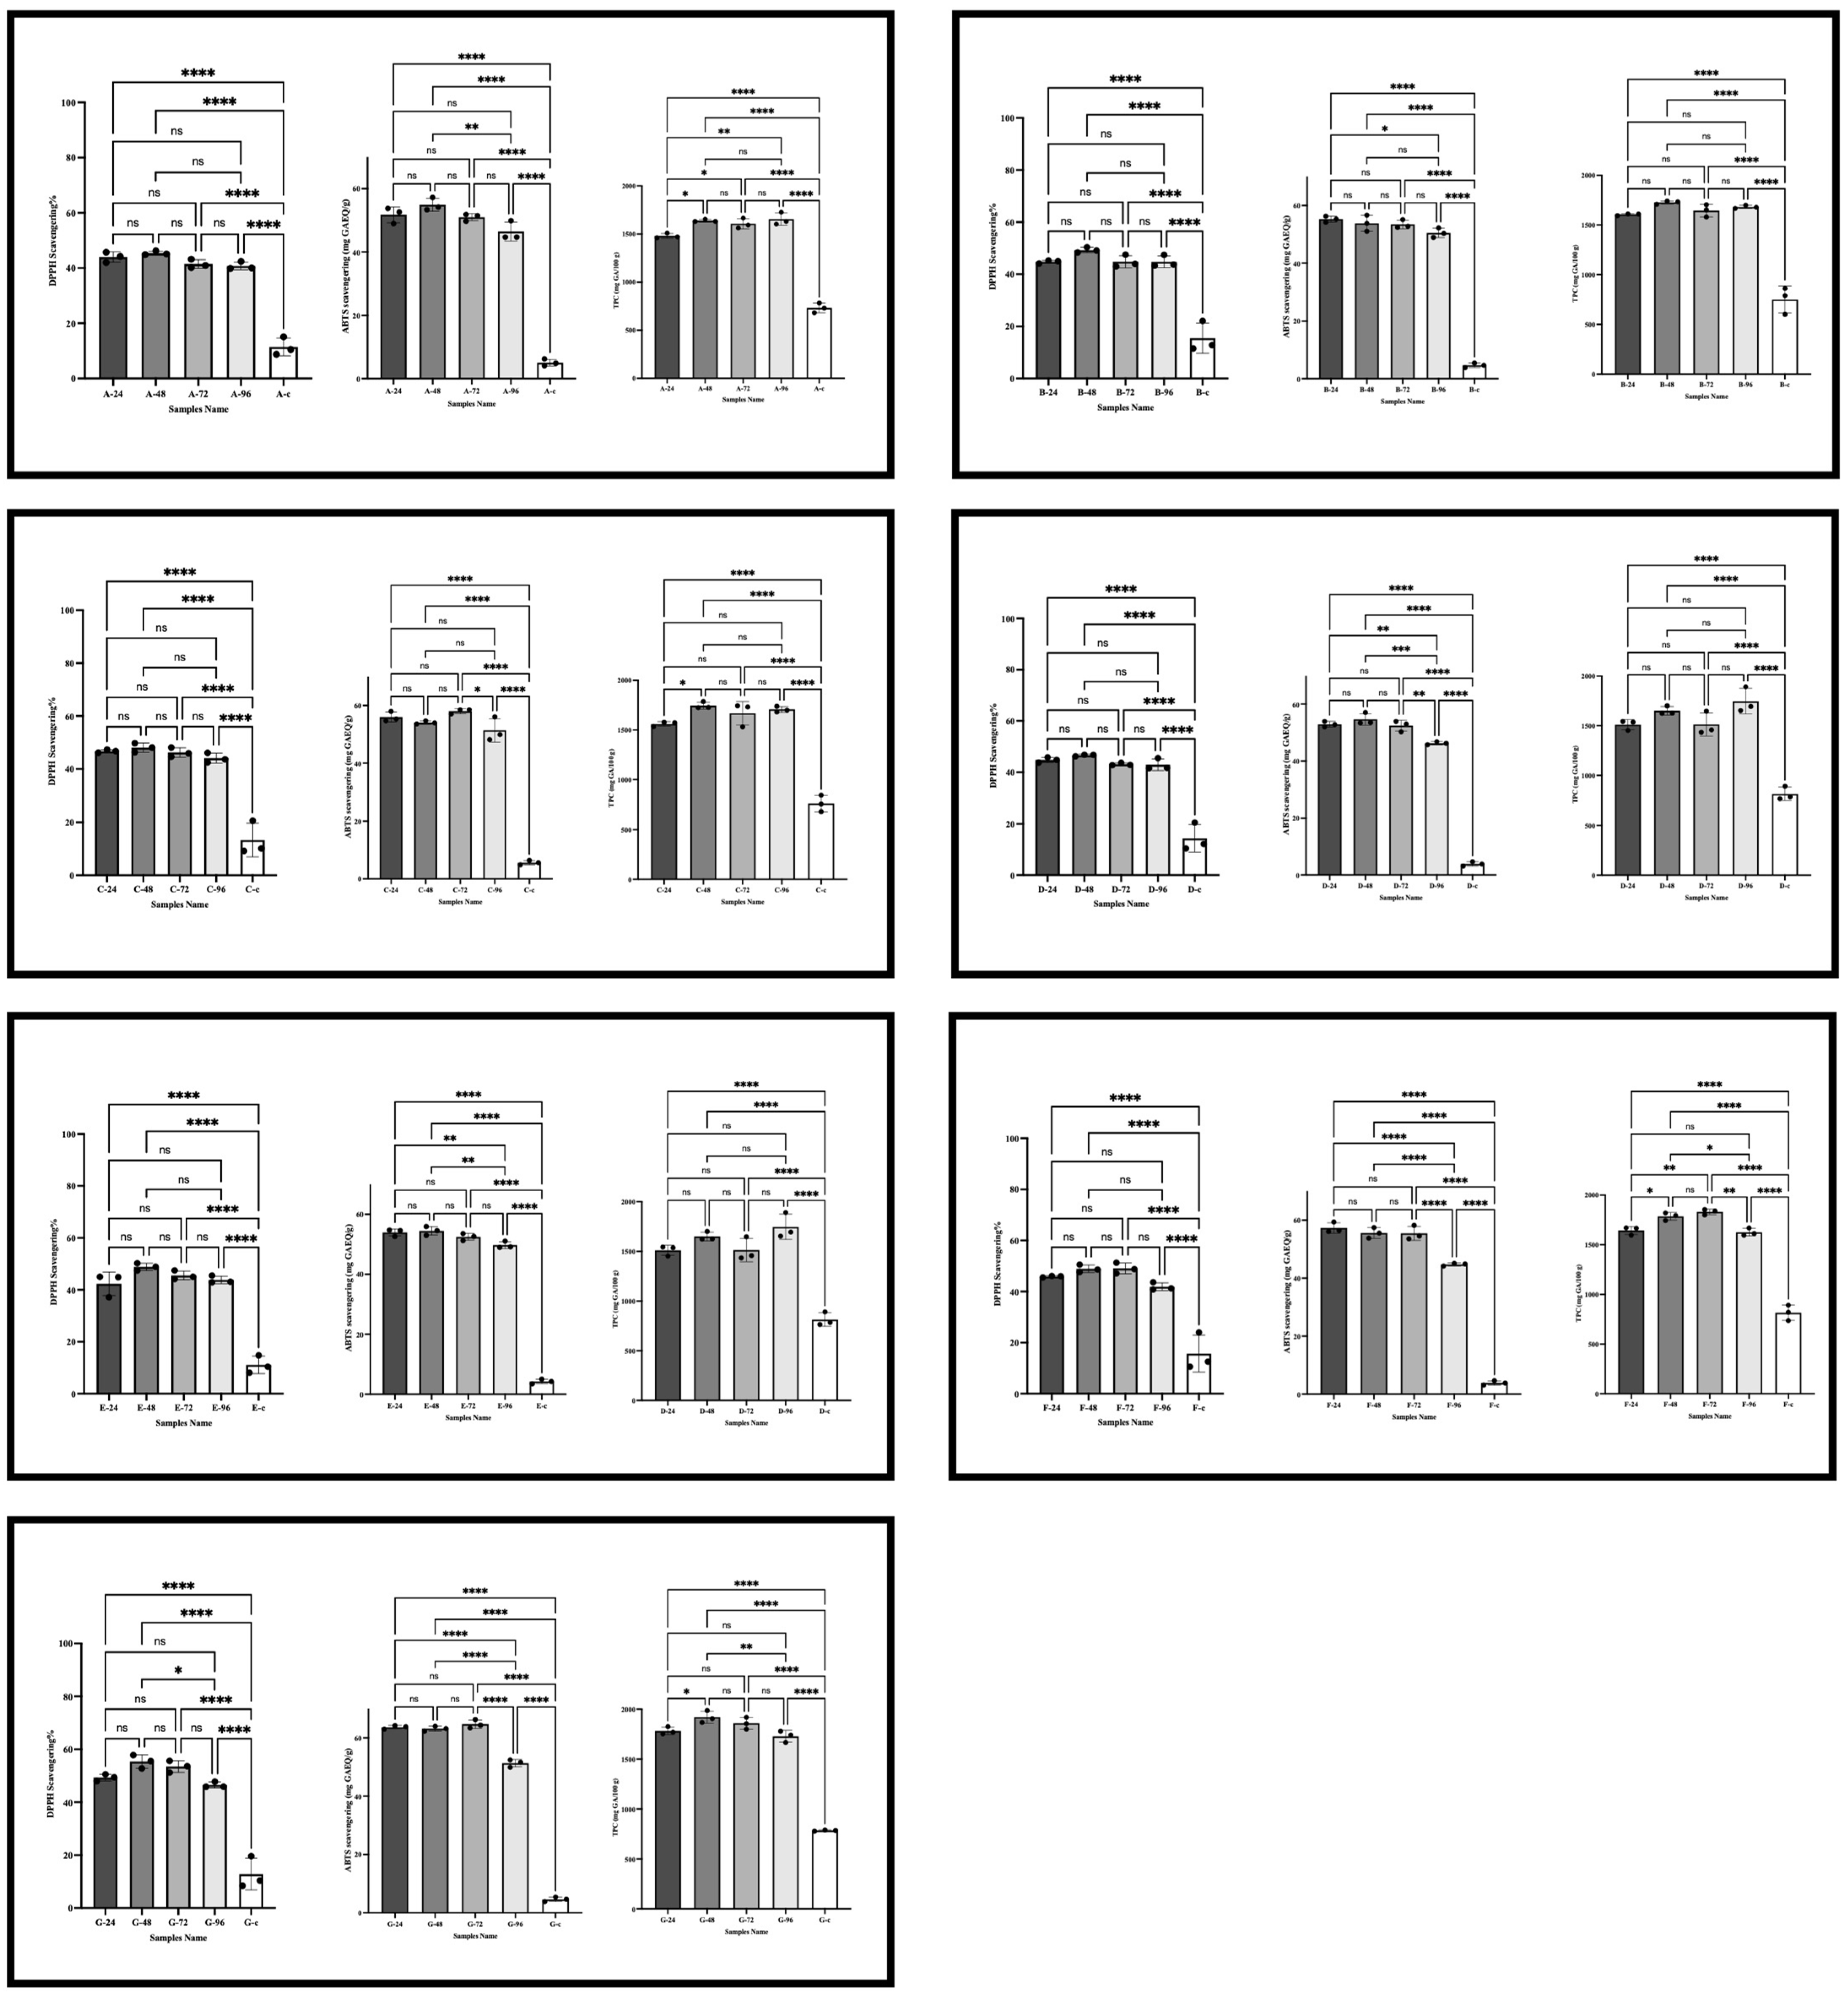
Increasing the number of LAB during fermentation can also increase the efficiency (%) of antioxidant properties and the TPC of extraction [38,45,46,47,48]. In our experiments, the TPC of fermented samples increased by two- to four-fold, depending on the fermentation conditions. Torres-León et al. reported that fermentation could increase antioxidant properties and the TPC by three-fold [49]. Our results show that the TPC increased moderately with an increase in moisture from a ratio of 4:1 to 10:1 (mL/g of seeds to water) (p < 0.05), with group G having the highest TPC with the highest volume of water. Regarding the fermentation time, 24 h fermentation showed lower TPCs in groups A, B, and C with the same water volume. However, as the water volume increased, so did the TPC. This result was consistent with the ABTS scavenging test. The samples with the highest water content fermented for 24, 48, and 72 h (G-24, G-48, and G-72) showed the highest TPCs. Among them, sample G-48 had the best average in terms of both the water volume and fermentation time (p < 0.05). According to scientific research, the release of bound phenolic compounds (or polyphenols) during fermentation can enhance the product’s antioxidant ability and health benefits [22,50,51], showcasing their critical role in scavenging free radicals [52]. These results are consistent with the DPPH and ABTS scavenging activities, showing a more than three-fold increase in antioxidant properties in the fermented samples compared with the control samples (p < 0.05), with group G showing the highest average radical scavenging potential after 48 h of fermentation. Rocchetti et al. and Hubert et al. also reported that the antioxidant properties and TPCs of fermented samples increased and peaked after 48 h of fermentation [53,54]. In our samples, the lowest ABTS scavenging ability among the four groups (A, B, C, and D) was observed after 24 h of fermentation, consistent with the TPC results. However, increasing the water volume up to 10 mL improved the activity of bacteria to produce TPC and showed ABTS scavenging ability. The overall DPPH scavenging ability of the samples was similar to the ABTS test (Figure 8). However, changes in the fermentation time among groups A–F (with the same water volume) did not show a significant difference in the DPPH scavenging percentage. In the G group, the 24, 48, and 72 h fermentations showed the highest DPPH scavenging ability, with the 48 h fermentation significantly differing from the 96 h fermentation, which showed the lowest ABTS and DPPH scavenging ability across all groups. Several factors could explain this phenomenon, including the binding of antioxidant compounds (e.g., TPC) with other constituents and their degradation by microbial enzymes [55]. Therefore, the moisture content and fermentation time are crucial factors influencing the quality, quantity, and antioxidant properties of products [53,56]. By optimizing the moisture and duration of basil seed fermentation, we could enhance their antioxidant properties and TPC. Antioxidant and polyphenolic compounds can improve the health benefits of seeds through various mechanisms, such as scavenging free radicals, complexing with pro-oxidants, and quenching singlet oxygen, thereby reducing their activity [7,33,57,58]. Vitamin B content is another secondary health metabolite that can also increase during fermentation [7,10,14]. Our results show that the niacin content increased with fermentation with the best fermentation times for the highest niacin content being 24 and then 48 h. Optimizing the fermentation conditions was crucial in increasing the niacin content (Figure 8c). Our results are consistent with those of Ngene et al. who reported that L. plantarum could increase the niacin content during fermentation [59].
Based on all results, basil seeds show the potential to improve health due to secondary metabolites like niacin and phenolic chemicals, which possess antioxidant qualities.

5. Conclusions

Our study found that fermenting basil seeds with L. plantarum significantly increased their total polyphenol content and enhanced their radical scavenging ability. Both moderate moisture and fermentation time were crucial factors in achieving a high antioxidant activity and bioactive compound effectiveness. Specifically, a higher moisture content during fermentation promoted TPC and antioxidant properties. A 48 h fermentation period resulted in the highest average TPC and scavenging radical ability among all the samples, while the highest niacin content was observed at 24 h of fermentation. These findings strongly suggest the potential for developing novel plant-based foods using fermented basil seeds. Fermentation could lead to the production of healthier products rich in phenolic compounds with a greater antioxidant capacity and niacin content, making them valuable as functional food additives.

Author Contributions

Conceptualization, S.J.; methodology, S.M.; formal analysis, S.M.; investigation, S.M.; resources, H.Y.; writing—review and editing, S.J.; visualization, H.Y., Z.E.M. and S.J.; supervision, S.H.R., H.Y. and S.J. All authors have read and agreed to the published version of the manuscript.

Funding

This research received no external funding.

Institutional Review Board Statement

Not applicable.

Informed Consent Statement

Not applicable.

Data Availability Statement

The original contributions presented in this study are included in this article. Further inquiries can be directed to the corresponding authors.

Acknowledgments

The authors are thankful for the support and resources from the USF Center for Microbiome Research, Microbiomes Institute, Center of Excellence for Aging and Brain Repair, Department of Neurosurgery and Brain Repair, along with the lab members from Yadav’s and Jain’s groups. The authors are grateful to the University of Tehran and the National Researchers and Technologists Support Fund for providing the equipment and facilities.

Conflicts of Interest

The authors declare no conflicts of interest regarding the data presented in this manuscript. Yadav is cofounder and Chief scientific officer of postbiotics Inc. He is also co-founder of BiomAge Inc. Yadav and Jain are cofounder of MusB LLC and MusB Research LLC but their roles have no conflict and influence with the work presented in this manuscript.

References

  1. Abdul Hakim, B.N.; Xuan, N.J.; Oslan, S.N.H. A Comprehensive Review of Bioactive Compounds from Lactic Acid Bacteria: Potential Functions as Functional Food in Dietetics and the Food Industry. Foods 2023, 12, 2850. [Google Scholar] [CrossRef] [PubMed]
  2. Gupta, S.; Lee, J.J.L.; Chen, W.N. Analysis of Improved Nutritional Composition of Potential Functional Food (Okara) after Probiotic Solid-State Fermentation. J. Agric. Food Chem. 2018, 66, 5373–5381. [Google Scholar] [CrossRef]
  3. Lee, J.H.; Yoon, Y.C.; Kim, J.K.; Park, Y.E.; Hwang, H.S.; Kwon, G.S.; Lee, J.B. Antioxidant and Whitening Effects of the Fermentation of Barley Seeds (Hordeum Vulgare L.) Using Lactic Acid Bacteria. J. Life 2018, 28, 444–453. [Google Scholar] [CrossRef]
  4. Thakur, P.; Kumar, K. Nutritional Importance and Processing Aspects of Pseudo-Cereals. J. Agric. Eng. Food Technol. 2019, 6, 155–160. [Google Scholar] [CrossRef]
  5. Ro, H.S.; Jang, H.J.; Kim, G.R.; Park, S.J.; Lee, H.Y. Enhancement of the Anti-Skin Wrinkling Effects of Aloe Arborescens Miller Extracts Associated with Lactic Acid Fermentation. Evid.-Based Complement. Altern. Med. 2020, 2020, 2743594. [Google Scholar] [CrossRef] [PubMed]
  6. El Mecherfi, K.E.; Todorov, S.D.; De Albuquerque, M.A.C.; Denery-Papini, S.; Lupi, R.; Haertlé, T.; De Melo Franco, B.D.G.; Larre, C. Allergenicity of Fermented Foods: Emphasis on Seeds Protein-Based Products. Foods 2020, 9, 792. [Google Scholar] [CrossRef]
  7. Rembe, J.-D.; Fromm-Dornieden, C.; Stuermer, E.K. Effects of Vitamin B Complex and Vitamin C on Human Skin Cells. Adv. Skin Wound Care 2018, 31, 225–233. [Google Scholar] [CrossRef]
  8. Shumao, C.; Zhexin, F. Lactic Acid Bacteria and Fermented Meat Products. In Lactic Acid Bacteria; Springer: Singapore, 2019; ISBN 978-981-13-7282-7. [Google Scholar]
  9. Kang, H.; Hwang, J.; Lee, S. Bacillus Subtilis Fermentation Augments the Anti-Inflammatory and Skin Moisture Improvement Activities of Tetragonia Tetragonoides through the Upregulation of Antioxidant Components. Fermentation 2023, 9, 800. [Google Scholar] [CrossRef]
  10. Laaksonen, O.; Kahala, M.; Marsol-Vall, A.; Blasco, L.; Järvenpää, E.; Rosenvald, S.; Virtanen, M.; Tarvainen, M.; Yang, B. Impact of Lactic Acid Fermentation on Sensory and Chemical Quality of Dairy Analogues Prepared from Lupine (Lupinus Angustifolius L.) Seeds. Food Chem. 2021, 346, 128852. [Google Scholar] [CrossRef]
  11. Ferreira, I.; de Sousa Melo, D.; Menezes, A.G.T.; Fonseca, H.C.; de Assis, B.B.T.; Ramos, C.L.; Magnani, M.; Dias, D.R.; Schwan, R.F. Evaluation of Potentially Probiotic Yeasts and Lactiplantibacillus Plantarum in Co-Culture for the Elaboration of a Functional Plant-Based Fermented Beverage. Food Res. Int. 2022, 160, 111697. [Google Scholar] [CrossRef]
  12. Hou, F.; Cai, Y.; Wang, J. Antioxidant Capacity Changes and Untargeted Metabolite Profile of Broccoli during Lactic Acid Bacteria Fermentation. Fermentation 2023, 9, 474. [Google Scholar] [CrossRef]
  13. Varnosfaderani, S.M.; Razavi, S.H.; Fadda, A.M. Germination and Fermentation of Soybeans: Two Healthy Steps to Release Angiotensin Converting Enzyme Inhibitory Activity Compounds. Appl. Food Biotechnol. 2019, 6, 201–215. [Google Scholar] [CrossRef]
  14. Hettwer, S.; Gyenge, E.B.; Suter, B.; Obermayer, B.; Hettwer, S.; Gyenge, E.B.; Suter, B.; Obermayer, B. Can Fermentation “Preserve” the Skin? Sofw 2021, 147, 24–28. [Google Scholar]
  15. Dong, X.; Ji, J.; Zhang, S.; Peng, D.; Wang, Y.; Zhang, L.; Li, J.; Wang, G. Study on a Low-Temperature Cellulose-Degrading Strain: Fermentation Optimization, Straw Degradation, and the Effect of Fermentation Broth on Seed Growth. Biotechnol. Bioprocess Eng. 2022, 27, 652–667. [Google Scholar] [CrossRef]
  16. Jeon, G.; Ro, H.; Kim, G.; Lee, H. Enhancement of Melanogenic Inhibitory Effects of the Leaf Skin Extracts of Aloe Barbadensis Miller by the Fermentation Process. Fermentation 2022, 8, 580. [Google Scholar] [CrossRef]
  17. Michalak, M.; Pierzak, M.; Kręcisz, B.; Suliga, E. Bioactive Compounds for Skin Health: A Review. Nutrients 2021, 13, 203. [Google Scholar] [CrossRef]
  18. Lee, S.; Eun, C.; Kwon, Y.; Baek, J.; Kim, I. Evaluation of Fermented Extracts of Aloe Vera Processing Byproducts as Potential Functional Ingredients. Fermentation 2021, 7, 269. [Google Scholar] [CrossRef]
  19. Abdel-Aty, A.M.; Barakat, A.Z.; Bassuiny, R.I.; Mohamed, S.A. Antioxidant-Polyphenols of Saw Palmetto Seeds: Statistical Optimized Production and Improved Functional Properties under Solid-State Fermentation by Trichoderma Reesei. J. Food Meas. Charact. 2023, 17, 1132–1143. [Google Scholar] [CrossRef]
  20. Iga-Buitron, D.; Torres-Maravilla, E.; Berm, L.G.; Ascacio-Valdes, J.A.; Aguilar, N.; Flores-Gallegos, A.C. Lactic Fermentation of Broccoli (Brassica Oleracea Var. Italica) to Enhance the Antioxidant and Antiproliferative Activities. Fermentation 2023, 9, 122. [Google Scholar] [CrossRef]
  21. Maleki, S.; Razavi, S.H. Pulses’ Germination and Fermentation: Two Bioprocessing against Hypertension by Releasing ACE Inhibitory Peptides. Crit. Rev. Food Sci. Nutr. 2021, 61, 2876–2893. [Google Scholar] [CrossRef]
  22. Majdinasab, M.; Niakousari, M.; Shaghaghian, S.; Dehghani, H. Antimicrobial and Antioxidant Coating Based on Basil Seed Gum Incorporated with Shirazi Thyme and Summer Savory Essential Oils Emulsions for Shelf-Life Extension of Refrigerated Chicken Fillets. Food Hydrocoll. 2020, 108, 106011. [Google Scholar] [CrossRef]
  23. Bartkiene, E.; Laurikietyte, R.; Lele, V.; Zavistanaviciute, P.; Mozuriene, E.; Baltusnikiene, A. Agar-Immobilized Basil–Lactic Acid Bacteria Bioproducts as Goat Milk Taste-Masking Agents and Natural Preservatives for the Production of Unripened Goat Cheese. J. Dairy Sci. 2018, 101, 10866–10876. [Google Scholar] [CrossRef] [PubMed]
  24. Ghasempour, Z.; Javanmard, N.; Mojaddar Langroodi, A.; Alizadeh-Sani, M.; Ehsani, A.; Moghaddas Kia, E. Development of Probiotic Yogurt Containing Red Beet Extract and Basil Seed Gum; Techno-Functional, Microbial and Sensorial Characterization. Biocatal. Agric. Biotechnol. 2020, 29, 101785. [Google Scholar] [CrossRef]
  25. Thanh Sang, V.; Phuong Uyen, L.; Dai Hung, N. The Increased Gamma-Aminobutyric Acid Content by Optimizing Fermentation Conditions of Bacteria from Kimchi and Investigation of Its Biological Activities. EurAsian J. Biosci. 2018, 12, 369–376. [Google Scholar]
  26. Calvo-Lerma, J.; Asensio-Grau, A.; García-Hernández, J.; Heredia, A.; Andrés, A. Exploring the Impact of Solid-State Fermentation on Macronutrient Profile and Digestibility in Chia (Salvia Hispanica) and Sesame (Sesamum Indicum) Seeds. Foods 2022, 11, 410. [Google Scholar] [CrossRef] [PubMed]
  27. Salar, R.K.; Purewal, S.S.; Bhatti, M.S. Optimization of Extraction Conditions and Enhancement of Phenolic Content and Antioxidant Activity of Pearl Millet Fermented with Aspergillus Awamori MTCC-548. Resour. Technol. 2016, 2, 148–157. [Google Scholar] [CrossRef]
  28. Haile, M.; Kang, W.H. Antioxidant Activity, Total Polyphenol, Flavonoid and Tannin Contents of Fermented Green Coffee Beans with Selected Yeasts. Fermentation 2019, 5, 29. [Google Scholar] [CrossRef]
  29. Silveira Coelho, M.; de Araujo Aquino, S.; Machado Latorres, J.; de las Mercedes Salas-Mellado, M. In Vitro and in Vivo Antioxidant Capacity of Chia Protein Hydrolysates and Peptides. Food Hydrocoll. 2019, 91, 19–25. [Google Scholar] [CrossRef]
  30. Hwang, S.; Lee, J. Comparison of Antioxidant Activities Expressed as Equivalents of Standard Antioxidant. Food Sci. Technol. 2023, 43, e121522. [Google Scholar] [CrossRef]
  31. Shirvani, A.; Goli, S.A.H.; Shahedi, M.; Soleimanian-Zad, S. Changes in Nutritional Value and Application of Thyme (Thymus Vulgaris) Essential Oil on Microbial and Organoleptic Markers of Persian Clover (Trifolium Resupinatum) Sprouts. LWT 2016, 67, 14–21. [Google Scholar] [CrossRef]
  32. Hämmerle, M.; Le, M.H.; Hekmat, O. GC-FID-Based Quantification of the Sum of the Three Forms of Vitamin B3 from Animal Liver. Anal. Biochem. 2020, 601, 113778. [Google Scholar] [CrossRef] [PubMed]
  33. Dhakal, R.; Bajpai, V.K.; Baek, K.H. Production of GABA (γ-Aminobutyric Acid) by Microorganisms: A Review. Braz. J. Microbiol. 2012, 43, 1230–1241. [Google Scholar] [CrossRef] [PubMed]
  34. Parekh, S.; Vinci, V.A.; Strobel, R.J. Improvement of Microbial Strains and Fermentation Processes. Appl. Microbiol. Biotechnol. 2000, 54, 287–301. [Google Scholar] [CrossRef] [PubMed]
  35. Ojewumi, M.E.; Omoleye, A.J.; Nyingifa, A.S. Biological and Chemical Changes during the Aerobic and Anaerobic Fermentation of African Locust Bean. Int. J. Chem. Stud. 2018, 2, 25–30. [Google Scholar] [CrossRef]
  36. Wu, Z.; Miao, W.; Yang, Y.; Fan, G.; Wu, C.; Li, T.; Xie, C.; Shen, D. Preparation of Monascus-Fermented Ginkgo Seeds: Optimization of Fermentation Parameters and Evaluation of Bioactivity. Food Sci. Biotechnol. 2022, 31, 721–730. [Google Scholar] [CrossRef]
  37. Jood, S.; Khetarpaul, N.; Goyal, R. Effect of Germination and Probiotic Fermentation on PH, Titratable Acidity, Dietary Fibre, β-Glucan and Vitamin Content of Sorghum Based Food Mixtures. J. Nutr. Food Sci. 2012, 2, 1000164. [Google Scholar] [CrossRef]
  38. Nizioł-Łukaszewska, Z.; Ziemlewska, A.; Bujak, T.; Zagórska-Dziok, M.; Zarębska, M.; Hordyjewicz-Baran, Z.; Wasilewski, T. Effect of Fermentation Time on Antioxidant and Anti-Ageing Properties of Green Coffee Kombucha Ferments. Molecules 2020, 25, 5394. [Google Scholar] [CrossRef]
  39. Mao, B.; Guo, W.; Chen, M.; Tang, X.; Zhang, Q.; Zhao, J.; Zhang, H.; Cui, S. Effects of Streptococcus Thermophilus Fermentation on the Flavors and Antioxidant Properties of Barley Juice. Fermentation 2023, 9, 623. [Google Scholar] [CrossRef]
  40. Maleki, S.; Razavi, S.H.; Yadav, H. Diabetes and Seeds: New Horizon to Promote Human Nutrition and Anti-Diabetics Compounds in Grains by Germination. Crit. Rev. Food Sci. Nutr. 2022, 63, 8457–8477. [Google Scholar] [CrossRef]
  41. Tangüler, H. The Effect of Using Different Size Purple Carrots and Lactobacillus Plantarum on the Properties of Fermented Shalgam (Şalgam). Turk. J. Agric. Food Sci. Technol. 2021, 9, 1759–1766. [Google Scholar] [CrossRef]
  42. Vatansever, S.; Vegi, A.; Garden-Robinson, J.; Hall, C.A., III. The Effect of Fermentation on the Physicochemical Characteristics of Dry-Salted Vegetables. J. Food Res. 2017, 6, 32. [Google Scholar] [CrossRef]
  43. Yuan, Y.; Peng, Y.; Liu, Y.; Jin, B.; Wang, B.; Wang, S. Change of PH during Excess Sludge Fermentation under Alkaline, Acidic and Neutral Conditions. Bioresour. Technol. 2014, 174, 1–5. [Google Scholar] [CrossRef]
  44. Marco, M.L.; Heeney, D.; Binda, S.; Cifelli, C.J.; Cotter, P.D.; Foligné, B.; Gänzle, M.; Kort, R.; Pasin, G.; Pihlanto, A.; et al. Health Benefits of Fermented Foods: Microbiota and Beyond. Curr. Opin. Biotechnol. 2017, 44, 94–102. [Google Scholar] [CrossRef] [PubMed]
  45. Budryn, G.; Klewicka, E.; Grzelczyk, J.; Gałązka-Czarnecka, I.; Mostowski, R. Lactic Acid Fermentation of Legume Seed Sprouts as a Method of Increasing the Content of Isoflavones and Reducing Microbial Contamination. Food Chem. 2019, 285, 478–484. [Google Scholar] [CrossRef] [PubMed]
  46. Hu, Y.; Ge, C.; Yuan, W.; Zhu, R.; Zhang, W.; Du, L.; Xue, J. Characterization of Fermented Black Soybean Natto Inoculated with Bacillus Natto during Fermentation. J. Sci. Food Agric. 2010, 90, 1194–1202. [Google Scholar] [CrossRef] [PubMed]
  47. Landete, J.M.; Hernández, T.; Robredo, S.; Dueñas, M.; De Las Rivas, B.; Estrella, I.; Muñoz, R. Effect of Soaking and Fermentation on Content of Phenolic Compounds of Soybean (Glycine Max Cv. Merit) and Mung Beans (Vigna Radiata [L] Wilczek). Int. J. Food Sci. Nutr. 2015, 66, 203–209. [Google Scholar] [CrossRef]
  48. Joshi, D.; Roy, S.; Banerjee, S. Prebiotics: A Functional Food in Health and Disease; Elsevier: Amsterdam, The Netherlands, 2018; ISBN 9780081021040. [Google Scholar]
  49. Torres-León, C.; Ramírez-Guzmán, N.; Ascacio-Valdés, J.; Serna-Cock, L.; dos Santos Correia, M.T.; Contreras-Esquivel, J.C.; Aguilar, C.N. Solid-State Fermentation with Aspergillus Niger to Enhance the Phenolic Contents and Antioxidative Activity of Mexican Mango Seed: A Promising Source of Natural Antioxidants. LWT 2019, 112, 108236. [Google Scholar] [CrossRef]
  50. Melini, F.; Melini, V. Impact of Fermentation on Phenolic Compounds and Antioxidant Capacity of Quinoa. Fermentation 2021, 7, 20. [Google Scholar] [CrossRef]
  51. Aung, T.; Park, S.; Kim, M. Influence of Lactobacillus (LAB) Fermentation on the Enhancement of Branched Chain Amino Acids and Antioxidant Properties in Bran among Wheat By-Products. Fermentation 2022, 8, 732. [Google Scholar] [CrossRef]
  52. Chaubey, P.S.; Somani, G.; Kanchan, D.; Sathaye, S.; Varakumar, S.; Singhal, R.S. Evaluation of Debittered and Germinated Fenugreek (Trigonella Foenum Graecum L.) Seed Flour on the Chemical Characteristics, Biological Activities, and Sensory Profile of Fortified Bread. J. Food Process. Preserv. 2018, 42, e13395. [Google Scholar] [CrossRef]
  53. Hubert, J.; Berger, M.; Nepveu, F.; Paul, F.; Daydé, J. Effects of Fermentation on the Phytochemical Composition and Antioxidant Properties of Soy Germ. Food Chem. 2008, 109, 709–721. [Google Scholar] [CrossRef] [PubMed]
  54. Rocchetti, G.; Miragoli, F.; Zacconi, C.; Lucini, L.; Rebecchi, A. Impact of Cooking and Fermentation by Lactic Acid Bacteria on Phenolic Profile of Quinoa and Buckwheat Seeds. Food Res. Int. 2019, 119, 886–894. [Google Scholar] [CrossRef]
  55. Adebo, O.A.; Medina-Meza, I.G. Impact of Fermentation on the Phenolic Compounds and Antioxidant Activity of Whole Cereal Grains: A Mini Review. Molecules 2020, 25, 927. [Google Scholar] [CrossRef]
  56. Yan, Y.; Li, X.; Guan, H.; Huang, L.; Ma, X.; Peng, Y.; Li, Z.; Nie, G.; Zhou, J.; Yang, W.; et al. Microbial Community and Fermentation Characteristic of Italian Ryegrass Silage Prepared with Corn Stover and Lactic Acid Bacteria. Bioresour. Technol. 2019, 279, 166–173. [Google Scholar] [CrossRef] [PubMed]
  57. Maleki, S.; Razavi, S.H.; Yadav, H.; Letizia Manca, M. New Horizon to the World of Gut Microbiome: Seeds Germination. Crit. Rev. Food Sci. Nutr. 2024, 1–19. [Google Scholar] [CrossRef] [PubMed]
  58. Sanjukta, S.; Rai, A.K.; Muhammed, A.; Jeyaram, K.; Talukdar, N.C. Enhancement of Antioxidant Properties of Two Soybean Varieties of Sikkim Himalayan Region by Proteolytic Bacillus Subtilis Fermentation. J. Funct. Foods 2015, 14, 650–658. [Google Scholar] [CrossRef]
  59. Ngene, A.C.; Onwuakor, C.E.; Aguiyi, J.C.; Ifeanyi, V.O.; Ohaegbu, C.G.; Okwuchukwu, C.P.; Kim, E.G.; Egbere, J.O. Screening of Some Lactic Acid Bacteria Isolated from Selected Nigerian Fermented Foods for Vitamin Production. Adv. Microbiol. 2019, 9, 943–955. [Google Scholar] [CrossRef]
Figure 1. The procedure for the preparation of fermented basil samples.
Fermentation 10 00467 g001
Figure 2. (a) Total microbial counts (TMCs) of basil seeds under different fermentation moisture and temperature conditions, (b) pH values of basil seeds under different fermentation moisture and temperature conditions. Basil samples with different ratios of basil powder (g) to water (mL) are shown as A (1:4), B (1:5), C (1:6), D (1:7), E (1:8), F (1:9), and G (1:10). They were fermented for various incubation times (24 h, 48 h, 72 h, and 96 h). The aliphatic characteristics show the ratios of basil powder (g)–water (mL), and the numbers indicate the fermentation times (h).
Fermentation 10 00467 g002
Figure 3. DPPH scavenging assay (%) of fermented and unfermented basil samples. Basil samples with different ratios of basil powder (g) to water (mL) are shown as A (1:4), B (1:5), C, (1:6) D (1:7), E (1:8), F (1:9), and G (1:10). They were fermented for various incubation times (24 h, 48 h, 72 h, and 96 h). The aliphatic characteristics show the ratios of basil powder (g)–water (mL), and the numbers indicate the fermentation times (h).
Fermentation 10 00467 g003
Figure 4. (a,b) The average of fermented basil samples for DPPH, (c,d) The average of fermented basil samples for ABTS radical scavenging ability, (e,f) The average of fermented basil samples for TPC. (a,c,e) represent the average of fermented basil samples with different ratios of basil powder (g) to water (mL) (A (1:4), B (1:5), C (1:6), D (1:7), E (1:8), F (1:9), and G (1:10)). (b,d,f) represent the average of different fermentation times (24 h, 48 h, 72 h, and 96 h). The aliphatic characteristics show the ratios of basil powder (g)–water (mL), and the numbers indicate the fermentation times (h).
Fermentation 10 00467 g004
Figure 5. (a) shows the standard curve of gallic acid to assay ABTS radical scavenging ability. (b) shows the ABTS radical scavenging of different basil samples during different fermentation times. Basil samples with different ratios of basil powder (g) to water (mL) are shown as A (1:4), B (1:5), C (1:6), D (1:7), E (1:8), F (1:9), and G (1:10). They were fermented for different durations (24 h, 48 h, 72 h, and 96 h). The aliphatic characteristics show the ratios of basil powder (g)–water (mL), and the numbers indicate the fermentation times (h).
Fermentation 10 00467 g005
Figure 6. (a) shows the standard curve of gallic acid to measure the total polyphenol concentration (TPC). (b) shows the total polyphenol concentrations of all fermented and unfermented basil samples. Basil samples with different ratios of basil powder (g) to water (mL) are shown as A (1:4), B (1:5), C (1:6), D (1:7), E (1:8), F (1:9), and G (1:10). They were fermented for different durations (24 h, 48 h, 72 h, and 96 h). The aliphatic characteristics show the ratios of basil powder (g)–water (mL), and the numbers indicate the fermentation times (h).
Fermentation 10 00467 g006
Figure 7. (a,b) show the niacin standard curves in the range of 0.5 µg/mL (A), 1 µg/mL (B), 10 µg/mL (C), and 100 µg/mL (D). (c) shows the results of niacin content in fermented basil and control basil measured by gas chromatography. Fermented basil samples with a ratio of 1 g of basil powder mixed with 10 mL of water, fermented for 24 h, 48 h, and 72 h, are shown as A, B, and C, respectively. “D” is the unfermented basil sample serving as the control.
Fermentation 10 00467 g007
Figure 8. Total polyphenol concentration (TPC), DPPH, and scavenging radical ability of different groups of basil samples with the same water volume in each group. Basil samples with different ratios of basil powder (g) to water (mL) are shown as A (1:4), B (1:5), C (1:6), D (1:7), E (1:8), F (1:9), and G (1:10). They were fermented for different durations (24 h, 48 h, 72 h, and 96 h). The aliphatic characteristics show the ratios of basil powder (g)–water (mL), and the numbers indicate the fermentation times (hr). Data are expressed as means ± SD; n = 3. The stars are used to indicate levels of significance at four recognized thresholds. A p-value of less than 0.05 = *, less than 0.01 = **, less than 0.001 = ***, and less than 0.0001 = ****.
Fermentation 10 00467 g008
Table 1. Description of fermented and unfermented basil samples. The aliphatic characteristics indicate the ratio of basil powder (g) to water (mL), and the numbers determine fermentation time (h).
Name of Samples Based on Ratio of Basil Powder (g)–Water (mL)Fermentation Time (h)All Samples’ Abbreviations
A: adding 1 g of basil powder to 4 mL of water
0: without fermentation (control)


24: 24 h fermentation


48: 48 h fermentation


72: 72 h fermentation


96: 96 h fermentation
A-0A-24A-48A-72A-96
B: adding 1 g of basil powder to 5 mL of water
B-0B-24B-48B-72B-96
C: adding 1 g of basil powder to 6 mL of water
C-0C-24C-48C-72C-96
D: adding 1 g of basil powder to 7 mL of water
D-0D-24D-48D-72D-96
E: adding 1 g of basil powder to 8 mL of water
E-0E-24E-48E-72E-96
F: adding 1 g of basil powder to 9 mL of water
F-0F-24F-48F-72F-96
G: adding 1 g of basil powder to 10 mL of waterG-0G-24G-48G-72G-96
Table 2. Percentages of unfermented basil seed samples’ moisture contents.
SamplesMoisture%
A79 ± 0.3
B84 ± 0.3
C86 ± 0.7
D88 ± 0.3
E89 ± 0.60
F90 ± 0.6
G91 ± 0.4
Table 3. Changes in pH and TMC during different fermentation times (hours).
Sample/Time024 h48 h72 h96 h
pHTMC 1pHTMC 1pHTMC 1pHTMC 1pHTMC 1
A6.05 a ± 0.078.92 ± 0.855.19 b ± 0.0311.98 ± 0.815.22 b ± 0.1311.99 ± 0.115.24 b ± 0.0112.20 ± 0.0585.24 b ± 0.0812.89 ± 0.55
B6.23 a ± 0.168.92 ± 0.855.22 b ± 0.0711.79 ± 0.915.22 b ± 0.0211.82 ± 0.035.21 b ± 0.2512.00 ± 0.125.22 b ± 0. 4212.48 ± 0.70
C6.21 a ± 0.048.92 ± 0.855.12 b ± 0.0411.61 ± 1.045.14 b ± 0.0211.80 ± 0.325.19 b ± 0.0112.44 ± 0.145.20 b ± 0.21812.62± 0.61
D6.27 a ± 0.058.92 ± 0.855.16 b ± 0.0211.75 ± 2.045.17 b ± 0.0111.90 ± 0.215.18 b ± 0.0612.12 ± 0.255.19 b ± 0.1112.24± 0.16
E6.24 a ± 0.018.92± 0.855.11 b ± 0.0412.26 ± 1.055.12 b ± 0.0112.25 ± 0.335.13 b ± 0.0212.40 ± 0.335.22 b ± 0.2712.72 ± 0.761
F6.31 a ± 0.028.92 ± 0.855.17 b ± 0.0512.38 ± 0.795.18 b ± 0.0612.46 ± 0.335.19 b ± 0.0112.70 ± 0.44 5.22 b ± 0.1113.15 ± 0.84
G6.29 a ± 0.038.92 ± 0.855.17 b ± 0.0112.73 ± 0.955.22 b ± 0.0412.48 ± 0.125.16 b ± 0.0712.50 ± 0.835.26 b ± 0.1212.48 ± 0.82
1 TMC unit is cfu/mL. The differences between the two groups are illustrated as letters (a) and (b). Samples with no letters are not significantly different.
Disclaimer/Publisher’s Note: The statements, opinions and data contained in all publications are solely those of the individual author(s) and contributor(s) and not of MDPI and/or the editor(s). MDPI and/or the editor(s) disclaim responsibility for any injury to people or property resulting from any ideas, methods, instructions or products referred to in the content.