1. Introduction
The fibrinolytic kinase is a kind of thrombolytic kinase enzyme extracted from a nereid worm (
Perinereis aibuhitensis Grub), which belongs to the field of biopharmaceutical technology [
1]. Its molecular weight is between 25,000 Da and 55,000 Da, and its isoelectric point is between three and seven [
2,
3]. Currently, there is few relevant research focusing on fibrinolytic kinase in international settings, with limited publications available in China. The specific methods of separation and purification of this enzyme can be found in the papers of Ting, W [
4]. Nereid fibrinolytic kinase has excellent kinase activity, not less than that of urokinase. It can activate plasminogen, which degrades fibrin by indirect means. This mechanism of action gives fibrinolytic kinase a significant advantage in thrombolytic therapy. Nereid fibrinolytic kinase has good thermal and pH stability. Nereid kinase can maintain a higher activity at 37 °C, and even after one hour of treatment at 60 °C, its activity can still maintain more than 90% [
5,
6]. This excellent stability makes it possible to be used as a new thrombolytic drug suitable for oral administration, instead of intravenous injection as in the case of urokinase. Nereid fibrinolytic kinase is also highly specific and can efficiently hydrolyze the α-chain of plasminogen. This property enhances its effectiveness in the treatment of thrombotic diseases [
7]. From the application point of view, nereid fibrinolytic kinase can be used in the production of oral drugs for the treatment of thrombotic diseases caused by cerebral thrombosis, myocardial infarction, and other thrombotic diseases. With its abundant source of raw materials and low price, it is expected to become a regular therapeutic drug. In this experiment, recombinant
E. coli with fibrinolytic kinase DNA (GenBank No.: AHZ01188.1) was used in the laboratory to study the optimal fermentation conditions [
8,
9] to produce fibrinolytic kinase.
Single-factor, PB (Plackett–Burman design), and response surface experiments are commonly used in process optimization. Single-factor experimentation is simple and straightforward; it focuses on the effect of a single variable on the process result and observes the result change by fixing the other factors and changing the level of only one factor [
10]. This method can quickly determine the best value range of a factor, but it cannot take into account the interaction between factors [
11,
12]. PB experimentation is an efficient screening method, which is used to quickly identify the key influencing factors from many factors. It quickly assesses the contribution of each factor to the result by constructing a specific experimental matrix so that each factor is tested at both high and low levels [
13]. PB experiments are suitable for the initial screening stage and guide subsequent in-depth studies [
14,
15]. Response surface design is a more systematic and comprehensive optimization method. It carries out experiments by selecting different combinations of multiple factors in the experiment space and uses experimental data to build a mathematical model to describe the relationship between factors and results [
16]. By analyzing the model, the optimal process conditions can be determined and the interaction between the factors can be evaluated. In practical applications, these three methods are often combined [
17,
18].
In this study, by precisely controlling the change in each variable [
19], the changing trend of protein yield under different conditions could be observed, and the influence degree and rule of each parameter on protein yield could be preliminarily determined [
20,
21,
22]. The outcomes of these single-factor experiments have not only furnished us with crucial experimental data but also established a strong basis for the following PB experiments to identify the primary effector factors affecting protein quantity [
23,
24,
25]. Therefore, this study proposed identifying the main effect factors in the response surface design.
2. Materials and Methods
2.1. Raw Materials and Reagents
Yeast powder (OXOID, item No. LP0021B, Basingstoke, UK), tryptone (OXOID, item No. LP0042), kanamycin sulfate (Shenggong Biotechnology, item No. A600286-0025, Shanghai, China), IPTG (Beyotime, item No. ST1416, Shanghai, China), Tris (Shenggong Biotechnology, item No. A100826-0500, Shanghai, China), Tris-HCL (Shenggong Biotechnology, item No. A610103-0250), dipotassium hydrogen phosphate (Shanghai Titan, item No. G82678E, Shanghai, China), potassium dihydrogen phosphate (Shanghai Titan, item No. G82821A), glycerin (Shanghai Titan, item No. 01271856, Shanghai, China), colored pre-stained protein marker (Tanon, item No. 180-6006), Caulmers Brilliant Blue G250 (Sangong, item No. A100615-0005, Shanghai, China), anhydrous ethanol (Nanjing Reagent, Article No. C06901555010, Nanjing, China), glacial acetic acid (Jinke Chemical, item No. 02030074, Shaoxing, China), isopropyl alcohol (AMRESCO, item No. 67-63-0, Framingham, MA, USA), plasminogen (Shanghai Kuan-Dong Biological, Shanghai, China), urokinase (Shanghai Guandong Bio, UPA005, Shanghai, China), TEV protease (Novozymes, no. JE1006-01, Hong Kong, China), and fibrin analogues (AAT Bioquest, No. 13201, Guangzhou, China) were used in this study.
2.2. Media, Growth Conditions, and Chemicals
Seed (LB) medium was prepared by using 10 g/L of tryptone, 5 g/L of yeast powder, 10 g/L of sodium chloride, 50 μg/mL of kanamycin final concentration, and 50 mL/250 mL of liquid filling. The culture conditions were as follows: the glycerin tube strains were inoculated by a constant temperature incubator (Shanghai Yiheng Scientific Research Equipment, Shanghai, China, model DHP-9272) into the seed medium at 1% inoculation rate, 37 °C, and oscillated at 250 rpm to OD600 1.5 detected by ultraviolet spectrophotometer (Shanghai Yuan analysis instrument, Shanghai, China, model V-5000) for later use.
Fermentation (TB) medium was prepared by mixing 12 g/L of peptone, 24 g/L of yeast powder, 2.31 g/L of potassium dihydrogen phosphate, 12.54 g/L of dipotassium hydrogen phosphate, 4 g/L of glycerin, 50 μg/mL of kanamycin final concentration, and 50 mL/250 mL of liquid capacity. The culture conditions were as follows: The seed solution was inoculated at a pH value of 7.0, and the inoculated amount was 5% and oscillated at a rate of 220 rpm at 37 °C to OD600 1.5. Then, on this basis, IPTG was added, the final concentration was adjusted to 0.2 mM and oscillated at a rate of 220 rpm for 16 h at 25 °C.
E. coli strain was prepared in the marine biopharmaceutical group of Shanghai Ocean University (plasmid: pET28a(+)(Takara), expression host: BL21*(DE3) (Takara)). A solution of E. coli was prepared by impaling E. coli with a toothpick, which was then submerged in LB liquid medium and left to incubate for 16 h at 37 °C. To create a Caulmers Brilliant Blue R250 dye solution, 1 g of Caulmers Brilliant Blue R250 was combined with 650 mL of water, 250 mL of isopropyl alcohol, and 100 mL of glacial acetic acid. One liter of decolorizing solution was made by mixing 850 mL of water, 50 mL of ethanol, and 100 mL of glacial acetic acid. For the urokinase standard solution, urokinase was dissolved in 1.0 mL of sterile deionized water to achieve a concentration of approximately 10,000 U/mL. The mixture was gently shaken to ensure homogenization and prevent air bubbles. After standing at room temperature (18–25 °C) for at least 15 min, the solution was well shaken and then diluted with a specific buffer to the desired working concentration.
2.3. Method
2.3.1. To Investigate the Effect of Condition on Protein Amount
Single Factor: In single-factor experimental design, a single factor is controlled to vary at different levels, and the other factors are held constant. In total, 50 mL of liquid medium and 2.5 mL
E. coli solution are added to a sterile 250 mL flask on an ultra-clean workbench, inoculated with the bacterial solution. Design parameters are detailed in
Table 1.
PB Experiment: Find the best level point of each factor from the single factor and use the level of the best point as 0, the level before the best point as −1, and the level after the best point as 1 to design the PB experiment. The statistical software JMP, widely recognized in the industry, was used to design the PB experiment with 6 factors at 2 levels (
Table 2), in order to find the main effect factor.
Response Surface Experiment: The response surface experiment with 3 factors at 2 levels (
Table 3) is designed according to the main effect factors screened by PB experiment, and the best combination points were found in each main effect to maximize the yield. JMP (Pro 16) software is also used to analyze the response surface experiment’s results.
2.3.2. Determination of Protein Quantity
Following the completion of fermentation, the fermentation liquid was moved to a 50 mL centrifuge tube and then centrifuged at 12,000 rpm for 20 min. The bacteria were then weighed, with 0.5 g of bacteria subsequently added to 50 mL of 20 mM Tris-HCL pH 8.0 for suspension. The mixture was then crushed by 800–900 homogenates in a high-voltage homogenizer (Antosi Nanotech, AH-MINI, Suzhou, China) at 4 °C for 3 cycles. The supernatant was collected by centrifugation of the homogenate at 12,000 rpm for 5 min using a floor-type high-speed refrigerated centrifuge (Hunan Kecheng instrument machinery and equipment, specifications H6-10KR, Changsha, China). The protein quantity of the supernatant was determined by SDS-PAGE and grayscale scanning.
Loading and Electrophoresis: Following the addition of 10 μL of the previously obtained supernatant to the loading sample wells using a pipette (Eppendorf, 2~20 µL, Shanghai, China) in precast discontinuous gradient polyacrylamide gels (GenScript SurePAGE, Cat# M00655, Nanjing, China), electrophoresis was carried out at 160 V for 50 min in an electrophoresis apparatus (Tanon, Cat#EPS-300, Zhangjiakou, China).
Dyeing and Decolorization: After the electrophoresis process, a staining box was filled with tap water, and the gel was gently transferred into the water using a rubber block. Once the water was poured out, the staining solution was added, and the gel block was submerged. The block was then oscillated at 60 rpm on a flat plate oscillator for 60 min. Subsequently, the staining solution was removed, and the destaining solution was added. The gel block was oscillated at 60 rpm on a flat plate oscillator, with the destaining solution being changed every hour until the destaining process was complete. Following destaining, the gel images were analyzed using a gel imager.
Imaging and Analysis: The gel was positioned in the designated location of the imager (Tanon, Cat#1600, Zhangjiakou, China), and the imaging software AllDoc_x 6 was utilized for analysis. The essential parameters for image analysis are saved and detailed in
Table 4.
2.3.3. Fibrinolytic Kinase Enzyme Activity Test
Fibrinolytic kinase enzyme activity formulations are utilized to assess the activation of plasminogen by testing the enzyme activity of the kinase as outlined in
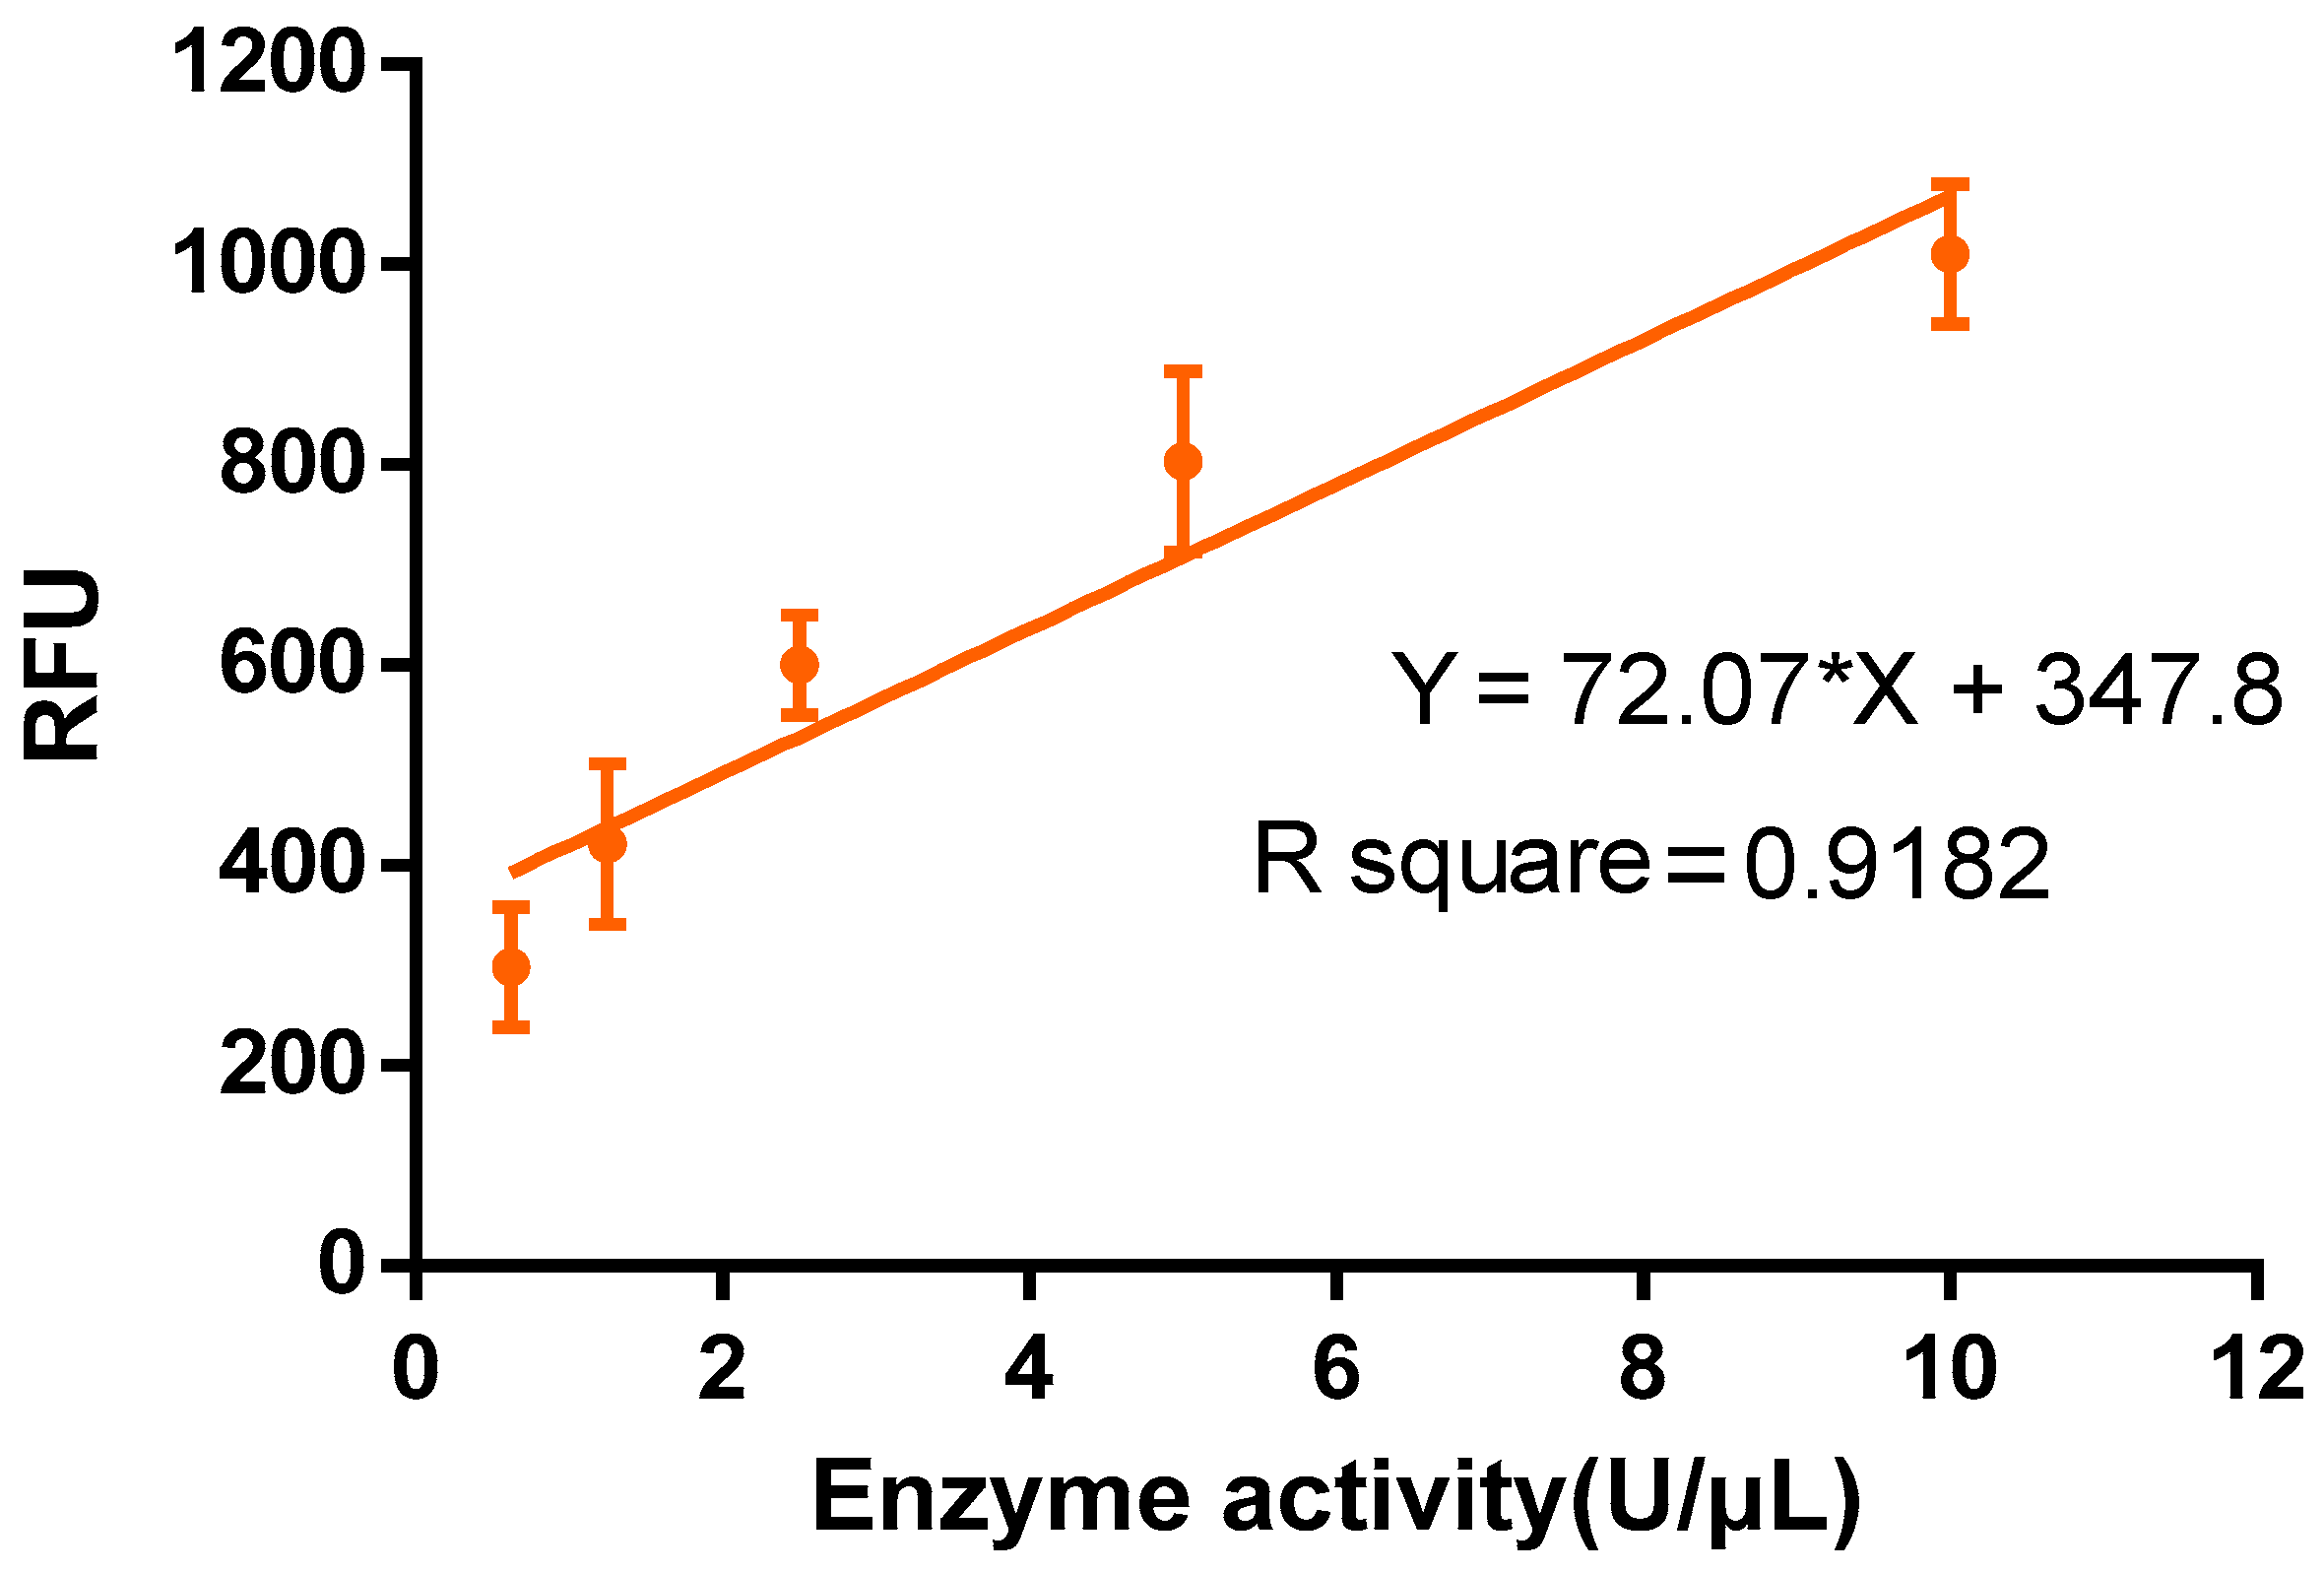
Table 5. To conduct the test, a 96-well enzyme labeling plate is taken, and 2 μL of plasminogen, 2 μL of fibrin analogues, and 96 μL of assay buffer are added to each well. Subsequently, 1 μL of the sample to be tested is added to the system, which is then placed into the Varioskan LUX Functional Labeling Instrument (thermos, Cat# 3020, Shanghai, China) immediately. The fluorescence is measured at 37 °C at 1 min intervals for 30 min (Ex/Em = 360/450 nm). The fluorescence value at 30 min is recorded, and the fibrinolytic kinase activity (U/μL) is determined using the standard curve (
Figure 1) and fluorescence value. If the concentration of the sample protein is known, the specific activity of fibrinolytic kinase (U/mg) can also be calculated.
2.4. Statistical Analysis
All the experiments were conducted with triplicate samples, and a concordant value was obtained from these experiments. The values were expressed as means ± SD unless otherwise indicated. The statistical difference and comparisons were made using one-way ANOVA analysis, and a p-value less than 0.05 was noted as statistically significant after treating the data in GraphPad Prism 9.4.0 and JMP 16 software.
4. Discussion
The present study precisely measured fibrinolytic kinase activity based on the activation of fibrinogen through fibrinolytic kinase and urokinase, which in turn produces fibrinolytic enzymes. Fibrinolytic kinase serves as a crucial biological enzyme capable of hydrolyzing and synthesizing fibrinolytic substrates. During this process, it generates the fluorophore AMC (7-amino-4-methylcoumarin), a fluorescent compound that enables quantitative detection through a specific fluorescent enzyme marker. To enhance the precision and dependability of our experimental findings, a standard curve representing urokinase enzyme activity was constructed. This curve is derived from a range of urokinase samples with established enzyme activity levels. By measuring the AMC released from these samples under consistent conditions, the relationship between enzyme activity and AMC release was illustrated. Utilizing this standard curve allows one to indirectly assess the enzyme activity level of fibrinolytic kinase by evaluating the amount of AMC released from an unknown sample.
After conducting numerous multi-dimensional experiments, the crucial factors influencing
E. coli fermentation of fibrinolytic kinase were extensively investigated [
26,
27,
28]. These factors primarily include inoculum amount, pH, OD, temperature, and others [
29,
30,
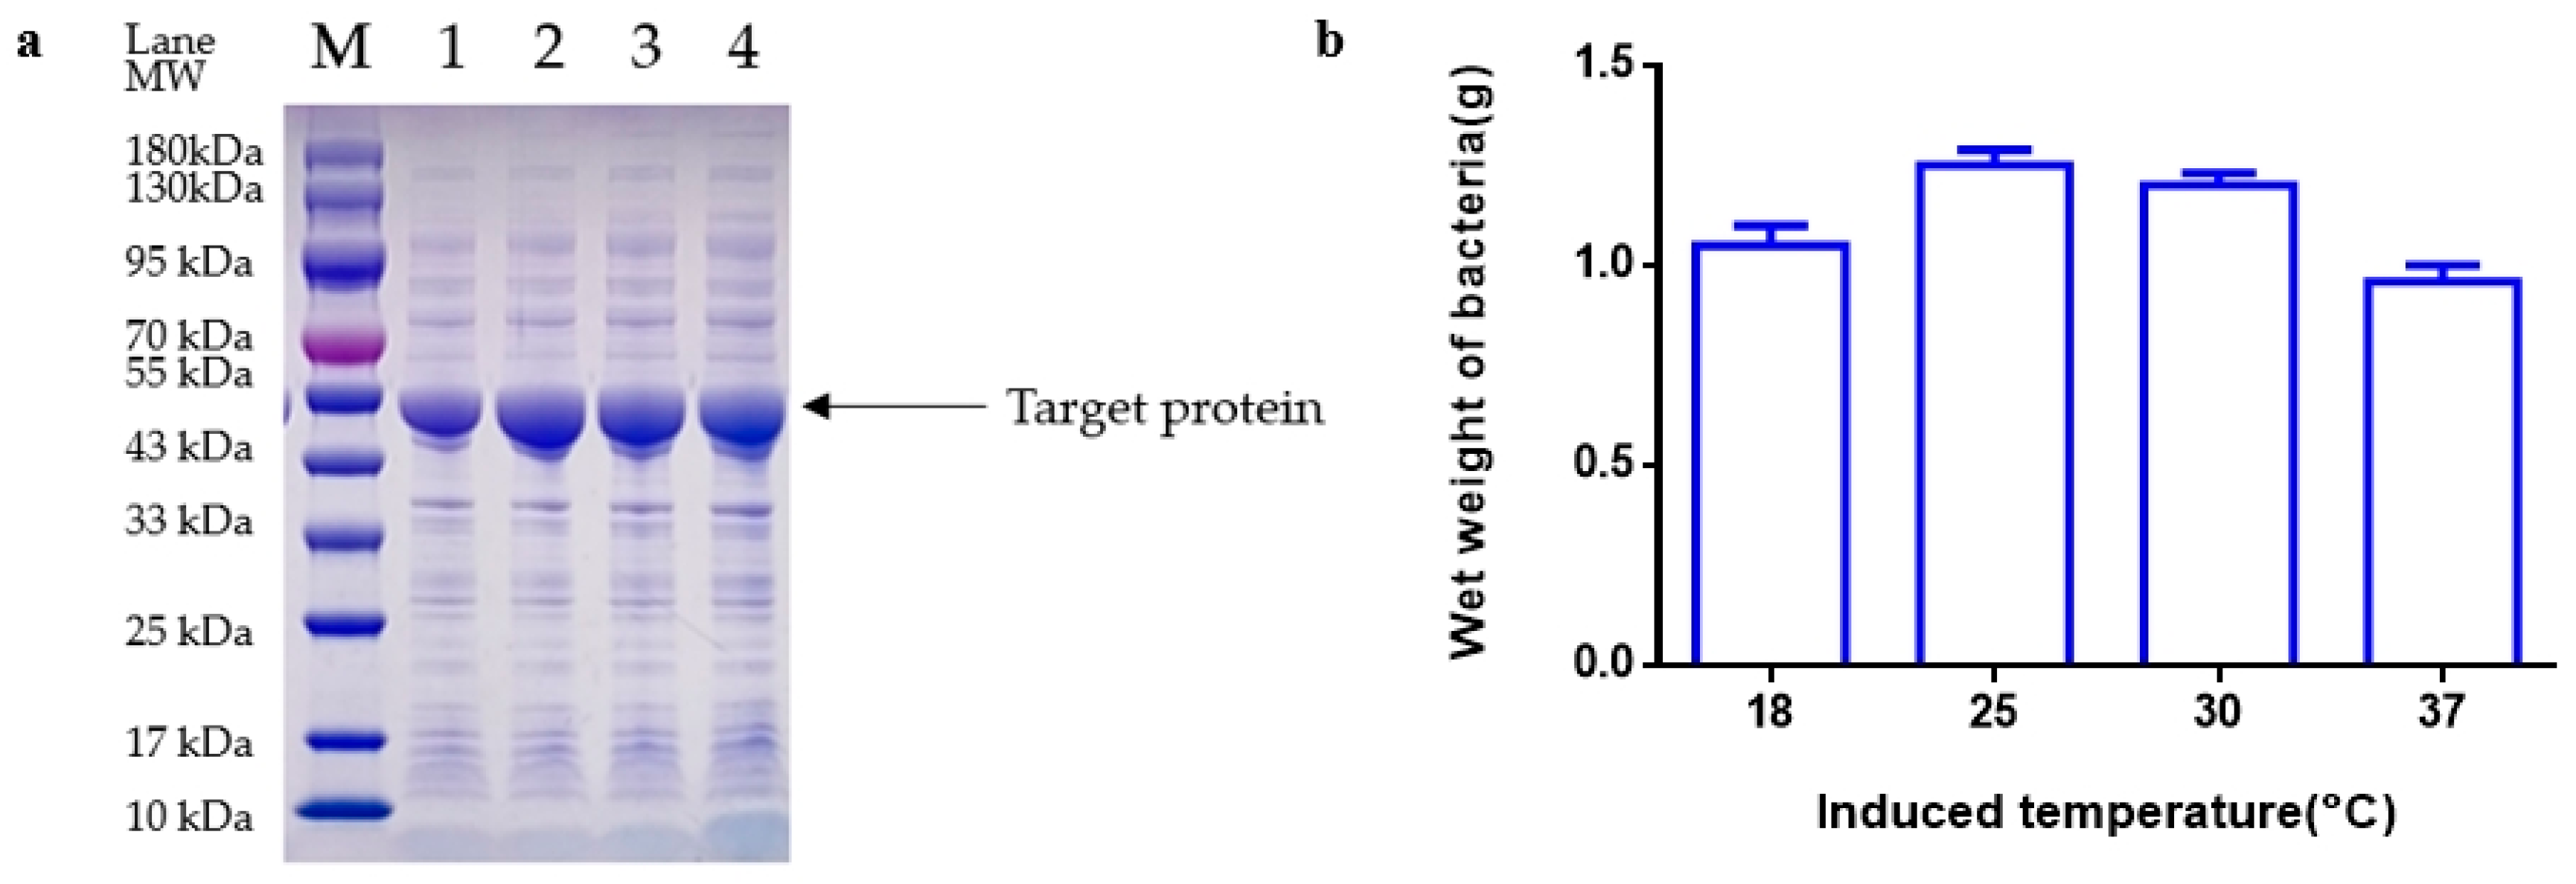
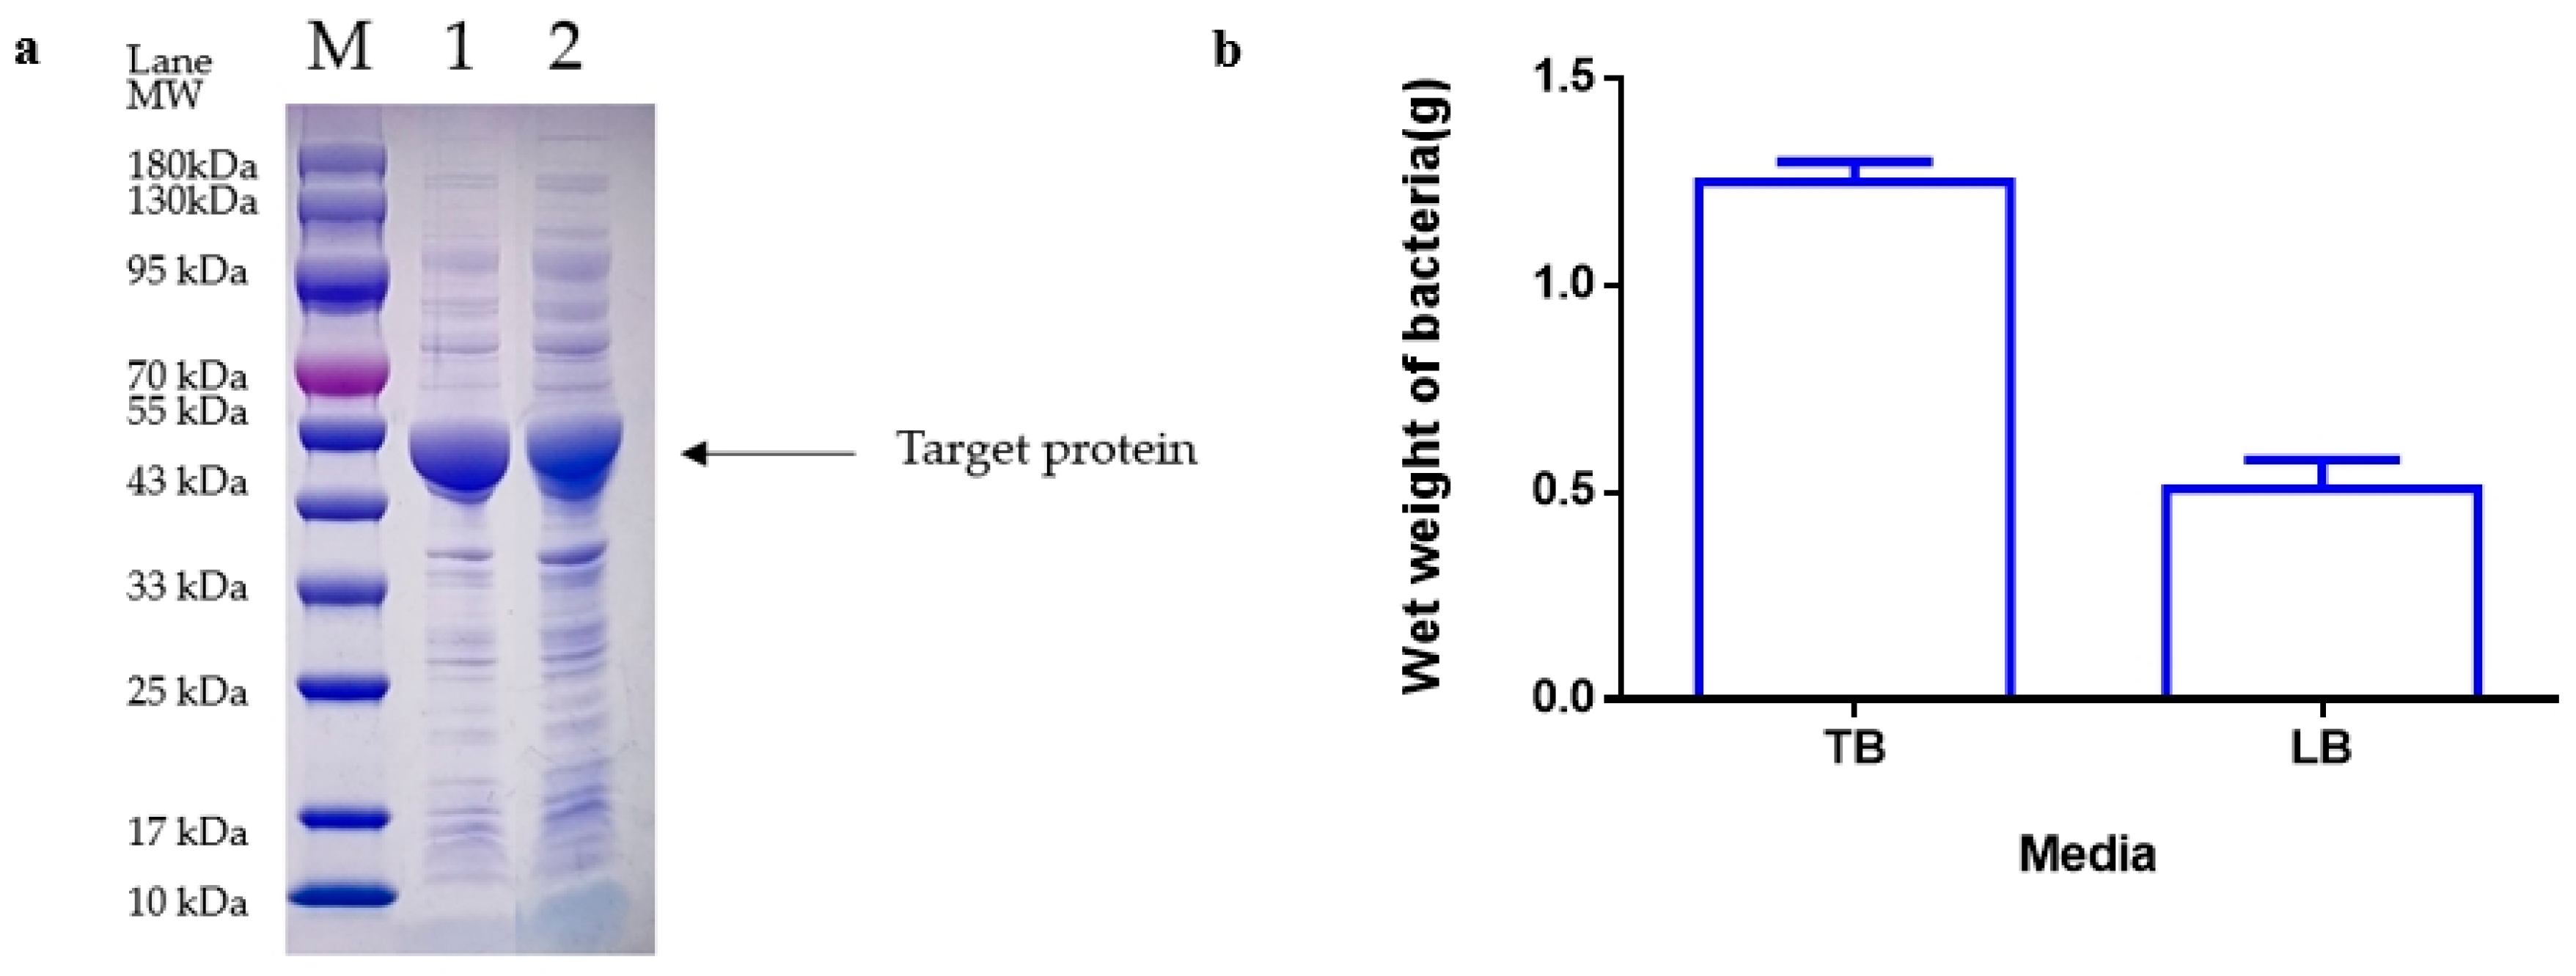
31]. The objective of these experiments was to uncover the specific impacts of each parameter on the protein yield of the kinase protein of nereid. Key parameters such as optimal inoculation amount, initial pH, induction OD, induction temperature, concentration of inducer, and induction time were determined through single-factor analysis in this study to establish the most suitable induction medium: TB [
32,
33,
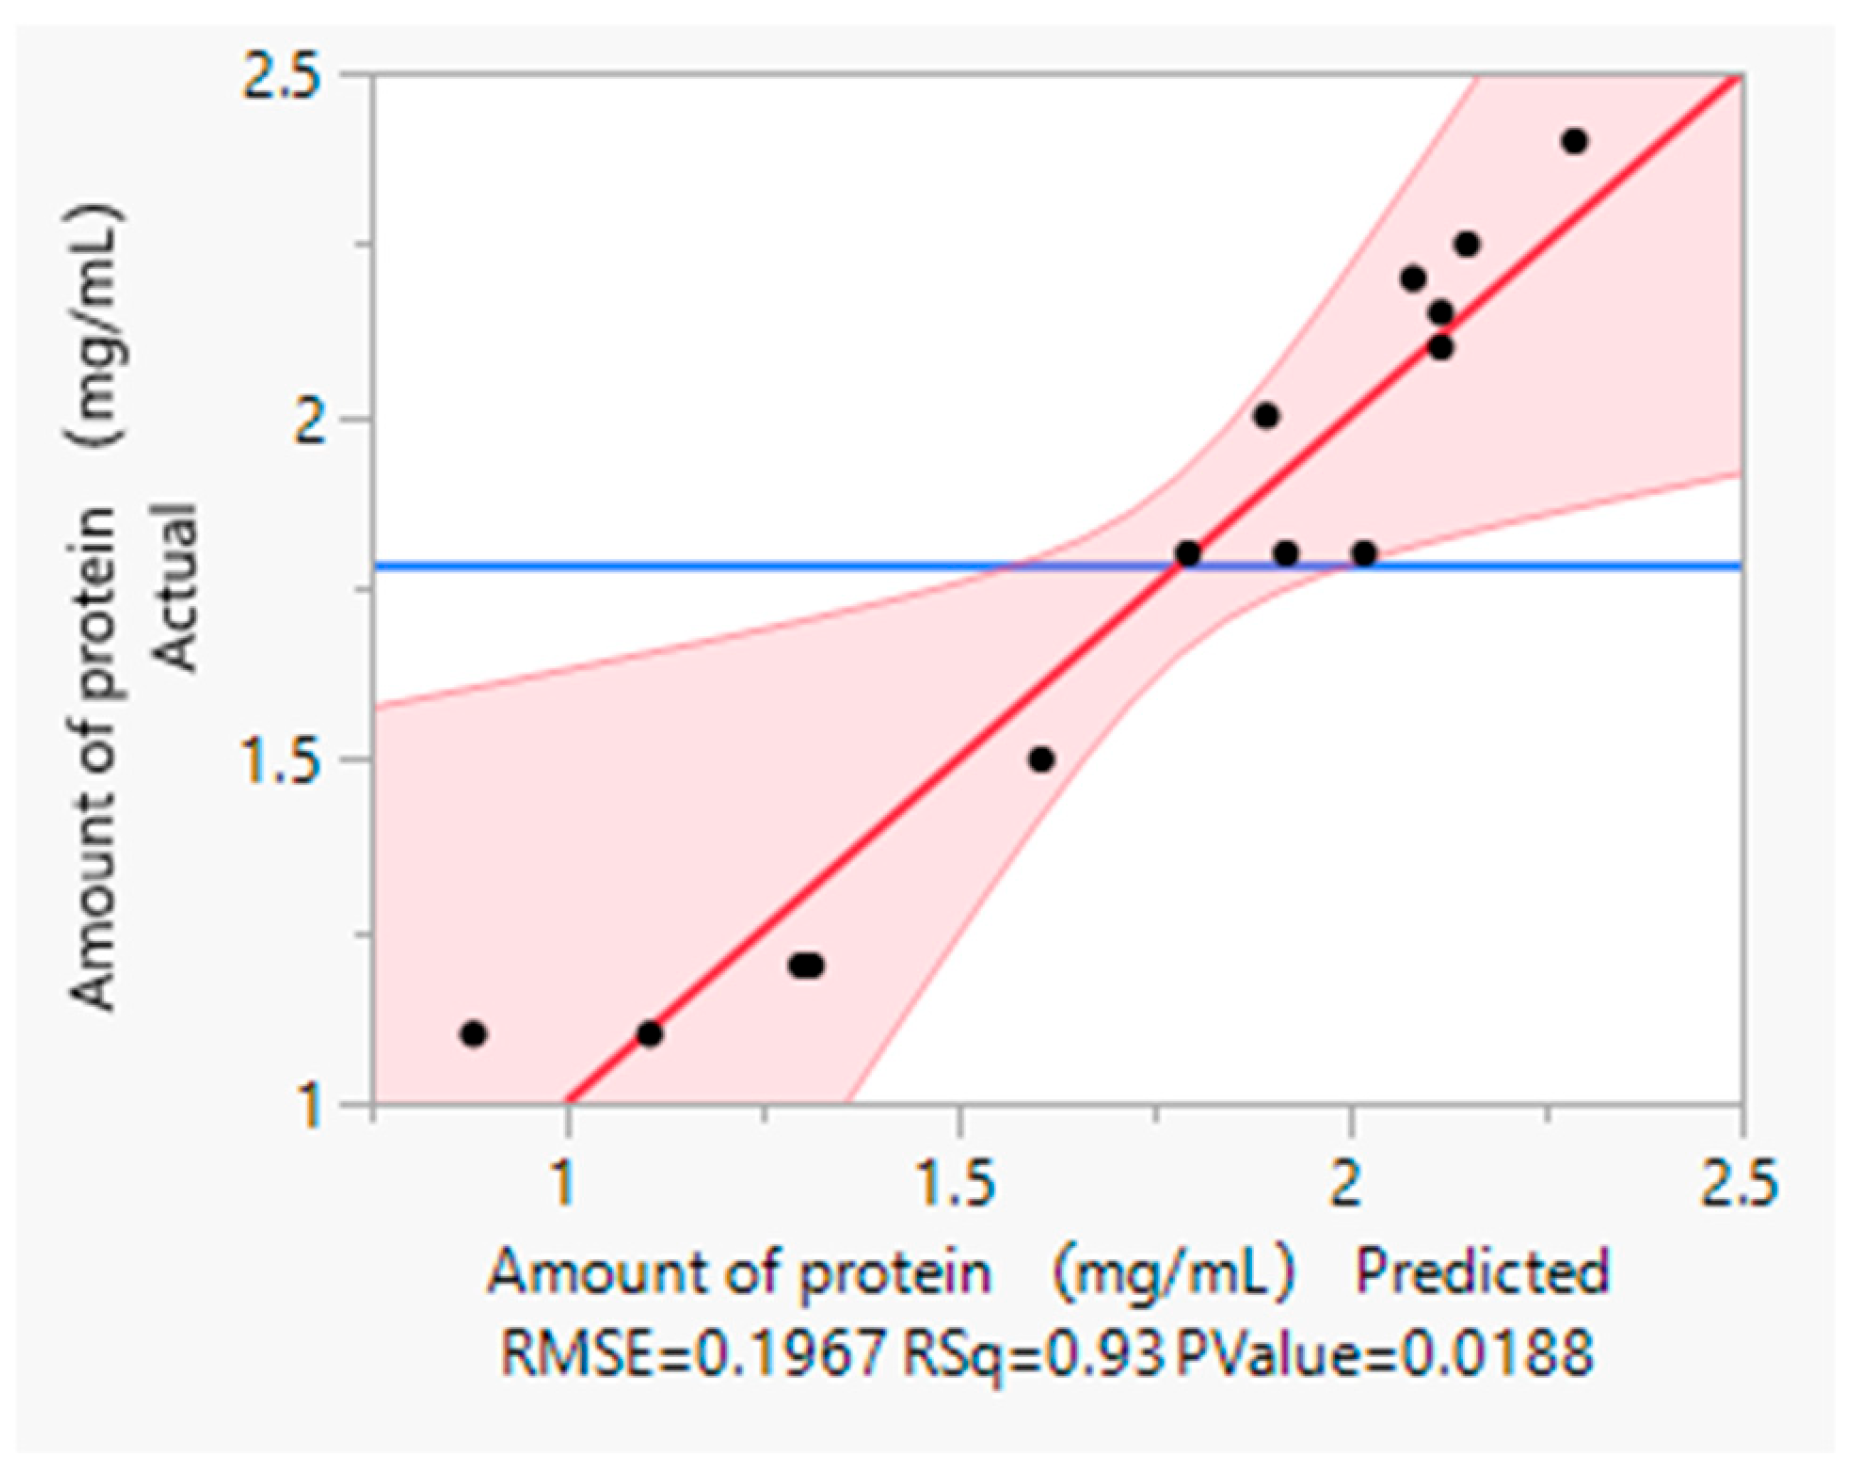
34]. The selected values were 5% for inoculation amount, 6.8 for initial pH, 2.6 for induction OD, 25 °C for induction temperature, 0.1 mM for the concentration of the inducer, and 16 h for induction time. Subsequently, a PB experiment was designed based on the single-factor results. The statistical analysis of the experimental data revealed that the PB experiment simulation results were highly accurate, with an R-square value exceeding 0.9, providing a robust theoretical foundation for our future experiments [
35,
36]. Notably, induction OD, induction time, and initial pH were identified as having the most significant impact on the experimental outcomes, with
p-values below 0.05 for all three factors. Consequently, a response surface experiment was devised to further investigate the interaction among these factors [
37]. By fixing the other parameters at the optimal levels determined by the single-factor experiment, a two-level design was implemented for initial pH, induced OD, and induced time in the response surface experiment [
38,
39]. Utilizing JMP software for simulation and calculation, this study developed a relatively precise mathematical model capable of effectively predicting the optimal conditions. Based on the comparison chart between the predicted and actual values, it is evident that the actual value falls within the predicted range, confirming the model’s reliability.
Compared with other similar experimental cases, PB and response surface experiments were introduced in this experiment [
40,
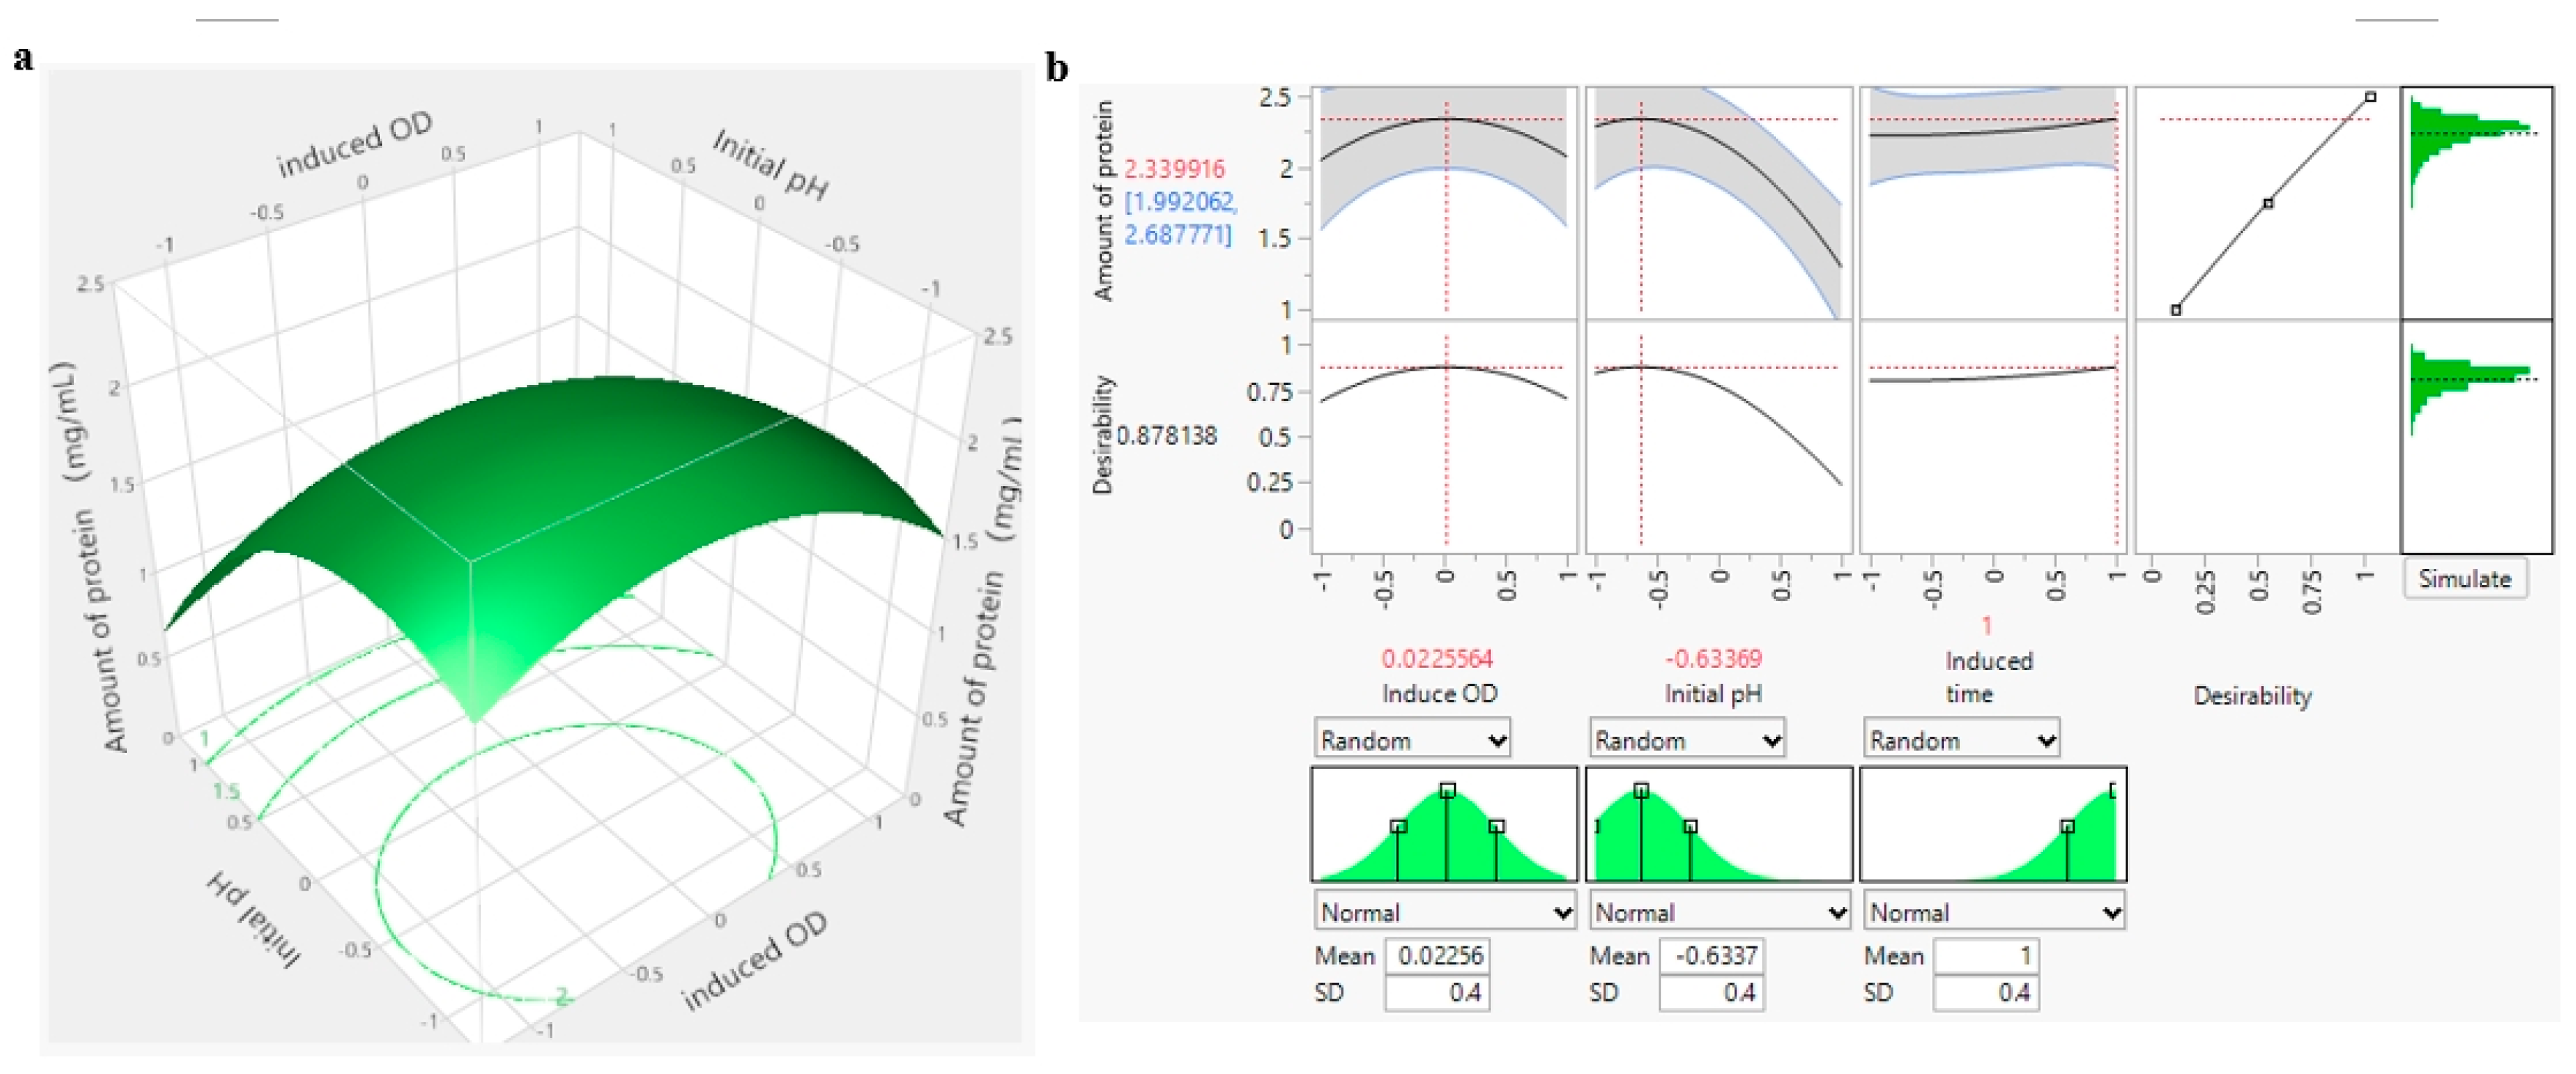
41]. Systematic statistical software was used for simulation and prediction, and the optimal combination of various factors under the interaction was studied in a more detailed manner, instead of just using a simple single factor to summarize the optimal combination. The results of response surface experiments indicate that the initial pH, initial pH squared term, and induced OD squared term significantly impact the experimental outcomes. The 3D response surface diagram visually displays the optimal combination of initial pH and induced OD interaction [
42]. By utilizing the profiler function of JMP software, the optimal level of protein amount can be accurately predicted, taking all factors into consideration for optimal results. To accommodate operational convenience and real-world scenarios, a fluctuation range for the optimal level value of each factor is provided, with an SD value of 0.4. Previously, Vijayaraghavan and Prakash utilized an economical fermentation medium to produce a potential fibrinolytic enzyme from a newly isolated marine bacterium, Shewanella sp. IND20. They determined that the enzyme had a molecular weight of 55.5 kDa, with optimal pH and temperature conditions of 8.0 and 50 °C, respectively [
43]. Similarly, Hu et al. developed a protocol for generating a novel and highly effective fibrinolytic enzyme from Bacillus subtilis DC27, which was isolated from Douchi, a traditional Chinese fermented soybean product. This was achieved using Luria–Bertani medium at 37 °C for 72 h [
44]. Additionally, Simkhada et al. reported the production of a novel fibrinolytic protease from Streptomyces sp. CS684, identifying maximum activity at 45 °C and a pH range of 7 to 8 [
45]. Consistent with the current study, various researchers have documented the optimal experimental conditions and fermentation processes for producing novel fibrinolytic proteases from different sources such as
Bacillus sp. strain CK 11-4 [
46], hepatic caeca of
Asterina pectinifera [
47],
Bacillus subtilis QK02 [
48],
Bacillus subtilis ZA400 [
49],
Bacillus pumilus BS15 [
50],
Serratia sp. KG-2-1 [
51],
Komagataella phaffii [
52], and
Bacillus subtilis Egy [
53,
54].
In the present study, the enzyme activity of fibrolytic kinase was systematically optimized to 15 U/uL, which is a notable improvement over the previously reported 8 U/uL [
55], indicating that process optimization significantly enhances enzyme activity.
5. Conclusions
This study concluded that the highest protein yield is obtained with a bacterial inoculated amount of 3 to 5%, induction temperature of 25 °C, 4 h induction time, pH of 6.8, and 0.1 mM inducer concentration. An induced OD of 2.6 is considered the most suitable. Among the different media tested, LB medium showed lower bacterial wet weight, while TB medium emerged as the best choice for induction. Results from response surface experiments indicated that the optimal initial pH level is −0.6337 (6.17), optimal induction time level is 1 (20 h), and optimal induction OD level is 0.02256 (2.62), with a standard deviation of 0.4 to address operational variability. Accordingly, these findings will offer valuable support and guidance for future experiments, enhancing the stability and reliability of the results.
