Article

Effects of Fermented Goat Milk on Adiposity and Gut Microbiota in a Diet-Induced Obesity Murine Model

1
Centro de Referencia para Lactobacilos, Consejo Nacional de Investigaciones Científicas y Técnicas, San Miguel de Tucumán T4000ILC, Argentina
2
Department for Sustainable Food Process, Università Cattolica del Sacro Cuore, 29122 Piacenza, Italy
3
Facultad de Agronomía, Zootecnia y Veterinaria, Universidad Nacional de Tucumán, San Miguel de Tucumán T4000ACS, Argentina
*
Author to whom correspondence should be addressed.
These authors contributed equally to this work.
Fermentation 2024, 10(3), 155; https://doi.org/10.3390/fermentation10030155
Submission received: 14 February 2024 / Revised: 29 February 2024 / Accepted: 3 March 2024 / Published: 7 March 2024
(This article belongs to the Special Issue Fermentation: 10th Anniversary)

Abstract

:
The administration of goat milk fermented (FGM) with Lactobacillus delbrueckii subsp. indicus CRL1447 and supplemented with different mixes of lactobacilli strains (Mix1: Limosilactobacillus fermentum CRL1446 + Lactiplantibacillus paraplantarum CRL1449 + Lactiplantibacillus paraplantarum CRL1472; Mix2: CRL1446 + CRL1449; Mix3: CRL1446 + CRL1472; and Mix4: CRL1449 + CRL1472) was investigated regarding body weight, metabolic and inflammatory parameters, and gut microbiota (GM) composition in mice fed a high-fat diet (HFD). Body weight gain, adipocyte size, fasting blood glucose, serum triglyceride, and leptin levels were significantly reduced in the group fed FGM+Mix3 compared with the obese mice fed FGM. FGM+Mix2 and FGM+Mix3 modified the GM composition, reversing the dysbiosis caused by the HFD. Although there were no significant changes at the phylum level, the GM composition was significantly changed at the family and genus levels. Results suggest that the administration of FGM+Mix3 improves metabolic and immune profiles in obese mice while positively modulating the GM, therefore attenuating the risk factors associated with obesity.

1. Introduction

Obesity and its associated disorders are one of the most prevalent non-communicable health issues worldwide. Obesity and overweight are described as excessive fat accumulation that may affect health and are frequently associated with several comorbidities, including type 2 diabetes mellitus, fatty liver disease, coronary artery disease, osteoarthritis, and certain cancers. Its worldwide prevalence has increased markedly in the last 50 years, nearly tripling between 1975 and 2016, with more than sixty percent of deaths by year by diseases related to obesity and overweight [1].
Although obesity results from a chronic imbalance between energy intake and expenditure, there are genetic, behavioral, metabolic, and hormonal factors which can influence body weight. In recent years, some authors have shown that the gut microbiome (GM) may also influence metabolism, as it contributes significantly to the health of the host, with roles in modulation of the immune system, gut barrier function, vitamin biosynthesis, nutrient absorption, neurohormonal function, among others [2,3,4]. Therefore, this complex ecosystem plays an important role in the proper function and homeostasis of the digestive system and the overall health status of the host. Some factors, such as improper diet, can alter the function and composition of GM. This imbalance in the composition, known as dysbiosis, can modulate the individual’s immune response, leading to a state of obesity, mainly by disturbing the food intake and energy balance [3,4].
However, GM can be positively modulated by probiotics supplementation. Probiotics are live microorganisms, administered in an adequate concentration, that confer a health benefit on the host [5,6]. Probiotics have emerged as an alternative strategy for handling digestive and immune health and are being recommended as effective therapeutic interventions for non-communicable diseases such as obesity or metabolic syndrome [4]. These probiotics can be considered for the design of functional food formulations; due to their high nutritional value and presence of bioactive components, goat milk has been widely used as a vehicle for probiotics delivery [7]. Their bioactive properties could be associated with the microorganisms themselves or with the metabolites resulting from their fermentation. Some authors describe the benefits obtained from the consumption of fermented goat milk (FGM) [8,9]. In addition, compared to fermented cow milk, FGM maintains a better nutritional profile with higher protein, mineral, and vitamin values and presents a fatty acid profile that is considered more health-promoting [10]. Although current knowledge positively supports the hypothesis that FGM presents beneficial effects related to obesity, such as metabolic and microbiota-modulating properties, preclinical and clinical trials evidencing these beneficial effects are scarce.
Marquez et al., in an intensive study of strain characterization in terms of their probiotic and technological properties, selected Lactobacillus delbrueckii subsp. indicus CRL1447 for developing fermented goat milk [11]. The CRL1447 strain stands out for its high acidification rate in milk, a property of technological interest for developing fermented products.
Therefore, the present work aimed to evaluate the administration of FGM with Lactobacillus delbrueckii subsp. indicus CRL1447 and supplemented with different mixes of lactobacilli strains regarding metabolic and immunologic parameters and GM composition in diet-induced obese mice.

2. Materials and Methods

2.1. Bacterial Strains and Culture Conditions

Four lactobacilli strains from the Culture Collection of the Centro de Referencia para Lactobacilos (CERELA-CONICET, Tucumán, Argentina) were used in this study: Lactobacillus delbrueckii subsp. indicus CRL1447 (CRL1447), Limosilactobacillus fermentum CRL1446 (CRL1446), Lactiplantibacillus paraplantarum CRL1449 (CRL1449), and Lactiplantibacillus paraplantarum CRL1472 (CRL1472). These strains, previously characterized for their in vitro probiotic and technology properties, were selected to be assayed on diet-induced obese mice [11]. Microorganisms were cultured in de Man–Rogosa–Sharpe (MRS) broth in aerobiosis for 18 h at 37 °C, except for the CRL1447 strain that was cultivated at 42 °C. A combination of these strains was used: Mix1 (CRL1446, CRL1449, and CRL1472), Mix2 (CRL1446 and CRL1449), Mix3 (CRL1446 and CRL1472), and Mix4 (CRL1449 and CRL1472) in a concentration of 1 × 10⁸ CFU mL−1 each strain.

2.2. Elaboration of Fermented Goat Milk (FGM) Supplemented with the Mixes

The FGM was elaborated as described by Marquez et al. [11]. Briefly, commercial GM powder (La Primera, Córdoba, Argentina) reconstituted in 10% (w/v) sterile distilled water was pasteurized in a thermostatic bath (90 °C for 15 min) and cooled (45 °C). The CRL1447 strain was used as the single starter for the fermentation of the GM. Eighteen-hour-old cells cultivated in MRS broth were harvested by centrifugation, inoculated (4%, v/v) in pasteurized GM, and incubated at 42 °C for 8–10 h. Four FGM samples were developed, adding Mix1, Mix2, Mix3, and Mix4 at the end of fermentation. FGM without bacterial supplementation was used as the control.

2.3. Animals, Diets, and Experimental Design

Adult male C57BL/6 mice (n = 42) were obtained from the closed random-bred colony maintained at CERELA. After the adaptation period (seven days), the seven groups of animals (n = 6 each) were randomly separated and received the different treatments for ten weeks. The assigned groups were as follows. (a) Control group: mice fed daily with a standard diet (SD) and water ad libitum; (b) Control+FGM group: mice fed with SD and FGM; (c) Obese (Ob)+FGM group: mice fed with a high-fat diet (HFD) and FGM, and four treatment groups fed with HFD and FGM supplemented with one of the mixes of the strains. These last groups were as follows. (d) Ob+FGM+Mix1 group: supplemented with CRL1446, CRL1449, and CRL1472; (e) Ob+FGM+Mix2 group: supplemented with CRL1446 and CRL1449; (f) Ob+FGM+Mix3 group: supplemented with CRL1446 and CRL1472; and (g) Ob+FGM+Mix4 group: supplemented with CRL1449 and CRL1472. The SD provided 3.10 kcal/g (7.5% kcal from fat) and the HFD provided 5.154 kcal/g (60% kcal from fat). The administered FGM was changed every 12 h and the diet was renewed twice a week.

2.4. Determination of Body Weight, Feed Consumption, and Feed Efficiency Ratio

The mice’s body weight (BW) and food intake were measured weekly. Body weight (BW) gain (BWG) was expressed as follows: final BW (g)—initial BW (g). Daily feed consumption (DFC) was calculated as follows: food consumed weekly (g)/7 days/number of mice per group. The formula for food efficiency ratio (FER) is FER = BWG (g)/total food consumed (g) [12].

2.5. Animal Sample Collection

At the end of the experimental period, animals fasted for 12 h were anesthetized using ketamine hydrochloride (150 mg/kg) and xylazine hydrochloride (5 mg/kg) (Richmond División Veterinaria SA, Bs As., Argentina). Blood samples were acquired by cardiac puncture and were collected in tubes, centrifuged to obtain plasma, and stored at −20 °C until processing. Epididymal adipose tissues (EATs) were also collected. The adiposity index (AI) was calculated by the ratio: EAT (g)/BW (g) × 100. Furthermore, before sacrifice, stool samples were collected from all experimental groups.

2.6. Analysis of Inflammatory and Metabolic Parameters

Plasma levels of cytokines (TNF-α, MCP-1, IL-6, and IL-10) were determined by flow cytometry. Data acquisition was performed on the FACS Calibur flow cytometer (BD Bioscience, San Jose, CA, USA) using the CBA Mouse Soluble Protein Flex Set Kit (BD Bioscience, San Jose, CA, USA). The FCAP Array software version 3.0.14 was used for data analysis. Plasma leptin levels were determined by enzyme-linked immunoadsorption assay (Mouse Leptin Quantikine ELISA Kit, R&D Systems, Minneapolis, MN, USA). Plasma glucose levels and lipid profile (total cholesterol, HDL-cholesterol (HDL-c), LDL-cholesterol (LDL-c), and triglycerides (TG)) were evaluated by enzymatic methods using commercial kits (Wiener Lab, Rosario, Argentina).

2.7. Histological Analysis

EAT samples from each group were fixed by immersion in 10% (v/v) formaldehyde, dehydrated in alcohol and xylene, and embedded in paraffin. Cuts of 3–5 μm thickness were stained with hematoxylin and eosin. The histological samples were examined by light microscopy (Carl Zeiss—Axio Scope A1, Jena, Germany).
Each experimental group’s adipocyte size was determined according to the methodology described by Gauffin Cano et al., using Carl Zeiss—Axio Vision Release 4.8 software [13]. The area (μm2) between 100 and 200 adipocytes per animal was analyzed to estimate adipocyte size. The adipocytes were then grouped by size ranges as follows, areas <500, 501–1000, 1001–2000, 2001–3000, and >3001 μm2, to be able to compare between the different groups.

2.8. Determination of Gut Microbiota Composition

Fecal samples from each group (n = 3) were collected in tubes before animal sacrifice and stored at −20 °C until use. The commercial kit for fecal samples (QIAamp DNA Stool Mini Kit, Hilden, Germany) for DNA extraction was used according to the manufacturer’s instructions. The total concentration and the quality of DNA samples, based on the 260/280 ratio, were confirmed using the Nabi UV/Vis nano-spectrophotometer (MicroDigital Co., Seoul, Republic of Korea).
A 20 μL aliquot of DNA from each sample was used for amplicon sequencing using a MiSeq Illumina sequencing platform. The V3–V4 bacterial regions of the 16S rRNA were amplified by PCR using primer pairs 341F (5′-CCTACGGGNGGCWGCAG-3′) and 805R (5′-GACTACHVGGGTATCTAATCC-3′) according to Illumina protocol to generate an amplicon size of ~400 bp [14]. The quality filtering, clustering of sequences into OTUs (Operational taxonomic units), and diversity indexes were performed using QUIIME (Quantitative Insights Into Microbial Ecology) software (http://qiime.org/1.8.0/index.html). Chimera elimination was performed using the UCHIME algorithm [15].

2.9. Statistical Analysis

Statistical analyses were performed using Graph Pad Prism software version 9.0 (GraphPad Software, San Diego, CA, USA) and Infostat/L® 2019 for Windows (Universidad Nacional de Córdoba, Córdoba, Argentina). One-way ANOVA followed by Tukey’s test was used to determine significant differences. p values < 0.05 were considered statistically significant. Correlations between gut microbiota taxonomic groups and biochemical parameters were performed using Spearman’s rank correlation coefficients using GraphPad Prism version 9.0 (GraphPad Software, San Diego, CA, USA). p values <0.05 were considered statistically significant.

3. Results

3.1. Evaluation of Nutritional Parameters

After ten weeks of feeding, the BWG of the Ob+FGM group was 38% higher than the Control+FGM group. The increase in the Control+FGM group was greater than that of the Control group; however, this difference was not significant. In the Ob+FGM+Mix2 and Ob+FGM+Mix3 groups, BWG decreased by 31% and 35%, respectively, concerning the Ob+FGM group. The Ob+FGM+Mix1 and Ob+FGM+Mix4 groups’ weight increase was similar to that of the Ob+FGM group (Table 1). The DFC was lower in the groups receiving the HFD than those receiving the SD (Control and Control+FGM). The FER of the Ob+FGM group mice was 1.8 times higher than that observed in the Control+FGM group mice. Contrarily, the FER in Ob+FGM+Mix2 and Ob+FGM+Mix3 group mice was reduced by 33% and 36% (Table 1).
In conjunction with the changes in body weight, the increases in AI in the Ob+FGM group were 3.5 times greater than that in the Control+FGM group after ten weeks of feeding, and it decreased by 35% and 40%, respectively, when administered FGM+Mix2 and FGM+Mix3 compared to the Ob+FGM group (Table 1). The association of the strains CRL1449 and CRL1472 (Mix1 and Mix4) does not induce a beneficial effect on the AI concerning that observed in the Ob+FGM group.

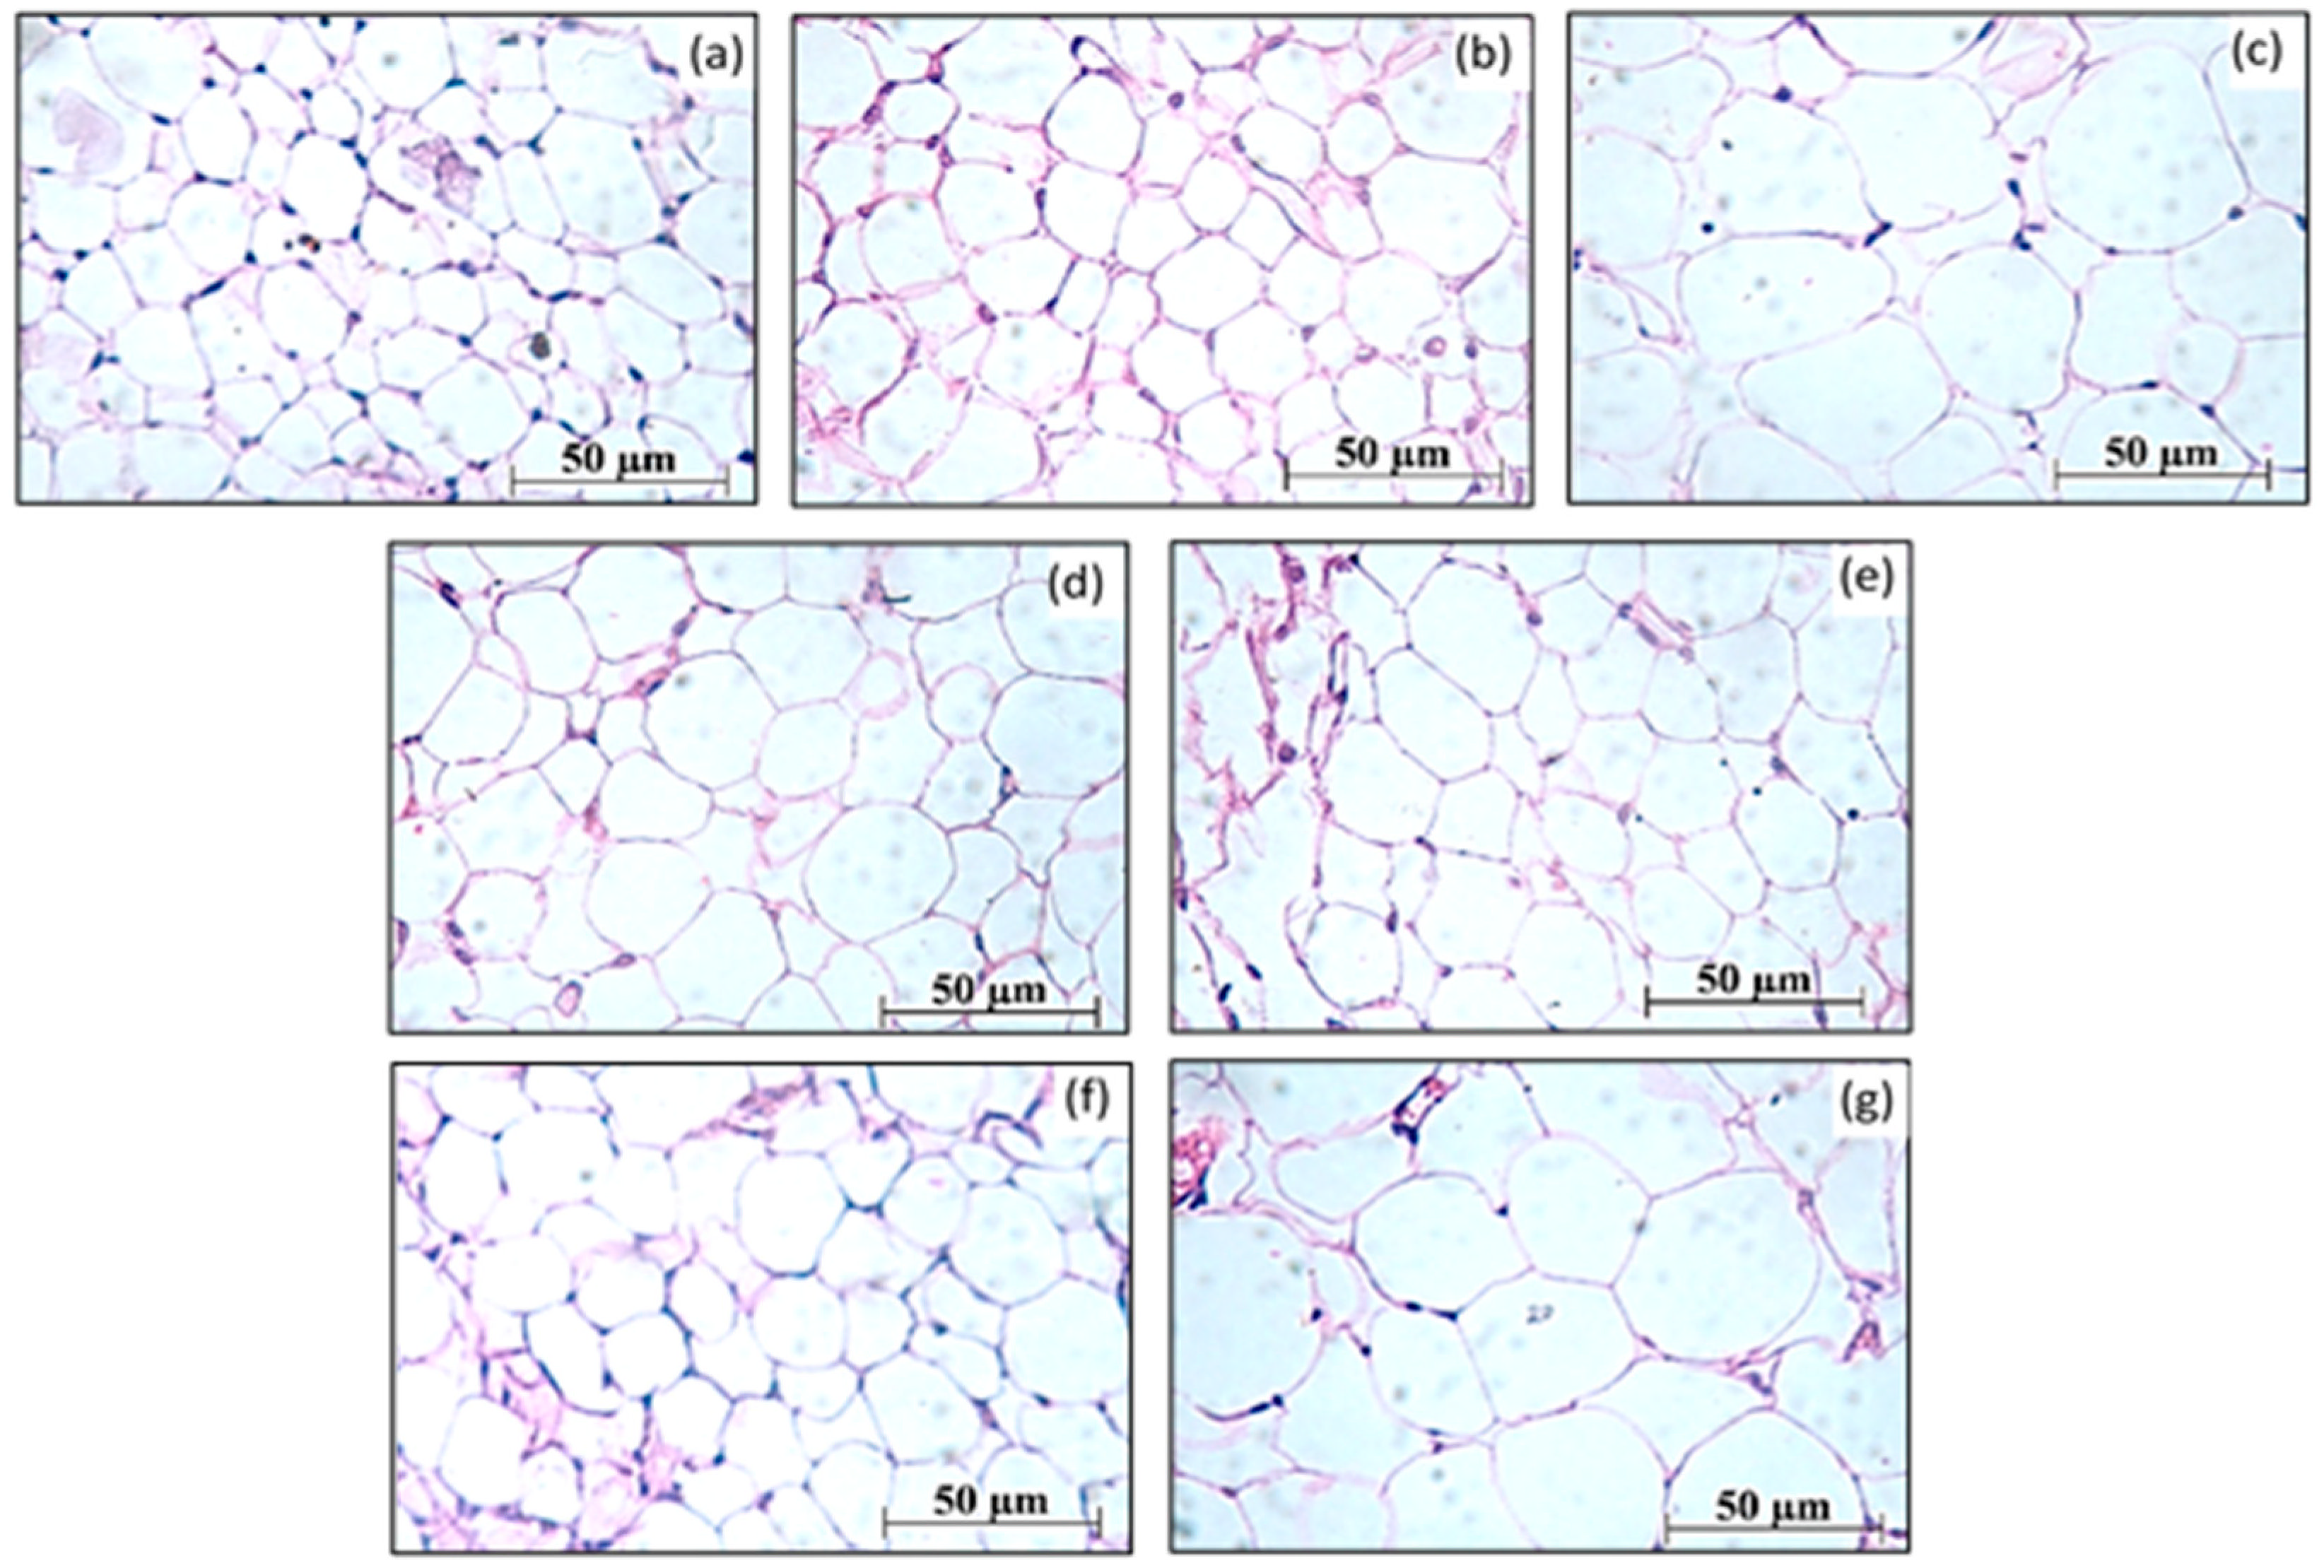
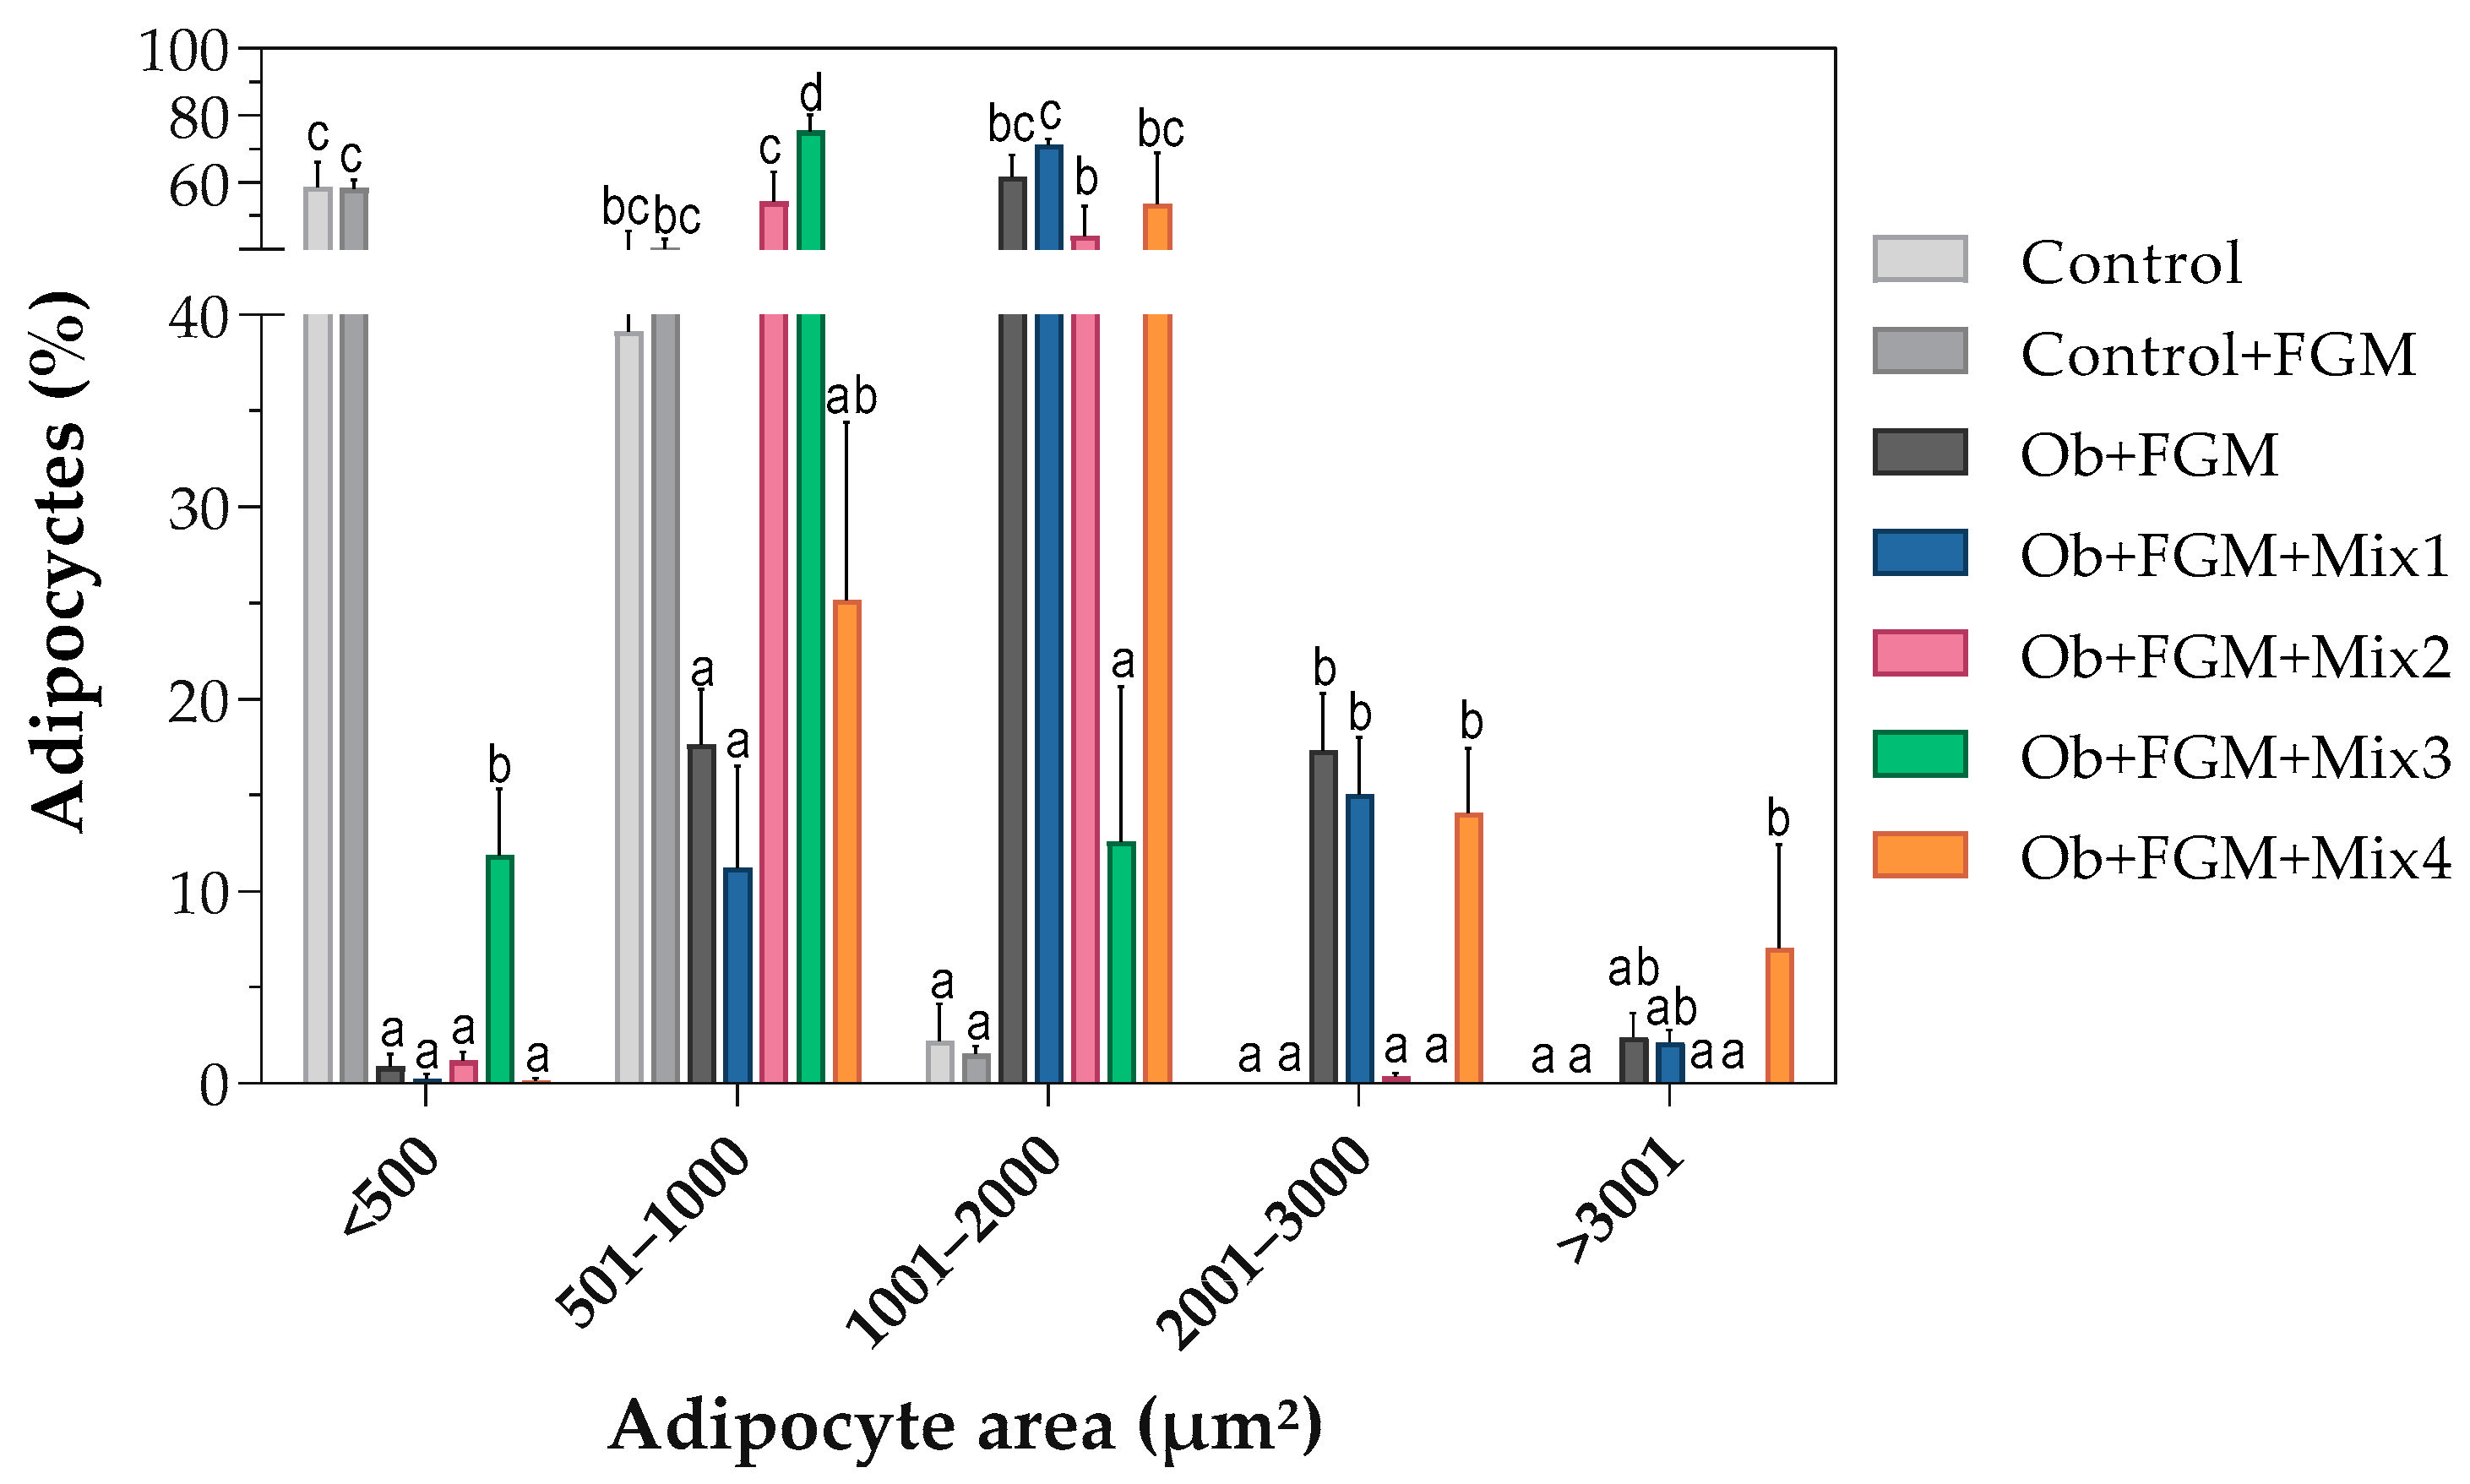
3.2. Assessment of the Structure of Adipocytes

Histological sections of EAT were analyzed and differences in the number and size of adipocytes in mice from the experimental groups under study were observed (Figure 1). The adipocytes of the Control and Control+FGM groups revealed a regular structure, and their arrangement was ordered (Figure 1a,b). In contrast, in the Ob group, larger adipocytes are observed without well-defined limits (Figure 1c). The administration of the FGM supplemented with the mixtures could reverse the changes produced in adipocytes by the HFD to some extent (Figure 1d–g).
The FGM administration in the group that received the SD did not induce significant differences in adipocytes’ area size than the group that received water; in both groups, 98% of the adipocytes have a size less than 1000 μm2 (Figure 2). The HFD significantly increased the number of large adipocytes (area > 1000 μm2) in the Ob group (81%) compared to the SD; that is, analyzing the weight and size of the EAT, we observed hypertrophy accompanied by a more significant number of large adipocytes. Mix4 supplementation presented a distribution similar to that of the Ob group; the highest percentage of adipocytes had a size between 1000 and 3000 μm2. Similar results were observed in the Mix1 group, where 78% of the adipocytes had a mean size between 500 and 3000 μm2. In contrast, Mix2 significantly reduced adipocyte area (areas < 2000 μm2) compared to the Ob group. This change was even more significant when Mix3 was administered, where 90% of the adipocytes were less than 1000 μm2 in size.

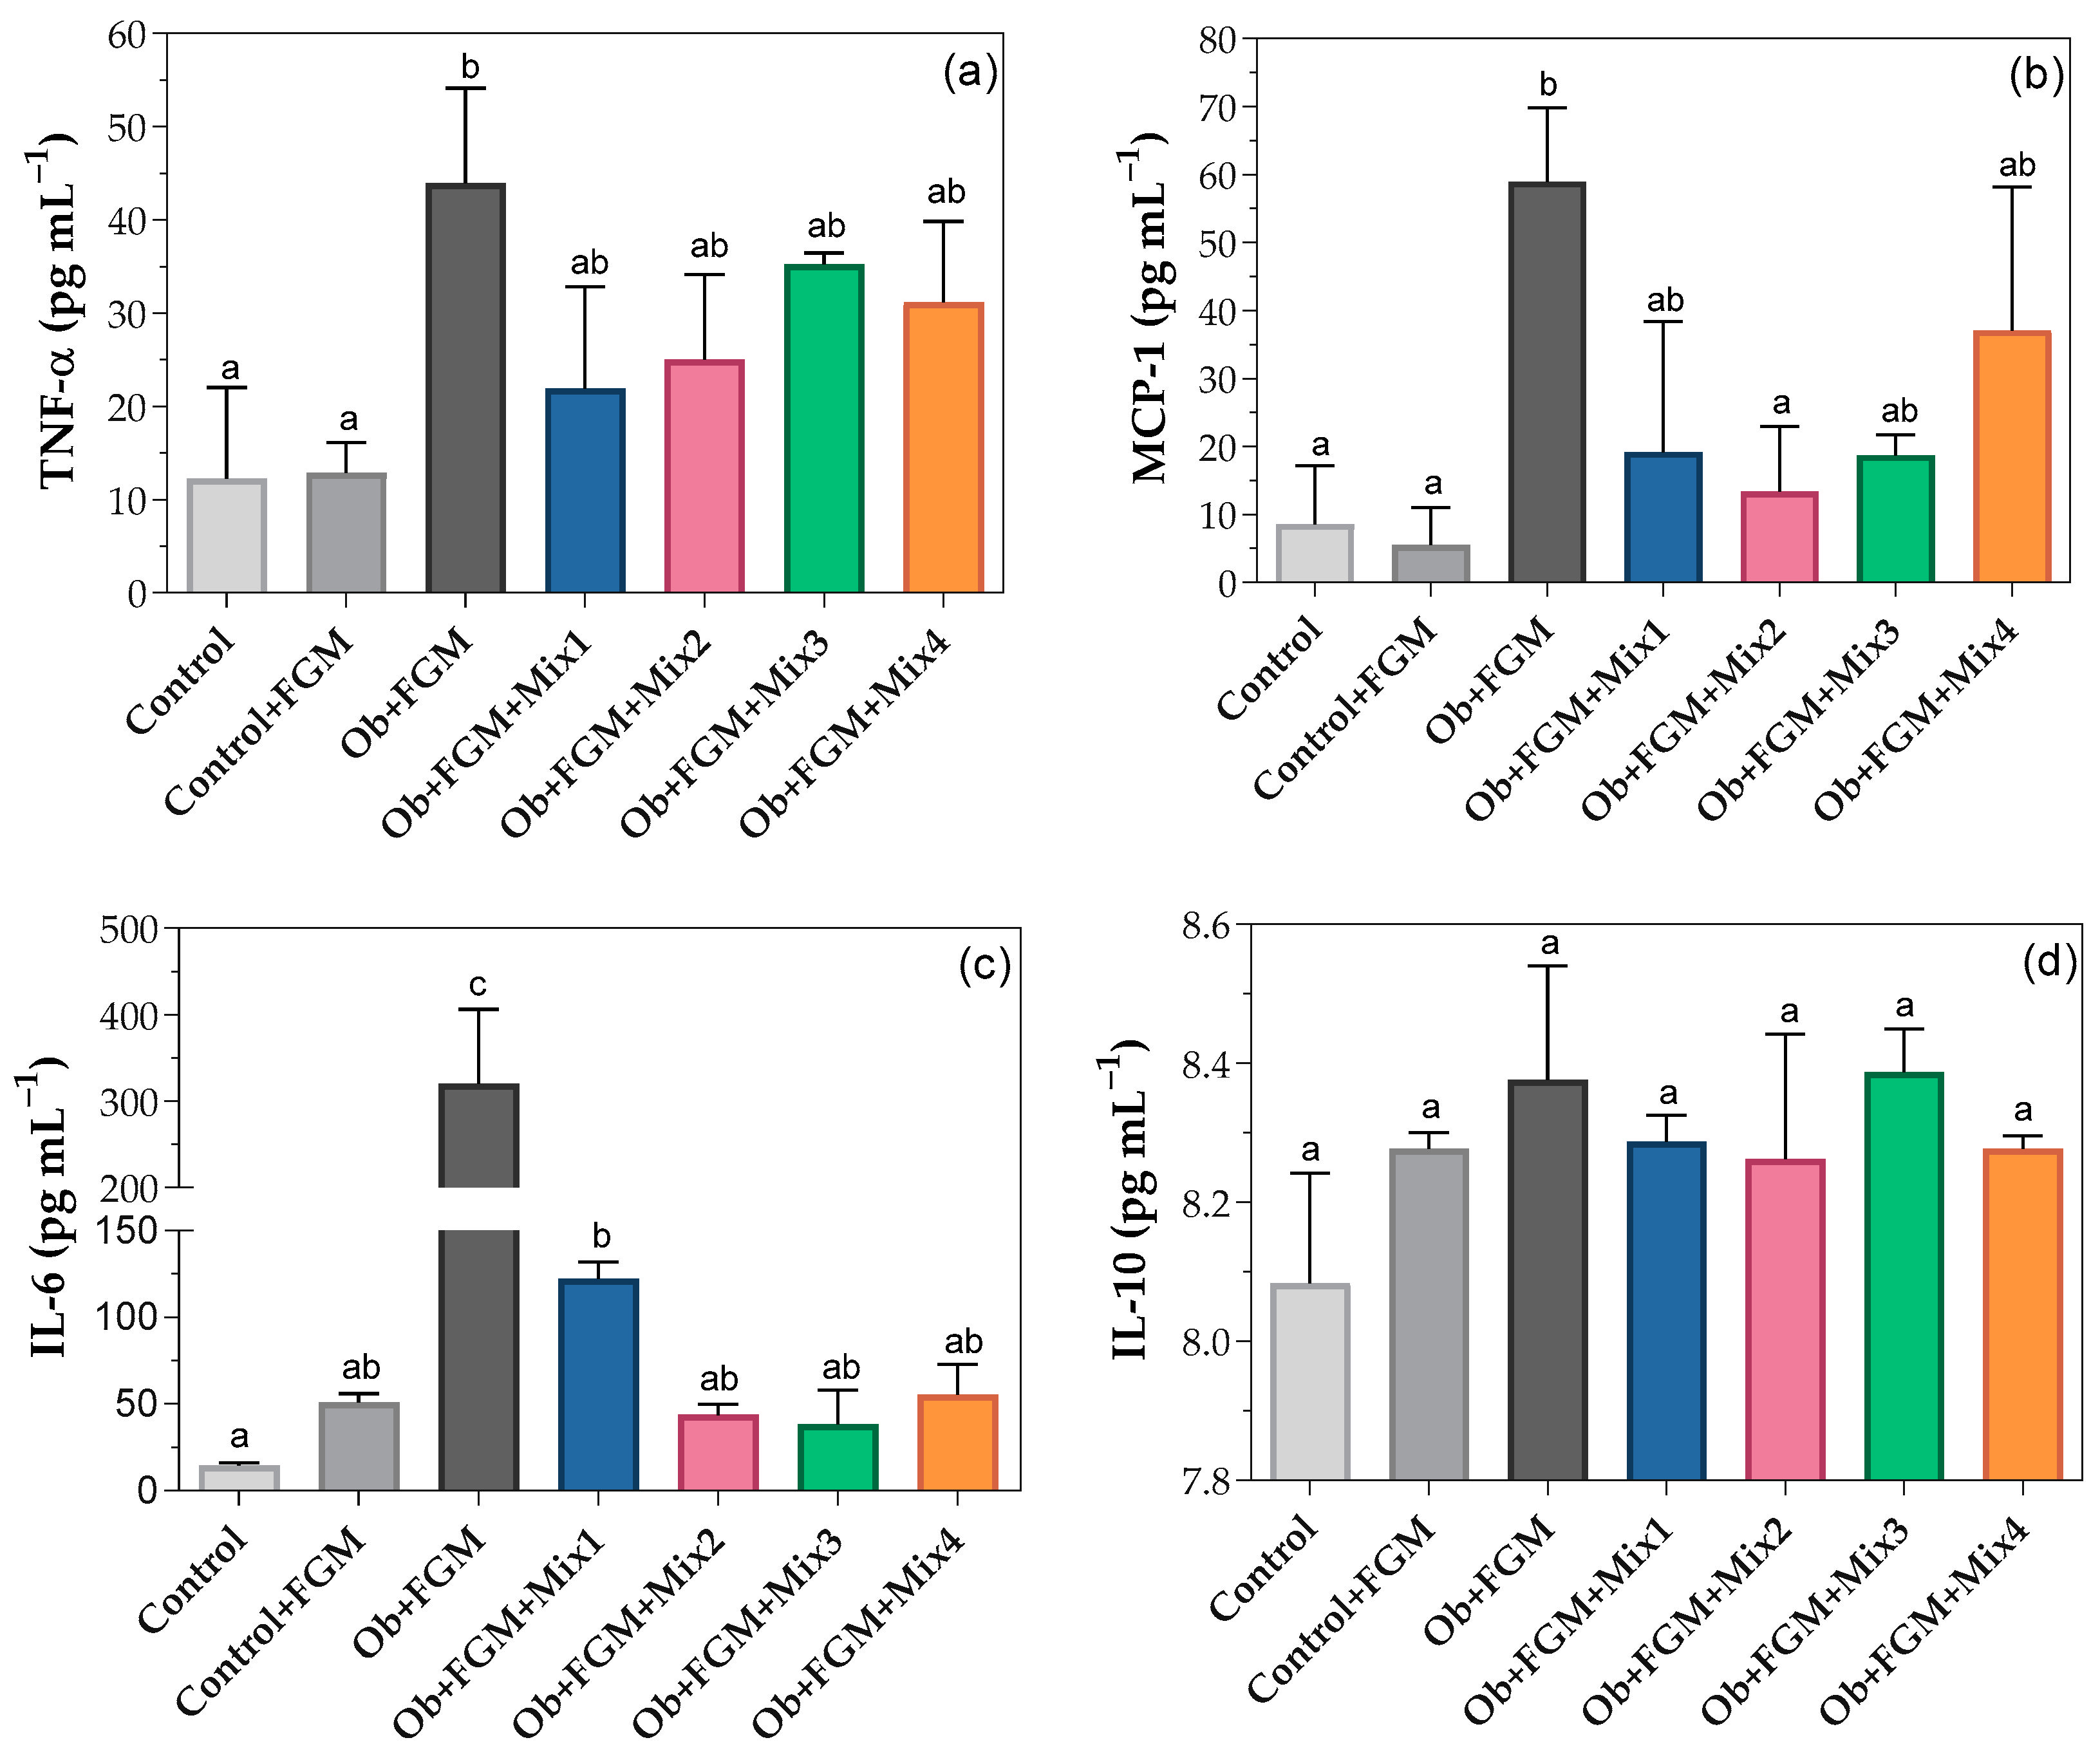
3.3. Inflammatory Status of Obese Mice after Administration of FGM

Inflammatory status was also determined by evaluating plasma levels of TNF-α, MCP-1, IL-6, and IL-10 cytokines (Figure 3, Table S1). The HFD significantly increased TNF-α, MCP-1, and IL-6, while no significant differences in IL-10 levels were observed, demonstrating a proinflammatory effect of this diet compared to the SD. Supplementation with the different mixes tended to restore the proinflammatory cytokine TNF-α; however, this difference was not significant concerning the Ob group. In the Ob+FGM+Mix2 group, MCP-1 levels decreased to values similar to the Control group. IL-6 levels in all groups fed with the mixes decreased significantly compared to the Ob+FGM group. At the same time, no significant differences were observed in the levels of the anti-inflammatory cytokine IL-10 in any group.

3.4. Biochemical Parameters of Obese Mice after Administration of FGM

Figure 4 (Table S2) shows the alterations in the biochemical parameters. Leptin levels in the Ob+FGM group increased 8.7-fold compared to the Control+FGM group; however, leptin levels in the Control+FGM group were only 1.9-fold higher than in the Control group. The administration of Mix3 significantly reduced leptin levels by 22% compared to the Ob+FGM group (Figure 4a).
The glucose values of the Ob+FGM group were 42% higher than those of the Control+FGM group. These values decreased by 43% and 48% in the groups fed with FGM+Mix2 and FGM+Mix3, respectively. The glucose values of the FGM+Mix1 and FGM+Mix4 groups also showed a 24% and 26% decrease, respectively (Figure 4b).
Compared with the Control+FGM group, TG levels significantly increased 1.8-fold in the Ob+FGM group. In the Ob+FGM+Mix3 group mice, TG levels were significantly reduced by 35% compared with the Ob+FGM group. TG levels in Ob+FGM+Mix1, Ob+FGM+Mix2, and Ob+FGM+Mix4 groups were similar to the Ob+FGM group (Figure 4c). The total cholesterol levels in the Ob+FGM group significantly increased by 17% compared to the animals in the Control group. No significant differences were observed between the different treatment groups regarding the Ob+FGM group (Figure 4d). Similar LDL-c levels were detected in all the experimental groups (Figure 4e). HDL-c levels in the Ob+FGM group were 23% lower than in the Control+FGM group. The HDL-c values were higher in all the experimental groups than in the Control+FGM groups (Figure 4f).

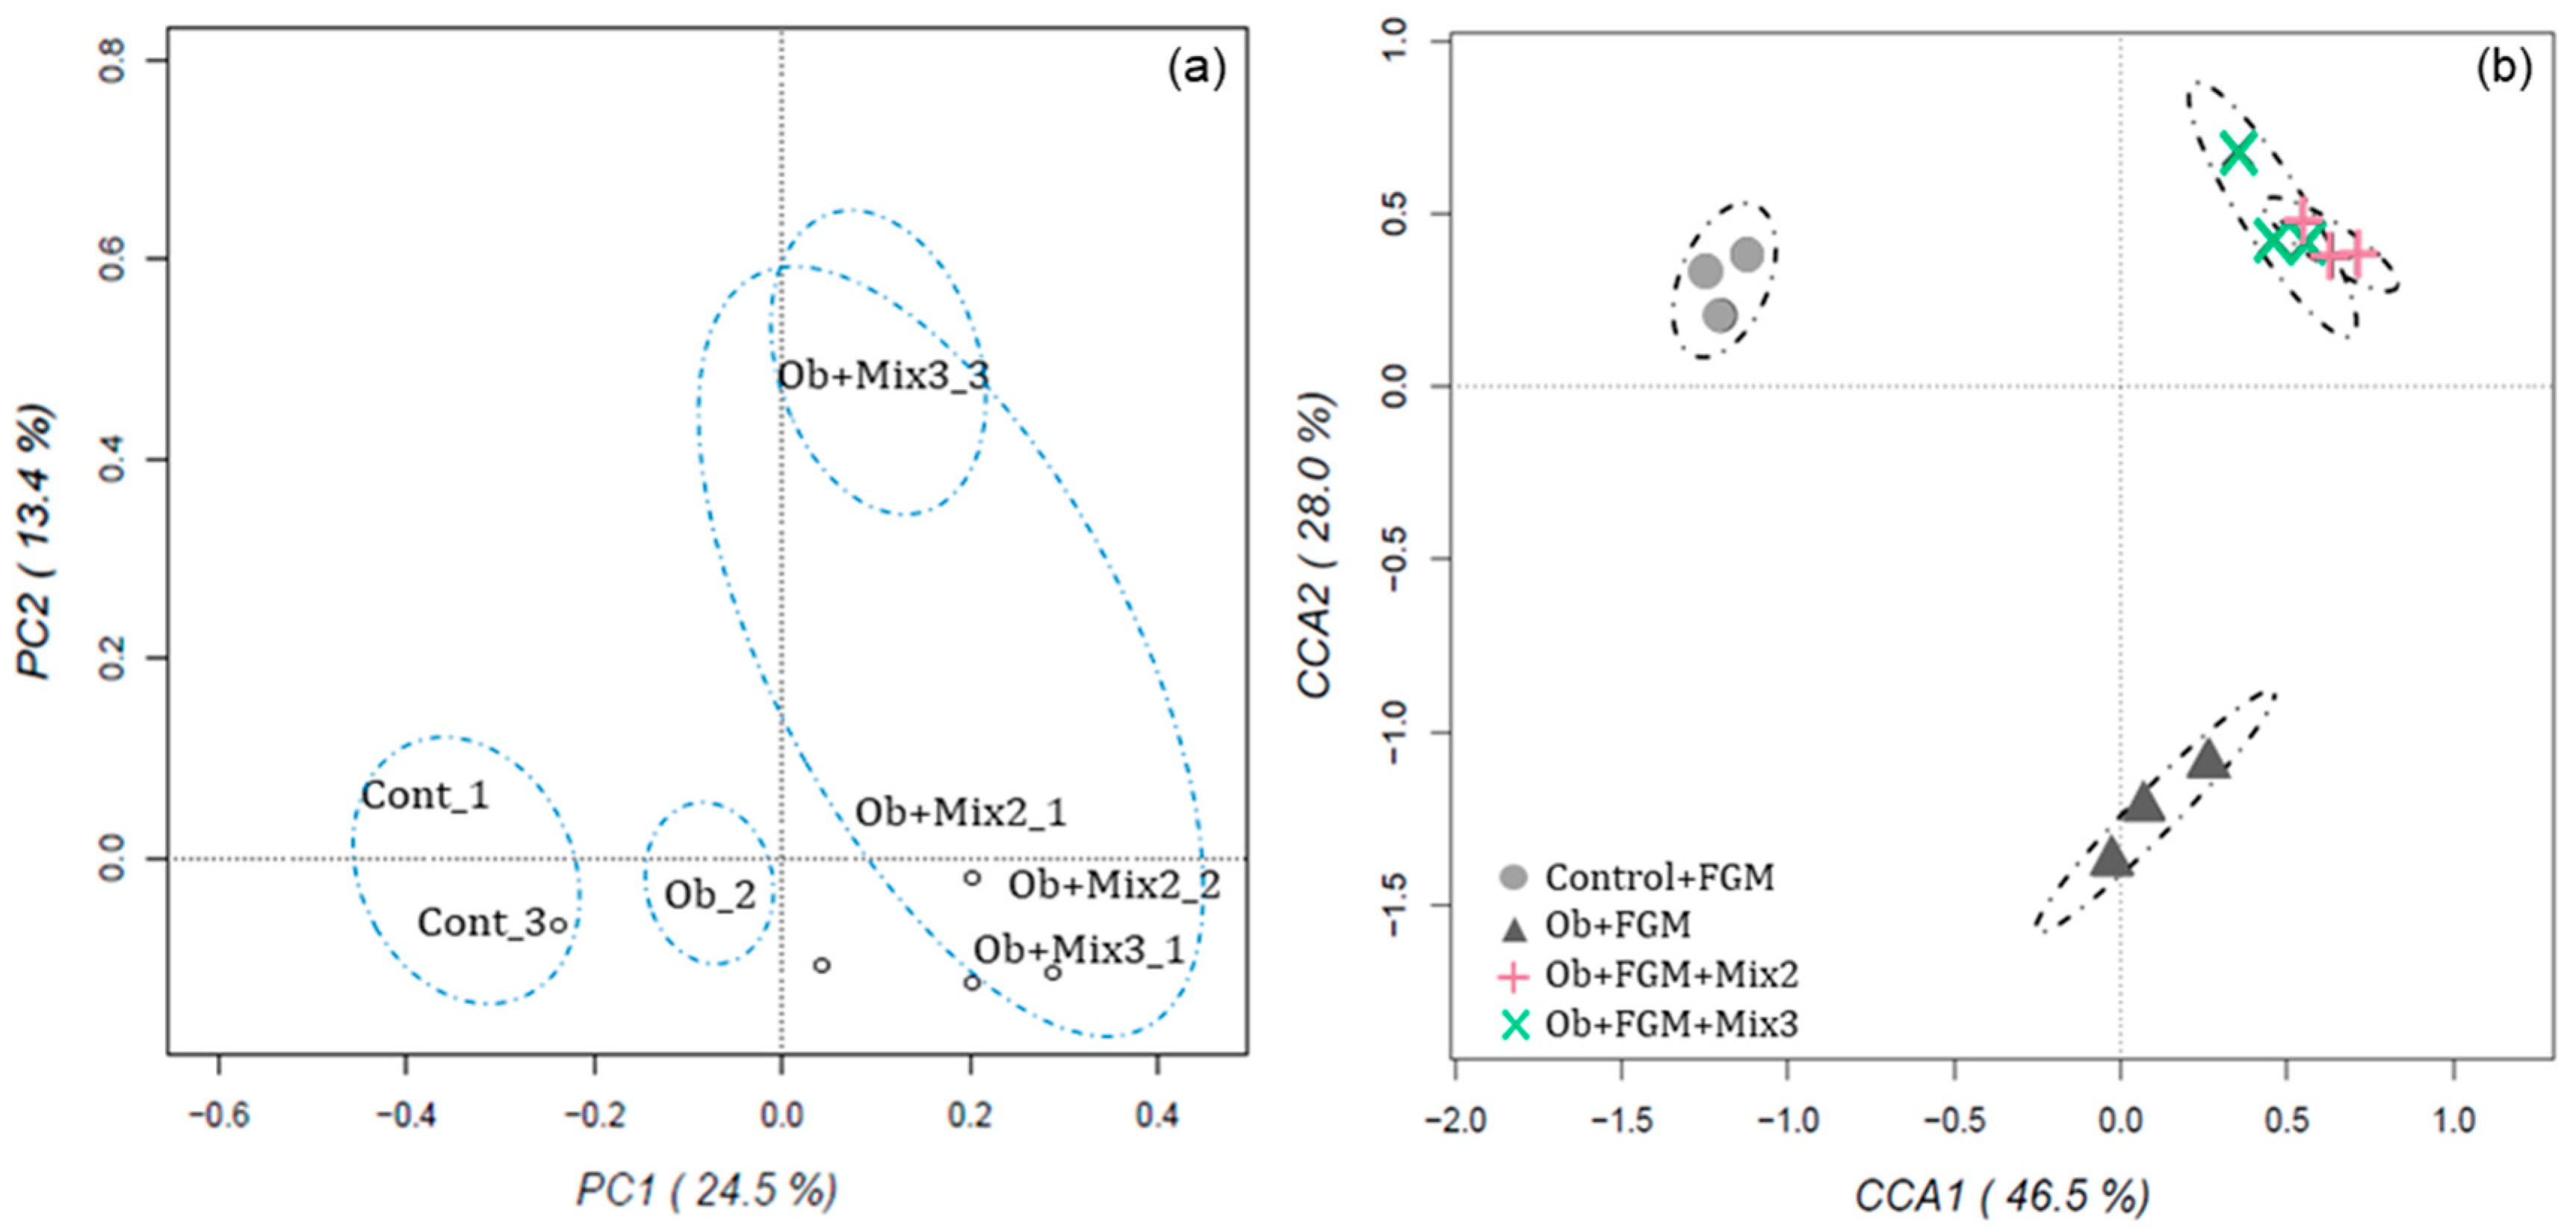
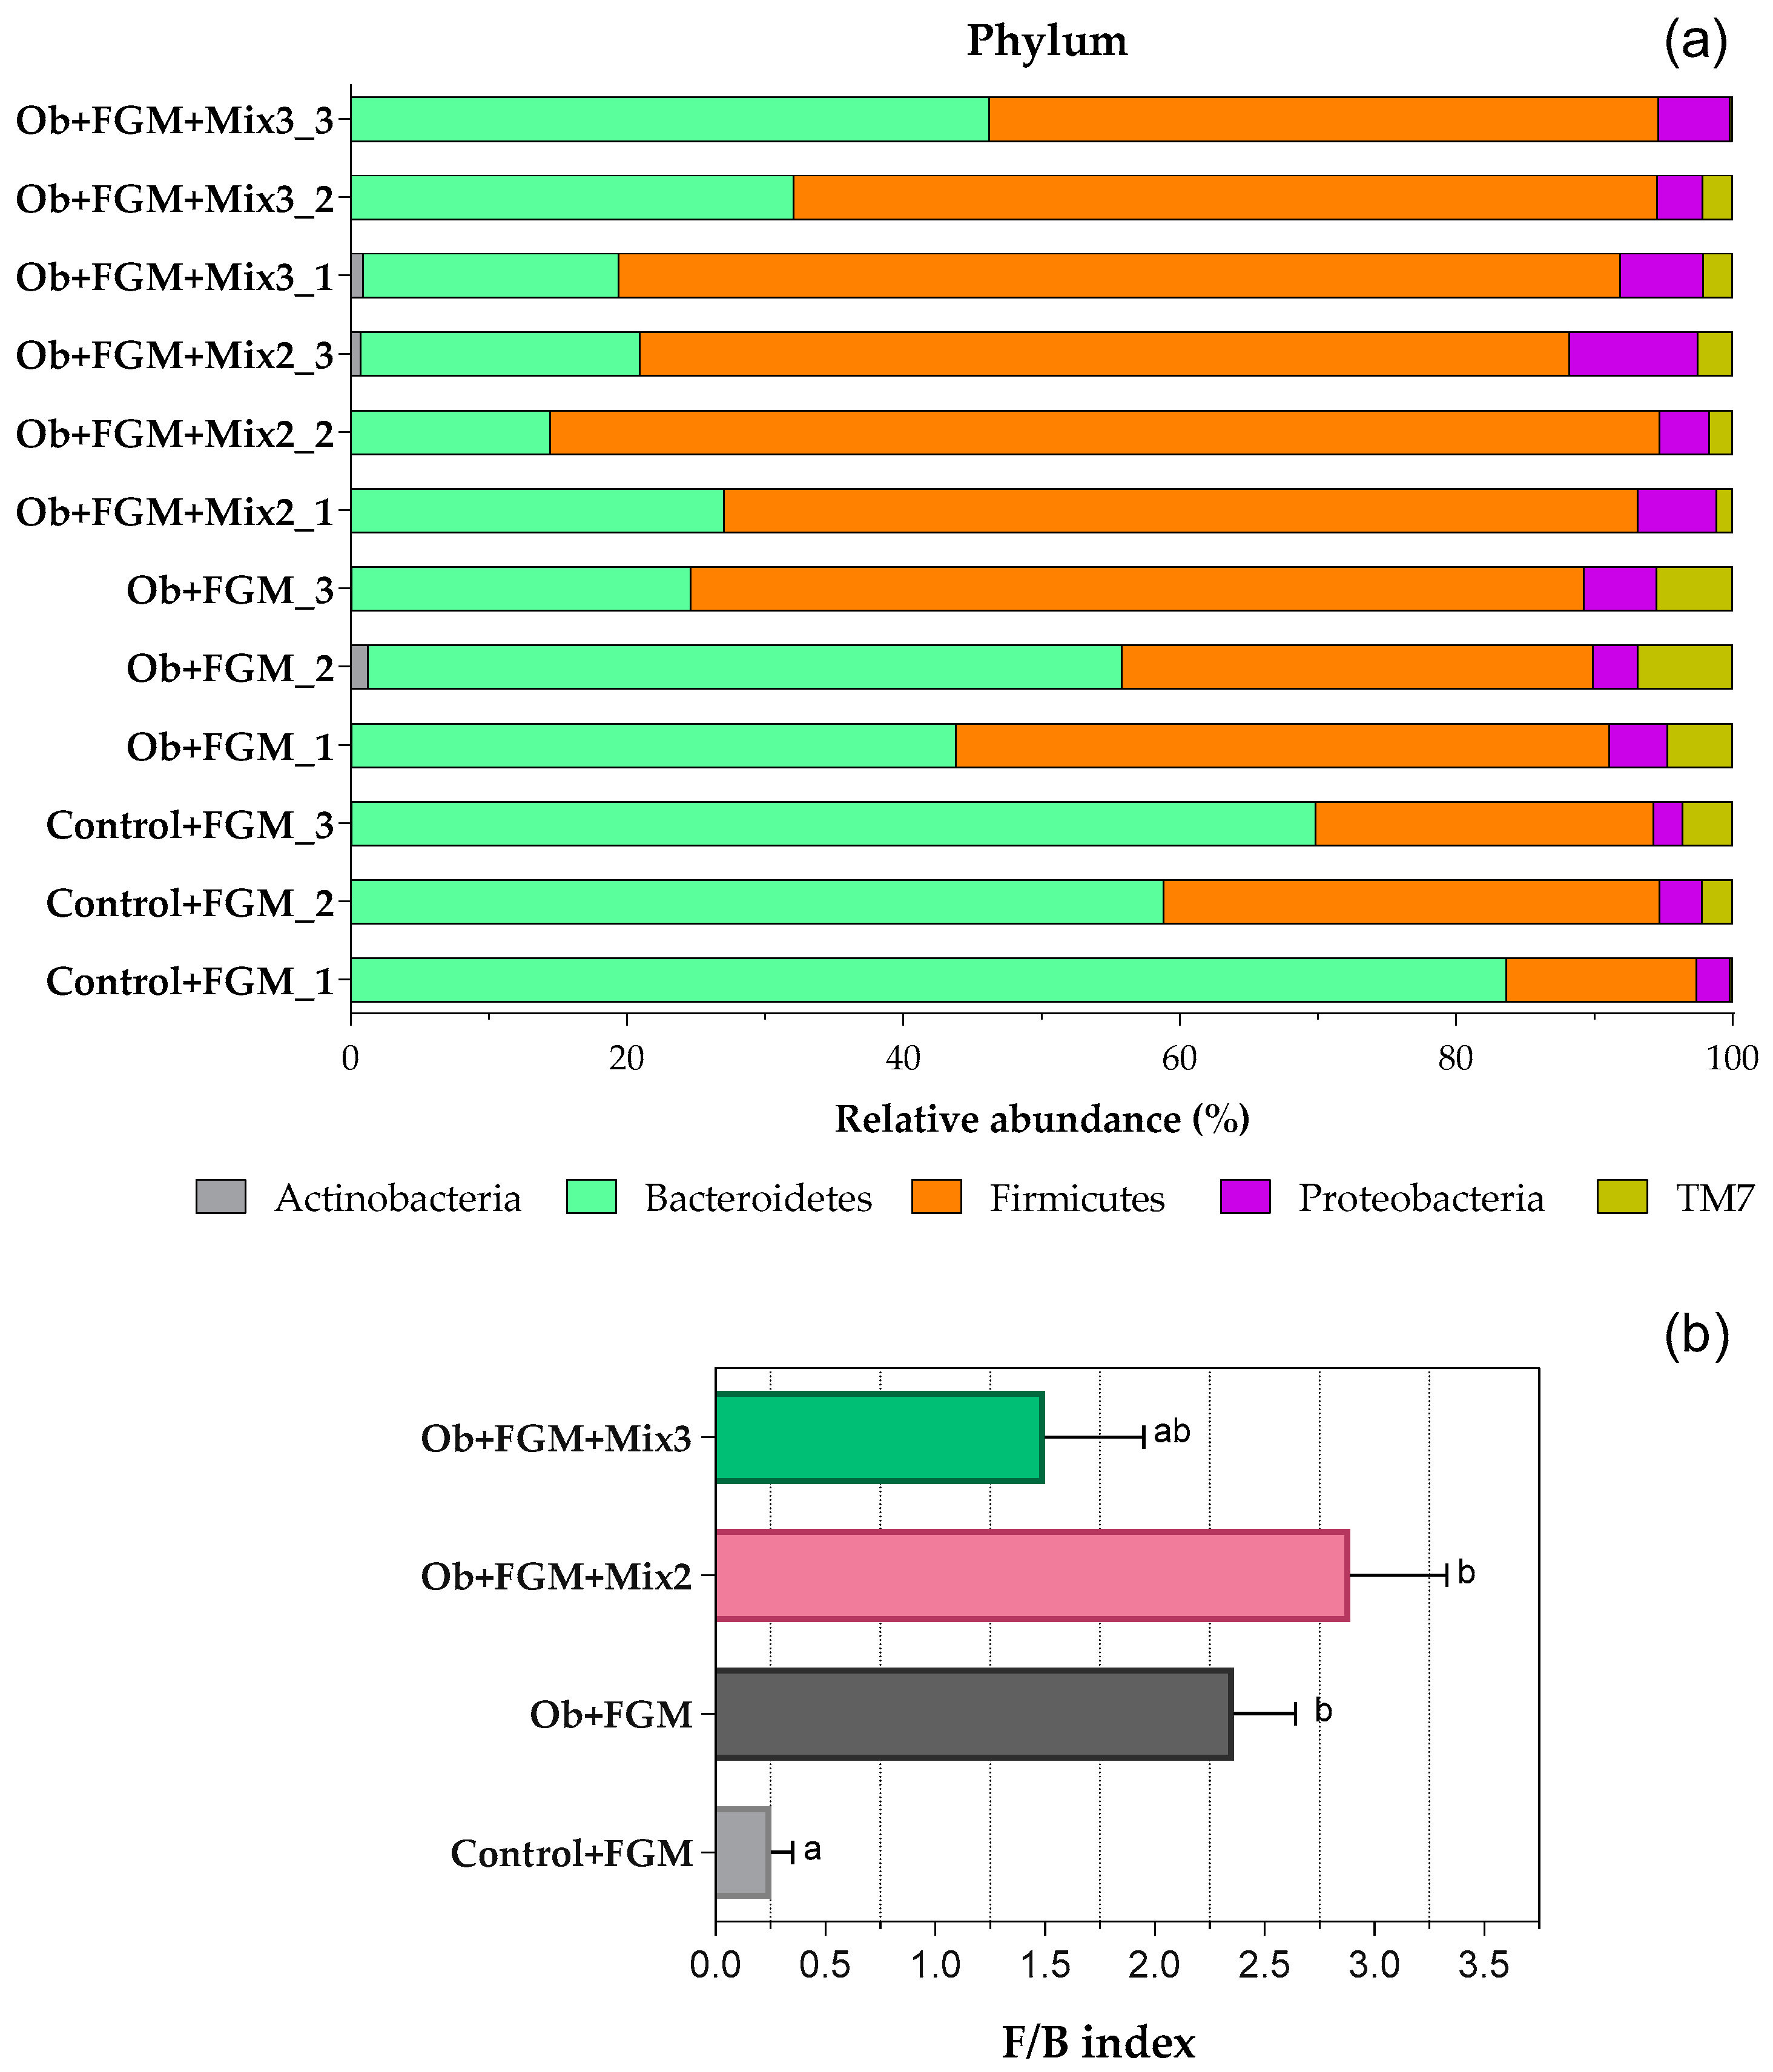
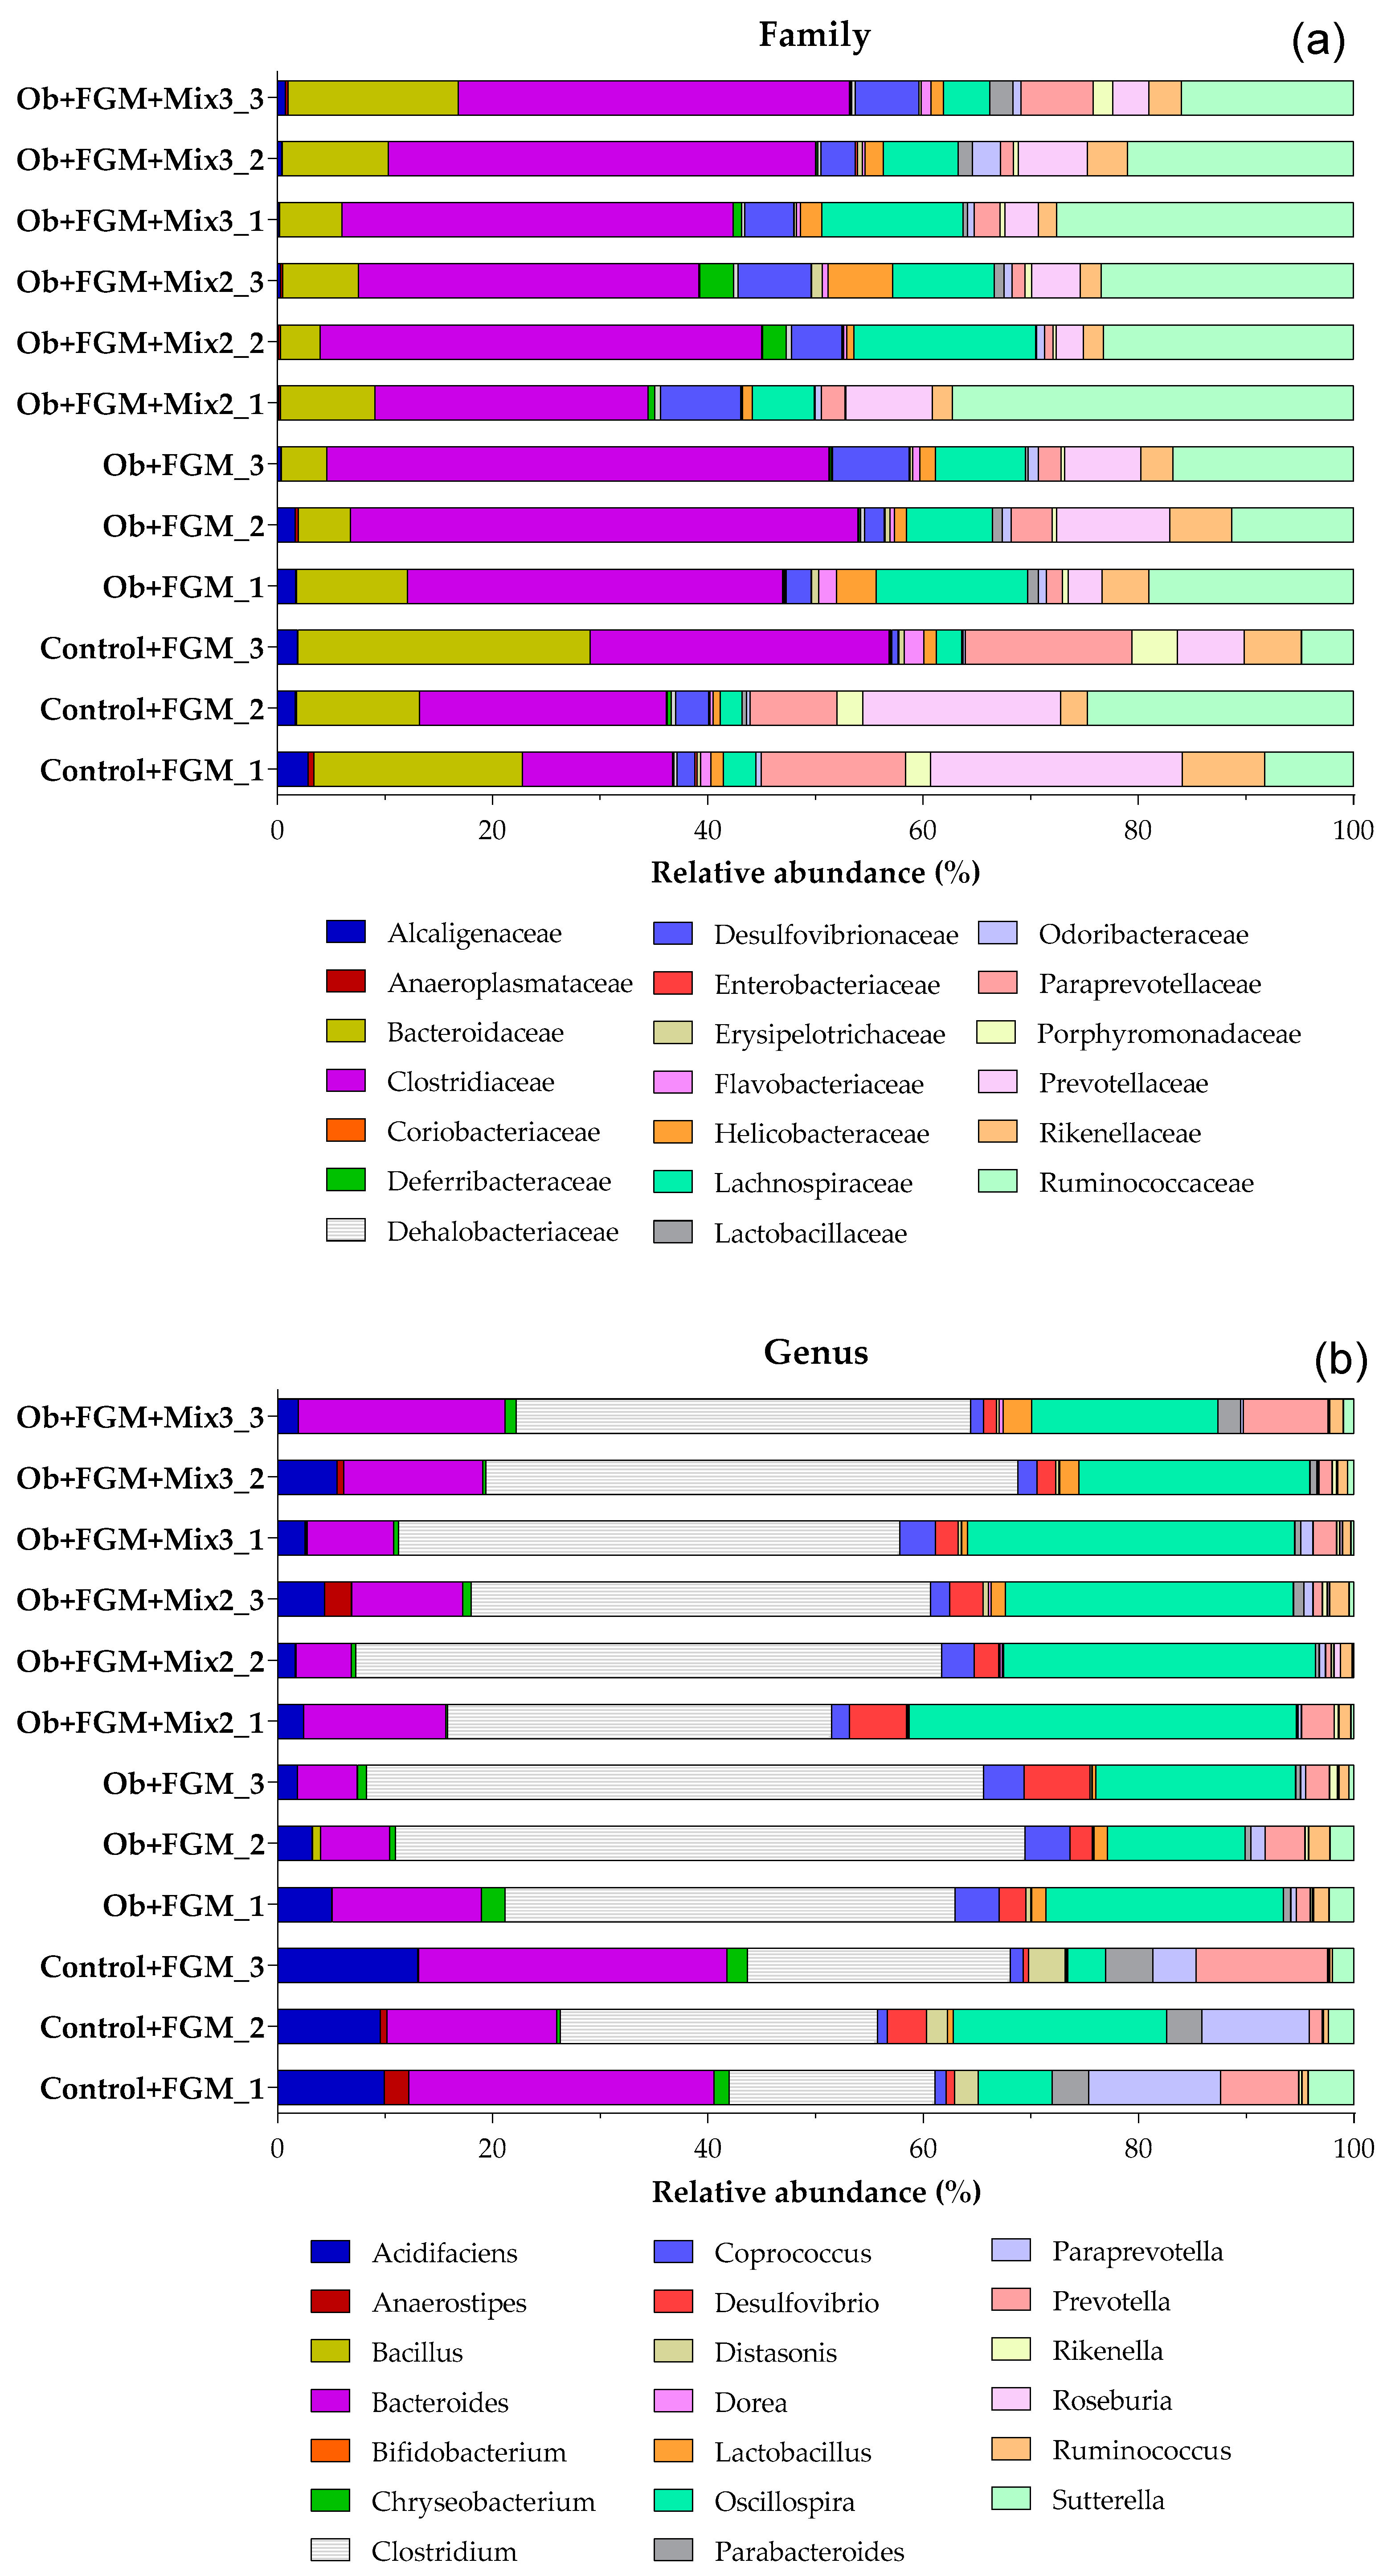
3.5. Determination of the Composition of GM of Obese Mice after Administration of FGM

Considering the best results obtained in nutritional and inflammatory parameters, microbial communities in the fecal content samples from mice from the Control+FGM, Ob+FGM, Ob+FGM+Mix2, and Ob+FGM+Mix3 groups were analyzed by massively parallel sequencing of 16S rDNA amplicons. Table 2 presents the Sobs, Chao, Shannon, and Simpson alpha diversity indices. The species richness indices were calculated based on the species and the abundance of OTUs. The Sobs index was significantly higher in the group treated with FGM+Mix3, indicating greater microbial richness than the rest. The Chao index did not show significant changes between the different groups. In our study, we observed a significant increase in the Shannon index in the group treated with FGM+Mix3 compared to the Ob control. The Simpson’s index was significantly higher in the Ob+FGM+Mix2 and Ob+FGM+Mix3 groups than the Control+FGM group; the richness represented by this last index was not modified by the two FGM supplemented with the mixtures. However, from the analysis of the different indices concerning richness and alpha diversity, we can highlight the Ob+FGM+Mix3 group.
Beta diversity was determined by principal component analysis (PCA) (Figure 5a) and by canonical correspondence analysis (CCA) (Figure 5b). The PCA results indicate that principal components 1 and 2 explain 37.9% of the observed variability. We can observe that the Ob+FGM+Mix2 and Ob+FGMF+Mix3 groups showed more significant variability between individuals since they were grouped apart from the Control groups, both those who received the SD and HFD. The CCA showed that the Ob+FGM group was separated from the bacterial communities of the other three groups along the second principal axis (which explains 28% of the variance). Within these three groups, the Control+FGM group also separated significantly along the first principal axis, whereas a slight separation was observed between the groups receiving FGM supplemented with Mix2 and Mix3. The graph shows that the type of diet administered and the treatment with the two mixtures are important sources that induce variability in the bacterial communities, which explains 32.3% of the variation (p < 0.002) in the fecal microbiota.
Our results demonstrate essential changes in the fecal microbiota composition at the phylum levels (Figure 6a) in experimental groups. The bacterial communities at the phylum level were dominated by Firmicutes and Bacteroidetes, the main bacterial species of the GM, representing around 90% of the total bacteria in the gut, followed by Proteobacteria and TM7. In the Ob+FGM group, an increase in the relative abundance of Firmicutes was observed with a reduction in Bacteroidetes (F/B index) compared to the Control+FGM group; however, when the HFD was supplemented with FGM+Mix2 or FGM+Mix3, no changes in F/B index were observed compared to the Ob+FGM group (Figure 6b).
Changes in the fecal microbiota composition at the family (Figure 7a) and genera levels (Figure 7b) were also observed. At the family level, the Ob+FGM group showed a greater relative abundance of Clostridiaceae, Ruminococcaceae, and Lachnospiraceae and a reduction in Bacteroidaceae and Prevotellaceae compared to the Control+FGM group. The administration of both mixtures induced relative increases in the Ob+FGM group in the families Ruminococcaceae, Lachnospiraceae, Helicobacteraceae, and Deferribacteraceae (mainly Mix2), as well as Bacteroidaceae, Lactobacillaceae, and Paraprevotellaceae (mainly Mix3) (Figure 7a). In the Ob+FGM group, a greater relative abundance of the genera Clostridium, Oscillospira, Coprococcus, Desulfovibrio, Ruminococcus, and Lactobacillus was observed compared to the Control+FGM group. Meanwhile, the genera Bacteroides, Acidifaciens, Prevotella, and Sutterella significantly decreased their abundance (Figure 7b).

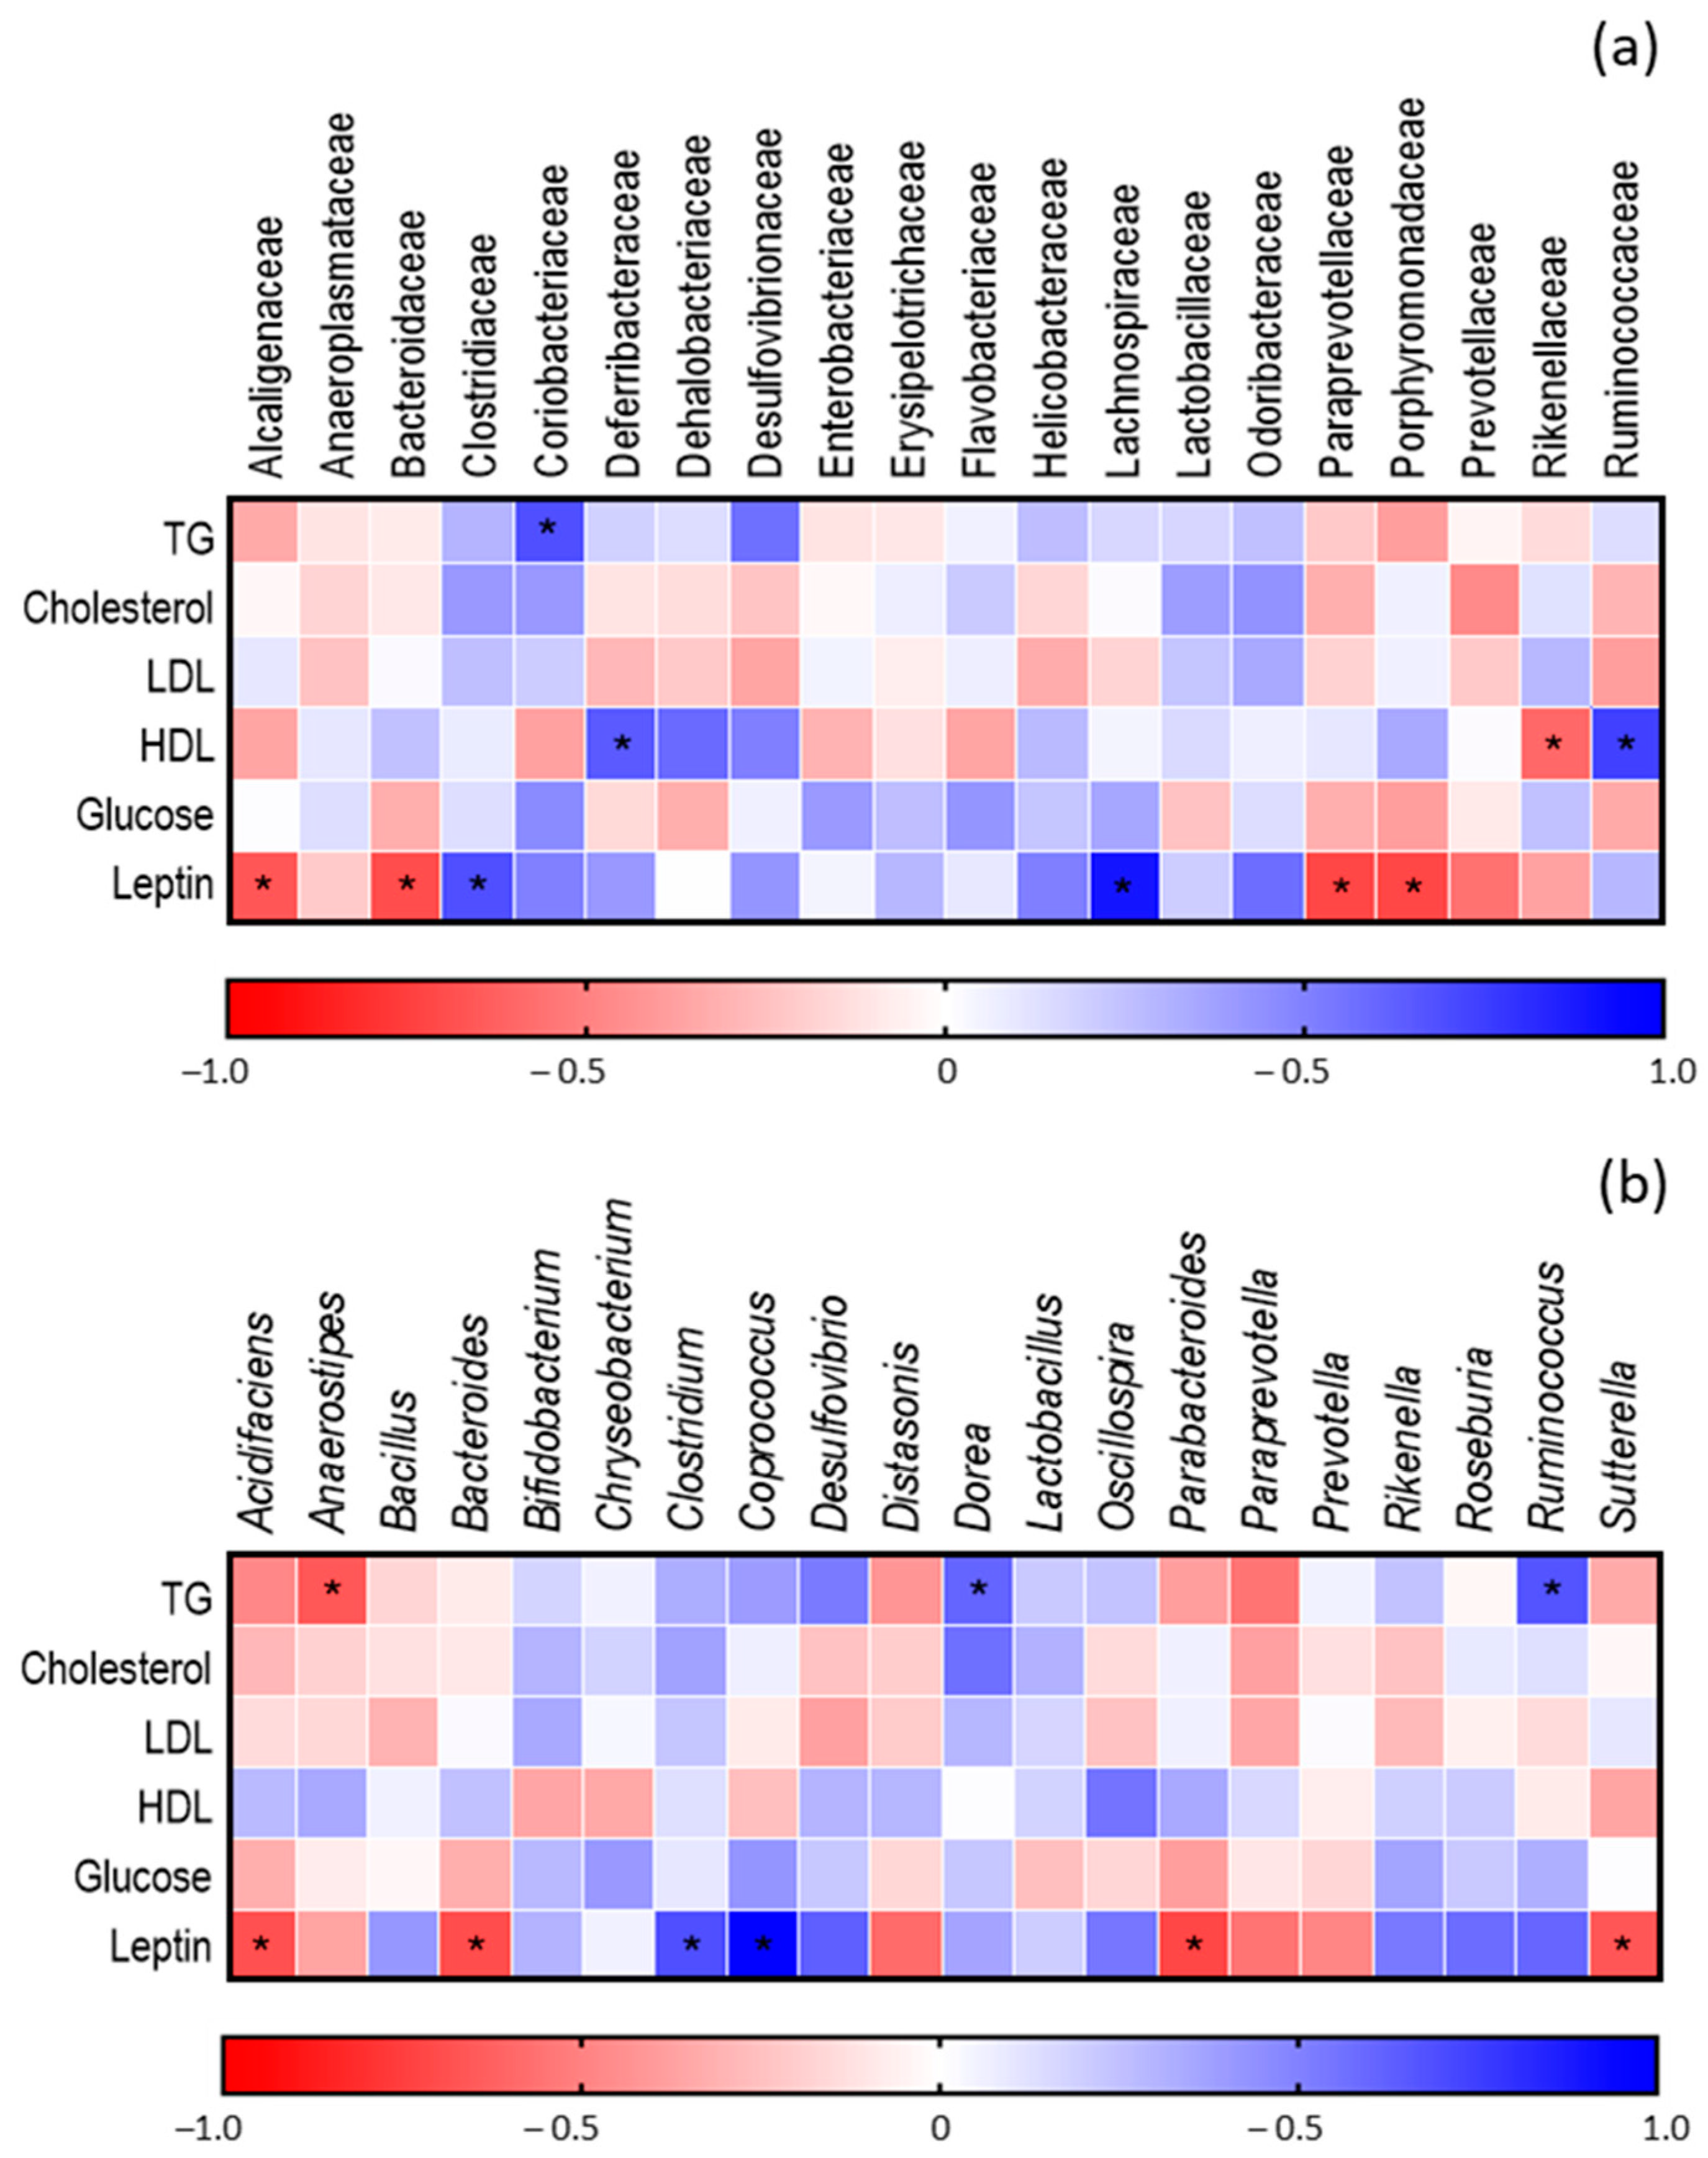
Correlation between GM and Metabolic Parameters

The results of association analysis between metabolic parameters (Figure 4) and GM composition (Figure 7) are illustrated in Figure 8. The results show statistically significant interactions between four microbial families and genera with TG, three significant interactions between microbial families with HDL-c, and twelve significant associations between microbial families and genera with Leptin. The Anaerostipes genus is associated negatively with TG, while the Coriobacteriaceae family and Ruminococcus and Dorea genera denote a positive association. The Rikenellaceae family is negatively associated with HDL-c, while Ruminococcaceae and Deferribacteraceae families present a positive association. Regarding leptin, Paraprevotellaceae Porphyromonadaceae, Bacteroidaceae, and Alcaligenaceae families, and Parabacteroides, Bacteroides, Acidifaciens and Sutterella genera are inversely related. In contrast, Lachnospiraceae and Clostridiaceae families and Coprococcus and Clostridium genera present a positive association. No significant associations are observed between the GM and the other parameters.

4. Discussion

Several authors reported positive results in the treatment and prevention of obesity-related disorders with the use of probiotics in preclinical studies [16]. However, evidence of the use of probiotic-fermented milk is limited and the mechanisms involved are hardly known. In the present study, we investigate the effect of fermented goat’s milk on metabolic parameters in HFD-induced obese mice and its relation to the gut microbiota composition.
In general, between 45 and 60% of the total energy value of obesity-inducing diets in mice and rats comes from lipids. This energy is given either by adding high-fat- and sugar-rich supermarket foods (cafeteria diet) or by increasing the percentage of fat [17]. In the present study, we induced obesity using an HFD, where 60% of energy is derived from the lipid fraction. This diet was sufficient to induce overweight gain in the animals to a degree of moderate obesity (>25% with respect to control) [18]. Some studies in murine animal models indicate that palatable food with high sugar and fat levels induces uncontrolled food consumption, leading to a BWG [19]. Nevertheless, other authors have shown that animals exposed to an HFD reduced food consumption to compensate for the elevated energy intake [20]. In this study, animals receiving an HFD exhibited lower food intake during the experimental protocol but showed greater BWG and FER. These results could be explained as a compensatory mechanism to maintain energy balance due to the HFD being hypercaloric (5.15 Kcal/g) compared to the SD (3.10 Kcal/g). FER is defined as the ability of the animal to convert each gram of food consumed into body weight [21]. Therefore, the development of obesity in mice was not due to hyperphagia but to the increased feeding efficiency. The BWG suggests that the high caloric supply of the diet, especially in the form of lipids, contributed to the accumulation of adipose tissue, which is consistent with the total mass of epididymal fat, which was higher in the Ob group compared to the Control and Control+FGM groups. Based on these results, a histological analysis of the adipose tissue was performed. In male mice, the adipose tissue associated with the epididymis (EAT) constitutes one of the tissues most susceptible to developing inflammation during obesity [22]. In response, the EAT expands, accompanied by marked de novo adipogenesis and an increase in immune cell infiltrations. As evidenced by the AI, regular ingestion of the FGM+Mix2 and Mix3 did not alter fat deposits. Our group obtained similar results in a previous study in HFD-induced obese mice, where the BWG of the Ob group was 40% higher than the Control group, and it decreased by 19, 14, and 15% with the administration of CRL1446, CRL1449, and CRL1472, respectively, reaching values similar to the Control group [11].
In response to excessive fat ingestion, dynamic mechanisms reorganize the adipose tissue by changing the number (hyperplasia) and size (hypertrophy) of adipocytes. In this study, the intake of an HFD increased the percentage of adipocytes with a larger area. Of note, FGM+Mix2 and FGM+Mix3 prevented the increase in the area of adipocytes compared to the Ob group. The CRL1446 strain had already been found to maintain the adipocyte morphology in HFD-fed mice, confirming its effect on controlling obesity [23]. Alteration in adipose tissue remodeling produces changes in the structure of the adipose cells and their functionality, inducing the deregulation of secreted cytokines by adipose tissue, leading to local and systemic inflammation characteristic of obesity [24]. In a previous study, we demonstrated the ability of the strains under study to modulate cytokine secretion in macrophages and adipocytes using an in vitro technique, and we observed that these strains decreased the secretion of the proinflammatory TNF-α and IL-6 molecules compared to that triggered by lipopolysaccharide stimuli. And strains CRL1446 and CRL1447 induce greater secretion of the anti-inflammatory IL-10 cytokine values compared to the basal control of production of macrophages [11]. The effect of Lactobacillus strains on the regulation of the immune system has been previously described [25,26]. Certain strains of probiotics have beneficial effects on immunity because they stimulate host immune responses. Some cytokines regulate the immune system and protect the body from the invasion of microorganisms by activating the inflammatory response. Increases in the concentration of these cytokines, such as TNF-α or IL-6, have also been reported in developing dyslipidemia and obesity [27]. Pothuraju et al. described that the decrease in proinflammatory markers, such as TNF-α and IL-6, in C57BL/6 mice that received an HFD was due to the supplementation of milk fermented with L. plantarum NCDC 625 [28]. Therefore, the effects of probiotics on immunity may be mediated at least in part through decreased concentrations of inflammatory cytokines.
A positive correlation exists between body fat percentage and serum leptin concentration [29], corroborating the increase in BWG and leptin levels observed in the Ob group. These results reflect a state of hyperleptinemia (high levels of leptin), which favors the state of chronic inflammation associated with obesity. In healthy individuals, leptin can reduce food intake and body weight effectively. Initially considered for leptin use in the treatment of obesity, however, obese subjects have been found to have elevated levels of circulating leptin and are insensitive to exogenous leptin administration. This inability of leptin to exert its anorexigenic effects in obese individuals is defined as leptin resistance [30]. The reduction in cytokines and leptin plasma levels as a consequence of the administration of probiotic microorganisms in models of diet-induced obesity has been reported by several authors [13,31]; therefore, the proactive role of probiotics in modulating these inflammatory molecules secreted by adipose tissue provides an effective approach to counteract HFD-induced inflammation and leptin resistance to prevent the progression of obesity [32].
It is crucial to control blood glucose in the early treatment of diabetes. Decreased glucose absorption and circulation can be achieved by inhibiting α-glucosidase, an enzyme that hydrolyzes glycosidic bonds. We previously demonstrated in an in vitro study that CRL1446 shows high inhibition of α-glu (97%), whereas CRL1449 and CRL1472 strains inhibited enzyme activity by 50%; these strains were also able to reduce glucose levels in HFD-induced obese mice [11]. In this study, the Ob group showed higher blood glucose levels than the Control group, but supplementation of FGM+Mix3 significantly lowered the blood glucose levels. Previously, we demonstrated in a model of metabolic syndrome where mice had high blood glucose levels that the CRL1446 strain was able to reduce the HOMA-IR index (a homeostatic model to evaluate insulin resistance) to values similar to those observed in the Control group [33]. Therefore, both in vitro and in vivo results suggested that the study strains could significantly increase glucose tolerance.
High cholesterol levels are commonly associated with dyslipidemia in diet-induced obesity models [33,34]. Several studies reported probiotic products with the potential to lower total plasma cholesterol and LDL-c levels [23,33]. This cholesterol-lowering capacity could be due to different mechanisms, such as bile salt deconjugation and membrane assimilation [35,36]. In a previous study, CRL1446, CRL1449, and CRL1472 showed BSH activity and cholesterol-lowering ability in vitro, and these strains also significantly ameliorated the lipid profile in HFD-induced obese mice [11]. Furthermore, elevated levels of blood lipids are strongly associated with cardiovascular diseases [37]. TGs are the initiators of metabolic changes leading to atherogenic dyslipidemia, an important inducer of atherosclerosis resulting from qualitative and quantitative variations in the distribution of lipoprotein subclasses [38]. The direct relationship between TG and atherosclerosis remains controversial because atherosclerotic plaques mainly contain cholesterol, not TG. However, some studies suggest that TGs indirectly affect disease progression through their association with other genetically regulated components [39]. Several authors have provided evidence supporting the hypolipidemic effects of probiotic strains and foods [40,41]. Li et al. reported that rats that received soy milk fermented with L. plantarum HFY01 increased HDL-c levels and decreased total cholesterol, LDL-c, and TG levels induced by an HFD [42]. HDL-c levels are negatively correlated with the appearance of coronary heart disease; it acts mainly as antiatherosclerosis by promoting the reverse transport of cholesterol, as well as an antioxidant, anti-inflammatory, and antithrombotic. This fermented milk was also able to regulate the expression in the adipose tissue of genes that participate in adipocyte differentiation.
The BWG and metabolic and inflammatory parameters are closely related to the structure of the GM and are affected by diet. The GM is considered a vital organ that produces many metabolites that generate signals regulating metabolism. The complex interaction between GM and diet contributes to overall human health [4]. Using high-throughput sequencing methods to investigate changes in GM, we found that the HFD had a marked effect on GM. The phyla Bacteroidetes and Firmicutes were the most abundant in all groups, which is consistent with other studies in rodents and humans [43], and this diet increased the abundance in phylum Firmicutes while decreasing in Bacteroidetes compared to the SD. No significant difference in the F/B index with the FGM administration was observed; however, as expected, a dysbiotic GM was observed in mice fed the HFD. The ability of the host to obtain energy from the diet is closely related to the F/B index. The obese GM has a more notable ability to extract energy and deposit it in the form of body fat; therefore, a high F/B index has been described as an obese phenotype. [44]. In this sense, it should be noted that recent studies indicated that the associations or conclusions established between the abundance of the phyla Bacteroidetes and Firmicutes and obesity are oversimplifications; this ratio is multifactorial and dependent on other factors than body mass index, such as comorbidities or host genetics. The link between metabolism and microbiota composition is more complex, and genus and species level diversity can better define obesity, associated with dysbiosis, than the F/B index [45].
Although there were no significant changes at the phylum level, the GM composition was significantly changed at the family and genus levels. When both FGM samples supplemented with the mixtures were administered to Ob mice, a positive effect on the Ruminococaceae family and the Ruminococcus genus was observed since their increase is associated with metabolic improvements. Jian et al. found that after a low-calorie diet, an increase in five members of the Ruminococaceae family is observed [46]. Obese mice fed with FGM+Mix3, compared to the Ob+FGM and Ob+FGMF+Mix2 group, showed a greater increase in the Bacteroidaceae and Paraprevotellaceae families. In general, representatives of these enterotypes appear to obtain energy primarily from carbohydrates through fermentation and augment the production of short-chain fatty acid (SCFA) [47]. Nadal et al. reported changes in the microbiota associated with weight loss in obese adolescents, which included increased proportions of Bacteroides–Prevotella [48]. Also, mainly with the administration of Mix3, there was an increase in the Lactobacillaceae family and the Lactobacillus genus, which has already been suggested to be associated with SCFA production and weight change [49]. Our work group demonstrated that CRL1446 induces increases in the Lactobacillus genus in both murine models of obesity and metabolic syndrome [23,33]. Some members of Lachnospiraceae are among the main producers of SCFAs, but it was also found that different taxa of Lachnospiraceae may be associated with various diseases [50]. FGM supplementation with Mix2 induced an increase in the Lachnospiraceae family abundance compared to what was observed in the Ob+FGM group. The relative abundance of the genus Dorea (one of the main genera within this family and producer of SCFAs) was positively affected by the administration of the mixtures, which could favor the production of SCFAs [50]. It is important to note that we observed a higher relative abundance of the genus Oscillospira in the mice that received FGMF supplemented with the mixtures. Several recent studies have indicated that Oscillospira is associated with thinness or lower body mass index in children and adults, including two twin studies [51,52]. In particular, one of these studies showed that members of the genus Oscillospira were highly heritable, enriched in lean individuals, and positively associated with thinness-promoting bacterial species, such as Christensenella minuta [52].
Numerous studies have tried to elucidate the complex link between GM and obesity. Although there is still no consensus about the bacterial populations responsible for the development of obesity, the presence of altered GM in obese people has been confirmed [4,53].
We also attempted to assess the correlation between differences in GM composition and biochemical markers of obesity. Interestingly, a clear, significant correlation was found between TG, HDL-c, and leptin levels and GM at the family and genus levels. Fabersani et al. reported significant negative correlations between the Bacteroides genus and BWG, plasma TG, and several blood proinflammatory markers [54]. Our study also found inverse associations between Bacteroides and leptin, a hormone closely related to body weight and inflammatory parameters. Leptin also showed a negative correlation with the Porphyromonadaceae family; Palmas et al. reported that Porphyromonadaceae, one of the taxa less abundant in the obese rats group compared to the control, were negatively correlated with fat mass [55]. These authors also found a significant correlation between bacterial abundance and metabolic parameters related to obesity in rats fed an HFD, such as body weight, fat mass, leptin, insulin, TG plasma concentrations, glucose tolerance, and insulin sensitivity. Vojinovic et al. identified associations between 32 microbial families and genera with various circulating metabolites in population-based cohorts, including HDL-c, TG, fatty acids, glycolysis-related metabolites, ketone bodies, amino acids, and acute-phase reaction markers [56]. They reported an association between serum TG and genus Ruminococcus gnavus and a negative correlation between the Clostridiacae family with serum TG and body mass index, which is involved in bile acid metabolism. On the contrary, in our study, leptin was positively associated with the Clostridiacae family.
These findings suggest a close interrelationship between the GM composition and mice’s metabolic state, highlighting that GM dysbiosis might be closely involved in the presence and development of obesity. The effect of diet on GM composition offers new approaches to nutritional therapies by manipulating intestinal ecology or introducing specific beneficial microbial species. In this sense, specific probiotics can modulate the GM, prevent chronic low-grade inflammation, and alter energy metabolism associated with obesity [16,29].

5. Conclusions

The administration of FGM with Mix3 significantly impacted host metabolism by reducing BWG, AI, leptin levels, and lipid profiles. Furthermore, it improved and modulated cytokine expression, enhancing the inflammatory status of obese mice. The beneficial effects observed could be related to the positive modulation of GM composition, thus ameliorating the expression of cytokines and the production of different metabolites involved in the control of the inflammatory processes. This functional milk constitutes potential therapeutic and nutritional treatments that allow for the attenuation of the risk factors associated with obesity.

Supplementary Materials

The following supporting information can be downloaded at https://www.mdpi.com/article/10.3390/fermentation10030155/s1. Table S1: Inflammatory status in mice fed with a high-fat diet (HFD) and a standard diet (SD) with and without supplementation of FGM and mixes; Table S2: Biochemical parameters of mice fed with a high-fat diet (HFD) or a standard diet (SD) with and without supplementation of FGM and mixes.

Author Contributions

Conceptualization, A.M. and P.G.-C.; Data Curation, A.M., M.R., C.T. and E.P.; Formal Analysis, A.M., M.R., C.T., P.C. and E.P.; Funding Acquisition, P.C., R.M. and P.G.-C.; Investigation, A.M., M.R. and C.T.; Methodology, A.M., M.R., E.P., R.M. and P.G.-C.; Project Administration, R.M. and P.G.-C.; Resources, P.C., R.M. and P.G.-C.; Software, A.M. and E.P.; Supervision, P.G.-C.; Validation, A.M. and P.G.-C.; Writing—Original Draft Preparation, A.M., P.C., R.M. and P.G.-C.; Writing—Review and Editing, A.M., R.M. and P.G.-C. All authors have read and agreed to the published version of the manuscript.

Funding

This research was funded by FONCyT, grant number PICT-2021-CAT-II-00071 and PICT-2020-03777, and by CONICET, grant number PIP 0406 and PIP 0869.

Institutional Review Board Statement

The animal study protocol was approved by the Ethical Committee of Laboratory Animals Center of CERELA (protocol code CRL-BIOT-EF-2012/2B).

Informed Consent Statement

Not applicable.

Data Availability Statement

The high-throughput sequencing data were deposited in NCBI SRA BioProject. Accession number: PRJNA1078585.

Acknowledgments

The authors are grateful for the technical support provided by Vet. Eduardo Alvarez Villamil and Alejandra de Moreno.

Conflicts of Interest

The authors declare no conflicts of interest.

References

  1. WHO Obesity and Overweight. Available online: https://www.who.int/news-room/fact-sheets/detail/obesity-and-overweight (accessed on 6 April 2020).
  2. Barlow, G.M.; Lin, E.A.; Mathur, R. Chapter 6—An Overview of the Roles of the Gut Microbiome in Obesity and Diabetes. In Nutritional and Therapeutic Interventions for Diabetes and Metabolic Syndrome, 2nd ed.; Bagchi, D., Nair, S., Eds.; Academic Press: Los Angeles, CA, USA, 2018; pp. 65–91. ISBN 978-0-12-812019-4. [Google Scholar]
  3. Sivamaruthi, B.S.; Kesika, P.; Suganthy, N.; Chaiyasut, C. A Review on Role of Microbiome in Obesity and Antiobesity Properties of Probiotic Supplements. BioMed Res. Int. 2019, 2019, 3291367. [Google Scholar] [CrossRef]
  4. Zsálig, D.; Berta, A.; Tóth, V.; Szabó, Z.; Simon, K.; Figler, M.; Pusztafalvi, H.; Polyák, É. A Review of the Relationship between Gut Microbiome and Obesity. Appl. Sci. 2023, 13, 610. [Google Scholar] [CrossRef]
  5. FAO/WHO. Probiotics in Food Health and Nutritional Properties and Guidelines for Evaluation. 2001. ISBN 92-5-105513-0. Available online: http://www.fao.org/3/a0512e/a0512e.pdf (accessed on 6 April 2020).
  6. Hill, C.; Guarner, F.; Reid, G.; Gibson, G.R.; Merenstein, D.J.; Pot, B.; Morelli, L.; Canani, R.B.; Flint, H.J.; Salminen, S.; et al. The International Scientific Association for Probiotics and Prebiotics Consensus Statement on the Scope and Appropriate Use of the Term Probiotic. Nat. Rev. Gastroenterol. Hepatol. 2014, 11, 506–514. [Google Scholar] [CrossRef] [PubMed]
  7. dos Santos, W.M.; Guimarães Gomes, A.C.; de Caldas Nobre, M.S.; de Souza Pereira, Á.M.; dos Santos Pereira, E.V.; dos Santos, K.M.O.; Florentino, E.R.; Alonso Buriti, F.C. Goat Milk as a Natural Source of Bioactive Compounds and Strategies to Enhance the Amount of These Beneficial Components. Int. Dairy J. 2023, 137, 105515. [Google Scholar] [CrossRef]
  8. Ranadheera, C.; Evans, C.A.; Baines, S.K.; Balthazar, C.F.; Cruz, A.G.; Esmerino, E.A.; Freitas, M.Q.; Pimentel, T.C.; Wittwer, A.E.; Naumovski, N.; et al. Probiotics in Goat Milk Products: Delivery Capacity and Ability to Improve Sensory Attributes. Compr. Rev. Food Sci. Food Saf. 2019, 18, 867–882. [Google Scholar] [CrossRef] [PubMed]
  9. Andrada, E.; Marquez, A.; Russo, M.; Gauffin-Cano, P.; Medina, R. Fermented Goat Milk as a Functional Food for Obesity Prevention or Treatment: A Narrative Review. Front. Food Sci. Technol. 2024, 3, 1329037. [Google Scholar] [CrossRef]
  10. Chen, L.; Bagnicka, E.; Chen, H.; Shu, G. Health Potential of Fermented Goat Dairy Products: Composition Comparison with Fermented Cow Milk, Probiotics Selection, Health Benefits and Mechanisms. Food Funct. 2023, 14, 3423–3436. [Google Scholar] [CrossRef]
  11. Marquez, A.; Andrada, E.; Russo, M.; Bolondi, M.L.; Fabersani, E.; Medina, R.; Gauffin-Cano, P. Characterization of Autochthonous Lactobacilli from Goat Dairy Products with Probiotic Potential for Metabolic Diseases. Heliyon 2022, 8, e10462. [Google Scholar] [CrossRef]
  12. de Carvalho Marchesin, J.; Celiberto, L.S.; Orlando, A.B.; de Medeiros, A.I.; Pinto, R.A.; Zuanon, J.A.S.; Spolidorio, L.C.; dos Santos, A.; Taranto, M.P.; Cavallini, D.C.U. A Soy-Based Probiotic Drink Modulates the Microbiota and Reduces Body Weight Gain in Diet-Induced Obese Mice. J. Funct. Foods 2018, 48, 302–313. [Google Scholar] [CrossRef]
  13. Gauffin Cano, M.P.; Santacruz, A.; Trejo, F.M.; Sanz, Y. Bifidobacterium CECT 7765 Improves Metabolic and Immunological Alterations Associated with Obesity in High-Fat Diet-Fed Mice. Obesity 2013, 21, 2310–2321. [Google Scholar] [CrossRef]
  14. Caporaso, J.G.; Lauber, C.L.; Walters, W.A.; Berg-Lyons, D.; Lozupone, C.A.; Turnbaugh, P.J.; Fierer, N.; Knight, R. Global Patterns of 16S rRNA Diversity at a Depth of Millions of Sequences per Sample. Proc. Natl. Acad. Sci. USA 2011, 108 (Suppl. S1), 4516–4522. [Google Scholar] [CrossRef] [PubMed]
  15. Caporaso, J.G.; Lauber, C.L.; Walters, W.A.; Berg-Lyons, D.; Huntley, J.; Fierer, N.; Owens, S.M.; Betley, J.; Fraser, L.; Bauer, M.; et al. Ultra-High-Throughput Microbial Community Analysis on the Illumina HiSeq and MiSeq Platforms. ISME J. 2012, 6, 1621–1624. [Google Scholar] [CrossRef]
  16. Vallianou, N.G.; Kounatidis, D.; Tsilingiris, D.; Panagopoulos, F.; Christodoulatos, G.S.; Evangelopoulos, A.; Karampela, I.; Dalamaga, M. The Role of Next-Generation Probiotics in Obesity and Obesity-Associated Disorders: Current Knowledge and Future Perspectives. Int. J. Mol. Sci. 2023, 24, 6755. [Google Scholar] [CrossRef] [PubMed]
  17. Buyukdere, Y.; Gulec, A.; Akyol, A. Cafeteria Diet Increased Adiposity in Comparison to High Fat Diet in Young Male Rats. PeerJ 2019, 7, e6656. [Google Scholar] [CrossRef]
  18. Hariri, N.; Thibault, L. High-Fat Diet-Induced Obesity in Animal Models. Nutr. Res. Rev. 2010, 23, 270–299. [Google Scholar] [CrossRef]
  19. Moore, C.F.; Schlain, G.S.; Mancino, S.; Sabino, V.; Cottone, P. A Behavioral and Pharmacological Characterization of Palatable Diet Alternation in Mice. Pharmacol. Biochem. Behav. 2017, 163, 1–8. [Google Scholar] [CrossRef] [PubMed]
  20. Hu, S.; Wang, L.; Yang, D.; Li, L.; Togo, J.; Wu, Y.; Liu, Q.; Li, B.; Li, M.; Wang, G.; et al. Dietary Fat, but Not Protein or Carbohydrate, Regulates Energy Intake and Causes Adiposity in Mice. Cell Metab. 2018, 28, 415–431.e4. [Google Scholar] [CrossRef]
  21. Patience, J.F.; Rossoni-Serão, M.C.; Gutiérrez, N.A. A Review of Feed Efficiency in Swine: Biology and Application. J. Anim. Sci. Biotechnol. 2015, 6, 33. [Google Scholar] [CrossRef] [PubMed]
  22. Sárvári, A.K.; Van Hauwaert, E.L.; Markussen, L.K.; Gammelmark, E.; Marcher, A.-B.; Ebbesen, M.F.; Nielsen, R.; Brewer, J.R.; Madsen, J.G.S.; Mandrup, S. Plasticity of Epididymal Adipose Tissue in Response to Diet-Induced Obesity at Single-Nucleus Resolution. Cell Metab. 2021, 33, 437–453.e5. [Google Scholar] [CrossRef]
  23. Fabersani, E.; Marquez, A.; Russo, M.; Ross, R.; Torres, S.; Fontana, C.; Puglisi, E.; Medina, R.; Gauffin-Cano, P. Lactic Acid Bacteria Strains Differently Modulate Gut Microbiota and Metabolic and Immunological Parameters in High-Fat Diet-Fed Mice. Front. Nutr. 2021, 8, 718564. [Google Scholar] [CrossRef]
  24. Longo, M.; Zatterale, F.; Naderi, J.; Parrillo, L.; Formisano, P.; Raciti, G.A.; Beguinot, F.; Miele, C. Adipose Tissue Dysfunction as Determinant of Obesity-Associated Metabolic Complications. Int. J. Mol. Sci. 2019, 20, 2358. [Google Scholar] [CrossRef] [PubMed]
  25. Azad, M.A.K.; Sarker, M.; Wan, D. Immunomodulatory Effects of Probiotics on Cytokine Profiles. BioMed Res. Int. 2018, 2018, 8063647. [Google Scholar] [CrossRef] [PubMed]
  26. Zhao, W.; Liu, Y.; Kwok, L.-Y.; Cai, T.; Zhang, W. The Immune Regulatory Role of Lactobacillus Acidophilus: An Updated Meta-Analysis of Randomized Controlled Trials. Food Biosci. 2020, 36, 100656. [Google Scholar] [CrossRef]
  27. Jung, U.; Choi, M.-S. Obesity and Its Metabolic Complications: The Role of Adipokines and the Relationship between Obesity, Inflammation, Insulin Resistance, Dyslipidemia and Nonalcoholic Fatty Liver Disease. Int. J. Mol. Sci. 2014, 15, 6184–6223. [Google Scholar] [CrossRef] [PubMed]
  28. Pothuraju, R.; Sharma, R.K.; Kavadi, P.K.; Chagalamarri, J.; Jangra, S.; Bhakri, G.; De, S. Anti-Obesity Effect of Milk Fermented by Lactobacillus Plantarum NCDC 625 Alone and in Combination with Herbs on High Fat Diet Fed C57BL/6J Mice. Benef. Microbes 2016, 7, 375–385. [Google Scholar] [CrossRef] [PubMed]
  29. Torres, S.; Fabersani, E.; Marquez, A.; Gauffin-Cano, P. Adipose Tissue Inflammation and Metabolic Syndrome. The Proactive Role of Probiotics. Eur. J. Nutr. 2019, 58, 27–43. [Google Scholar] [CrossRef] [PubMed]
  30. Izquierdo, A.G.; Crujeiras, A.B.; Casanueva, F.F.; Carreira, M.C. Leptin, Obesity, and Leptin Resistance: Where Are We 25 Years Later? Nutrients 2019, 11, 2704. [Google Scholar] [CrossRef] [PubMed]
  31. Roselli, M.; Finamore, A.; Brasili, E.; Rami, R.; Nobili, F.; Orsi, C.; Zambrini, A.V.; Mengheri, E. Beneficial Effects of a Selected Probiotic Mixture Administered to High Fat-Fed Mice before and after the Development of Obesity. J. Funct. Foods 2018, 45, 321–329. [Google Scholar] [CrossRef]
  32. Nakata, M.; Yamamoto, S.; Okada, T.; Gantulga, D.; Okano, H.; Ozawa, K.; Yada, T. IL-10 Gene Transfer Upregulates Arcuate POMC and Ameliorates Hyperphagia, Obesity and Diabetes by Substituting for Leptin. Int. J. Obes. 2016, 40, 425–433. [Google Scholar] [CrossRef]
  33. Russo, M.; Marquez, A.; Herrera, H.; Abeijon-Mukdsi, C.; Saavedra, L.; Hebert, E.; Gauffin-Cano, P.; Medina, R. Oral Administration of Lactobacillus fermentum CRL1446 Improves Biomarkers of Metabolic Syndrome in Mice Fed a High-Fat Diet Supplemented with Wheat Bran. Food Funct. 2020, 11, 3879–3894. [Google Scholar] [CrossRef]
  34. Namekawa, J.; Takagi, Y.; Wakabayashi, K.; Nakamura, Y.; Watanabe, A.; Nagakubo, D.; Shirai, M.; Asai, F. Effects of High-Fat Diet and Fructose-Rich Diet on Obesity, Dyslipidemia and Hyperglycemia in the WBN/Kob-Leprfa Rat, a New Model of Type 2 Diabetes Mellitus. J. Vet. Med. Sci. 2017, 79, 988–991. [Google Scholar] [CrossRef]
  35. Lye, H.-S.; Rahmat-Ali, G.R.; Liong, M.-T. Mechanisms of Cholesterol Removal by Lactobacilli under Conditions That Mimic the Human Gastrointestinal Tract. Int. Dairy J. 2010, 20, 169–175. [Google Scholar] [CrossRef]
  36. Reis, S.A.; Conceição, L.L.; Rosa, D.D.; Siqueira, N.P.; Peluzio, M.C.G. Mechanisms Responsible for the Hypocholesterolaemic Effect of Regular Consumption of Probiotics. Nutr. Res. Rev. 2017, 30, 36–49. [Google Scholar] [CrossRef] [PubMed]
  37. Rawat, S.; Kumar, S.; Arora, M.; Iqbal, S.; Batra, J.; Sharma, S.; Sah, S.P. Assessment of Atherogenic Index of Plasma, Non-HDL Cholesterol and Other Cardiac Indices as Risk Factors for CVD in Type II Diabetes. Int. J. Health Clin. Res. 2020, 3, 137–141. [Google Scholar]
  38. Choi, I.-D.; Kim, S.-H.; Jeong, J.-W.; Lee, D.E.; Huh, C.-S.; Hong, S.S.; Sim, J.-H.; Ahn, Y.-T. Triglyceride-Lowering Effects of Two Probiotics, Lactobacillus Plantarum KY1032 and Lactobacillus Curvatus HY7601, in a Rat Model of High-Fat Diet-Induced Hypertriglyceridemia. J. Microbiol. Biotechnol. 2016, 26, 483–487. [Google Scholar] [CrossRef] [PubMed]
  39. Sharma, A.; Garg, A.; Rout, A.; Lavie, C.J. Association of Obesity with More Critical Illness in COVID-19. Mayo Clin. Proc. 2020, 95, 2040–2042. [Google Scholar] [CrossRef] [PubMed]
  40. Kim, S.-J.; Park, S.; Sin, H.-S.; Jang, S.-H.; Lee, S.-W.; Kim, S.-Y.; Kwon, B.; Yu, K.-Y.; Kim, S.; Yang, D. Hypocholesterolemic Effects of Probiotic Mixture on Diet-Induced Hypercholesterolemic Rats. Nutrients 2017, 9, 293. [Google Scholar] [CrossRef] [PubMed]
  41. Darwish, A.M.G.; Allam, M.G.; Shokery, E.S.; Ayad, E.H.E. Functional Products Fortified with Probiotic LAB Isolated from Egyptian Dairy Sources Showed Hypolipidemic Effects in Albino Rats. PLoS ONE 2022, 17, e0263241. [Google Scholar] [CrossRef] [PubMed]
  42. Li, C.; Liu, H.; Yang, J.; Mu, J.; Wang, R.; Zhao, X. Effect of Soybean Milk Fermented with Lactobacillus Plantarum HFY01 Isolated from Yak Yogurt on Weight Loss and Lipid Reduction in Mice with Obesity Induced by a High-Fat Diet. RSC Adv. 2020, 10, 34276–34289. [Google Scholar] [CrossRef]
  43. Rinninella, E.; Raoul, P.; Cintoni, M.; Franceschi, F.; Miggiano, G.A.D.; Gasbarrini, A.; Mele, M.C. What Is the Healthy Gut Microbiota Composition? A Changing Ecosystem across Age, Environment, Diet, and Diseases. Microorganisms 2019, 7, 14. [Google Scholar] [CrossRef]
  44. Chen, Y.-H.; Chiu, C.-C.; Hung, S.-W.; Huang, W.-C.; Lee, Y.-P.; Liu, J.-Y.; Huang, Y.-T.; Chen, T.-H.; Chuang, H.-L. Gnotobiotic Mice Inoculated with Firmicutes, but Not Bacteroidetes, Deteriorate Nonalcoholic Fatty Liver Disease Severity by Modulating Hepatic Lipid Metabolism. Nutr. Res. 2019, 69, 20–29. [Google Scholar] [CrossRef] [PubMed]
  45. Neves Casarotti, S.; Fernanda Borgonovi, T.; de Mello Tieghi, T.; Sivieri, K.; Lúcia Barretto Penna, A. Probiotic Low-Fat Fermented Goat Milk with Passion Fruit by-Product: In Vitro Effect on Obese Individuals’ Microbiota and on Metabolites Production. Food Res. Int. 2020, 136, 109453. [Google Scholar] [CrossRef] [PubMed]
  46. Jian, C.; Silvestre, M.P.; Middleton, D.; Korpela, K.; Jalo, E.; Broderick, D.; de Vos, W.M.; Fogelholm, M.; Taylor, M.W.; Raben, A.; et al. Gut Microbiota Predicts Body Fat Change Following a Low-Energy Diet: A PREVIEW Intervention Study. Genome Med. 2022, 14, 54. [Google Scholar] [CrossRef] [PubMed]
  47. Chen, Y.; Chang, S.K.C.; Zhang, Y.; Hsu, C.-Y.; Nannapaneni, R. Gut Microbiota and Short Chain Fatty Acid Composition as Affected by Legume Type and Processing Methods as Assessed by Simulated in Vitro Digestion Assays. Food Chem. 2020, 312, 126040. [Google Scholar] [CrossRef] [PubMed]
  48. Nadal, I.; Santacruz, A.; Marcos, A.; Warnberg, J.; Garagorri, J.M.; Moreno, L.A.; Martin-Matillas, M.; Campoy, C.; Martí, A.; Moleres, A.; et al. Shifts in Clostridia, Bacteroides and Immunoglobulin-Coating Fecal Bacteria Associated with Weight Loss in Obese Adolescents. Int. J. Obes. 2009, 33, 758–767. [Google Scholar] [CrossRef] [PubMed]
  49. Joung, H.; Chu, J.; Kim, B.-K.; Choi, I.-S.; Kim, W.; Park, T.-S. Probiotics Ameliorate Chronic Low-Grade Inflammation and Fat Accumulation with Gut Microbiota Composition Change in Diet-Induced Obese Mice Models. Appl. Microbiol. Biotechnol. 2021, 105, 1203–1213. [Google Scholar] [CrossRef] [PubMed]
  50. Vacca, M.; Celano, G.; Calabrese, F.M.; Portincasa, P.; Gobbetti, M.; De Angelis, M. The Controversial Role of Human Gut Lachnospiraceae. Microorganisms 2020, 8, 573. [Google Scholar] [CrossRef] [PubMed]
  51. Tims, S.; Derom, C.; Jonkers, D.M.; Vlietinck, R.; Saris, W.H.; Kleerebezem, M.; de Vos, W.M.; Zoetendal, E.G. Microbiota Conservation and BMI Signatures in Adult Monozygotic Twins. ISME J. 2013, 7, 707–717. [Google Scholar] [CrossRef]
  52. Goodrich, J.K.; Waters, J.L.; Poole, A.C.; Sutter, J.L.; Koren, O.; Blekhman, R.; Beaumont, M.; Van Treuren, W.; Knight, R.; Bell, J.T.; et al. Human Genetics Shape the Gut Microbiome. Cell 2014, 159, 789–799. [Google Scholar] [CrossRef]
  53. Singer-Englar, T.; Barlow, G.; Mathur, R. Obesity, Diabetes, and the Gut Microbiome: An Updated Review. Expert Rev. Gastroenterol. Hepatol. 2019, 13, 3–15. [Google Scholar] [CrossRef]
  54. Fabersani, E.; Portune, K.; Campillo, I.; López-Almela, I.; La Paz, S.M.; Romaní-Pérez, M.; Benítez-Páez, A.; Sanz, Y. Bacteroides Uniformis CECT 7771 Alleviates Inflammation within the Gut-Adipose Tissue Axis Involving TLR5 Signaling in Obese Mice. Sci. Rep. 2021, 11, 11788. [Google Scholar] [CrossRef] [PubMed]
  55. Palmas, V.; Pisanu, S.; Madau, V.; Casula, E.; Deledda, A.; Cusano, R.; Uva, P.; Vascellari, S.; Loviselli, A.; Manzin, A.; et al. Gut Microbiota Markers Associated with Obesity and Overweight in Italian Adults. Sci. Rep. 2021, 11, 5532. [Google Scholar] [CrossRef] [PubMed]
  56. Vojinovic, D.; Radjabzadeh, D.; Kurilshikov, A.; Amin, N.; Wijmenga, C.; Franke, L.; Ikram, M.A.; Uitterlinden, A.G.; Zhernakova, A.; Fu, J.; et al. Relationship between Gut Microbiota and Circulating Metabolites in Population-Based Cohorts. Nat. Commun. 2019, 10, 5813. [Google Scholar] [CrossRef] [PubMed]
Figure 1. Representative photomicrographs of epididymal adipose tissue at ten weeks in mice fed with a high-fat diet (HFD) or a standard diet (SD) with and without supplementation of FGM and mixes. The histological sections were stained with hematoxylin–eosin. The photomicrographs were obtained with a 40× objective. Scale bar: 50 μm. (a) Control; (b) Control+FGM; (c) Ob+FGM; (d) Ob+FGM+Mix1; (e) Ob+FGM+Mix2; (f) Ob+FGM+Mix3; (g) Ob+FGM+Mix4.
Fermentation 10 00155 g001
Figure 2. Number of adipocytes (%) according to their size (μm2) of mice fed with a high-fat diet (HFD) and a standard diet (SD) with and without supplementation of FGM and mixes. Data values (n = 6) are shown as mean ± standard error (SEM). Values with different letters in the same area ranges are significantly different (p < 0.05) as assessed by Tukey’s test.
Fermentation 10 00155 g002
Figure 3. Inflammatory status in mice fed with a high-fat diet (HFD) and a standard diet (SD) with and without supplementation of FGM and mixes. (a) TNF-α; (b) MCP-1, (c) IL-6; (d) IL-10. Data values (n = 6) are shown as mean ± standard error (SEM). Values with different letters are significantly different (p < 0.05), as assessed by Tukey’s test.
Fermentation 10 00155 g003
Figure 4. Biochemical parameters of mice fed with a high-fat diet (HFD) or a standard diet (SD) with and without supplementation of FGM and mixes. (a) Leptin; (b) glucose; (c) triglycerides; (d) cholesterol; (e) LDL-cholesterol; (f) HDL-cholesterol. Data values (n = 6) are shown as mean ± standard error (SEM). Values with different letters are significantly different (p < 0.05) as assessed by Tukey’s test.
Fermentation 10 00155 g004
Figure 5. Analysis of the bacterial community in feces of mice fed with a standard diet (SD) or a high-fat diet (HFD) and fermented goat milk (FGM) with or without supplementation of different strain mixtures. (a) Principal component analysis (PCA). (b) Canonical correspondence analysis (CCA). Dash circle groups mice closely related. The percentages on each axis indicate the variation in the samples.
Fermentation 10 00155 g005
Figure 6. (a) Relative abundance (%) at the phylum level of fecal content of mice fed with a high-fat diet (HFD) or a standard diet (SD) and fermented goat milk (FGM) with or without supplementation of different strain mixtures. The microbial communities present in the samples were analyzed by parallel sequencing of 16S rDNA amplicons. Each bar represents the results of the abundance of each mouse (n = 3) and the five main phyla are presented. (b) Firmicutes (F)/Bacteroidetes (B) index of mice after administration of a high-fat diet (HFD) and fermented goat milk (FGM) with or without supplementation of different strain mixes. Values with different superscript letters in the same column are significantly different (p < 0.05) as assessed by Tukey’s test.
Fermentation 10 00155 g006
Figure 7. Relative abundance (%) at the family (a) and genera (b) level of fecal content of mice fed with a high-fat diet (HFD) or a standard diet (SD) and fermented goat milk (FGM) with or without supplementation of different strain mixtures. The microbial communities present in the samples were analyzed by parallel sequencing of 16S rDNA amplicons. Each bar represents the results of abundance of each mouse (n = 3), and the 20 main families (a) and 20 main genera (b) are presented.
Fermentation 10 00155 g007
Figure 8. Heatmap of correlations between plasma lipids, glucose, and leptin with the 20 main families (a) and genera (b). The relative key color indicates the value of Spearman’s correlation coefficient rho (ρ); red color stands for inverse association and blue color denotes positive associations. (*): significantly correlated pair of variables, p < 0.05. TG: triglyceride, HDL-c: high-density lipoprotein cholesterol, LDL-c: low-density lipoprotein cholesterol.
Fermentation 10 00155 g008
Table 1. Nutritional parameters in mice fed with a high-fat diet (HFD) and a standard diet (SD) with and without supplementation of FGM and mixes.
GroupsBWGDFCFERAI
Control6.88 ± 0.11 a3.42 ± 0.13 c0.026 ± 0.001 a1.12 ± 0.15 ab
Control+FGM8.70 ± 0.61 ab3.37 ± 0.16 c0.037 ± 0.003 ab0.99 ± 0.09 a
Ob+FGM11.99 ± 0.93 c2.48 ± 0.10 a0.063 ± 0.005 c3.48 ± 0.46 d
Ob+FGM+Mix110.44 ± 1.55 bc2.88 ± 0.14 b0.062 ± 0.005 c3.25 ± 0.36 cd
Ob+FGM+Mix28.23 ± 1.38 ab2.55 ± 0.10 a0.042 ± 0.007 b2.25 ± 0.51 bc
Ob+FGM+Mix37.76 ± 0.82 ab2.54 ± 0.08 a0.052 ± 0.003 bc2.07 ± 0.42 ab
Ob+FGM+Mix410.29 ± 0.87 bc2.36 ± 0.08 a0.058 ± 0.002 c3.70 ± 0.30 d
BWG: body weight gain (g); DFC: daily feed consumption; FER: food efficiency ratio; AI: adiposity index. Data values (n = 6) are shown as mean ± standard error (SEM). Values with different superscript letters in the same column are significantly different (p < 0.05) as assessed by Tukey’s test.
Table 2. Alpha diversity indices of the analyzed microbial communities of mice fed with a standard diet (SD) or a high-fat diet (HFD) and fermented goat milk (FGM) with or without supplementation of different strain mixtures.
GroupsSobsChao ShannonSimpson
Control6469 ± 265 a39,238 ± 2981 a5.59 ± 0.06 a40.69 ± 3.4 a
Ob+FGM6889 ± 392 ab42,161 ± 1086 a5.95 ± 0.07 b59.51 ± 8.3 ab
Ob+FGM+Mix26987 ± 516 ab39,232 ± 2280 a6.02 ± 0.16 bc63.26 ± 9.5 b
Ob+FGM+Mix38027 ± 161 b44,138 ± 2016 a6.26 ± 0.05 c74.91 ± 3.4 b
Data values (n = 3) are shown as mean ± standard error (SEM). Values with different superscript letters in the same column are significantly different (p < 0.05) as assessed by Tukey’s test.
Disclaimer/Publisher’s Note: The statements, opinions and data contained in all publications are solely those of the individual author(s) and contributor(s) and not of MDPI and/or the editor(s). MDPI and/or the editor(s) disclaim responsibility for any injury to people or property resulting from any ideas, methods, instructions or products referred to in the content.

