Article

Use of Non-Saccharomyces Yeast to Enhance the Acidity of Wines Produced in a Warm Climate Region: Effect on Wine Composition

by
Fernando Sánchez-Suárez
and
Rafael A. Peinado
*
Department of Agricultural Chemistry, Edaphology and Microbiology, Building Marie Curie 3rd Floor, University of Córdoba, 14014 Córdoba, Spain
*
Author to whom correspondence should be addressed.
Fermentation 2024, 10(1), 17; https://doi.org/10.3390/fermentation10010017
Submission received: 7 November 2023 / Revised: 22 December 2023 / Accepted: 23 December 2023 / Published: 26 December 2023

Abstract

:
One of the most notable effects of climate change, especially in warm regions, is the decrease in acidity (i.e., increase in pH) of wines and a reduction in their aromatic profile. To address this issue, must from a white grape variety with low acidity were inoculated with two non-Saccharomyces yeasts (Lachancea thermotolerans and Torulaspora delbrueckii) to enhance the acidity of the resulting wines. Basic oenological variables and major volatile compounds and polyols of the wines were analyzed, and the results were compared with those obtained through a Saccharomyces cerevisiae strain. Through multiple regression analysis, we found relations between the production of lactic acid to compounds involved in yeast metabolism and redox balance, including glycerol, acetic acid, isobutanol, isoamyl alcohols, and 2-phenylethanol. By means of principal component analysis, we obtained three components that explain more than 89% of the observed variability. The first component differentiates wines produced by L. thermotolerans; the second differentiates wines obtained by S. cerevisiae from those obtained by T. delbrueckii; and the third component is related to the temperature of fermentation. Organoleptic wines produced with S. cerevisiae were the best valuated, but taste was a highlight of the wines produced with L. thermotolerans due to possessing the best acidity.

1. Introduction

Climate change affects all types of crops and environmental processes, resulting in higher temperatures and reduced annual rainfall in Mediterranean climate regions [1]. Furthermore, the precipitation is often intense, causing water to run off instead of being absorbed into the soil. As temperatures continue to rise, crop evapotranspiration (ETo) increases significantly. This will increase the water demand in the plant and subsequently in the soil, which is exacerbated by reduced precipitation and a dry atmosphere [2,3].
The effect of climate change on wine production can be grouped into two areas, i.e., viticulture and oenology. In the domain of viticulture, an advancement in the date of ripening, harvesting, and overall phenology stands out [4,5], resulting in ripening occurring during a warmer time of the year that will negatively affect grape quality and reduce yields, both in terms of quality and quantity. In addition, the increase in temperatures and reduction in precipitation adds to heat waves during the ripening period, which can have very harmful effects on the plant, causing ripening blockages and berry dehydration and shriveling, collectively resulting in a decrease in both quality and quantity of the product [6].
Regarding the oenological aspect, it is worth noting that musts and, consequently, wines show reduced quality, mainly based on an increase in pH and a reduction in titratable acidity because of the malic acid degradation by the high temperatures and harvest delay [4]. As a result, a mismatch between industrial maturity and phenolic maturity is observed. To minimize this gap, grapes are often allowed to overripen, resulting in wines with higher alcohol content. Additionally, lower quantities of phenolic compounds, responsible for color and astringency in red wines, and odorant compounds in red and white wines are synthesized. An increase in temperatures and lower thermal oscillations between day and night also contribute to these properties [7,8].
To mitigate such effects, different strategies can be carried out. Among the viticultural ones, these include a reduction of bunch exposure to sunlight by means of sprawl trellis systems [9]; late pruning to delay the phenological cycle [10,11]; a reduction of the leaf/fruit ratio to delay the harvest date [12,13]; grapevine irrigation [14]; and the application of sun protectants [15,16,17]. In newly established vineyards, it is recommended that one should use grapevine varieties and clones that stand out for their resistance to high temperatures, drought, and delayed vegetative cycle [4,18].
Regarding oenological strategies, the purposes are (i) to increase the acidity of the resulting wines, (ii) to reduce ethanol concentration, and (iii) to enhance the aroma of the wines. These objectives can be achieved with new technologies, such as electrodialysis for the reduction of K+, nanofiltration for the elimination of sugars of the must, dealcoholization of wines, and through the use of non-Saccharomyces yeasts [19,20,21,22,23].
The use of non-Saccharomyces yeasts has multiple effects, one of the most notable being the increase in aroma compounds produced by certain yeasts, such as Torulaspora delbrueckii or Metschnikowia pulcherrima [24,25,26,27,28,29,30]. Specifically, in some studies on the latter yeast, co-inoculations have been found to produce lower amounts of higher alcohols, esters, and fatty acids, but much higher amounts of polyfunctional thiols, such as 3-sulfanylhexan-1-ol, 3-sulfanylhexyl acetate, and 4-methyl-4-sulfanylpentan-2-one. These wines had more positive scores in tastings than those inoculated solely with S. cerevisiae [30].
Another notable effect is the increase in acidity and reduction of pH produced by L. thermotolerans [31], which can produce significant amounts of lactic acid from sugars [32]. This acid is mainly present in wines due to the malolactic fermentation. The increase in lactic acid by this yeast will reduce the addition of tartaric acid to correct must and wine acidity, a common practice in winegrowing regions of warm climates. Several authors have highlighted the improvement in sensory properties related to acidity in wines produced by L. thermotolerans [31,32,33,34,35,36,37,38].
The aim of this paper is to analyze the effect of two non-Saccharomyces yeast strains on the acidity and the production of volatile aroma compounds related to yeast metabolism. To this end, a white grape variety that is scarcely aromatic and low in acidity was used.

2. Materials and Methods

2.1. Experimental Design

White grapes (Vitis vinifera L. cv. Cayetana Blanca) cultivated in Extremadura, Spain (region V, Amerine-Winkler), were used.
Grapes were manually harvested, destemmed, and pressed. The must obtained was divided in eighteen batches of 12 L and was introduced in fermentation tanks of 15 L. Previously, starter cultures of L. thermotolerans (Lt, Level2 Laktia™, Lallemand, Montreal, QC, Canada), T. delbrueckii (Td, Viniferm NSTD™, Agrovin, Alcázar de San Juan, Spain), and S. cerevisiae (Sc, Viniferm Pasión™, Agrovin, Alcázar de San Juan, Spain) were prepared according to the instructions of the provider. The batches were inoculated at a rate of 30 g of yeast per hL. Fermentations were carried out in triplicate and two different temperatures (14 and 21 °C) were assayed for each yeast strain. To control the temperature, the fermentation tanks were provided with a temperature sensor and a double shell through which cold water circulates.

2.2. Determination of Enological Parameters in Must and Wines and Fermentation Kinetics

The pH, volatile and titratable acidity, ethanol, and reducing sugars were measured using official methods [39]. Lactic acid was determined by reflectometry by using the Reflectoquant® test (Merck, Darmstadt, Germany).
The initial must had a sugar concentration of 200 g/L, a pH value of 3.4, and the titratable acidity was 5.3 g/L (expressed as tartaric acid). However, the volatile acidity and lactic acid were under the detection limit.
The fermentation kinetics were monitored by daily measurement of the density using two hydrometers, Pobel, Madrid, Spain with scales of 0.900–1.000 g/cm3 and 1.000–1.100 g/cm3.

2.3. Volatile Compounds Determination

A gas chromatograph and a flame ionization detector (GC-FID) were used for the analysis of major volatile compounds according to the conditions described by Peinado et al. [30]. Based on this protocol, 0.5 μL aliquots of wine samples (10 mL), previously supplied with 1 mL of 4-methyl-2-pentanol as an internal standard (1 g/L), were directly injected in an HP-6890 gas chromatograph, Agilent Technologies, Santa Clara CA, USA, with a capillary column CP-WAX 57 CB (50 m in length, 0.25 mm in internal diameter, and 0.4 μm in coating thickness). Tartaric acid was previously removed from the wine sample by precipitation with 0.2 g of calcium carbonate and subsequent centrifugation of the sample.
To identify the analyzed compounds, standards were injected under the same conditions as the samples. Additional information about LRI to identify volatile compounds is detailed in Table S1. Quantification was carried out by means of the corresponding calibration curve of the standards.
The identification and quantification of aroma compounds were carried out with standard solutions of pure compounds of analytical grade, purchased from Sigma-Aldrich and Merck. Pure water was obtained from a Milli-Q purification system (Millipore, Bedford, MA, USA).

2.4. Organoleptic Analysis

To evaluate the effect of fermentation on the sensory characteristics of the musts, a sensory assessment was carried out. The guidelines outlined in the standard UNE 87-020-93 [40] were adhered to for the preparation of the samples. The test consists of evaluating the wines (color, aroma, and taste) using three quality levels: undesirable, acceptable, and desirable. Furthermore, as recommended by the UNE 87-020-93 standard, the quality levels were assessed based on an increasing scale of scoring for each level [40]. The results were analyzed in accordance with the indications provided by the UNE 87-020-93 standard [40].
The tasting panel consisted of 8 women and 7 men from the research group of the authors who have wide experience in the topic of enology and in the organoleptic analysis of the wines.

2.5. Statistical Analysis

To determine if there were statistically significant differences between the variables analyzed, a multifactorial analysis of variance was performed using the studied variables (yeast strain and the temperature of fermentation). In addition, a multiple regression analysis was carried out to relate the production of lactic acid with some of the determined parameters. Lastly, to identify similarities and differences between the wines obtained in the assayed conditions, cluster and principal component analyses were also performed.
All these statistical analyses were carried out using the Statgraphics Centurion XVII v.2 software, developed by STSC, Inc. (Rockville, MD, USA).

3. Results and Discussion

3.1. Fermentation Kinetics

Figure 1 shows the fermentation kinetics of the assays. Fermentations conducted at 14 °C were slower than those conducted at 21 °C. Particularly, treatments involving must inoculated with S. cerevisiae at 14 °C end 4 days after those conducted at 21 °C. The differences observed in the fermentation duration at both temperatures are more noticeable in the case of non-Saccharomyces yeasts. Some studies have also provided evidence of a similar behavior due to the temperature of fermentation [41].
In relation to non-Saccharomyces yeasts, the fermentation kinetics put in evidence that T. delbrueckii requires a longer adaptation time to the medium. However, once fermentation is initiated, its kinetics are faster than those observed in L. thermotolerans.

3.2. Oenological Parameters

Table 1 shows the oenological parameters of the obtained wines and the results of the multivariate analysis of variance. The factors analyzed were temperature and the yeast strain.
Most enological parameters are dependent on both factors, except for residual sugars, which did not exhibit significant differences due to either yeast strain or temperature. Parameters related to wine acidity (pH, titratable acidity, and volatile acidity) showed significant differences for both factors. This was also the case for lactic acid production. As was reported by several authors [34,38,42,43,44], wines fermented with L. thermotolerans showed higher values of titratable acidity and buffering capacity compared to other wines. This observation is mainly due to the ability of this yeast to produce lactic acid from pyruvate through the action of lactate dehydrogenase enzyme, bypassing conversion into ethanol [32]. This yeast also produced a higher amount of acetic acid in wines, increasing their volatile acidity. The concentration of acetic acid is 0.3 g/L below the established legal limit. Although its concentration is close to the perception threshold, as described later, the tasters did not detect it. Therefore, we can conclude that this increase in volatile acidity compared to the other wines does not pose a problem for organoleptic quality. In this sense, some authors reported, as in our study, an increase in this parameter, whereas others observed that the volatile acidity decreased [24,25,26,27,28,45].
Regarding the ethanol concentration, it was lower in wines produced at 21 °C. Considering that residual sugars did not show significant differences due to the fermentation temperatures, the minor concentration of ethanol could be attributed to its higher volatility at higher temperatures [36].

3.3. Major Volatile Aroma Compounds and Polyols

Major volatile aroma compounds were grouped into four families: higher alcohols and methanol, esters, polyols, and carbonyl compounds (Table 2).
All compounds, except for methanol and 2,3-butanediol (levo), were present in different amounts depending on the yeast strain. Additionally, the temperature significantly influenced the concentration of the analyzed compounds.
Higher alcohols are produced during fermentation due to the metabolism of sugars and amino acids. As reported by Mauricio et al. [37], the yeasts may be able to use amino acids not only as nitrogen sources but also as redox agents to balance the oxidation−reduction potential under conditions of restricted oxygen. In this sense, the production of higher alcohols could depend on the fermentation conditions and on the metabolic pathways of each specific yeast. In line with Azzolini et al. [27], the production of 2-phenylethanol stands out in T. delbrueckii, whose main descriptor is the floral (rose) aroma [46]. The rest of the higher alcohols show similar concentrations between both non-Saccharomyces yeasts.
The second group consists of esters. They can be formed either chemically or through yeast metabolism. Specifically, they are produced as the final step in fatty acid synthesis, which involves the release of Coenzyme A (if it occurs via alcoholysis instead of hydrolysis). This group includes ethyl acetate, ethyl succinate, and ethyl lactate, which are characterized by fruity aromas, except for ethyl acetate, which at high concentrations has an unpleasant aroma of glue and chemicals [46].
L. thermotolerans produced the highest amount of ethyl acetate and ethyl lactate. This can be explained by the highest concentration of both acetic and lactic acids. Probably, lactate formation via NAD-dependent lactate dehydrogenase (LDH) serves to replenish oxidized NAD+ depleted through glycolysis. This fact could alter the redox balance, resulting in the production of acetic acid.
The third group included 2,3-butanediol (levo and meso forms) and glycerol, which is the third most abundant compound in wines after water and ethanol. Glycerol, as described for amino acids, is related to redox balance. It serves as a redox valve to eliminate excess cytosolic NADH under anaerobic conditions and is coupled with acetic acid production [23]. Moreover, T. delbrueckii stood out in the production of polyols, especially 2,3-butanediol (meso), which was not affected by the fermentation temperature. On the other hand, the production of glycerol did not follow a clear trend, as it was produced in higher quantities by T. delbrueckii at low temperatures, and the same was true for L. thermotolerans at 21 °C. Authors, such as Belda et al. [19] and Puertas et al. [35], described a higher production of glycerol by T. delbrueckii than by S. cerevisiae, while, in the review of Benito et al. [24], disparate results were found in the case of L. thermotolerans.
Lastly, the concentration of carbonyl compounds was higher in wine produced with non-Saccharomyces yeasts. Regarding the effect of temperature, it has been observed that there was a significant reduction in these compounds as temperature increased. This may have been due to metabolic deviations at low temperatures, favoring the synthesis of secondary compounds associated with glycerol–pyruvic fermentation.

3.4. Multiple Regression Analysis for Lactic Acid

As described above, the production of lactic acid impacts the redox balance. Additionally, the production of compounds, such as higher alcohols, glycerol, or acetic acid, is also related to the redox balance. To establish a link between the production of lactic acid and some of the compounds involved in the redox balance, we conducted a multiple regression analysis. The results showed that lactic acid production is related to volatile acidity (acetic acid), glycerol, and the higher alcohols isobutanol, isoamyl alcohols, and 2-phenylethanol (see Table 3). Propanol has been excluded because its synthesis is related to α-ketobutyric acid and not to any amino acid.
Based on the results provided by the model, the p-value is less than 0.05, which indicates a statistically significant relationship between the variables with a confidence level of 95.0%.
The R2 statistic indicates that the adjusted model explains 99.10% of the variability in lactic acid values. The Durbin–Watson statistic examines the residuals to determine if there is any significant correlation based on their order in the data file. Since the p-value is greater than 0.05, there is no indication of serial autocorrelation in the residuals with a confidence level of 95.0%. Furthermore, considering the sign of the coefficients for each independent variable, we can conclude that as lactic acid production increased, so did the contents of acetic acid, isobutanol, and isoamyl alcohols, while glycerol and 2-phenylethanol decreased.

3.5. Cluster and Principal Component Analysis

3.5.1. Cluster Analysis

Cluster analysis is an exploratory technique used to classify objects or cases into groups (clusters) based on their similarity. To this end, a group of variables is chosen as classifying factors. The smaller the distance between two clusters, the greater the similarity that exists between the samples that comprise both clusters [47].
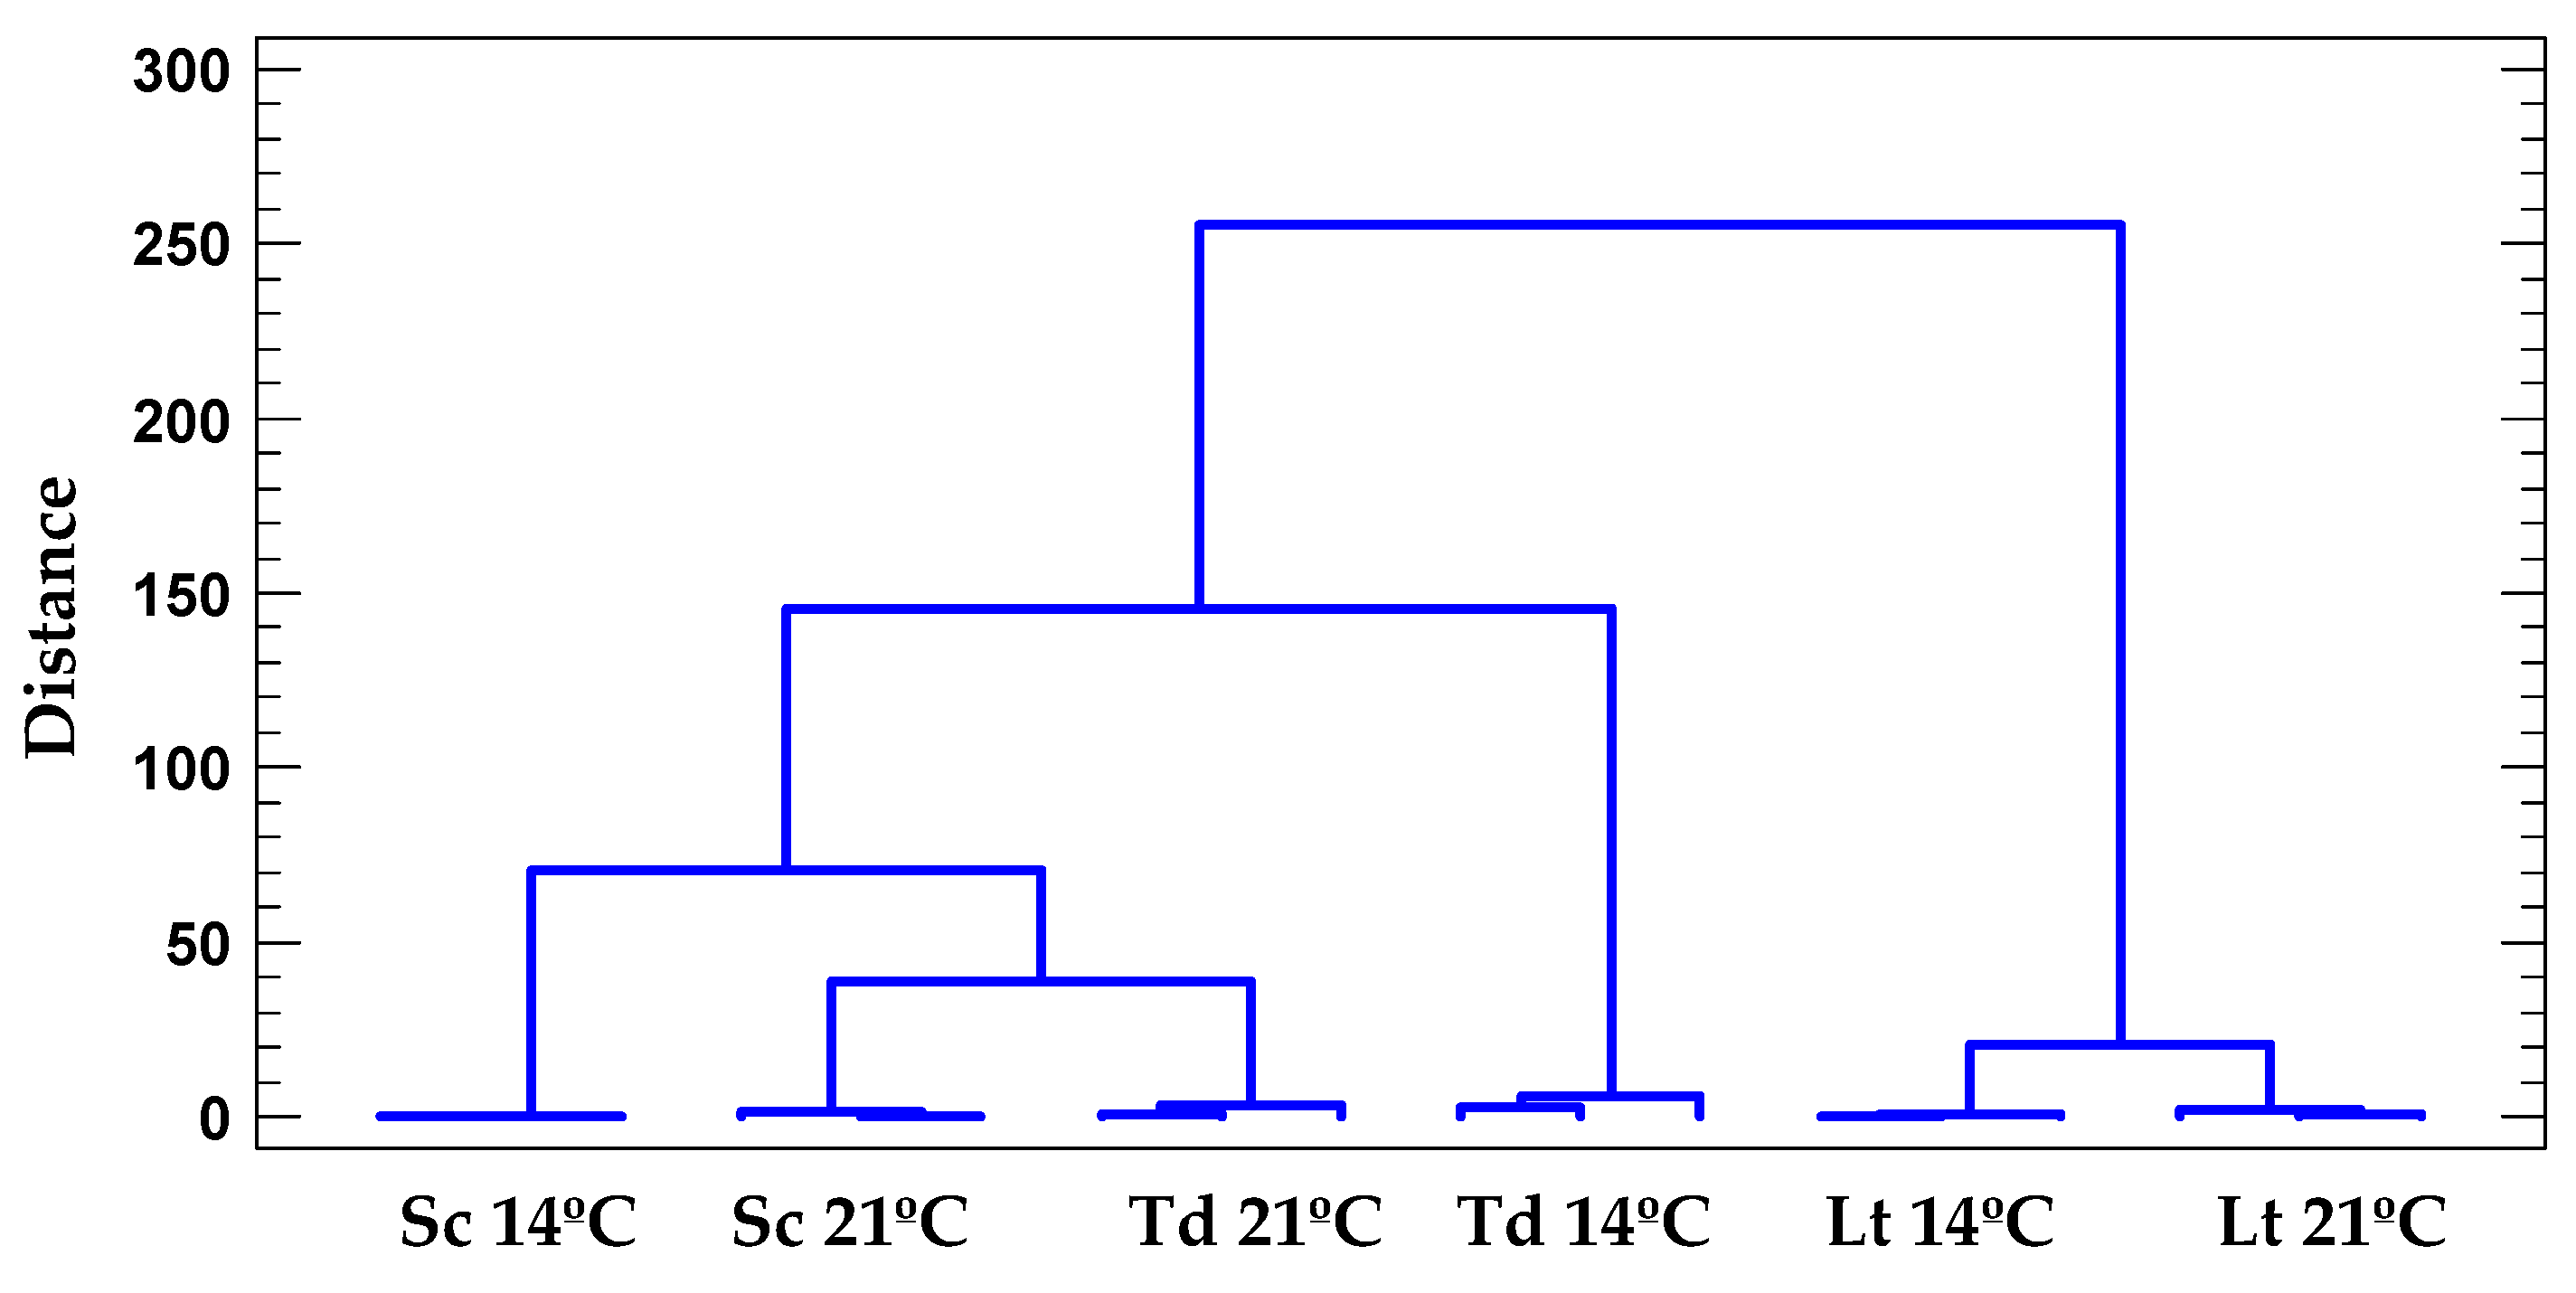
Here, cluster analysis, according to Ward’s method, was carried out, with the classifying variables being the major volatile compounds (except methanol because it is not produced by yeasts), polyols, lactic acid, and acetic acid (Figure 2).
It can be observed that wines produced by L. thermotolerans were quite different than those produced with the two other yeasts. According to the distance of separation between 14 and 21 °C for L. thermotolerans, we can assume that there were scarcely any differences between both wines. The other cluster groups the rest of the wines and, in this case, there were notable differences among wines produced at 14 and 21 °C independently of the yeast used. In this sense, at high fermentation temperatures, wines produced by S. cerevisiae and T. delbrueckii are more similar than those obtained at low temperatures.

3.5.2. Principal Component Analysis

Principal component analysis (PCA) is a multivariate technique of analysis used to reduce the dimensionality of a dataset. To this end, the original variables are transformed into new uncorrelated variables (components). A reduced number of components should explain the greatest variability. Subsequently, the analyst must relate the selected components to one of the sources of variation. In our case, these are the yeast species and the temperature. Several authors have recently used this statistical procedure to relate wine composition with the variables involved in wine production [48].
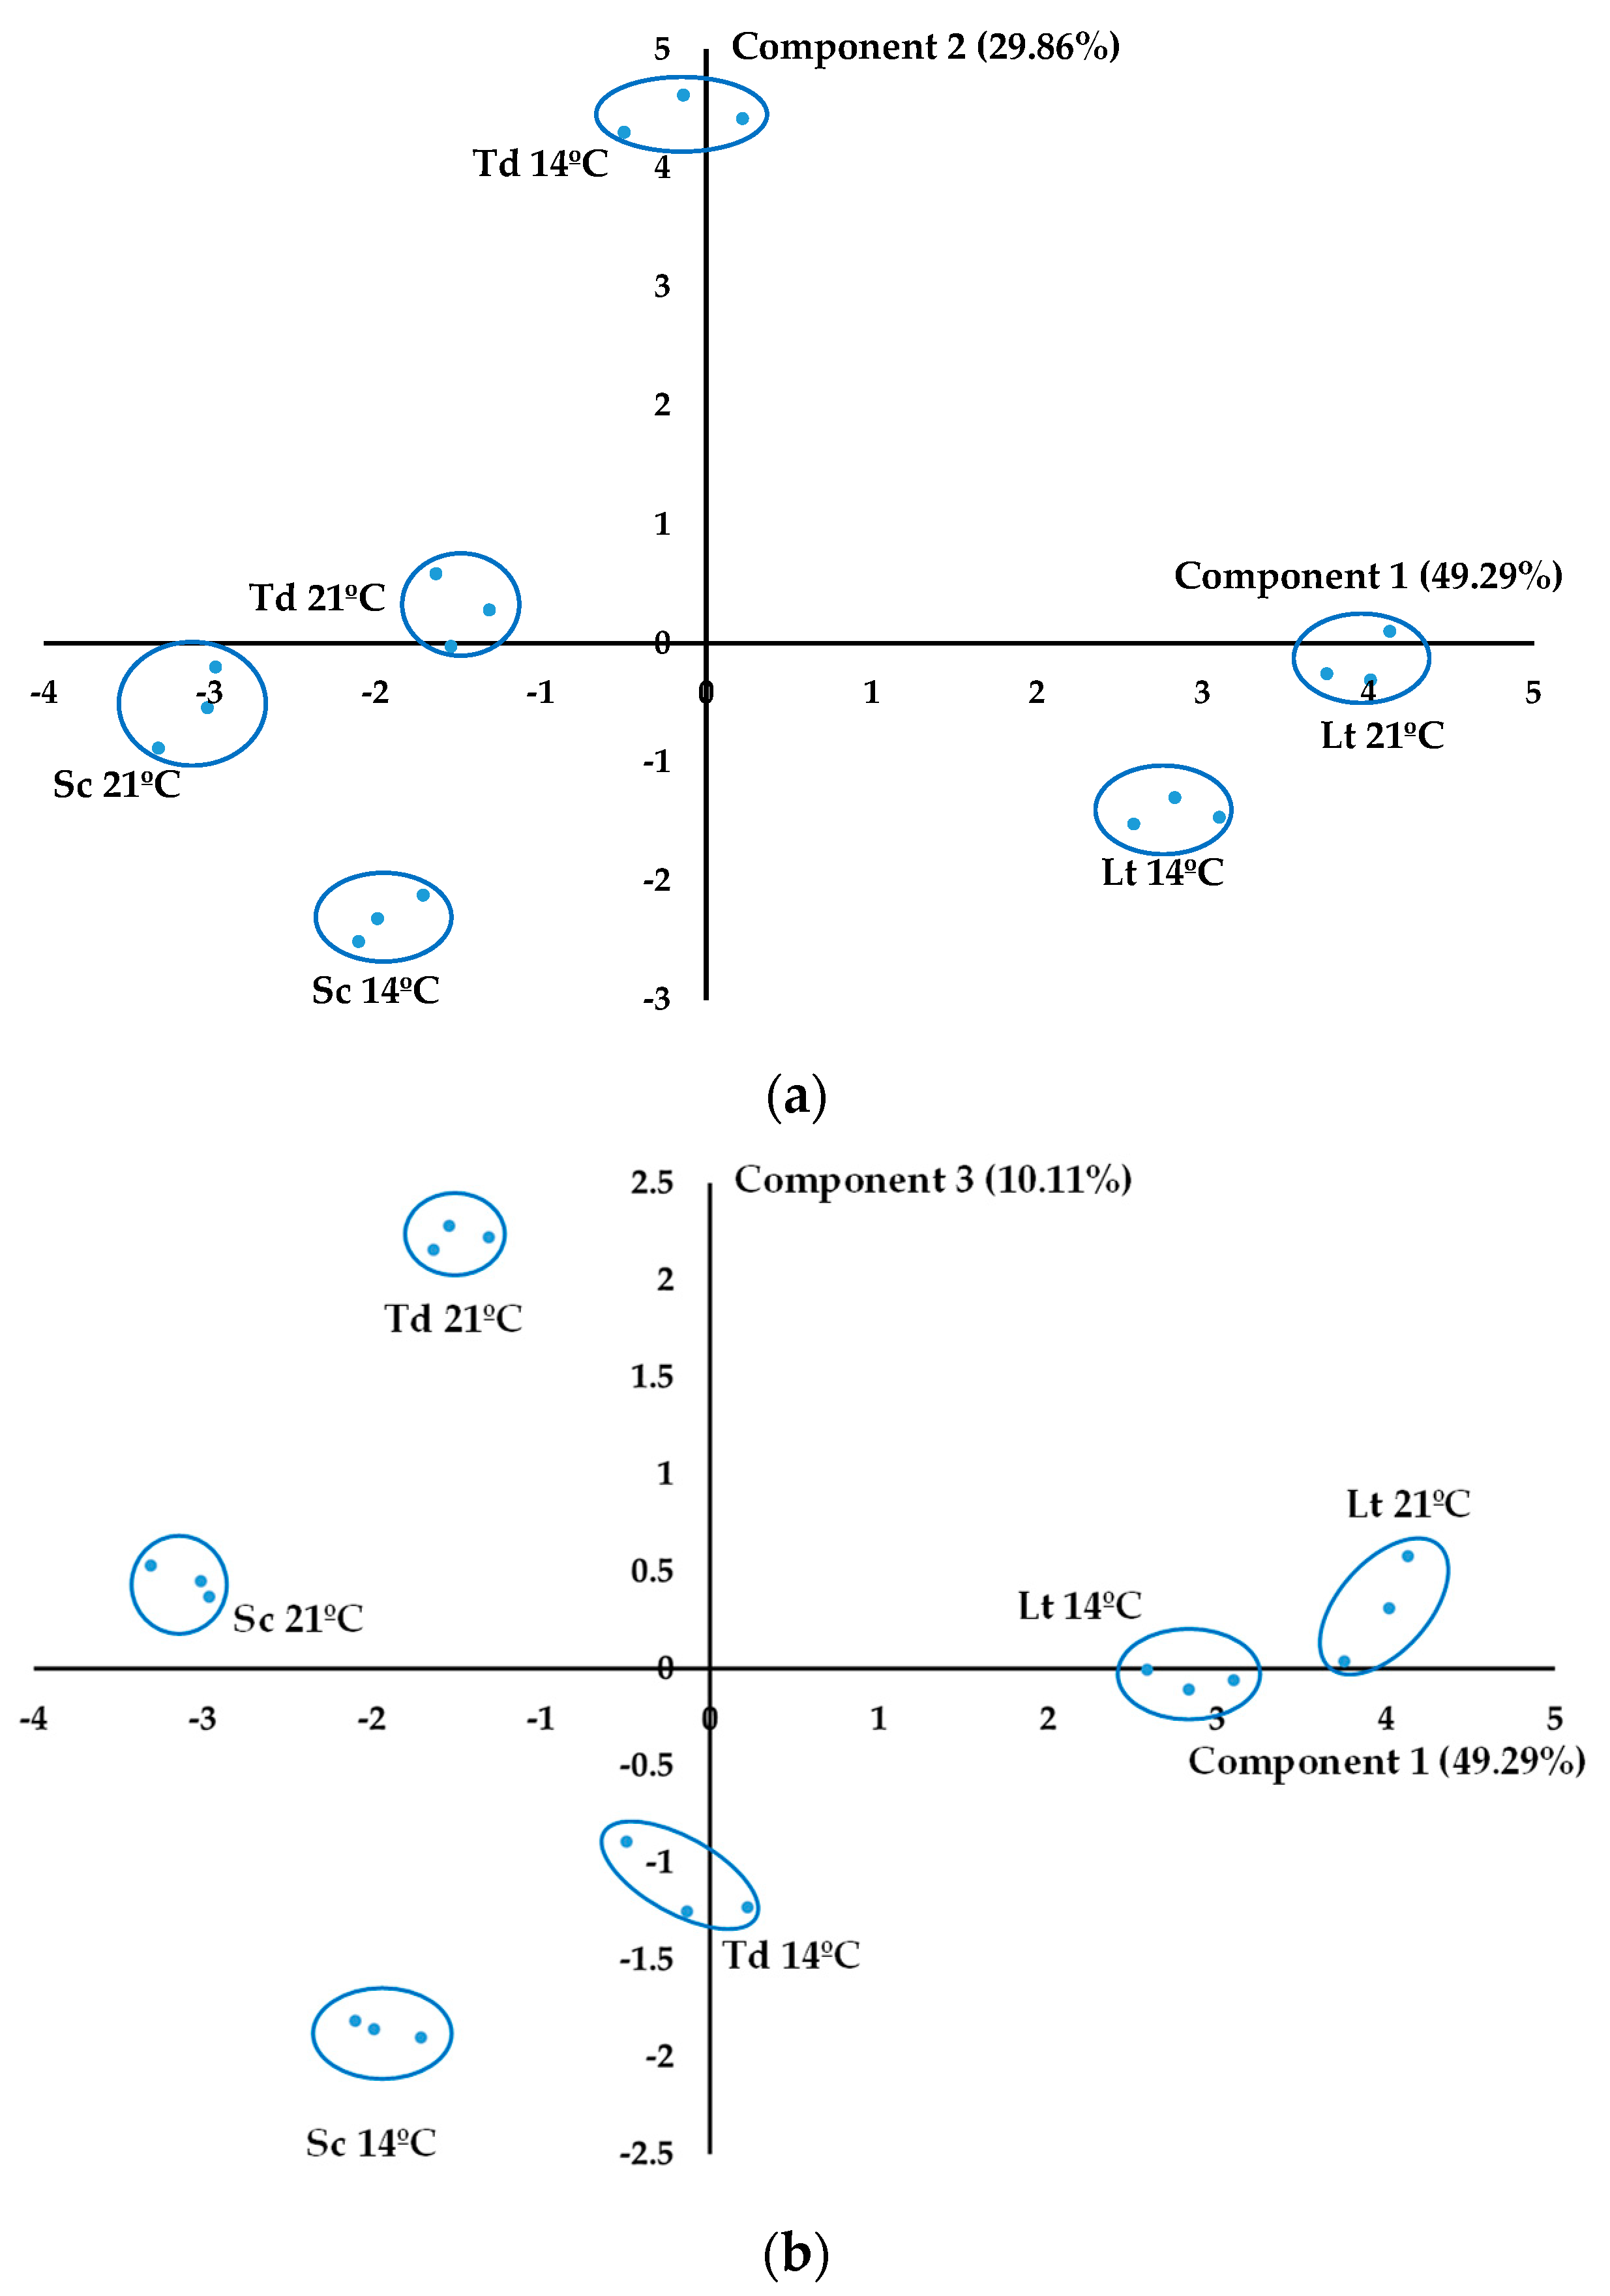
Here, a PCA was performed, using as classifying variables the major volatile compounds (except methanol, because it is not produced by yeast), polyols, lactic acid, and acetic acid (Figure 2). The first three components explained 89.26% of the observed variability.
Specifically, the first principal component explained 49.29% of the variability and distinguished between wines produced by L. thermotolerans and the rest of the wines (Figure 3a). The variables with the highest weight in such differentiation were lactic acid, propanol, ethyl acetate, ethyl lactate, and acetoin (Table 4), all of which were positively correlated with L. thermotolerans.
The second component (29.86% of the variability) differentiates between wines produced with T. delbrueckii (positive values of the second component) and those obtained with S. cerevisiae. Isoamyl alcohols, diethyl succinate, and 2,3-butanediol (meso) were the compounds involved in such differentiation (Table 4).
The third component (10.11% of the variability) discriminates between wines produced with T. delbrueckii and S. cerevisiae at different temperatures. As can be seen in Figure 3b, positive values of the third component contain wines obtained at 21 °C and negative values contain the wines obtained at 14 °C. For these wines, the compounds related to the fermentation temperature were 2-phenylethanol and glycerol (Table 4).

3.6. Organoleptic Characterization

Figure 4 and Figure 5 show the distribution of frequencies of the evaluations given by the tasting panel at 14 and 21 °C, respectively. Additionally, the medians (dark bars) and the trend lines are provided. At both temperatures, wines obtained with the S. cerevisiae yeast strain received higher ratings. Taking into account the number of responses categorized as acceptable and desirable, it appears that wines produced at 21 °C were rated higher than those produced at 14 °C.
Visually, tasters prefer wines produced with L. thermotolerans at 14 °C as they were characterized by greater clarity and brightness. All wines showed color nuances from green to pale yellow, except for those fermented with T. delbrueckii at 21 °C, which exhibited a slight turbidity problem and a more brownish hue.
Regarding the aroma notes, the tasters were asked to give the aromatic descriptor that was detected (Supplementary Material Figures S1 and S2). In the aromatic phase, control wines stood out positively compared to those fermented by non-Saccharomyces yeasts. S. cerevisiae showed positive floral and fruity notes at both temperatures, and T. delbrueckii showed fruity, herbaceous, and vegetal notes at 21 °C. On the other hand, L. thermotolerans stood out for aromas, such as vegetal and nuts at 14 °C and toasted notes at 21 °C, while negative aromas, such as chemical and pungent aromas, were detected at both temperatures.
In the taste phase, wines fermented with L. thermotolerans stood out in terms of acidity, freshness, and persistence at both temperatures.

4. Conclusions

L. thermotolerans significantly increases acidity levels due to the high production of lactic acid. Although there is still little knowledge of the routes involved in the production of this acid, in our study, we have been able to correlate its formation with a higher production of isoamyl alcohols, isobutanol, and acetic acid and a lower production of glycerol and 2-phenylethanol.
The principal component analysis showed that the compounds that contribute the most in differentiating between the wines produced by L. thermotolerans are lactic acid, ethyl lactate, ethyl acetate, propanol, and acetoin, while isoamyl alcohols, diethyl succinate, and 2,3-butanediol (meso) are related to the differentiation of the wines produced by T. delbrueckii from those obtained with S. cerevisiae. Finally, although the temperature does not have a significant effect on wines produced by L. thermotolerans, it does contribute to differentiating between the rest of the wines, with the compounds that contribute the most being glycerol and 2-phenylethanol.
In relation to the organoleptic analysis, the wines preferred by the tasting panel were the control wines, although the wines fermented with L. thermotolerans were also well-liked and received a similar score to the control wines. Lastly, the wines fermented with T. delbrueckii received the lowest score.
In conclusion, fermentation with L. thermotolerans is a great option for the natural acidification of wines from musts with low acidity. However, further research is needed to deepen the understanding of the metabolism of this yeast and its relationship with fermentation conditions. This should be done with the aim of increasing the beneficial effects on the analytical and organoleptic characteristics of wine while reducing the undesirable effects.

Supplementary Materials

The following supporting information can be downloaded at: https://www.mdpi.com/article/10.3390/fermentation10010017/s1, Table S1: Major aroma compounds identified in the wines. Figure S1: Aroma descriptors detected by the tasting panel in the wines produced at 14 °C. The number of times that the tasters detected a given aroma note is shown for Saccharomyces cerevisiae (SC); Torulaspora delbrueckii (TD); and Lachancea thermotolerans (LT). Figure S2: Aroma descriptors detected by the tasting panel in the wines produced at 21 °C. The number of times that the tasters detected a given aroma note is shown for Saccharomyces cerevisiae (SC); Torulaspora delbrueckii (TD); and Lachancea thermotolerans (LT).

Author Contributions

Conceptualization, R.A.P. and F.S.-S.; methodology, R.A.P. and F.S.-S.; formal analysis, R.A.P.; investigation, R.A.P. and F.S.-S.; data curation, R.A.P.; writing—original draft preparation, F.S.-S.; writing—review and editing, R.A.P. and F.S.-S.; funding acquisition, R.A.P. and F.S.-S. All authors have read and agreed to the published version of the manuscript.

Funding

This research was funded by the Ministry of Science and Innovation of Spain (TED2021-129208B-100 project).

Institutional Review Board Statement

Not applicable.

Informed Consent Statement

Not applicable.

Data Availability Statement

The data are available upon request to the authors.

Conflicts of Interest

The authors declare no conflicts of interest.

References

  1. Giorgi, F.; Lionello, P. Climate Change Projections for the Mediterranean Region. Glob. Planet. Chang. 2008, 63, 90–104. [Google Scholar] [CrossRef]
  2. Ficklin, D.L.; Novick, K.A. Historic and Projected Changes in Vapor Pressure Deficit Suggest a Continental-scale Drying of the United States Atmosphere. J. Geophys. Res. Atmos. 2017, 122, 2061–2079. [Google Scholar] [CrossRef]
  3. Dusenge, M.E.; Duarte, A.G.; Way, D.A. Plant Carbon Metabolism and Climate Change: Elevated CO2 and Temperature Impacts on Photosynthesis, Photorespiration and Respiration. New Phytol. 2019, 221, 32–49. [Google Scholar] [CrossRef] [PubMed]
  4. van Leeuwen, C.; Destrac-Irvine, A.; Dubernet, M.; Duchêne, E.; Gowdy, M.; Marguerit, E.; Pieri, P.; Parker, A.; de Rességuier, L.; Ollat, N. An Update on the Impact of Climate Change in Viticulture and Potential Adaptations. Agronomy 2019, 9, 514. [Google Scholar] [CrossRef]
  5. Van Leeuwen, C.; Destrac-Irvine, A. Modified Grape Composition under Climate Change Conditions Requires Adaptations in the Vineyard. OENO One 2017, 51, 147–154. [Google Scholar] [CrossRef]
  6. Winefield, C.; Lee, T.-M.; Gambetta, J.M.; Friedel, M.; Holzapfel, B.P.; Stoll, M. Sunburn Grapes: A Review. Front. Plant Sci. 2021, 11, 604691. [Google Scholar] [CrossRef]
  7. Cataldo, E.; Eichmeier, A.; Mattii, G.B. Effects of Global Warming on Grapevine Berries Phenolic Compounds—A Review. Agronomy 2023, 13, 2192. [Google Scholar] [CrossRef]
  8. Kliewer, W.M.; Torres, R.E. Effect of Controlled Day and Night Temperatures on Grape Coloration. Am. J. Enol. Vitic. 1972, 23, 71–77. [Google Scholar] [CrossRef]
  9. Reynolds, A.G.; Vanden Heuvel, J.E. Influence of Grapevine Training Systems on Vine Growth and Fruit Composition: A Review. Am. J. Enol. Vitic. 2009, 60, 251–268. [Google Scholar] [CrossRef]
  10. Gatti, M.; Frioni, T.; Garavani, A.; Biagioni, A.; Poni, S. Impact of Delayed Winter Pruning on Phenology and Ripening Kinetics of Pinot Noir Grapevines. BIO Web Conf. 2019, 13, 04002. [Google Scholar] [CrossRef]
  11. Zheng, W.; García, J.; Balda, P.; Martínez de Toda, F. Effects of Late Winter Pruning at Different Phenological Stages on Vine Yield Components and Berry Composition in La Rioja, North-Central Spain. OENO One 2017, 51, 363. [Google Scholar] [CrossRef]
  12. de Toda, F.; Sancha, J.; Zheng, W.; Balda, P. Leaf Area Reduction by Trimming, a Growing Technique to Restore the Anthocyanins: Sugars Ratio Decoupled by the Warming Climate. Vitis 2014, 53, 189–192. [Google Scholar]
  13. de Toda, F.; Balda, P. Delaying Berry Ripening through Manipulating Leaf Area to Fruit Ratio. Vitis J. Grapevine Res. 2013, 52, 171–176. [Google Scholar]
  14. Intrigliolo, D.S.; Lizama, V.; García-Esparza, M.J.; Abrisqueta, I.; Álvarez, I. Effects of Post-Veraison Irrigation Regime on Cabernet Sauvignon Grapevines in Valencia, Spain: Yield and Grape Composition. Agric. Water Manag. 2016, 170, 110–119. [Google Scholar] [CrossRef]
  15. Dinis, L.T.; Malheiro, A.C.; Luzio, A.; Fraga, H.; Ferreira, H.; Gonçalves, I.; Pinto, G.; Correia, C.M.; Moutinho-Pereira, J. Improvement of Grapevine Physiology and Yield under Summer Stress by Kaolin-Foliar Application: Water Relations, Photosynthesis and Oxidative Damage. Photosynthetica 2018, 56, 641–651. [Google Scholar] [CrossRef]
  16. Frioni, T.; Tombesi, S.; Luciani, E.; Sabbatini, P.; Berrios, J.G.; Palliotti, A. Kaolin Treatments on Pinot Noir Grapevines for the Control of Heat Stress Damages. BIO Web Conf. 2019, 13, 04004. [Google Scholar] [CrossRef]
  17. Coniberti, A.; Ferrari, V.; Dellacassa, E.; Boido, E.; Carrau, F.; Gepp, V.; Disegna, E. Kaolin over Sun-Exposed Fruit Affects Berry Temperature, Must Composition and Wine Sensory Attributes of Sauvignon Blanc. Eur. J. Agron. 2013, 50, 75–81. [Google Scholar] [CrossRef]
  18. van Leeuwen, C.; Roby, J.-P.; Alonso-Villaverde, V.; Gindro, K. Impact of Clonal Variability in Vitis vinifera Cabernet Franc on Grape Composition, Wine Quality, Leaf Blade Stilbene Content, and Downy Mildew Resistance. J. Agric. Food Chem. 2013, 61, 19–24. [Google Scholar] [CrossRef]
  19. Salgado, C.M.; Fernández-Fernández, E.; Palacio, L.; Carmona, F.J.; Hernández, A.; Prádanos, P. Application of Pervaporation and Nanofiltration Membrane Processes for the Elaboration of Full Flavored Low Alcohol White Wines. Food Bioprod. Process. 2017, 101, 11–21. [Google Scholar] [CrossRef]
  20. Biyela, B.N.E.; du Toit, W.J.; Divol, B.; Malherbe, D.F.; van Rensburg, P. The production of reduced-alcohol wines using Gluzyme Mono® 10.000 BG-treated grape juice. South. Afr. J. Enol. Vitic. 2016, 30, 124–132. [Google Scholar] [CrossRef]
  21. Liguori, L.; Albanese, D.; Crescitelli, A.; Di Matteo, M.; Russo, P. Impact of Dealcoholization on Quality Properties in White Wine at Various Alcohol Content Levels. J. Food Sci. Technol. 2019, 56, 3707–3720. [Google Scholar] [CrossRef] [PubMed]
  22. Contreras, A.; Hidalgo, C.; Henschke, P.A.; Chambers, P.J.; Curtin, C.; Varela, C. Evaluation of Non-Saccharomyces Yeasts for the Reduction of Alcohol Content in Wine. Appl. Environ. Microbiol. 2014, 80, 1670–1678. [Google Scholar] [CrossRef] [PubMed]
  23. Peinado, R.A.; Moreno, J.; Bueno, J.E.; Moreno, J.A.; Mauricio, J.C. Comparative Study of Aromatic Compounds in Two Young White Wines Subjected to Pre-Fermentative Cryomaceration. Food Chem. 2004, 84, 585–590. [Google Scholar] [CrossRef]
  24. Benito, S. The Impact of Torulaspora delbrueckii Yeast in Winemaking. Appl. Microbiol. Biotechnol. 2018, 102, 3081–3094. [Google Scholar] [CrossRef] [PubMed]
  25. Bely, M.; Stoeckle, P.; Masneuf-Pomarède, I.; Dubourdieu, D. Impact of Mixed Torulaspora delbrueckiiSaccharomyces cerevisiae Culture on High-Sugar Fermentation. Int. J. Food Microbiol. 2008, 122, 312–320. [Google Scholar] [CrossRef] [PubMed]
  26. Belda, I.; Navascués, E.; Marquina, D.; Santos, A.; Calderon, F.; Benito, S. Dynamic Analysis of Physiological Properties of Torulaspora delbrueckii in Wine Fermentations and Its Incidence on Wine Quality. Appl. Microbiol. Biotechnol. 2015, 99, 1911–1922. [Google Scholar] [CrossRef] [PubMed]
  27. Azzolini, M.; Tosi, E.; Lorenzini, M.; Finato, F.; Zapparoli, G. Contribution to the Aroma of White Wines by Controlled Torulaspora delbrueckii Cultures in Association with Saccharomyces cerevisiae. World J. Microbiol. Biotechnol. 2015, 31, 277–293. [Google Scholar] [CrossRef]
  28. Belda, I.; Ruiz, J.; Beisert, B.; Navascués, E.; Marquina, D.; Calderón, F.; Rauhut, D.; Benito, S.; Santos, A. Influence of Torulaspora delbrueckii in Varietal Thiol (3-SH and 4-MSP) Release in Wine Sequential Fermentations. Int. J. Food Microbiol. 2017, 257, 183–191. [Google Scholar] [CrossRef]
  29. Renault, P.; Coulon, J.; Moine, V.; Thibon, C.; Bely, M. Enhanced 3-Sulfanylhexan-1-Ol Production in Sequential Mixed Fermentation with Torulaspora delbrueckii/Saccharomyces cerevisiae Reveals a Situation of Synergistic Interaction between Two Industrial Strains. Front. Microbiol. 2016, 7, 293. [Google Scholar] [CrossRef]
  30. Ruiz, J.; Belda, I.; Beisert, B.; Navascués, E.; Marquina, D.; Calderón, F.; Rauhut, D.; Santos, A.; Benito, S. Analytical Impact of Metschnikowia pulcherrima in the Volatile Profile of Verdejo White Wines. Appl. Microbiol. Biotechnol. 2018, 102, 8501–8509. [Google Scholar] [CrossRef]
  31. Morata, A.; Bañuelos, M.A.; Vaquero, C.; Loira, I.; Cuerda, R.; Palomero, F.; González, C.; Suárez-Lepe, J.A.; Wang, J.; Han, S.; et al. Lachancea thermotolerans as a Tool to Improve PH in Red Wines from Warm Regions. Eur. Food Res. Technol. 2019, 245, 885–894. [Google Scholar] [CrossRef]
  32. Hranilovic, A.; Gambetta, J.M.; Schmidtke, L.; Boss, P.K.; Grbin, P.R.; Masneuf-Pomarede, I.; Bely, M.; Albertin, W.; Jiranek, V. Oenological Traits of Lachancea thermotolerans Show Signs of Domestication and Allopatric Differentiation. Sci. Rep. 2018, 8, 14812. [Google Scholar] [CrossRef] [PubMed]
  33. Benito, S. The Impacts of Lachancea thermotolerans Yeast Strains on Winemaking. Appl. Microbiol. Biotechnol. 2018, 102, 6775–6790. [Google Scholar] [CrossRef] [PubMed]
  34. Balikci, E.K.; Tanguler, H.; Jolly, N.P.; Erten, H. Influence of Lachancea thermotolerans on Cv. Emir. Wine Fermentation. Yeast 2016, 33, 313–321. [Google Scholar] [CrossRef] [PubMed]
  35. Benito, Á.; Calderón, F.; Palomero, F.; Benito, S. Quality and Composition of Airen Wines Fermented by Sequential Inoculation of Lachancea thermotolerans and Saccharomyces cerevisiae. Food Technol. Biotechnol. 2016, 54, 135–144. [Google Scholar] [CrossRef] [PubMed]
  36. Vicente, J.; Kelanne, N.; Navascués, E.; Calderón, F.; Santos, A.; Marquina, D.; Yang, B.; Benito, S. Combined Use of Schizosaccharomyces pombe and a Lachancea thermotolerans Strain with a High Malic Acid Consumption Ability for Wine Production. Fermentation 2023, 9, 165. [Google Scholar] [CrossRef]
  37. Benito, Á.; Calderón, F.; Palomero, F.; Benito, S. Combine Use of Selected Schizosaccharomyces Pombe and Lachancea thermotolerans Yeast Strains as an Alternative to the Traditional Malolactic Fermentation in Red Wine Production. Molecules 2015, 20, 9510–9523. [Google Scholar] [CrossRef]
  38. Gobbi, M.; Comitini, F.; Domizio, P.; Romani, C.; Lencioni, L.; Mannazzu, I.; Ciani, M. Lachancea thermotolerans and Saccharomyces cerevisiae in Simultaneous and Sequential Co-Fermentation: A Strategy to Enhance Acidity and Improve the Overall Quality of Wine. Food Microbiol. 2013, 33, 271–281. [Google Scholar] [CrossRef]
  39. International Organisation of Vine and Wine. Compendium of International Methods of Wine and Must Analysis; International Organisation of Vine and Wine: Dijon, France, 2021; ISBN 9782850380686. [Google Scholar]
  40. AENOR. AENOR. Análisis Sensorial. Tomo I. Alimentación; AENOR: Madrid, Spain, 1997. [Google Scholar]
  41. Llauradó, J.M.; Rozès, N.; Constantí, M.; Mas, A. Study of Some Saccharomyces cerevisiae Strains for Winemaking after Preadaptation at Low Temperatures. J. Agric. Food Chem. 2005, 53, 1003–1011. [Google Scholar] [CrossRef]
  42. Kapsopoulou, K.; Mourtzini, A.; Anthoulas, M.; Nerantzis, E. Biological Acidification during Grape Must Fermentation Using Mixed Cultures of Kluyveromyces thermotolerans and Saccharomyces cerevisiae. World J. Microbiol. Biotechnol. 2007, 23, 735–739. [Google Scholar] [CrossRef]
  43. Benito, S. Combined Use of S. pombe and L. thermotolerans in Winemaking. Beneficial Effects Determined Through the Study of Wines’ Analytical Characteristics. Molecules 2016, 21, 1744. [Google Scholar] [CrossRef]
  44. Escribano, R.; González-Arenzana, L.; Portu, J.; Garijo, P.; López-Alfaro, I.; López, R.; Santamaría, P.; Gutiérrez, A.R. Wine Aromatic Compound Production and Fermentative Behaviour within Different Non- Saccharomyces Species and Clones. J. Appl. Microbiol. 2018, 124, 1521–1531. [Google Scholar] [CrossRef]
  45. Puertas, B.; Jiménez, M.J.; Cantos-Villar, E.; Cantoral, J.M.; Rodríguez, M.E. Use of Torulaspora delbrueckii and Saccharomyces cerevisiae in Semi-Industrial Sequential Inoculation to Improve Quality of Palomino and Chardonnay Wines in Warm Climates. J. Appl. Microbiol. 2017, 122, 733–746. [Google Scholar] [CrossRef]
  46. Moreno, J.J.; Peinado, R.A. Enological Chemistry; Academic Press: Cambridge, MA, USA, 2012. [Google Scholar]
  47. Everitt, B.S.; Landau, S.; Leese, M.; Stahl, D. Cluster Analysis; Wiley: Hoboken, NJ, USA, 2011; ISBN 9780470749913. [Google Scholar]
  48. Vaquero, C.; Izquierdo-Cañas, P.M.; Mena-Morales, A.; Marchante-Cuevas, L.; Heras, J.M.; Morata, A. Use of Lachancea thermotolerans for Biological vs. Chemical Acidification at Pilot-Scale in White Wines from Warm Areas. Fermentation 2021, 7, 193. [Google Scholar] [CrossRef]
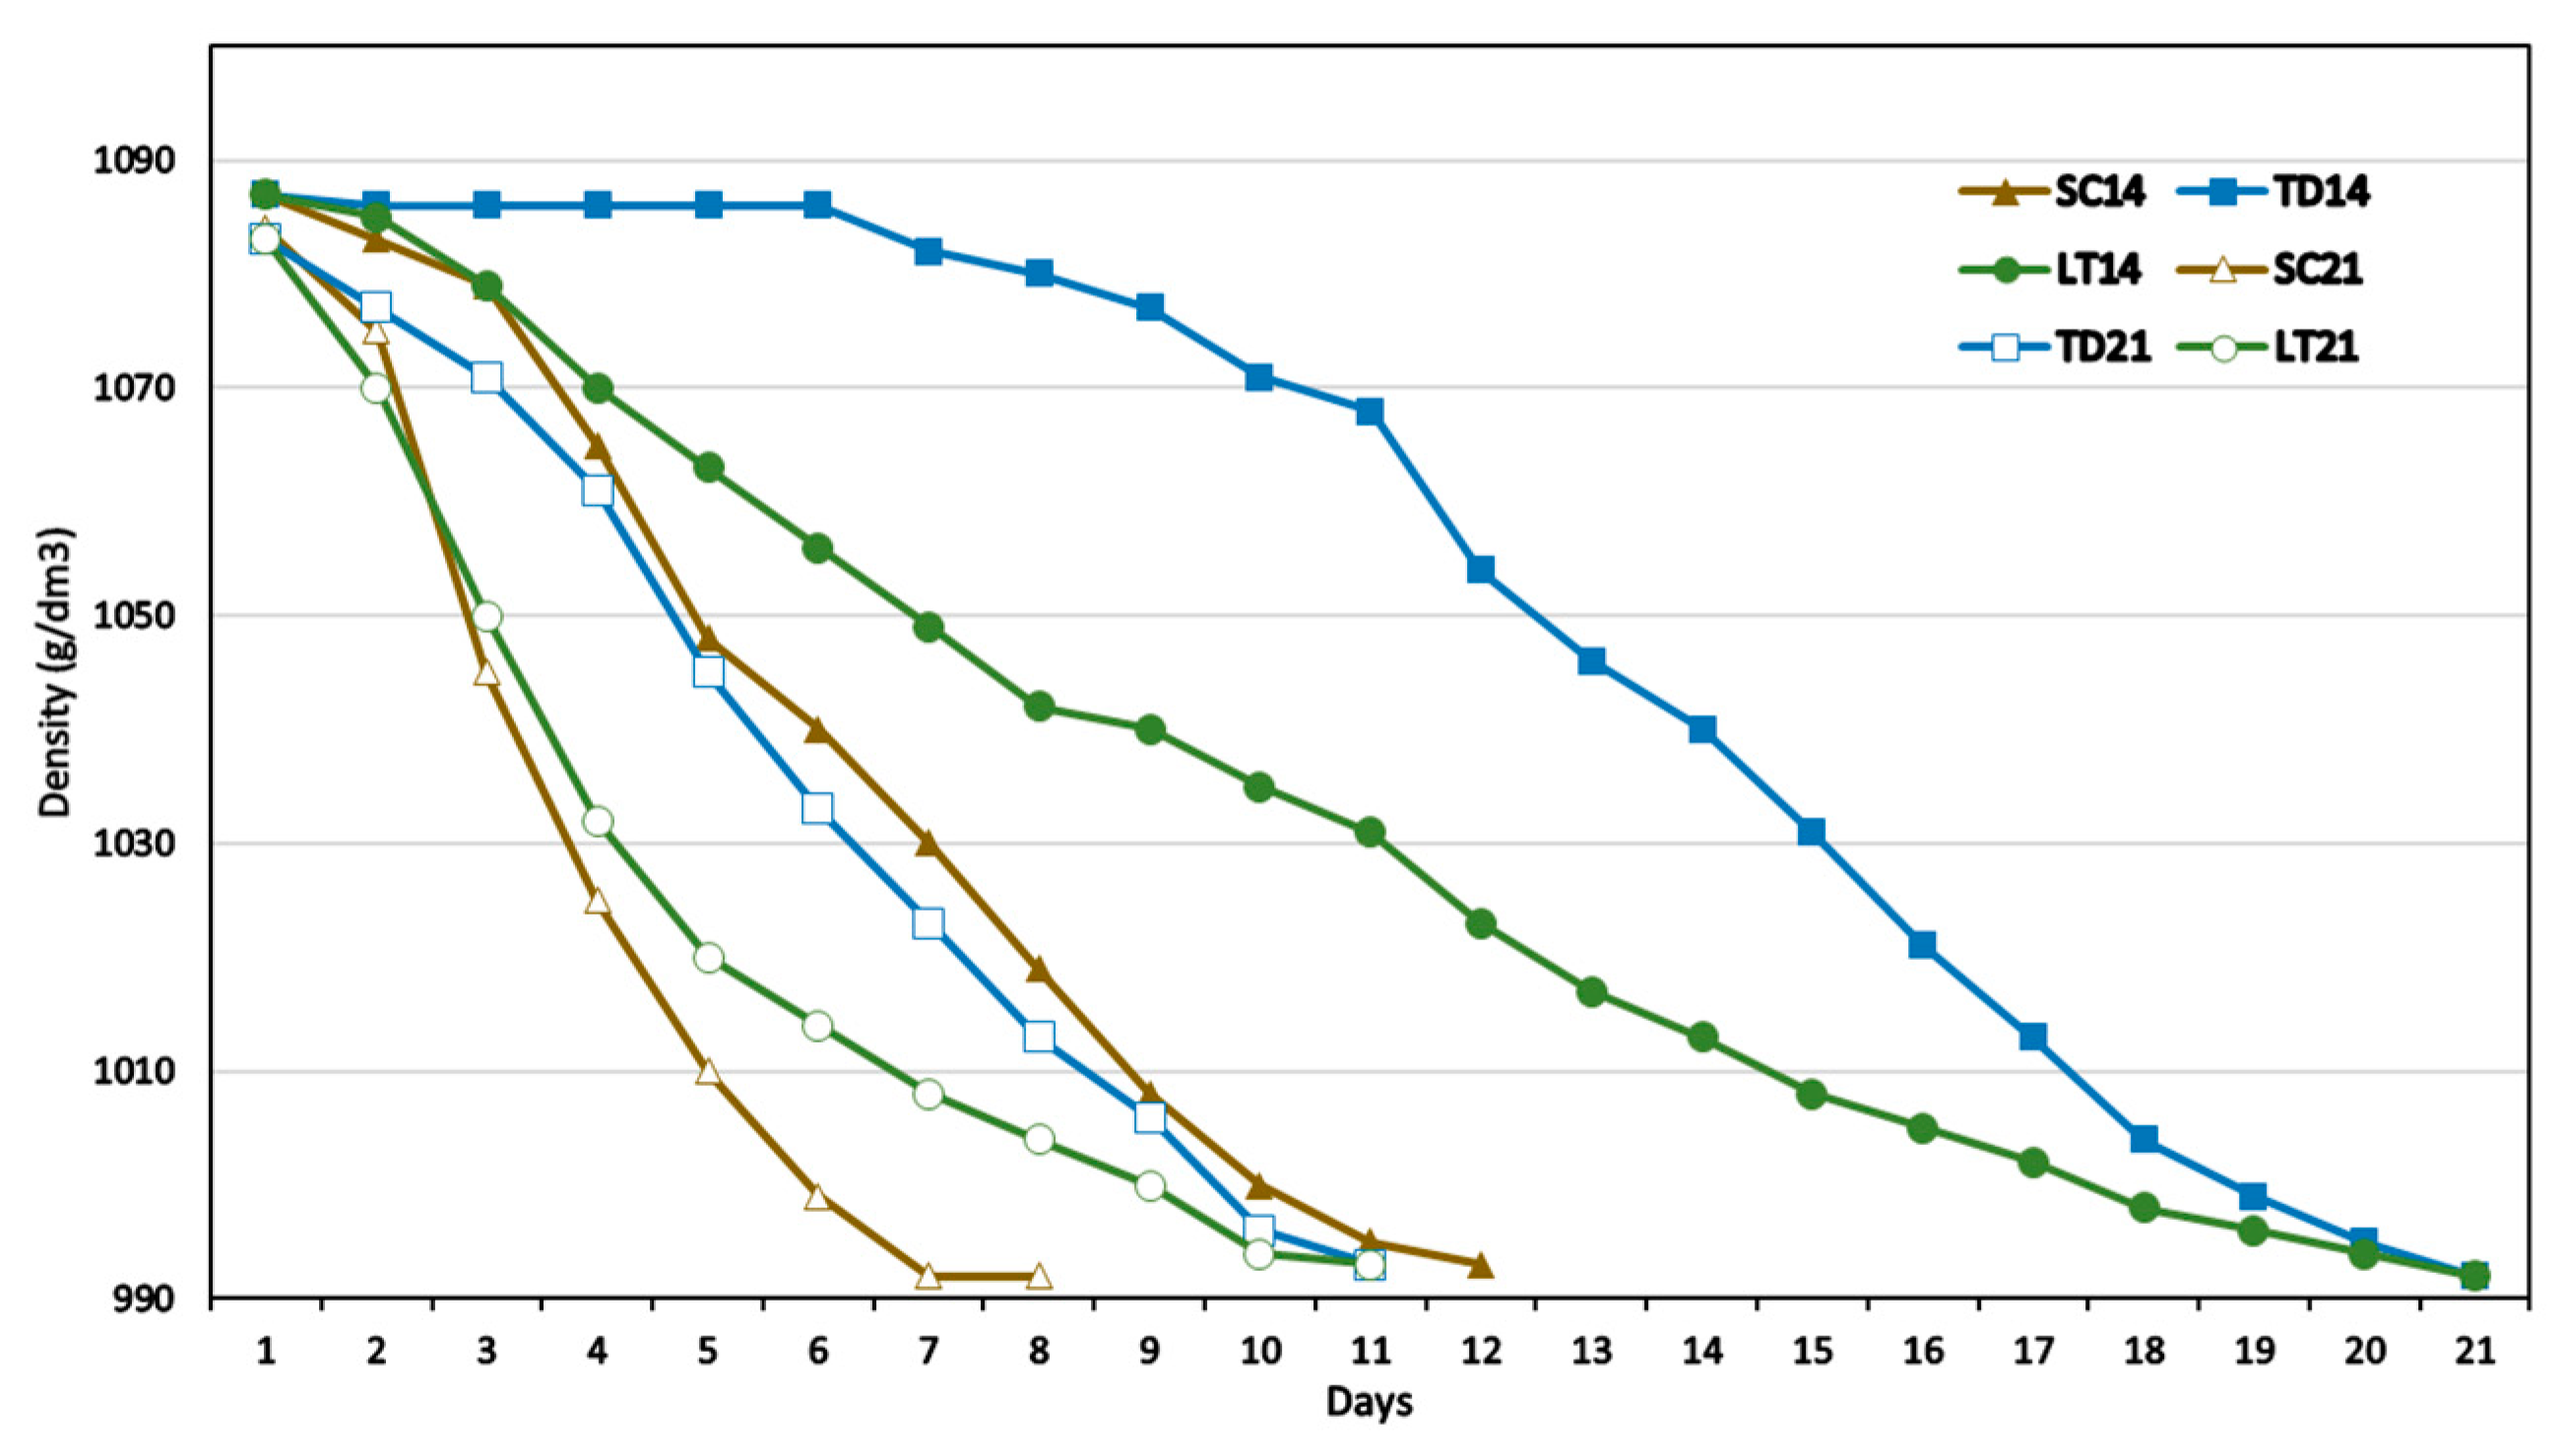
Figure 1. Fermentation kinetics of Saccharomyces cerevisiae (Sc), Torulaspora delbrueckii (Td), and Lachancea thermotolerans (Lt) at two different temperatures, 14 and 21 °C.
Fermentation 10 00017 g001
Figure 2. Cluster analysis according to Ward’s method. Saccharomyces cerevisiae (Sc), Torulaspora delbrueckii (Td), and Lachancea thermotolerans (Lt) are depicted at two different temperatures (14 and 21 °C).
Fermentation 10 00017 g002
Figure 3. (a) Two-dimensional representation of the components 1 and 2 obtained in the principal component analysis. (b) Two-dimensional representation of the components 1 and 3 obtained in the principal component analysis.
Fermentation 10 00017 g003
Figure 4. Distribution of absolute frequencies and trend lines obtained in the evaluation of wines obtained at 14 °C by Saccharomyces cerevisiae (blue bars); Torulaspora delbrueckii (red bars); and Lachancea thermotolerans (green bars). Dark bars indicate the median value.
Fermentation 10 00017 g004
Figure 5. Distribution of absolute frequencies and trend lines obtained in the evaluation of wines obtained at 21 °C by Saccharomyces cerevisiae (blue bars); Torulaspora delbrueckii (red bars); and Lachancea thermotolerans (green bars). Dark bars indicate the median value.
Fermentation 10 00017 g005
Table 1. Oenological parameters determined in wines produced by Saccharomyces cerevisiae (Sc), Torulaspora delbrueckii (Td), and Lachancea thermotolerans (Lt) at 14 °C and 21 °C. Multivariate analysis of variance (MANOVA) involved the factors of temperature (T) and the yeast used (Y).
Parameter14 °C21 °CMANOVA
ScTdLtScTdLtTY
pH3.20 ± 0.023.23 ± 0.023.25 ± 0.013.31 ± 0.023.34 ± 0.023.22 ± 0.02*****
Buffer capacity (meq/L)31 ± 134 ± 247 ± 230.0 ± 0.928.5 ± 0.749 ± 1ns***
Titratable acidity
Tartaric acid (g/L)
5.95 ± 0.085.7 ± 0.17.9 ± 0.14.9 ± 0.14.85 ± 0.097.65 ± 0.06******
Lactic acid (g/L)0.50 ± 0.020.48 ± 0.013.7 ± 0.10.15 ± 0.070.33 ± 0.044.8 ± 0.2*****
Volatile acidity
Acetic acid (g/L)
0.5 ± 0.10.31 ± 0.020.74 ± 0.050.22 ± 0.050.52 ± 0.030.63 ± 0.01******
Ethanol (% v/v)11.5 ± 0.111.8 ± 0.111.7 ± 0.211.6 ± 0.111.2 ± 0.211.2 ± 0.1**ns
Reducing sugars (g/L)1.8 ± 0.21.7 ± 0.31.9 ± 0.22.5 ± 0.42.3 ± 0.31.8 ± 0.2nsns
** denote significant differences at 99% confidence level; *** denote significant differences at 99.9% confidence level; ns = no significant differences.
Table 2. Major volatile compounds and polyols (mg/L, except where indicated) were determined in wines fermented with Saccharomyces cerevisiae (Sc), Torulaspora delbrueckii (Td), and Lachancea thermotolerans (Lt) at two different temperatures. Multivariate analysis of variance (MANOVA) involved taking variations in factors of temperature (T) and the yeast used (Y).
Compound14 °C21 °CMANOVA
ScTdLtScTdLtTY
Methanol31 ± 332 ± 526.5 ± 0.431 ± 225 ± 331 ± 1*ns
Propanol33 ± 155.3 ± 0.755 ± 428 ± 133 ± 258.1 ± 0.1******
Isobutanol28.6 ± 0.868 ± 158.8 ± 0.138 ± 270 ± 2106 ± 1******
Isoamyl alcohols195 ± 4270 ± 6245 ± 2261 ± 8258 ± 3254 ± 3******
2-Phenylethanol24.6 ± 0.444.7 ± 0.227 ± 245 ± 158 ± 229 ± 5******
Ethyl acetate32 ± 134 ± 2158 ± 038 ± 153.1 ± 0.2152 ± 1******
Ethyl lactatendnd73 ± 3ndnd91 ± 3******
Diethyl succinate8.5 ± 0.215 ± 111.6 ± 0.89.7 ± 0.412.8 ± 0.313.5 ± 0.2ns***
2,3-Butanediol (levo)224 ± 2256 ± 31213.2 ± 0.1249 ± 11231 ± 19210 ± 10nsns
2,3-Butanediol (meso)71 ± 5209 ± 2368 ± 178 ± 5179 ± 1046 ± 4ns***
Glycerol (g/L)7.6 ± 0.111 ± 17.1 ± 0.26.8 ± 0.36.4 ± 0.59.0 ± 0.4**
Acetaldehyde59 ± 2177 ± 2165 ± 236 ± 472 ± 2103 ± 13******
Acetoin4.4 ± 0.313.2 ± 0.911.4 ± 0.13.3 ± 0.36.3 ± 0.518.3 ± 0.6ns***
* denote significant differences at 95% confidence level; *** denote significant differences at 99.9% confidence level; ns = no significant differences; nd = not detected.
Table 3. Coefficients, R-squared, p-value, and Durbin–Watson statistic of the multiple regression analysis carried out to relate lactic acid concentration with some compounds produced during alcoholic fermentation.
Coefficientp-Value
Constant1.564>0.05
Volatile Acidity1.379<0.05
Glycerol−0.371<0.05
Isobutanol0.0436<0.05
Isoamyl alcohol0.0323<0.05
2-Phenyletanol−0.136<0.05
R299.10%
Durbin–Watson3.033>0.05
Model <0.05
Table 4. Weight of the variables in each one of the selected principal components (Pc) obtained in the principal component analysis.
Classifying VariablesPc1 (49.29%)Pc2 (29.86%)Pc3 (10.11%)
Lactic acid0.3613−0.12230.0818
Acetic acid0.2829−0.20760.1287
Propanol0.34050.1663−0.2235
Isobutanol0.29220.19270.3037
Isoamyl alcohols0.06350.37390.3934
2-Phenylethanol−0.18770.30390.5004
Ethyl acetate0.3473−0.13330.1873
Ethyl lactate0.3579−0.13080.1069
Diethyl succinate0.18900.41200.0905
2,3-Butanediol (levo)−0.23410.2925−0.1563
2,3-Butanediol (meso)−0.12760.41100.0149
Glycerol (g/L)0.13760.3108−0.5006
Acetaldehyde0.23500.2446−0.3080
Acetoin0.34530.1716−0.0679
Disclaimer/Publisher’s Note: The statements, opinions and data contained in all publications are solely those of the individual author(s) and contributor(s) and not of MDPI and/or the editor(s). MDPI and/or the editor(s) disclaim responsibility for any injury to people or property resulting from any ideas, methods, instructions or products referred to in the content.