1. Introduction
Nanodiamonds (NDs) have been considered as one of the most promising fillers for nanocomposites in the last few decades [
1,
2,
3,
4]. NDs can combine properties of a diamond such as extremely high hardness, chemical and bio-stability, high thermal conductivity, etc., with an ability to use them as an effective filler for improvement of polymer characteristics [
5,
6,
7].
ND particles can be obtained by the detonation of strong explosives and ablation of carbon target by laser pulses [
2,
8]. A significant advantage of the detonation method is the formation of diamond nanoparticles with a typical size of 4–5 nm. The structures of ND particles are of a special interest for investigation [
4]. In the work of Ginés et al. [
9], the zeta potential of NDs was investigated. Positive zeta potentials in nano-structured carbons were explained by the presence of graphitic planes at the surface of ND particles, which leave oxygen-free Lewis sites and promote the suppression of acidic functional groups. Electron microscopy and Raman spectroscopy have been used to show that positive zeta potential of nanodiamond is only exhibited in the presence of sp
2 carbon at the surface. In the review by Shrestha et al. [
10] it was concluded that exploiting the surface characteristics of the nanoparticles, including surface charge and functionality, is an effective method of size control of aggregate/agglomerate nanoparticles.
Along with detonation synthesis NDs, polymers modified with NDs are also an attractive subject for research [
11]. In the review by Karami et al. [
12], it was noted that exceptional properties of detonation NDs and its inherent rich surface chemistry make them suitable for the production of multifunctional materials. In the work of Kidalov et al. [
13], it was shown that the thermal conductivity of nanocomposites based on nanodiamonds can reach up to 10 W/(m∙K). In the work of Houshyar et al. [
14], using conventional methods of processing such as melt mixing, the authors obtained filaments based on polypropylene (PP) filled with NDs that were characterized by exceptional long-term stability performance, mechanical and biological properties.
A wide range of methods for the controlled modification of diamond powder opens up the possibilities of increasing such characteristics of polymer composites as adhesive strength [
3,
6]. In the work of Kurkin et al. [
6], it was shown that the adhesive strength of oriented poly(vinyl alcohol) (PVA) fibers in an epoxy binder can be significantly improved by simultaneously modifying the polymer fiber and the polymer matrix with fine particles of detonation-synthesized ND powder with oppositely charged surfaces.
Unfortunately, using NDs for the modification of polymers can be very expensive, especially if high filler content is required. This is due to the complex purification process required to remove residue metals and non-diamond forms of carbon [
3]. Additionally, while purified ND powder can be characterized by a relatively high level of thermal conductivity, it cannot be used efficiently to increase electrical conductivity of polymers [
5].
Nanodiamond soot (NDS) is a more affordable type of filler with characteristics close to those of NDs [
11,
15]. NDS is obtained at the post-detonation stage of an ND synthesis process, preceding the expensive final stage of NDs purification from non-diamond carbon [
8]. This reduces the cost of NDS fillers, making them a less expensive alternative to the pure NDs. Additionally, since NDS can contain a high-volume fraction of non-diamond carbon, such as graphite, it is potentially possible to obtain electrically conductive polymer composites modified with NDS.
In the works of Satonkina et al. [
4] and Chen et al. [
15], structure, composition, and surface properties of detonation synthesis NDS were characterized using elemental analysis, high resolution transmission electron microscopy, X-ray diffraction (XRD), Raman spectroscopy, Fourier-IR, X-ray photoelectron spectroscopy, and small angle X-ray scattering. It was shown that the condensed carbon in the NDS of choice had a complex composition, comprising clusters of diamond, graphite and amorphous carbon, all of which were in the nanometer scale. Two types of graphite phases were present in the ND. The first phase was tangled and highly curved graphite nanoribbons; the other was carbon spheres and carbon mantles graphitized from the NDs. Such nanoribbons were effectively used previously in the work of Alaferdov et al. [
16] to obtain polymer composites with excellent conductivity (up to 40 S/cm) and very low percolation threshold (0.42 vol.%).
In the work of Kurkin et al. [
17], the structure and properties of the oriented PVA fibers modified with NDs and NDS of detonation synthesis were investigated using XRD, electron microscopy, and mechanical testing. It was shown that NDs and NDS are effective modifiers of the physical–mechanical properties of the oriented PVA fibers. NDS particles in the PVA matrix retained a high level of dispersion without aggregation up to a filling degree of 3 vol.%. Maximum values of the longitudinal elastic modulus and the energy stored in the modified PVA fiber upon stretching up to the moment of the fracture was achieved at a small (1 vol.%) NDS filling value. The adhesion strength of the oriented modified by NDS PVA fibers in the epoxy matrix substantially exceeded the adhesion strength of the nonmodified fibers.
In the works of Neitzel et al. [
18,
19] it was demonstrated that an addition of ND particles in a polymer matrix (epoxy) is an efficient way of decreasing the friction coefficient of the material. In the work of Lebedev et al. [
20], tribological and percolation properties of composites based on PP modified with non-conductive NDS particles were investigated. By measuring tribological characteristics such as wear rate, it was shown that there is a possibility of formation of a surface layer enriched with NDS. This effect was additionally studied in [
21] for electrically conductive such fillers as carbon black (CB).
It should be mentioned that most of the currently published works are either focused on the research of NDs or polymer nanocomposites filled with NDs. There are very few works that investigate the properties of specific NDS particles, and no works that connect the structure of such particles with the properties of polymer composites based on the same filler. At the same time, researching possible areas of application of such a unique type of filler can be very useful for the polymer composite industry and are of a great scientific and practical interest.
The performance of various types of nanosized and submicron polydisperse fillers (including inorganic and carbon particles, as well as more complex organic/inorganic hybrid particles) in polymer composites is generally associated with the structural properties of these fillers [
10,
22]. Among the most common methods of obtaining information about the phase composition, structural hierarchy and colloidal behavior of polydisperse fillers are XRD, dynamic light scattering (DLS), laser diffraction (LD) and static light scattering, along with various types of microscopy techniques. While each of these techniques has its intrinsic limitations, their combination often provides complementary information [
23,
24], which is necessary to determine the most optimal procedure of composite material design and processing [
25].
The novelty of our work is in a comprehensive study of the properties of NDS of detonation synthesis, characterized by high-volume fractions of graphite in the form of graphite nanoribbons. The study is based on the thorough analysis of the structure of such NDS powder and dispersions under various conditions. The structural properties of NDS were characterized by a wide variety of techniques, including XRD, DLS, LD, Raman spectroscopy, atomic force microscopy (AFM), scanning and transmission electron microscopy (SEM and TEM, respectively), scanning tunnelling microscopy (STM), and electron diffraction. By using the NDS as a filler for a polymer, investigated earlier in our previous works, and comparing the effect of the filler structure on the migration of nanoparticles to the boundaries of polymer composite melts, it makes it possible to draw conclusions on the overall possibility of NDS acting as a more versatile substitute of such conventionally used fillers, as CB. The obtained results can provide a solid foundation for the future design of new carbon-based polymer composite materials.
2. Materials and Methods
As the main object of the investigation, NDS of detonation synthesis was used. NDS was obtained from 2,4,6-trinitrotoluene, providing the high graphite/nanodiamond ratio required to ensure high levels of electrical conductivity. NDS was provided by the Special Design and Technological Bureau “Technolog” (St. Petersburg, Russia). The details on the synthesis process can be found in the works of Dolmatov et al. [
3,
11].
Commercially available amorphous–crystalline PP grade H030 GP/3 (SIBUR International GmbH, Vienna, Austria) was used as the base polymer for the composite materials studied in this work [
26]. As the reference electrically conductive filler, commercially available electrically conductive CB of brand P267-E (equivalent of N 472, Institute of Hydro-carbons Processing of the Siberian Branch of the Russian Academy of Sciences IHCP SB RAS, Saint Petersburg, Russia) with a specific surface area of 144 m
2/g [
27] was chosen. Previously, this filler was used in the investigation of nanoparticles migration in PP-based composite melts [
21].
Samples of composites were obtained via melt mixing of the polymer granules and nanoparticle powders in a micro-compounder (DACA Instruments, Goleta, CA, USA) designed to prepare compositions in laboratory quantities (up to 4 cm3). The quantity of the material in the micro-compounder chamber was calculated so the chamber was filled fully. The mixing procedure was carried out at 200 °C and 500 rpm for 10 min after the addition of the components into the compounder.
DC electrical conductivity of the filler powders was measured using a 34401A multimeter (Agilent, Santa Clara, CA, USA) and the four-probe method. A special appliance was used to change volume fraction of the powder between electrodes.
To carry out measurements of electrical resistance of the composite melts, granules of the prepared composites of various compositions were placed in a heated mold between two flat electrodes inside a circular hole in a spacer made of polytetrafluoroethylene [
21]. The composite granules were quickly heated to 205 °C, after which a pressure of 5 MPa was gradually applied to the composite melt. The temperature and pressure values were maintained for the duration of the experiments. Constant electrical voltage was applied between the electrodes during the entire experiment time. The voltage was provided by a highly stable AKIP 1147/1 power supply (Prist, Moscow, Russia). The standard preset value of the electric voltage was 2 V. A 6485/E (Keithley, Cleveland, OH, USA) picoammeter was used for the current measurements. During the experiments, the values of the electric current between the electrodes were continuously recorded using a multichannel analog-to-digital converter E14-440 (L-Card, Moscow, Russia) at frequency of 100 Hz.
Hydrodynamic diameters of NDS in various liquid media (acetone, DMSO, ethanol, isopropanol) were determined via DLS at 25 °C using a Microtrac Nanotrac model Zetatrac instrument (Microtrac Inc., Montgomeryville, PA, USA) equipped with a 3 mW solid-state laser operating at 780 nm. Scattered light was detected at 180° in a controlled reference self-beating mode, and the particle size was calculated from the power spectrum analysis of Doppler-shifted signal over several runs. For every tested sample, 5 runs each of 60 s duration were performed. The sphere-equivalent hydrodynamic diameter of the NDS structures was calculated from the particle diffusion coefficient via the Stokes−Einstein equation, using solution viscosities for liquid media at 25 °C. Electrophoretic mobility of NDS structures was measured in liquid media using a Microtrac Nanotrac model Zetatrac instrument by applying AC/DC voltage to built-in sample cell electrodes to determine the magnitude and sign of particle zeta-potential. Zeta-potential was calculated from electrophoretic mobility via the Smoluchowski equation. All measurements and data analysis were performed using NanoFLEX Software. NDS concentrations of 0.5% (w/v) were utilized in all DLS and zeta-potential measurements. NDS dispersions were preliminarily treated using a CUD-500 ultrasonic disperser from Criamid, Moscow, Russia (2 min, 250 W, 30 kHz).
Particle size analysis by LD was performed using Wintrac 3000 instrument equipped with a He-Ne laser (λ = 632.8 nm) and auxiliary solid-state laser operating at λ = 405 nm, allowing for particle characterization in 0.1–2000 μm size range. Prior to the measurements, NDS powder was dispersed in a liquid medium using the built-in circulation system equipped ultrasound probe (60 W, 40 kHz). Scattering pattern measurements were performed with sample circulating through a flow-cell at pumping speed of 2000 rotations per minute. For every sample, 60 scans of 2 s duration each were performed. To obtain particle size distributions, each scattering pattern was processed according to Fraunhofer diffraction and Mie scattering models using WINTRAC Software. The reported results are the product of averaging of the 60 scans for every measured sample.
XRD patterns (2Ѳ = 10–105o) were obtained using a Bruker D8 Advance powder diffractometer (λ(CuKα) = 1.5418 Å) equipped with focusing germanium crystal monochromator, Ni-filter and a LYNXEYE 1D scintillating detector. XRD patterns were recorded in the transmission mode, with NDS powder placed between two layers of amorphous poly(ethylene terephthalate) films. Processing of diffraction patterns (peak separation, corrections for non-coherent background scattering and scattering from poly(ethylene terephalate)) was performed using Origin Pro software.
AFM measurements were performed using a Solver HV atomic-force microscope (NT-MDT, Moscow, Russia) with standard HA-NC cantilevers (chip size 3.6 × 1.6 × 0.45 mm, cantilever size 87 × 32 × 1.75 µm, curvature radius of the tip 10 nm, force constant 5.8 N/m). The measurements were carried out in a tapping mode with the acquisition of surface topography and phase contrast.
STM measurements were performed using a scanning tunneling microscope (STM, Omicron NanoTechnology, Taunusstein, Germany) at 300 K and a residual gas pressure of 2 × 10⁻¹⁰ Torr. According to the standard procedure, tips made of tungsten wires were used as STM probes. STM topography measurements were carried out in the constant current mode (Ubias = 2.0 V, Itunnel = 3.1 nA).
Prior to the AFM and STM measurements, NDS dispersions in 2-propanol (concentration of solid phase 0.5 wt.%) were deposited on a highly oriented pyrolytic graphite substrate and dried at the ambient conditions (air, Т = 22 °C).
Raman spectra were obtained using a RamanStation-400 (Perkin-Elmer, Waltham, MA, USA) dispersive echelle Raman spectrometer equipped with a single-mode 785 nm diode laser excitation (1–100 mW), thermoelectrically cooled (−52 °C) CCD matrix detector (Andor Inc., Belfast, North Ireland), XYZ-motorized sample stage and an ×30 microscope objective used for delivering laser excitation and collecting Raman photons. Raman spectra were acquired in 180° backscattering geometry. The solid samples were placed onto the standard Au-coated slide on the XYZ-table and focused under the instrument objective. The Raman spectra were obtained within 3400–100 cm−1 Raman shifts range at 1,2,4 or 8 cm−1 optical resolution. In different experiments, depending on the luminescence activity of the samples, the laser excitation power of 2–25 mW and signal accumulation times of 20–180 s were used for the spectra recording. A dedicated Bruker OPUS software package was used for routine processing (baseline correction, smoothing, etc.) of the Raman spectra.
Tribological tests were conducted using a pin-on-disk-type testing machine (cylindrical stainless-steel pin) in the dry friction mode according to ASTM G99-05 procedure. Test parameters values can be found in [
20]. For each test piece, 6 identical test runs were performed, measuring friction coefficient dependence on time. The obtained results were averaged.
SEM studies of the NDS powder were performed using a JSM-6000 (Neoscope II) scanning microscope (Jeol, Japan). TEM studies were performed using a fully digital 200 kV S/TEM FEI Tecnai Osiris system (FEI Company, Hillsboro, OR, USA). Samples were prepared by deposition of the NDS solutions on holey C film on Au grid.
3. Results
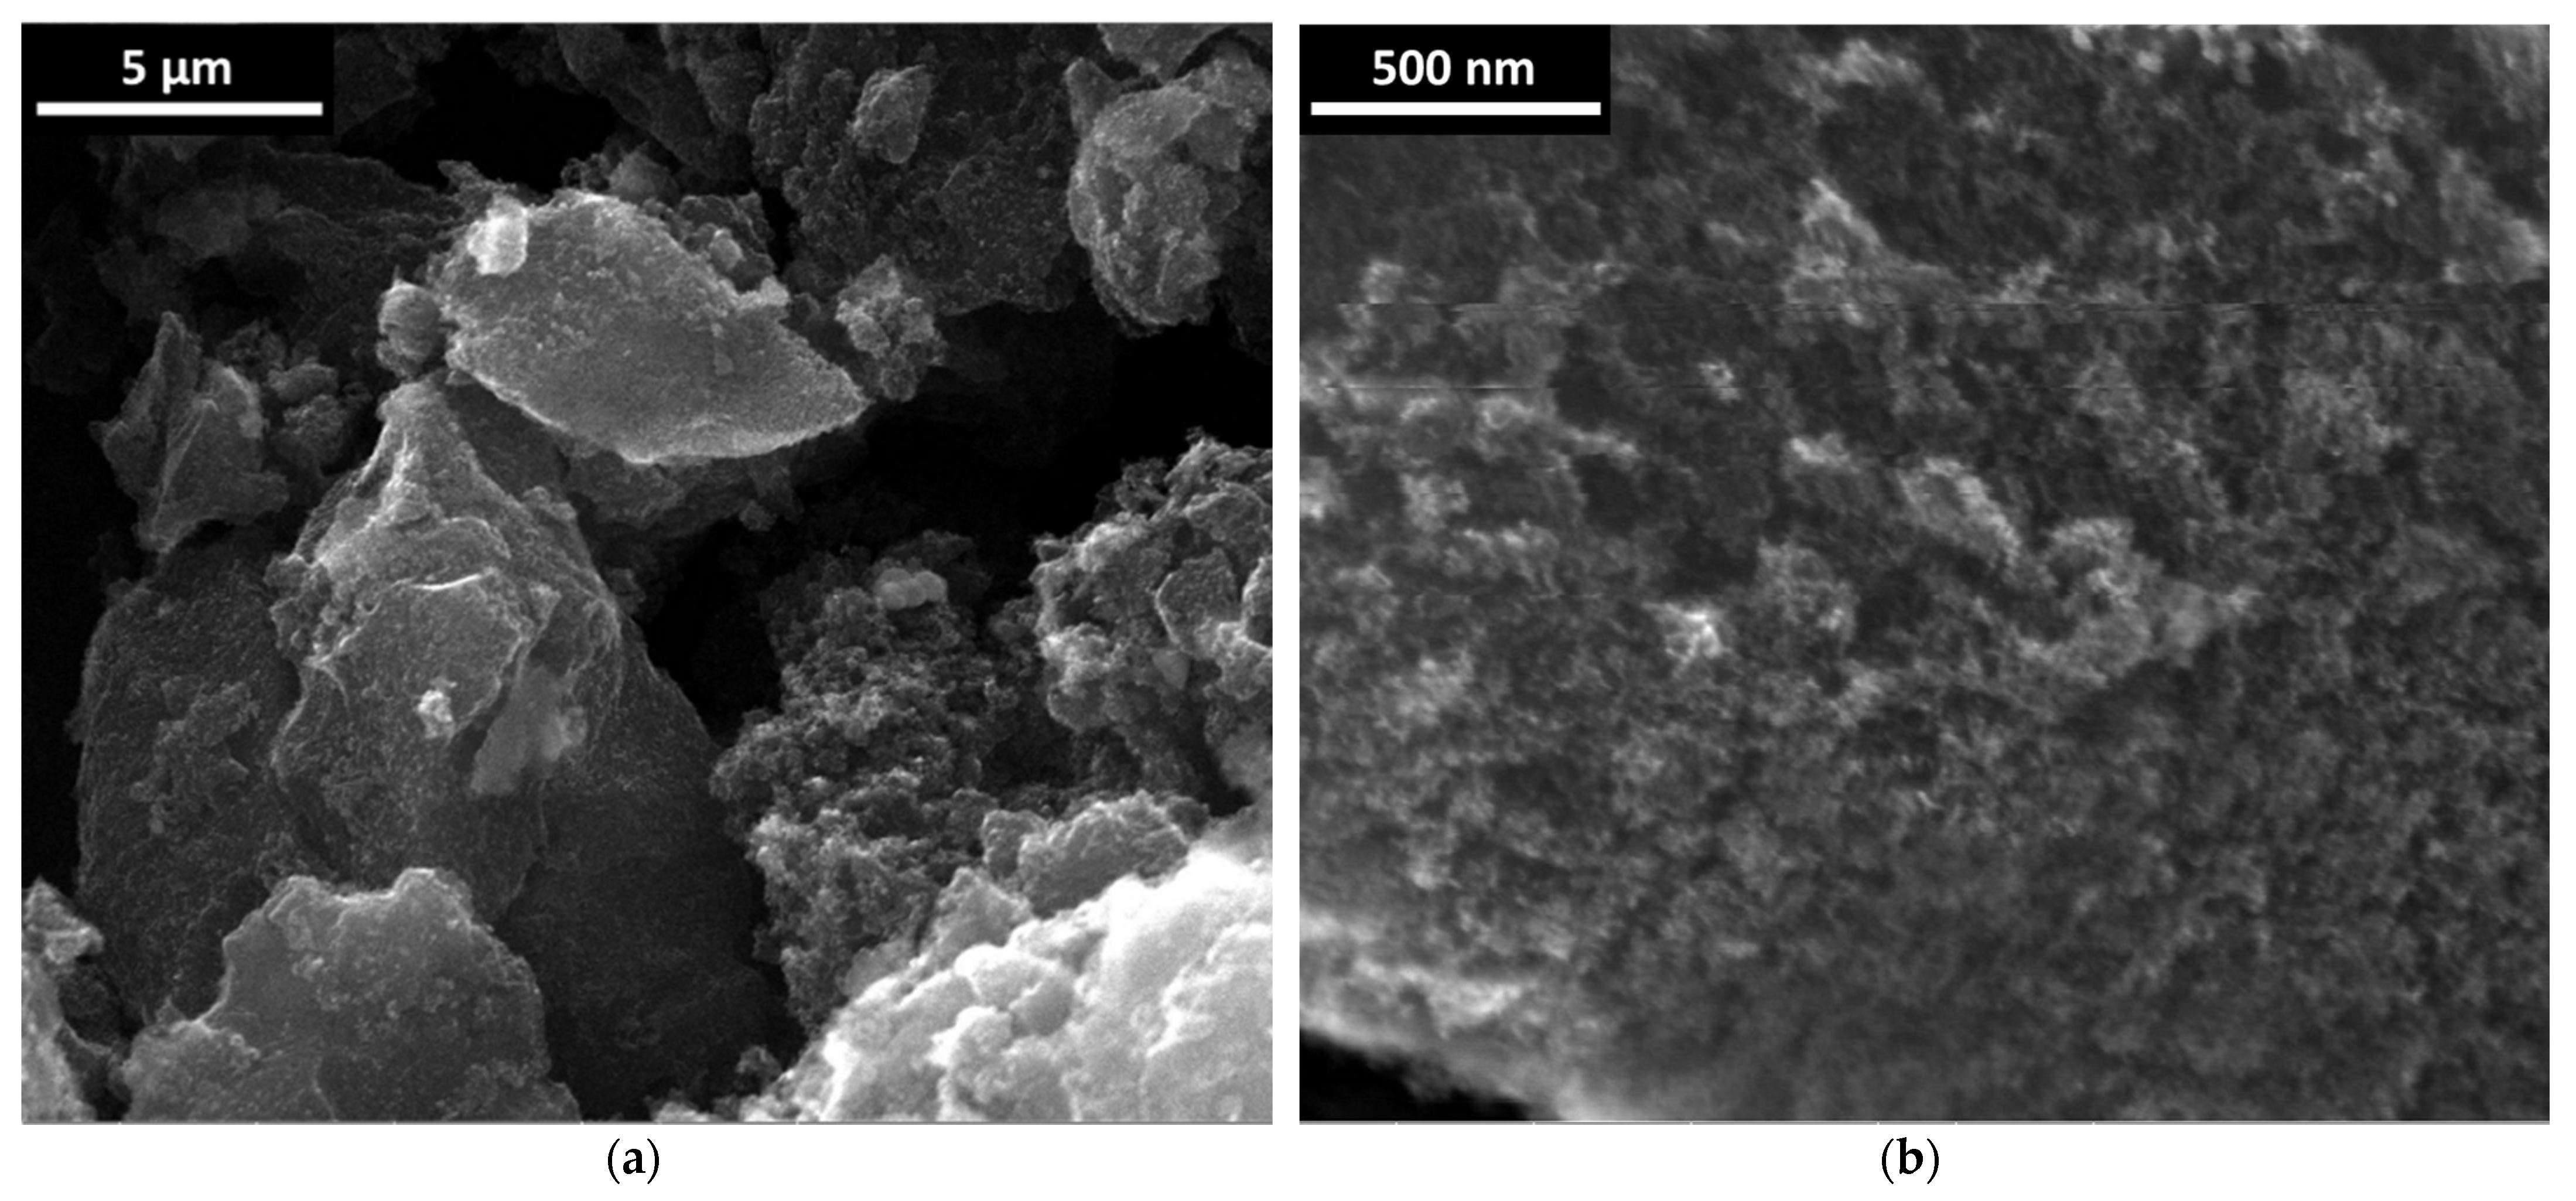
Firstly, the NDS powder was investigated “as it is” using SEM. Selected results of the microscopy study are presented in
Figure 1.
It can be seen that the powder contains soft-looking (the packing of the carbon phase looks not very dense) agglomerates of diameter >~3 µm (
Figure 1a). In turn, these relatively large agglomerates are seemingly formed from aggregates of diameter >100 nm (
Figure 1b) [
22].
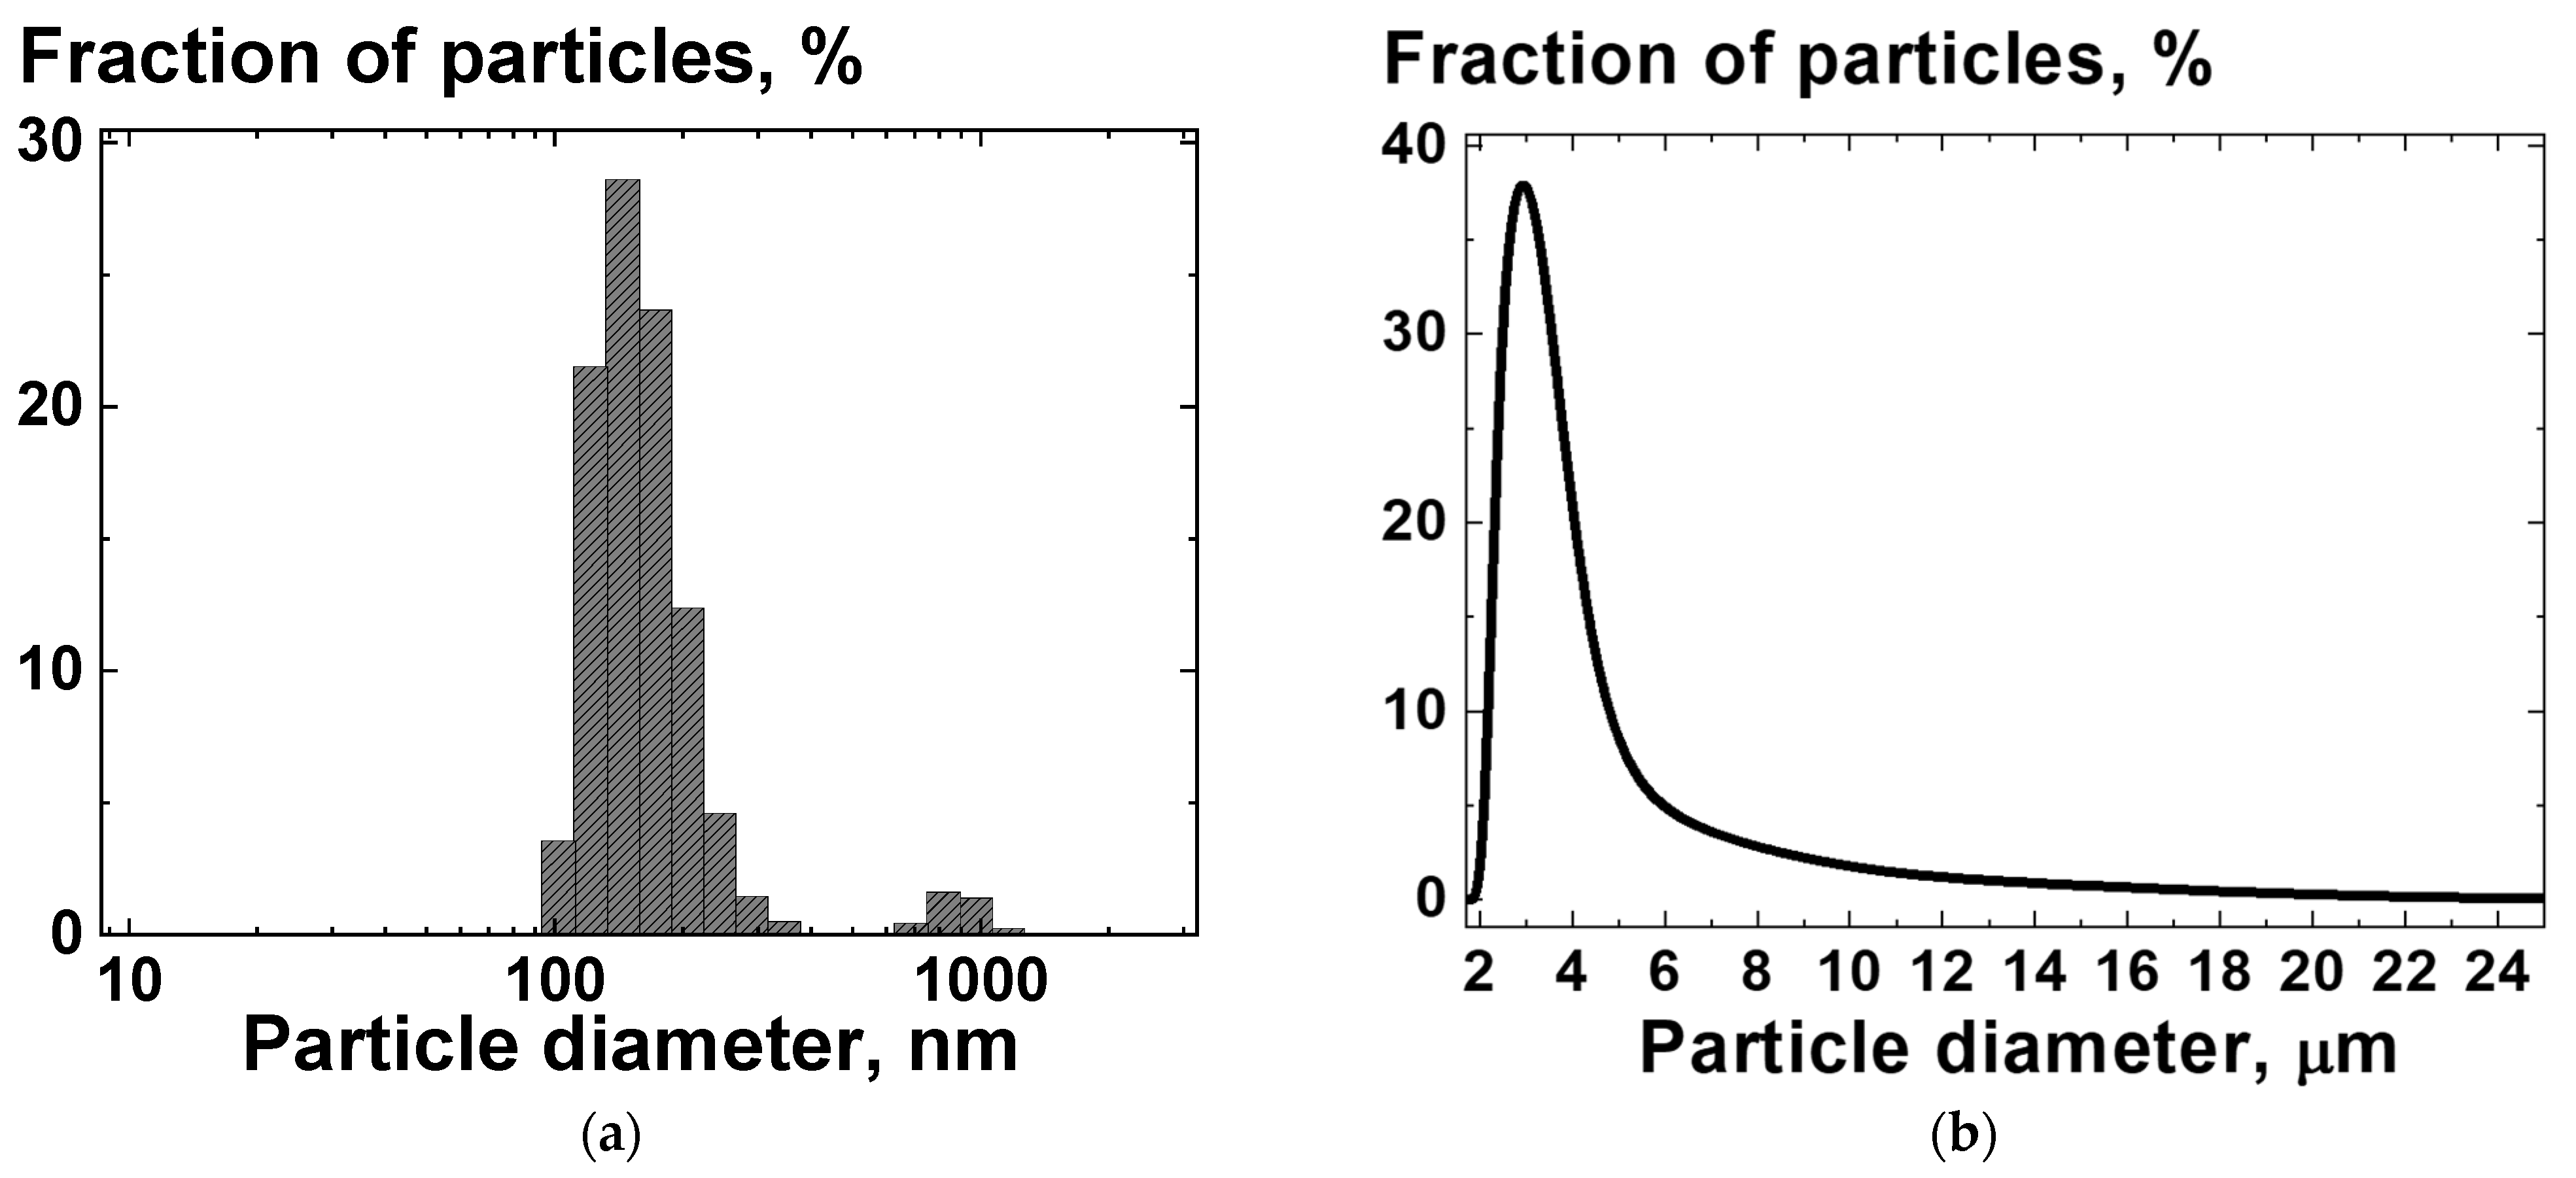
The results of SEM data analysis for the powder of NDS were in some agreement with the measurements of NDS structures (primary particles, aggregates, agglomerates [
22]) size distributions in acetone using DLS and LD analysis (LDA), as can be seen from
Figure 2.
The size distribution for NDS aggregates/agglomerates consisted of peaks at ~250 nm and ~950 nm, obtained using DLS (
Figure 2a), and at ~3.2 µm, obtained using LDA (
Figure 2b). The difference in the size distributions determined by the DLS and LDA can be attributed to the additional pretreatment using ultrasound with higher power when the size distributions were measured by the DLS method, compared to the treatment of the NDS in the circulation system when the size distributions was measured by LD.
NDS size distributions were also obtained for additional liquid media, such as DMSO, ethanol, and isopropanol, as well as for different time periods after ultrasonication: 0 h, 24 h, 120 h, 1 week, 3 weeks, and 4 weeks. The results were very close to the ones obtained for NDS dispersion in acetone soon after ultrasonication (in the range of an error). The results of the DLS measurements for different liquid media and time periods after ultrasonication are presented in
Supplementary Materials.
For all the investigated dispersions in different media (acetone, DMSO, ethanol, isopropanol) zeta-potentials were measured after 0 h, 24 h, 120 h, 1 week, 3 weeks, and 4 weeks after the initial ultrasonication. The value of zeta-potential for NDS dispersions were in the range of uncertainty for all the investigated media even after 4 weeks: 20 ± 4 mV for dispersion in acetone soon after the ultrasonication. As was mentioned in the introduction section, according to Ginés et al. [
9], the positive zeta potential is only exhibited on nanodiamond with non-zero concentrations of sp
2 bonding, specifically attributed to graphene-like shells. Although it is well known in colloid physics that zeta-potential above +30 mV is expected for stable dispersions, particle dispersions with zeta-potential in a range of +20–30 mV can also maintain the size distribution over a long period of time, depending on the particle size [
28].
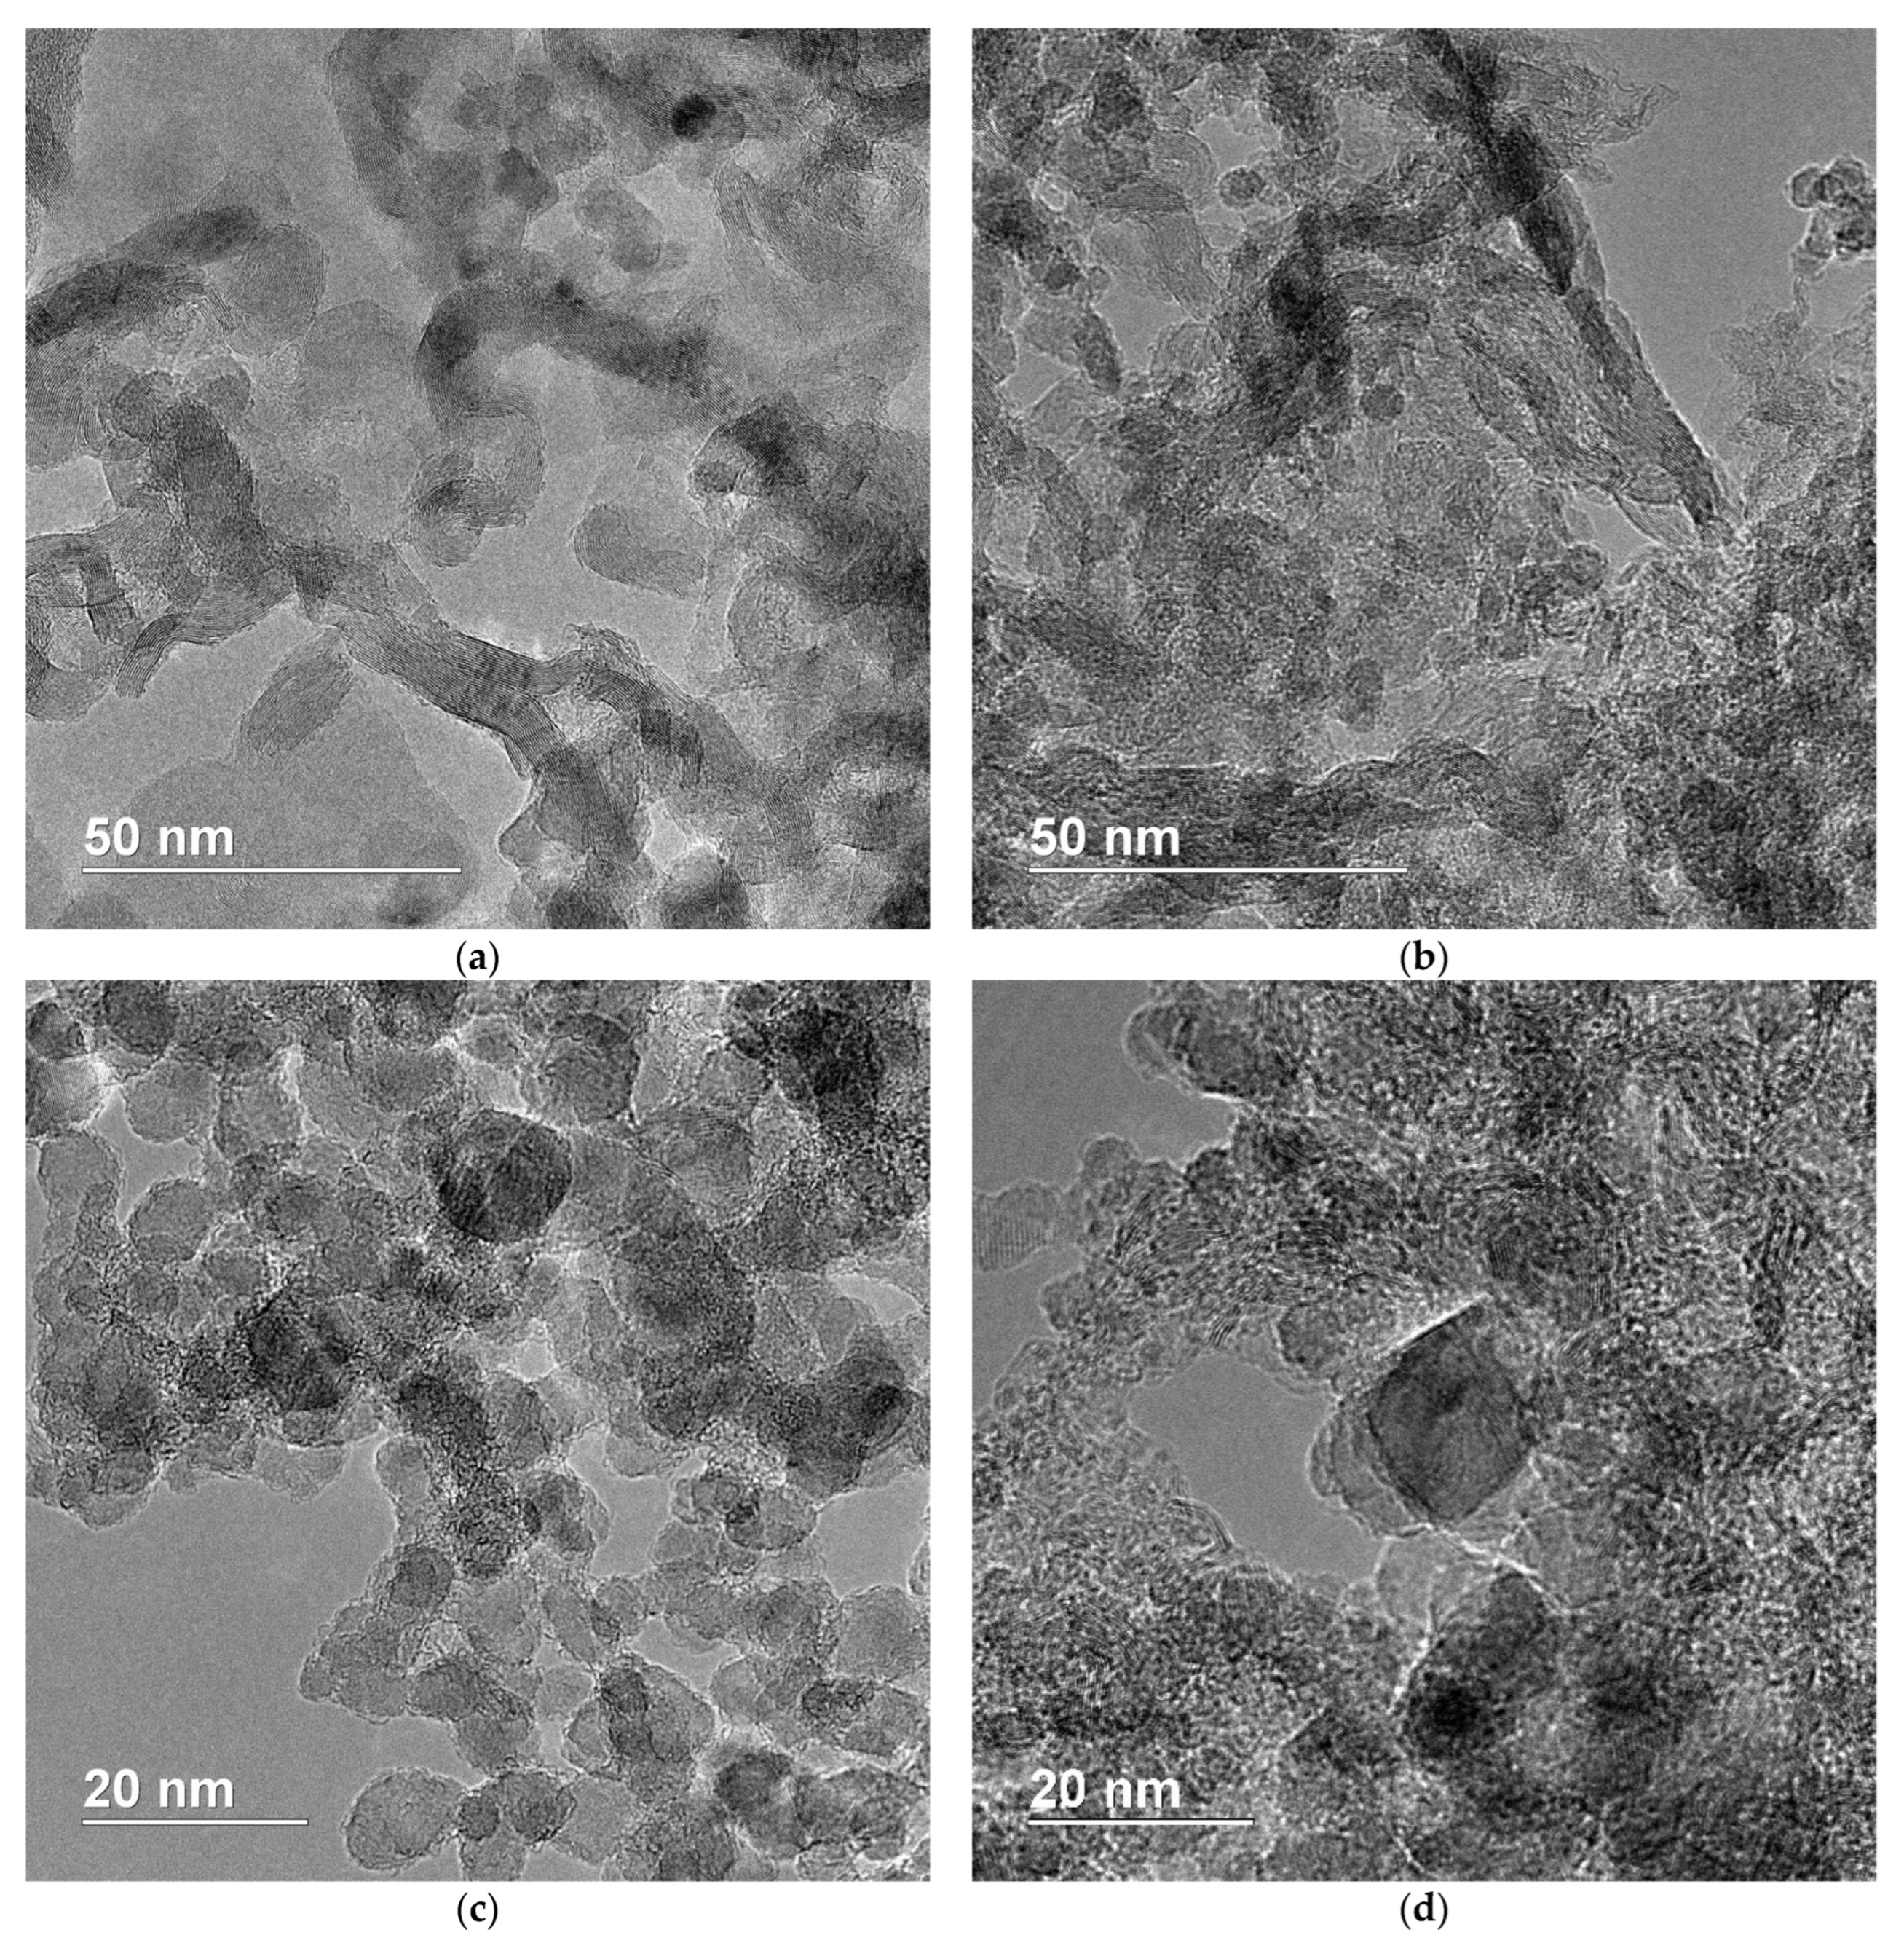
The next step was the investigation of the NDS powder using TEM. Selected results of the microscopy study are presented in
Figure 3.
As it can be seen from the TEM results, especially in
Figure 3a,b, the graphite phase is partially presented in the form of graphite nanoribbons/nanobelts. The primary NDS particles themselves seem to have an average diameter of ~5 nm. The primary NDS particles are considered to be ND crystallites [
12]. Additionally, relatively large flakes of graphite (~10–15 nm) can be observed (
Figure 3c,d).
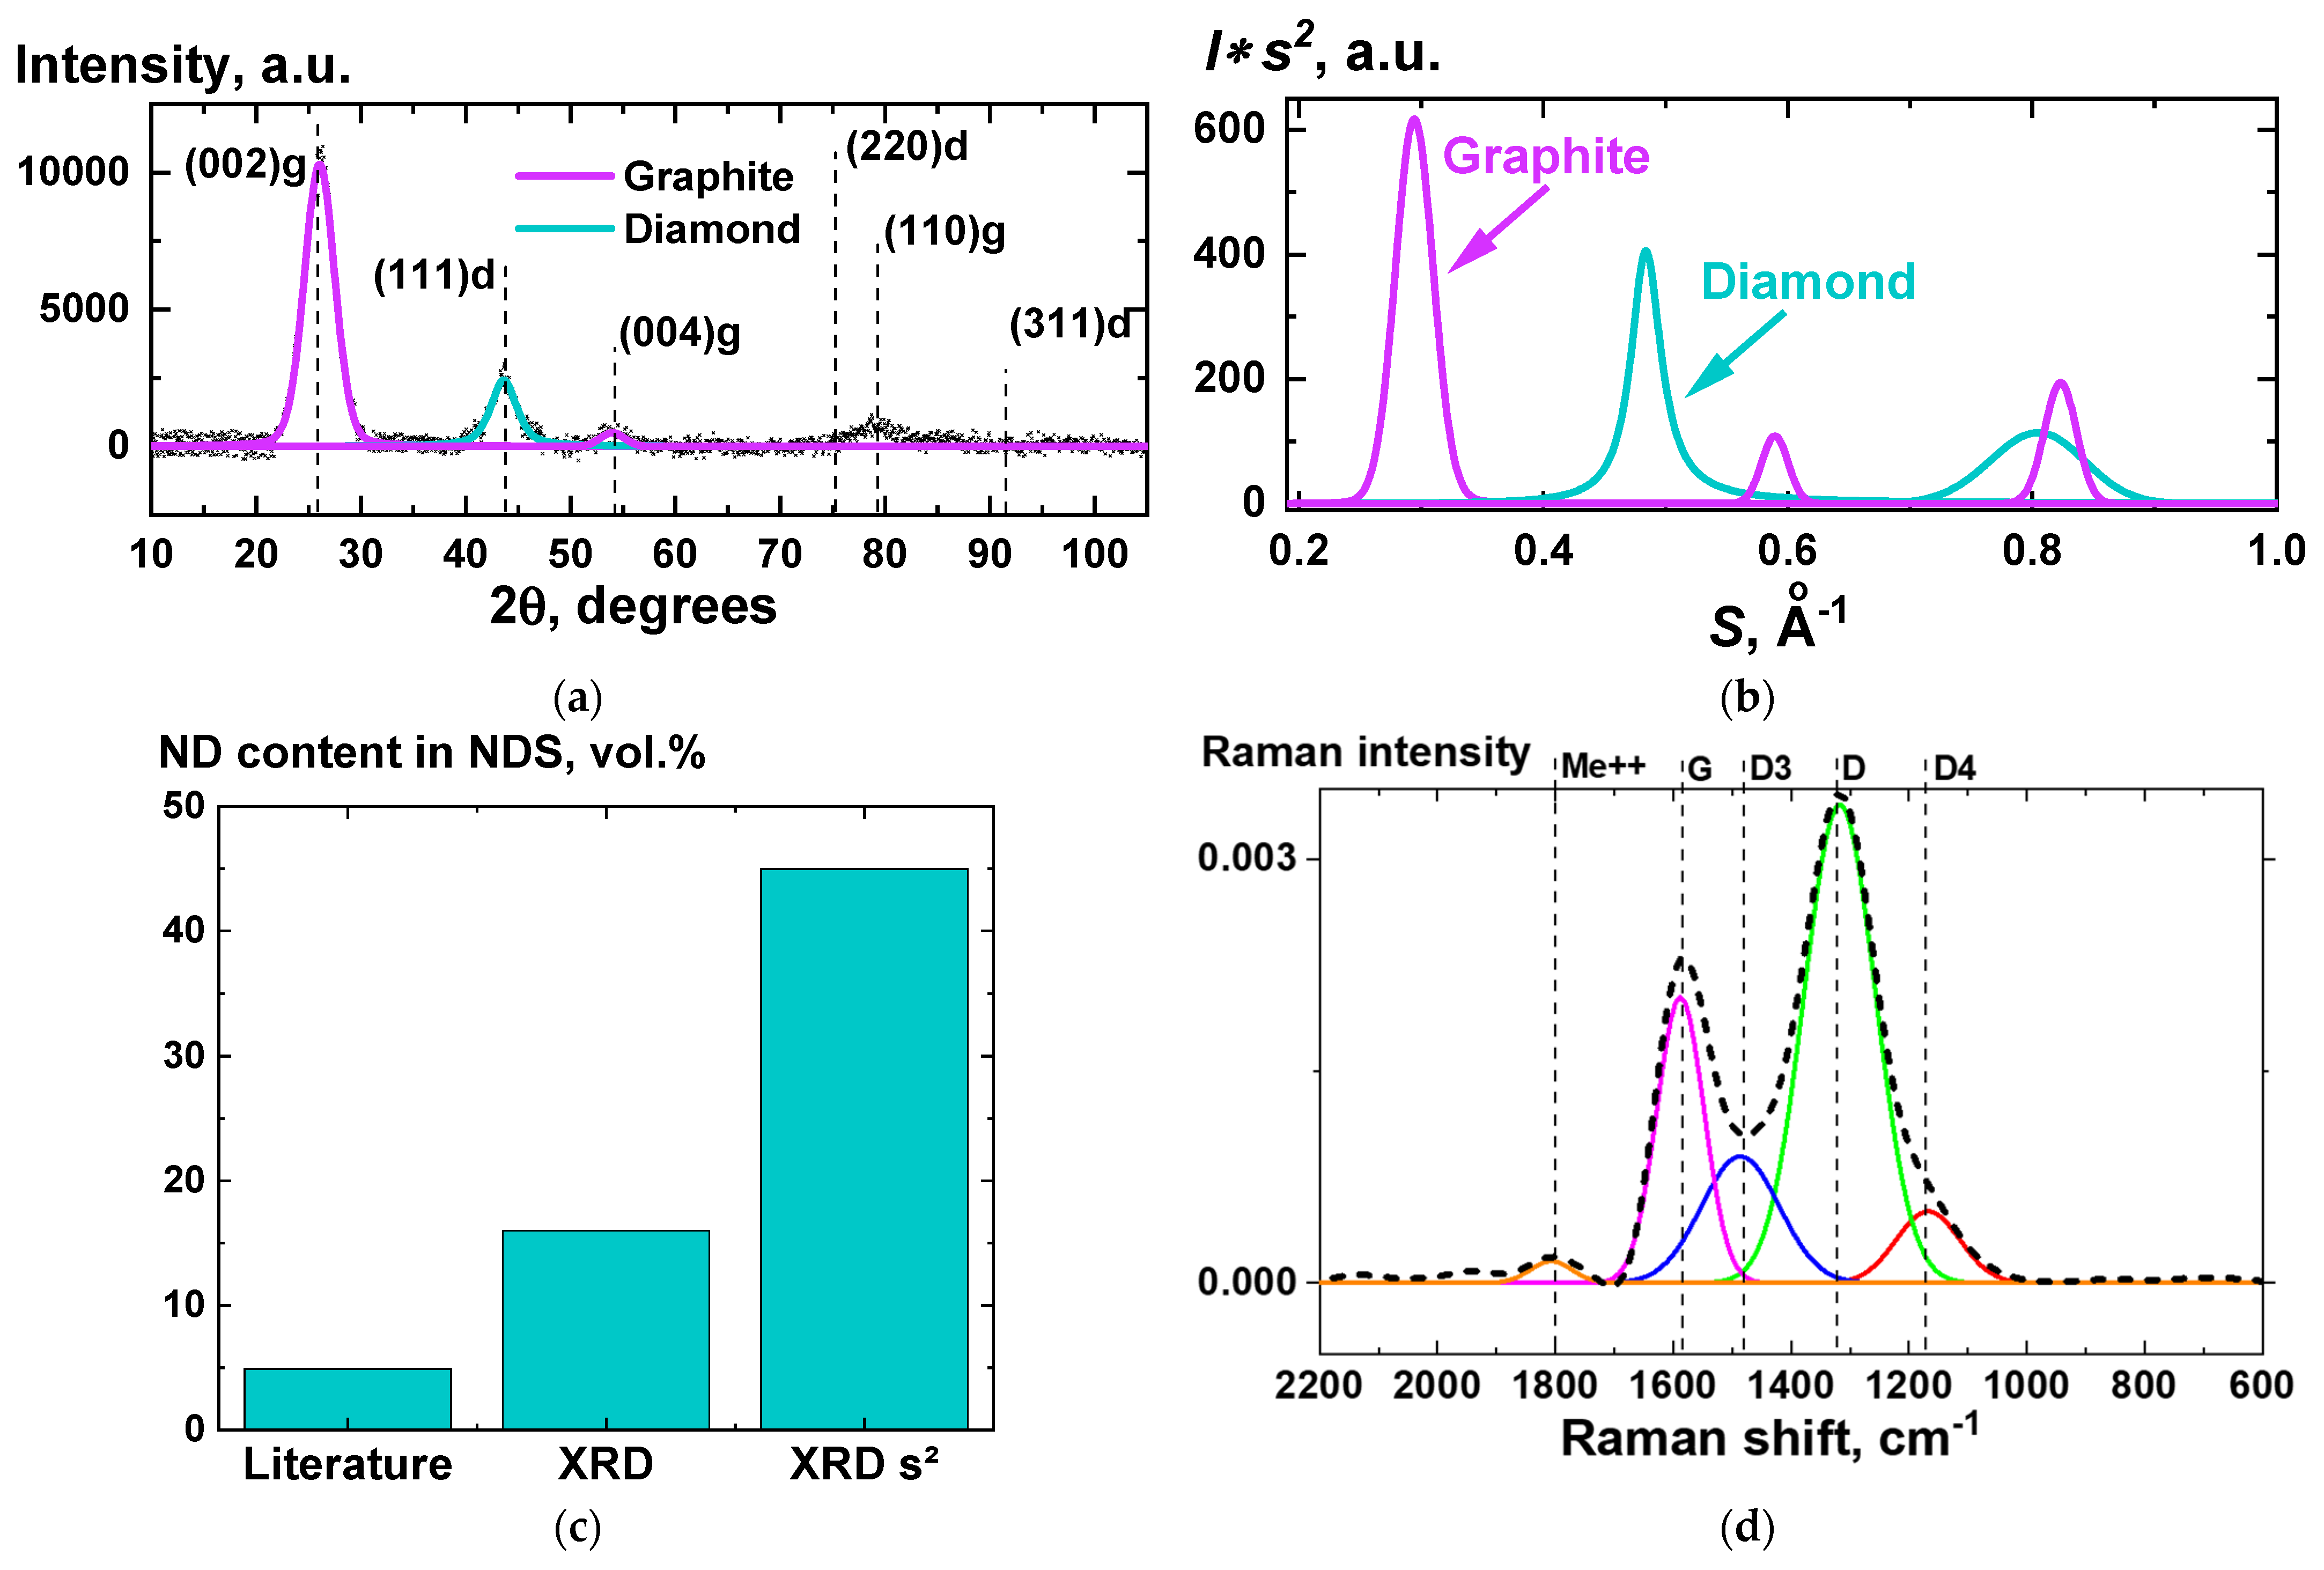
To be able to investigate the composition of NDS particles as well as their structure, XRD and Raman spectroscopy methods were used. The results of the study are presented in
Figure 4.
From the XRD data, it is possible to estimate the interlayer distance between 002 planes of atoms in the graphite phase. According to the literature data [
30], the distance is ~0.35 nm. The experimental value, obtained from the XRD data (
Figure 4a,b) turned out to be very close (0.348 ± 0.05) nm.
From XRD data it is also possible to estimate volume fraction of graphite in the NDS powder. The results of the comparison of the obtained value with the literature data [
11] are given in
Figure 4c. According to the literature, the volume fraction of the NDs in NDS is 4.9 vol.%. Taking into account that this value was obtained using the weighting procedure after purification of NDs, which can lead to a significant decrease of the initial NDs weight value, the real ND content in NDS can be much higher. According to the XRD analysis, the volume fraction of ND in NDS can be estimated as either 16 vol.%, or 45 vol.%, depending if the Ruland’s method [
29] is implemented (
Figure 4b) or not (
Figure 4a). No non-carbon impurities were observed according to the XRD data.
As is known from the publications on highly deformed carbon materials [
31,
32], the Raman scattering bands of the NDS cannot be described by only two bands, G and D. There are always two to three additional bands, which have been labeled according to the literature [
31,
32] in
Figure 4d. The physical meaning of these additional bands is discussed in the relevant publications [
31,
32,
33].
As the additional methods of NDS agglomerate size distribution and NDS particle structure analysis, AFM, along with STM and the electron diffraction method, were used. Selected results of these methods’ implementation are presented in
Figure 5.
It can be seen in
Figure 5a,b that a large NDS agglomerate with diameter ~1.5 µm comprises small strong-coupled [
22] aggregates with diameter of ~250 nm. Thus, it can be said that the AFM results correlate in some way with the SEM (
Figure 1), DLS (
Figure 2a), and LDA (
Figure 2b) data. At the same time, in the STM images (
Figure 5c) isolated ND particles can be observed with the diameter ~4–5 nm, which correlates well with the TEM data (
Figure 3).
In the electron diffraction pattern (
Figure 5d), two characteristic reflexes can be observed, corresponded to the graphite and diamond phases. From the analysis of the graphite reflex, the distance between 002 planes of carbon atoms in graphite can also be evaluated. The obtained value (3.45 ± 0.1) nm was in the range of error from the value taken from the literature [
30] and obtained experimentally from the XRD data (
Figure 4a,b).
To evaluate the potential of the NDS powder as a filler for electroconductive polymer composites, the NDS powder resistivity was measured depending on the volume fraction of the nanoparticles. The results of the comparison of resistivity of NDS and CB powders for various volume fraction values are presented in
Figure 6a. Additionally, composites, based on PP and containing 10 wt.% NDS and 10 wt.% CB, were subjected to annealing at 205 °C, while the resistivity was constantly measured between the two electrodes in contact with the composite melts. The resulting dependencies of resistivity of the composite melts versus time are presented in
Figure 6b.
As can be seen in
Figure 6, both results for resistivity of the NDS powder and the NDS-containing composite demonstrate similar behavior with volume fraction change or with time if to compare with the corresponding dependencies for CB.
For PP-based composites containing 2.5 and 10 wt.% NDS, dependencies of friction coefficient on time were obtained before and after annealing the composites at 205 °C for 2 h. The averaged friction coefficient values versus time curves for six independent runs are presented in
Figure 7a, while the results of averaging of the friction coefficient values versus time of annealing at 205 °C are presented in
Figure 7b. The averaging was performed for the values of friction coefficient in the (2–8) h range of tribological test run time.
4. Discussion
It is known that bonding strength between subunits (primary particles) in an aggregate/agglomerate strongly affects the size of the aggregate/agglomerate determined by different methods, as well the conditions required for the deagglomeration [
10,
22]. Based on the bonding strength between the subunits, agglomerated particles are known to be roughly categorized into “soft” and “hard” agglomerates. It is not expected that nanoparticles agglomerate size distribution, obtained via DLS method, completely corresponds to the agglomerate size distribution in the polymer matrix in a polymer composite. Moreover, size distribution of nanoparticle agglomerates can be affected by the method of processing used to obtain the polymer composite. However, it is believed that certain structural levels of the NDS, e.g., their hard aggregates comprising of strongly bonded individual nanoparticles, are structurally determined rather by fundamental characteristics and intrinsic properties of the primary particles (material, surface charge and functionality) [
10,
22] than by an external medium. In this case, specifics of the size distributions of different structural elements for different states of the nanoparticles (powder, dispersion in a liquid medium, filler in a polymer matrix) can be correlated with each other. That is why we believe that the methods used are sufficiently informative for characterization of the NDS aggregates/agglomerates.
From the data obtained using SEM (
Figure 1), DLS (
Figure 2a), LDA (
Figure 2b), and AFM (
Figure 5a,b), it was concluded that NDS primary particles tend to aggregate/agglomerate into aggregates/agglomerates of a certain size relatively independently of the medium they are dispersed in, or for how long they are kept in that medium. This feature makes NDS a good model object for the research of properties of composite materials to compare the effect of different polymer matrices on the overall properties of the composites.
The results of TEM (
Figure 3), XRD (
Figure 4a,b), Raman spectroscopy (
Figure 4d), STM (
Figure 5c), and electron diffraction (
Figure 5d) show that, along with the NDs, a high amount of graphite (
Figure 4c) is present in NDS. While ND crystallites of ~4–5 nm gather up in relatively small strong-coupled agglomerates, they are surrounded by graphite in a nanoribbon form. Although from the microscopy data it is possible to roughly estimate the transverse dimensions of the nanoribbons (5–10 nm), estimation of longitudinal dimensions can be quite difficult. At the same time, the microscopy data are sufficient to draw conclusions about the high aspect ratio of such graphite nanoribbons. Due to the high aspect ratio of such a form of graphite, it is possible to achieve very low percolation thresholds for electrical conductivity, as was demonstrated in [
16]. At the same time, as the results of XRD and electron diffraction indicate, the graphite phase in NDS is not defective, meaning it can provide decent levels of electrical conductivity even in NDS contain a high fraction of non-conductive NDs. This data agrees with the results of comparison of resistivity for NDS and CB powders for various volume fraction values (
Figure 6a), as well as with the results of resistivity measurements with time for composite melts containing NDS and CB. The increase in electrical conductivity of the composite material based on PP is caused by an increase in the concentration of NDS in the near-surface layer when the composite is subjected to thermal treatment at melting temperature [
21], as is shown in
Figure 6b. High electric conductivity of NDS is a consequence of its structural specifics, such as the presence of graphite phase in the form of nanoribbons.
Results of the tribological tests (
Figure 7) allow us to say that using the effect of nanoparticles migration to the boundaries of nanocomposite melt, as was investigated in [
21], can be an effective way to improve tribological properties of composite materials filled with NDS particles, specifically due to the presence in NDS of the extremely hard ND cores [
12,
18,
19]. Particularly, it can be seen in
Figure 7 that annealing time effectively acted as an increase of the filler content in the composite, which agrees with the conclusions made in [
21] on the process of enrichment of a composite melt surface layer with time.
Altogether the results presented in this work demonstrate the versatility and utility of such easily obtainable and cheap filler as NDS. While containing simultaneously hard and chemically resistant ND particles and flexible electrically conductive graphite nanoribbons with a high aspect ratio, NDS has a potential to help meet multiple requirements for a polymer composite by improving different characteristics of the composite simultaneously. This, along with affordability of the filler, can be a very appealing factor for many industries working with polymer composites and looking to find a way to improve the product by substituting such conventional fillers such as CB.
As for future research, implementation of the NDS investigated in this work as a filler used to improve characteristics of ultra-high-molecular-weight polyethylene-based laminates is planned. Additionally, we plan to investigate NDS of different synthesis and study how it affects polymer composites filled with NDS of different types.


 ,
, 


