
Viability of Activated Carbon Derived from Polystyrene Sulphonate Beads as Electrical Double Layer Capacitors

 , ,
, ,
Abstract
:1. Introduction
2. Materials and Methods
2.1. Materials
Resin Pyrolysis and Activation
2.2. Experimental Procedure
Solid Electrode Preparation for CV and EIS Studies
2.3. Physical Characterization
2.4. Electrochemical Characterizations
3. Results
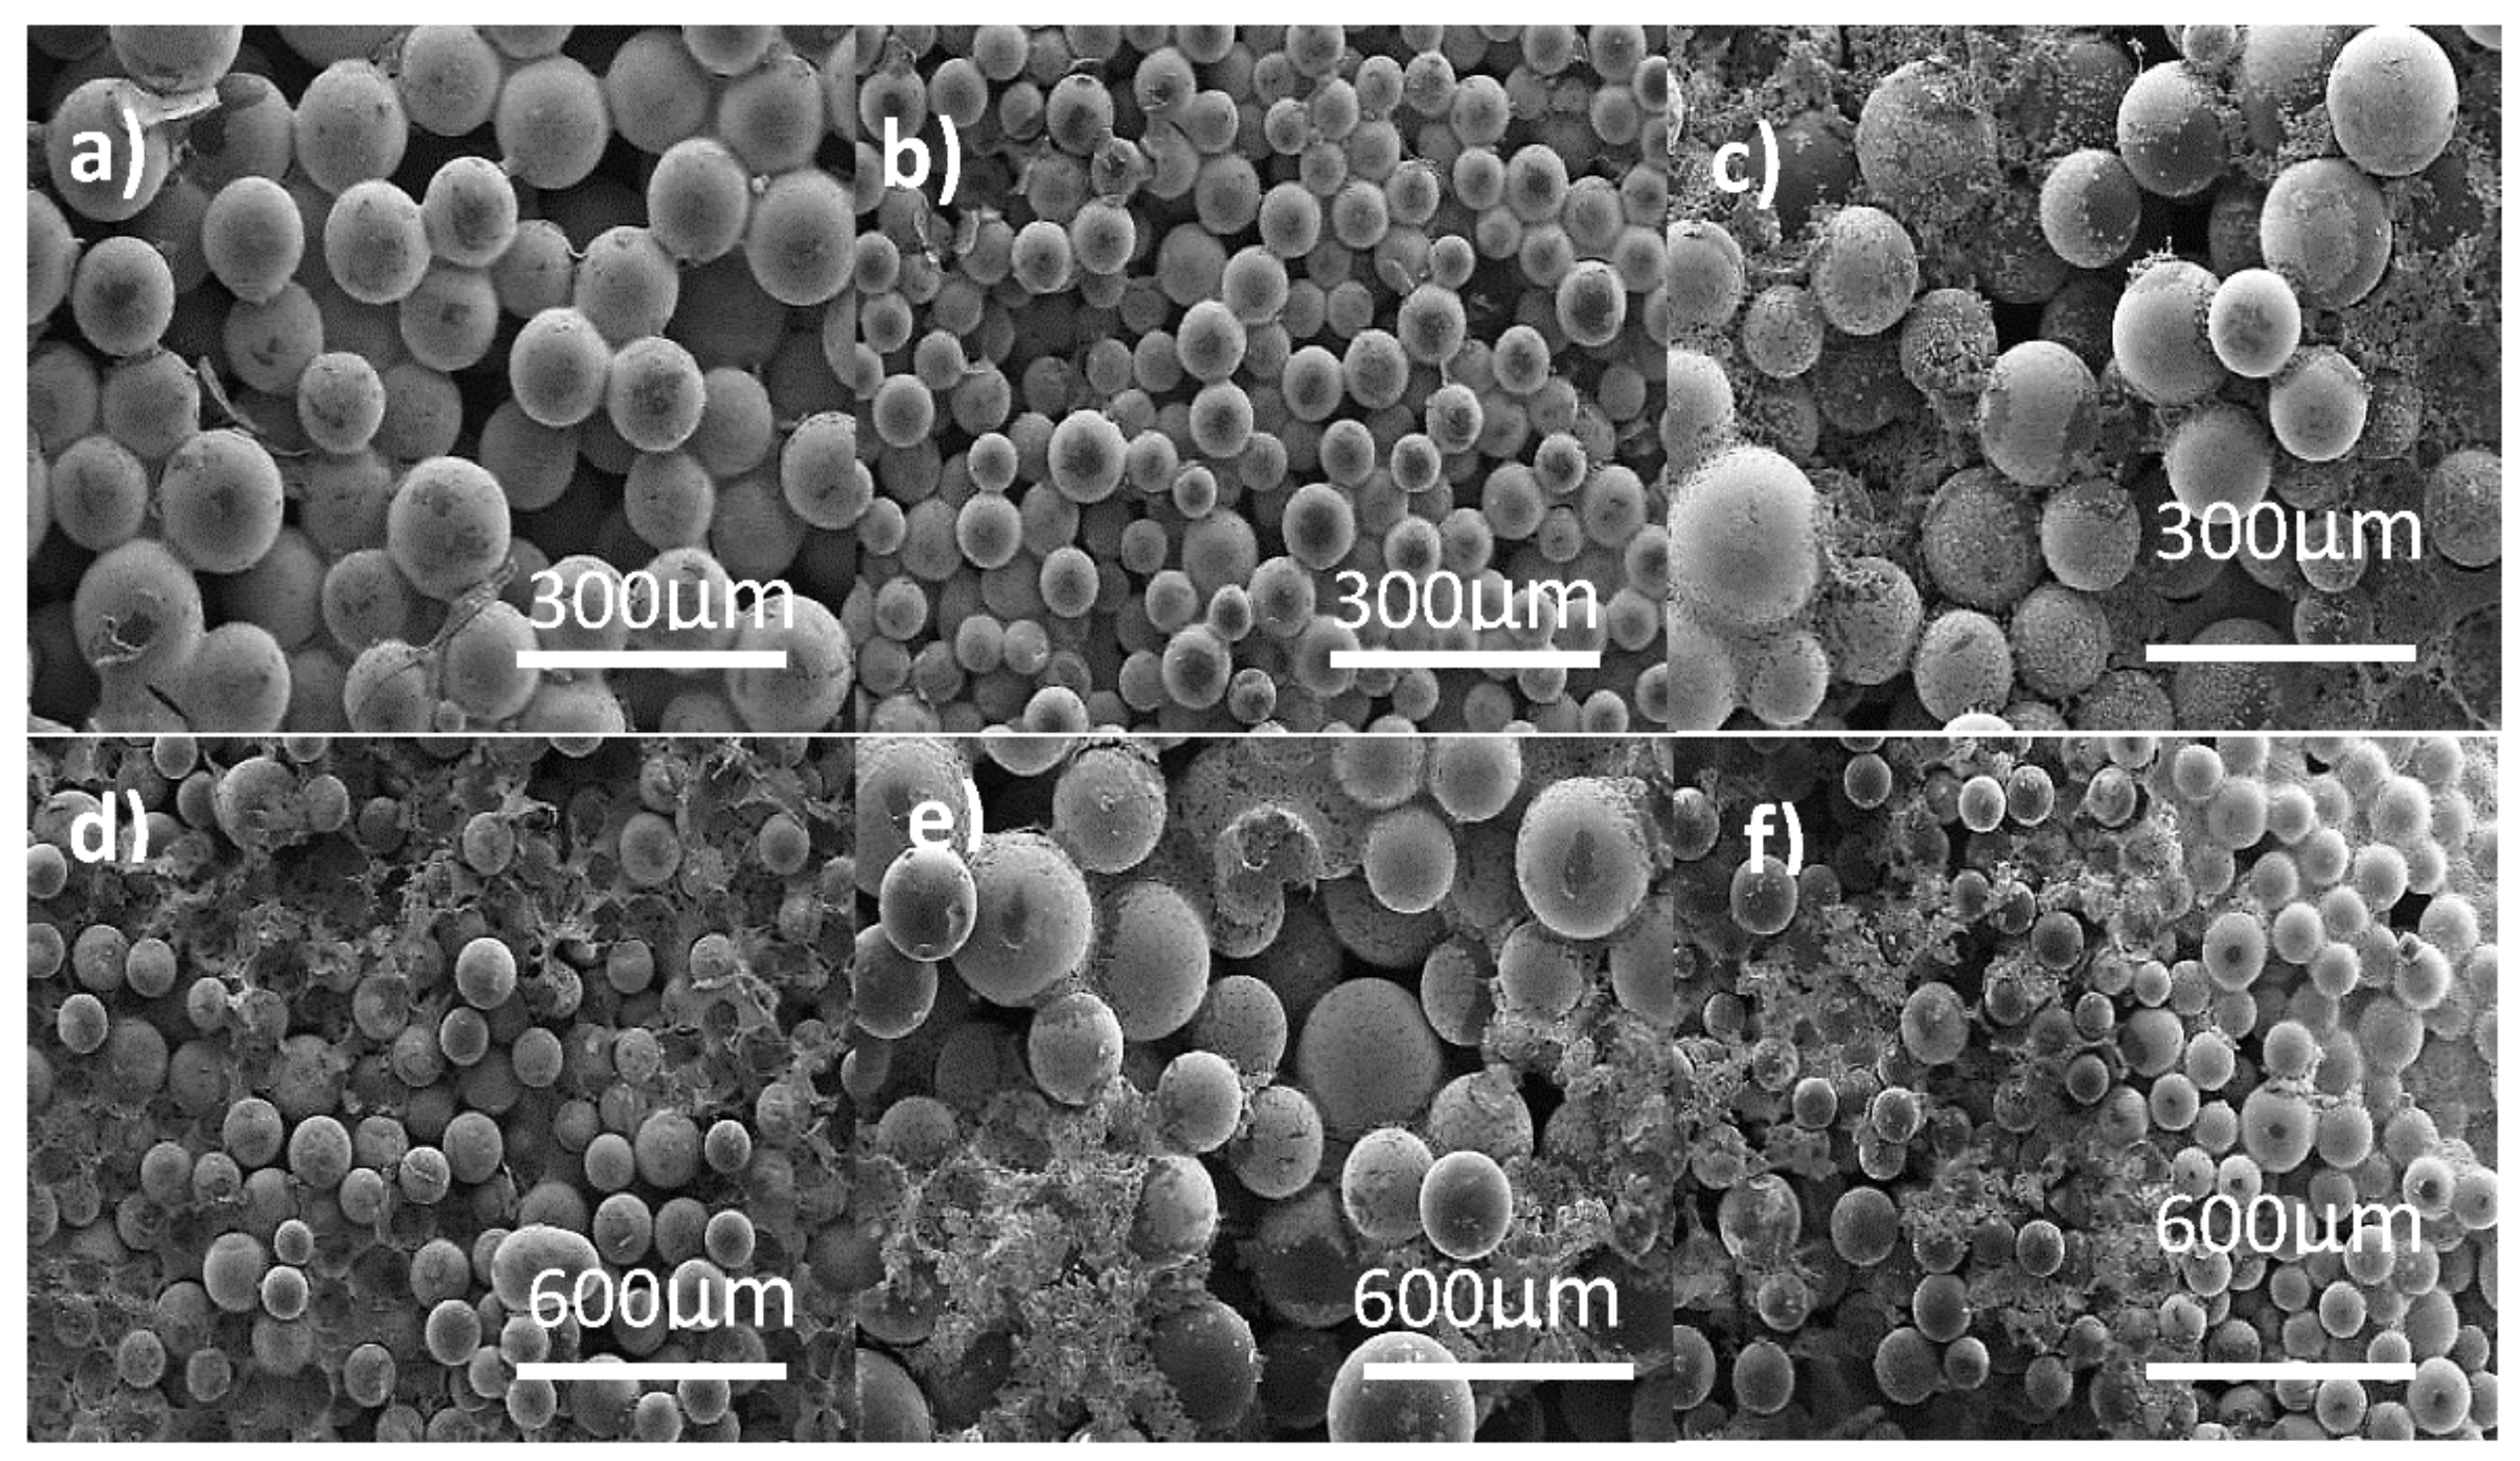
3.1. SEM Study
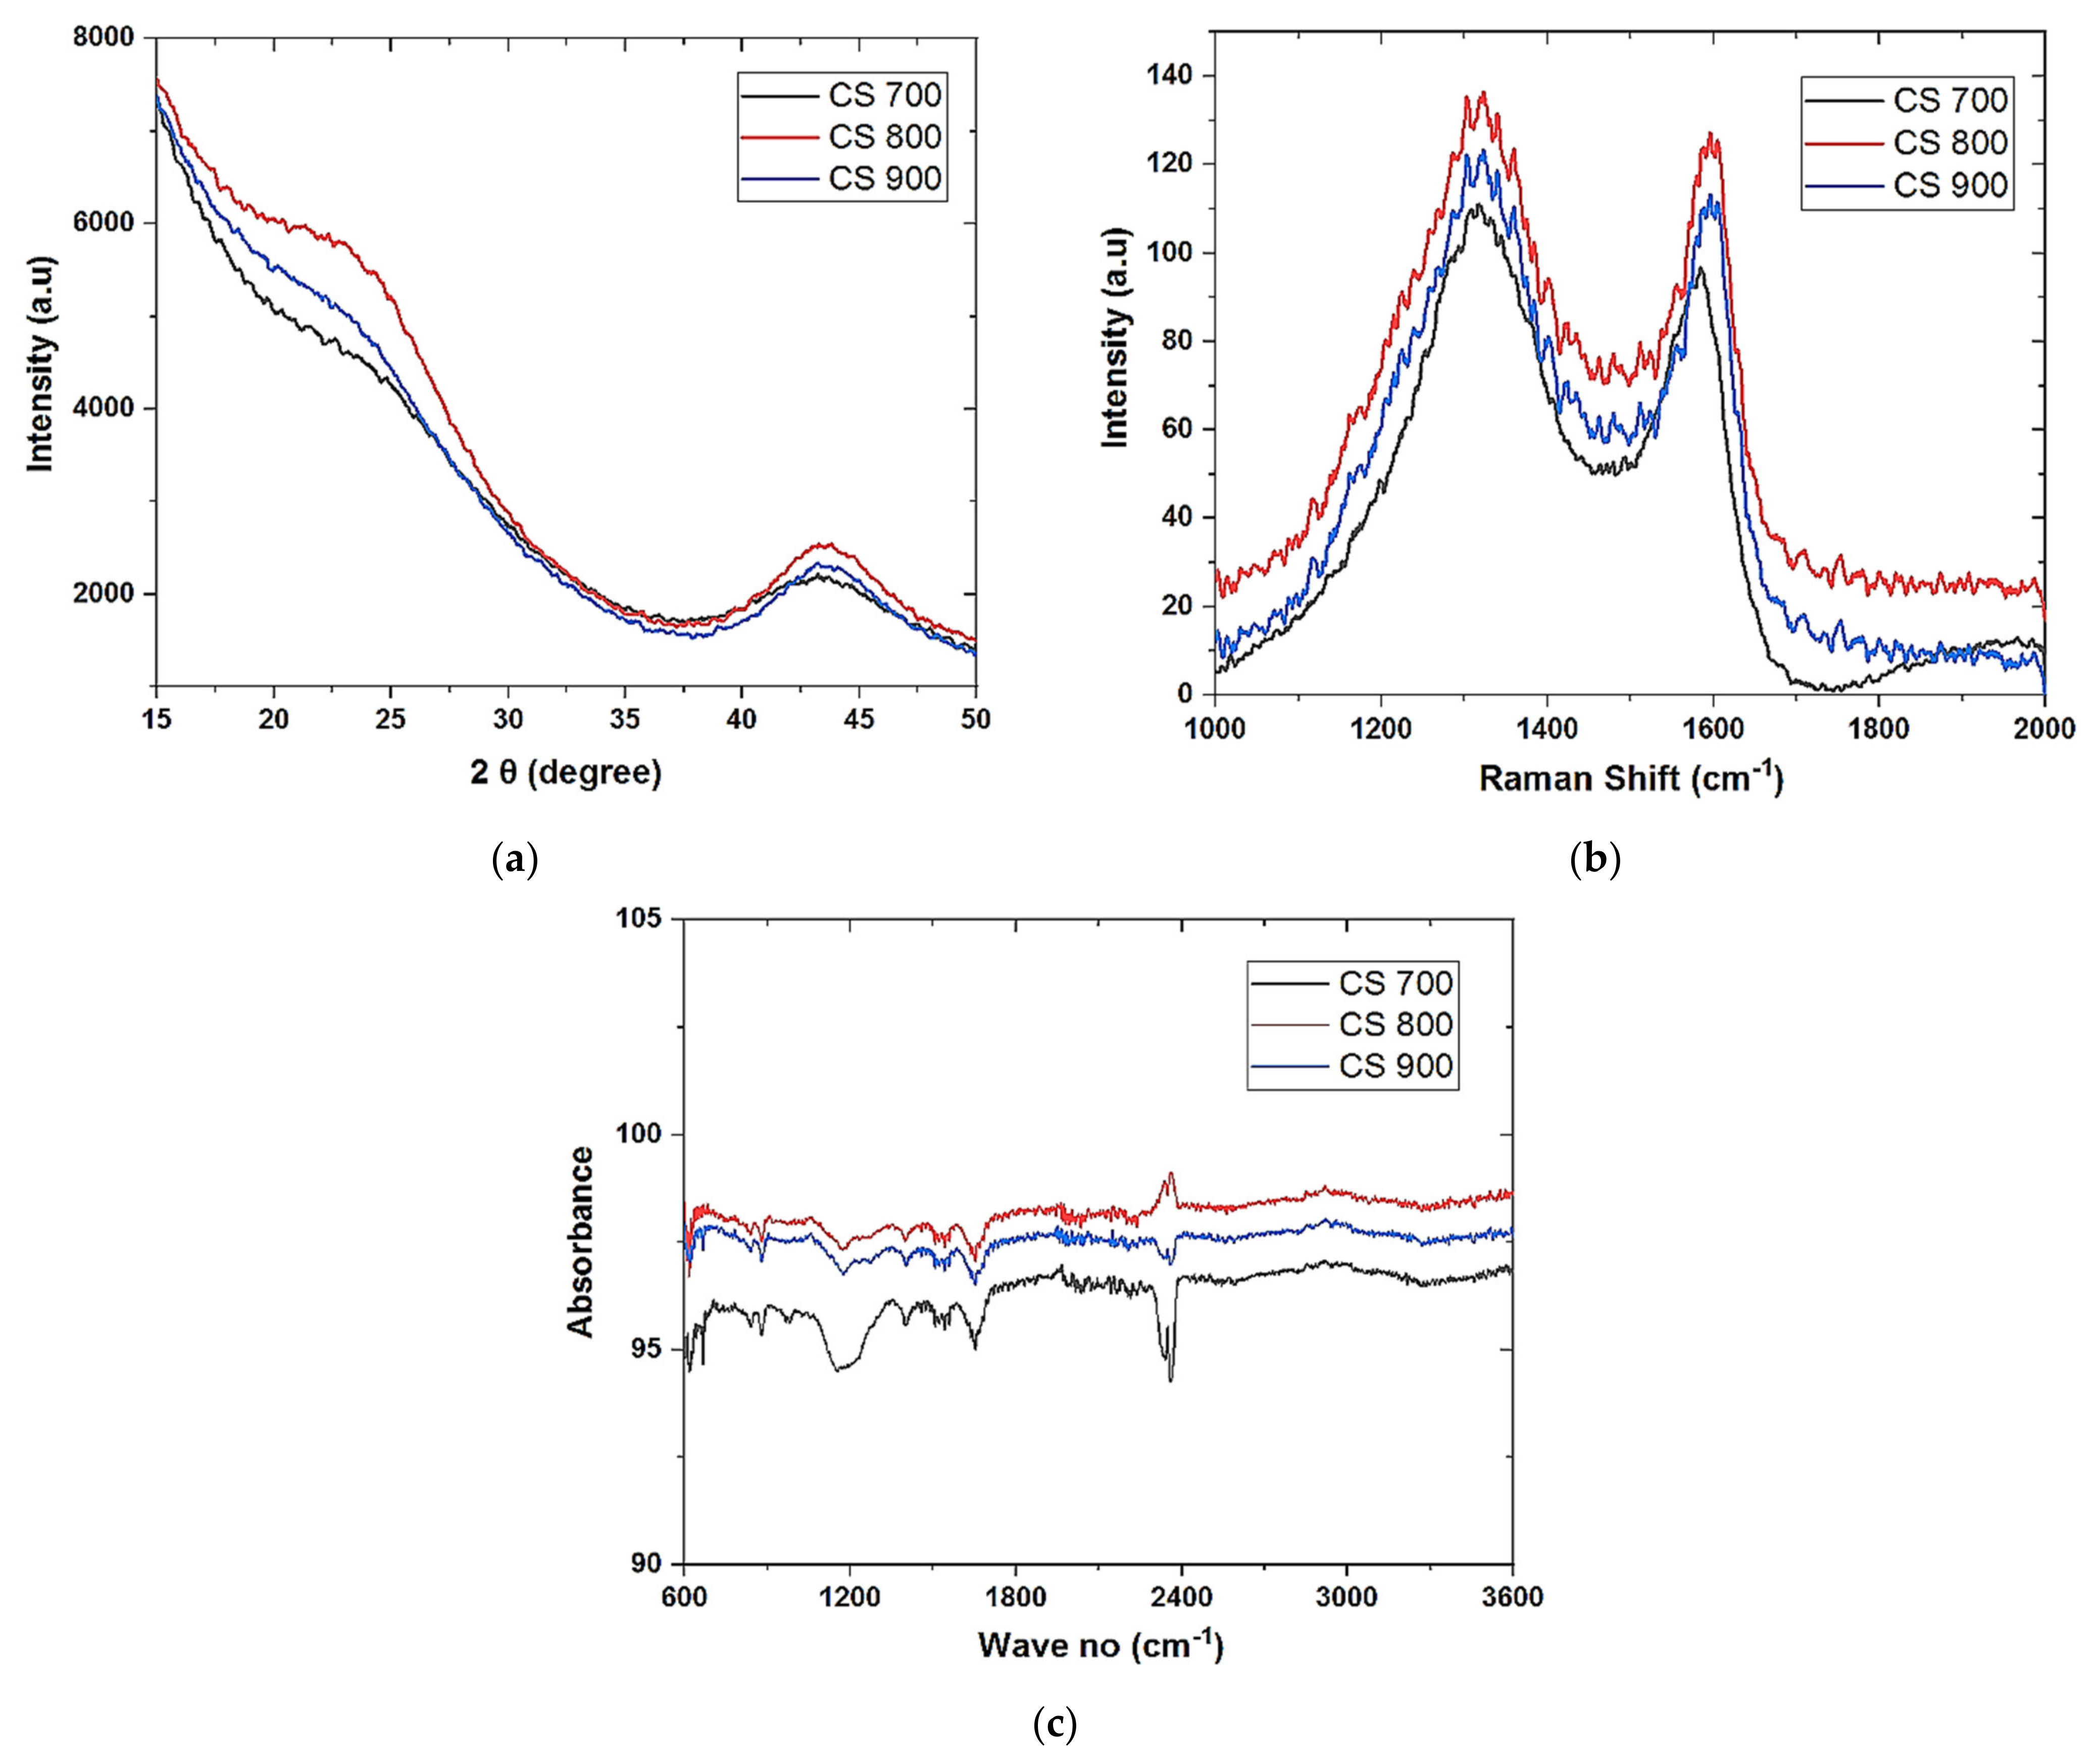
3.2. XRD Studies
3.3. Raman Studies
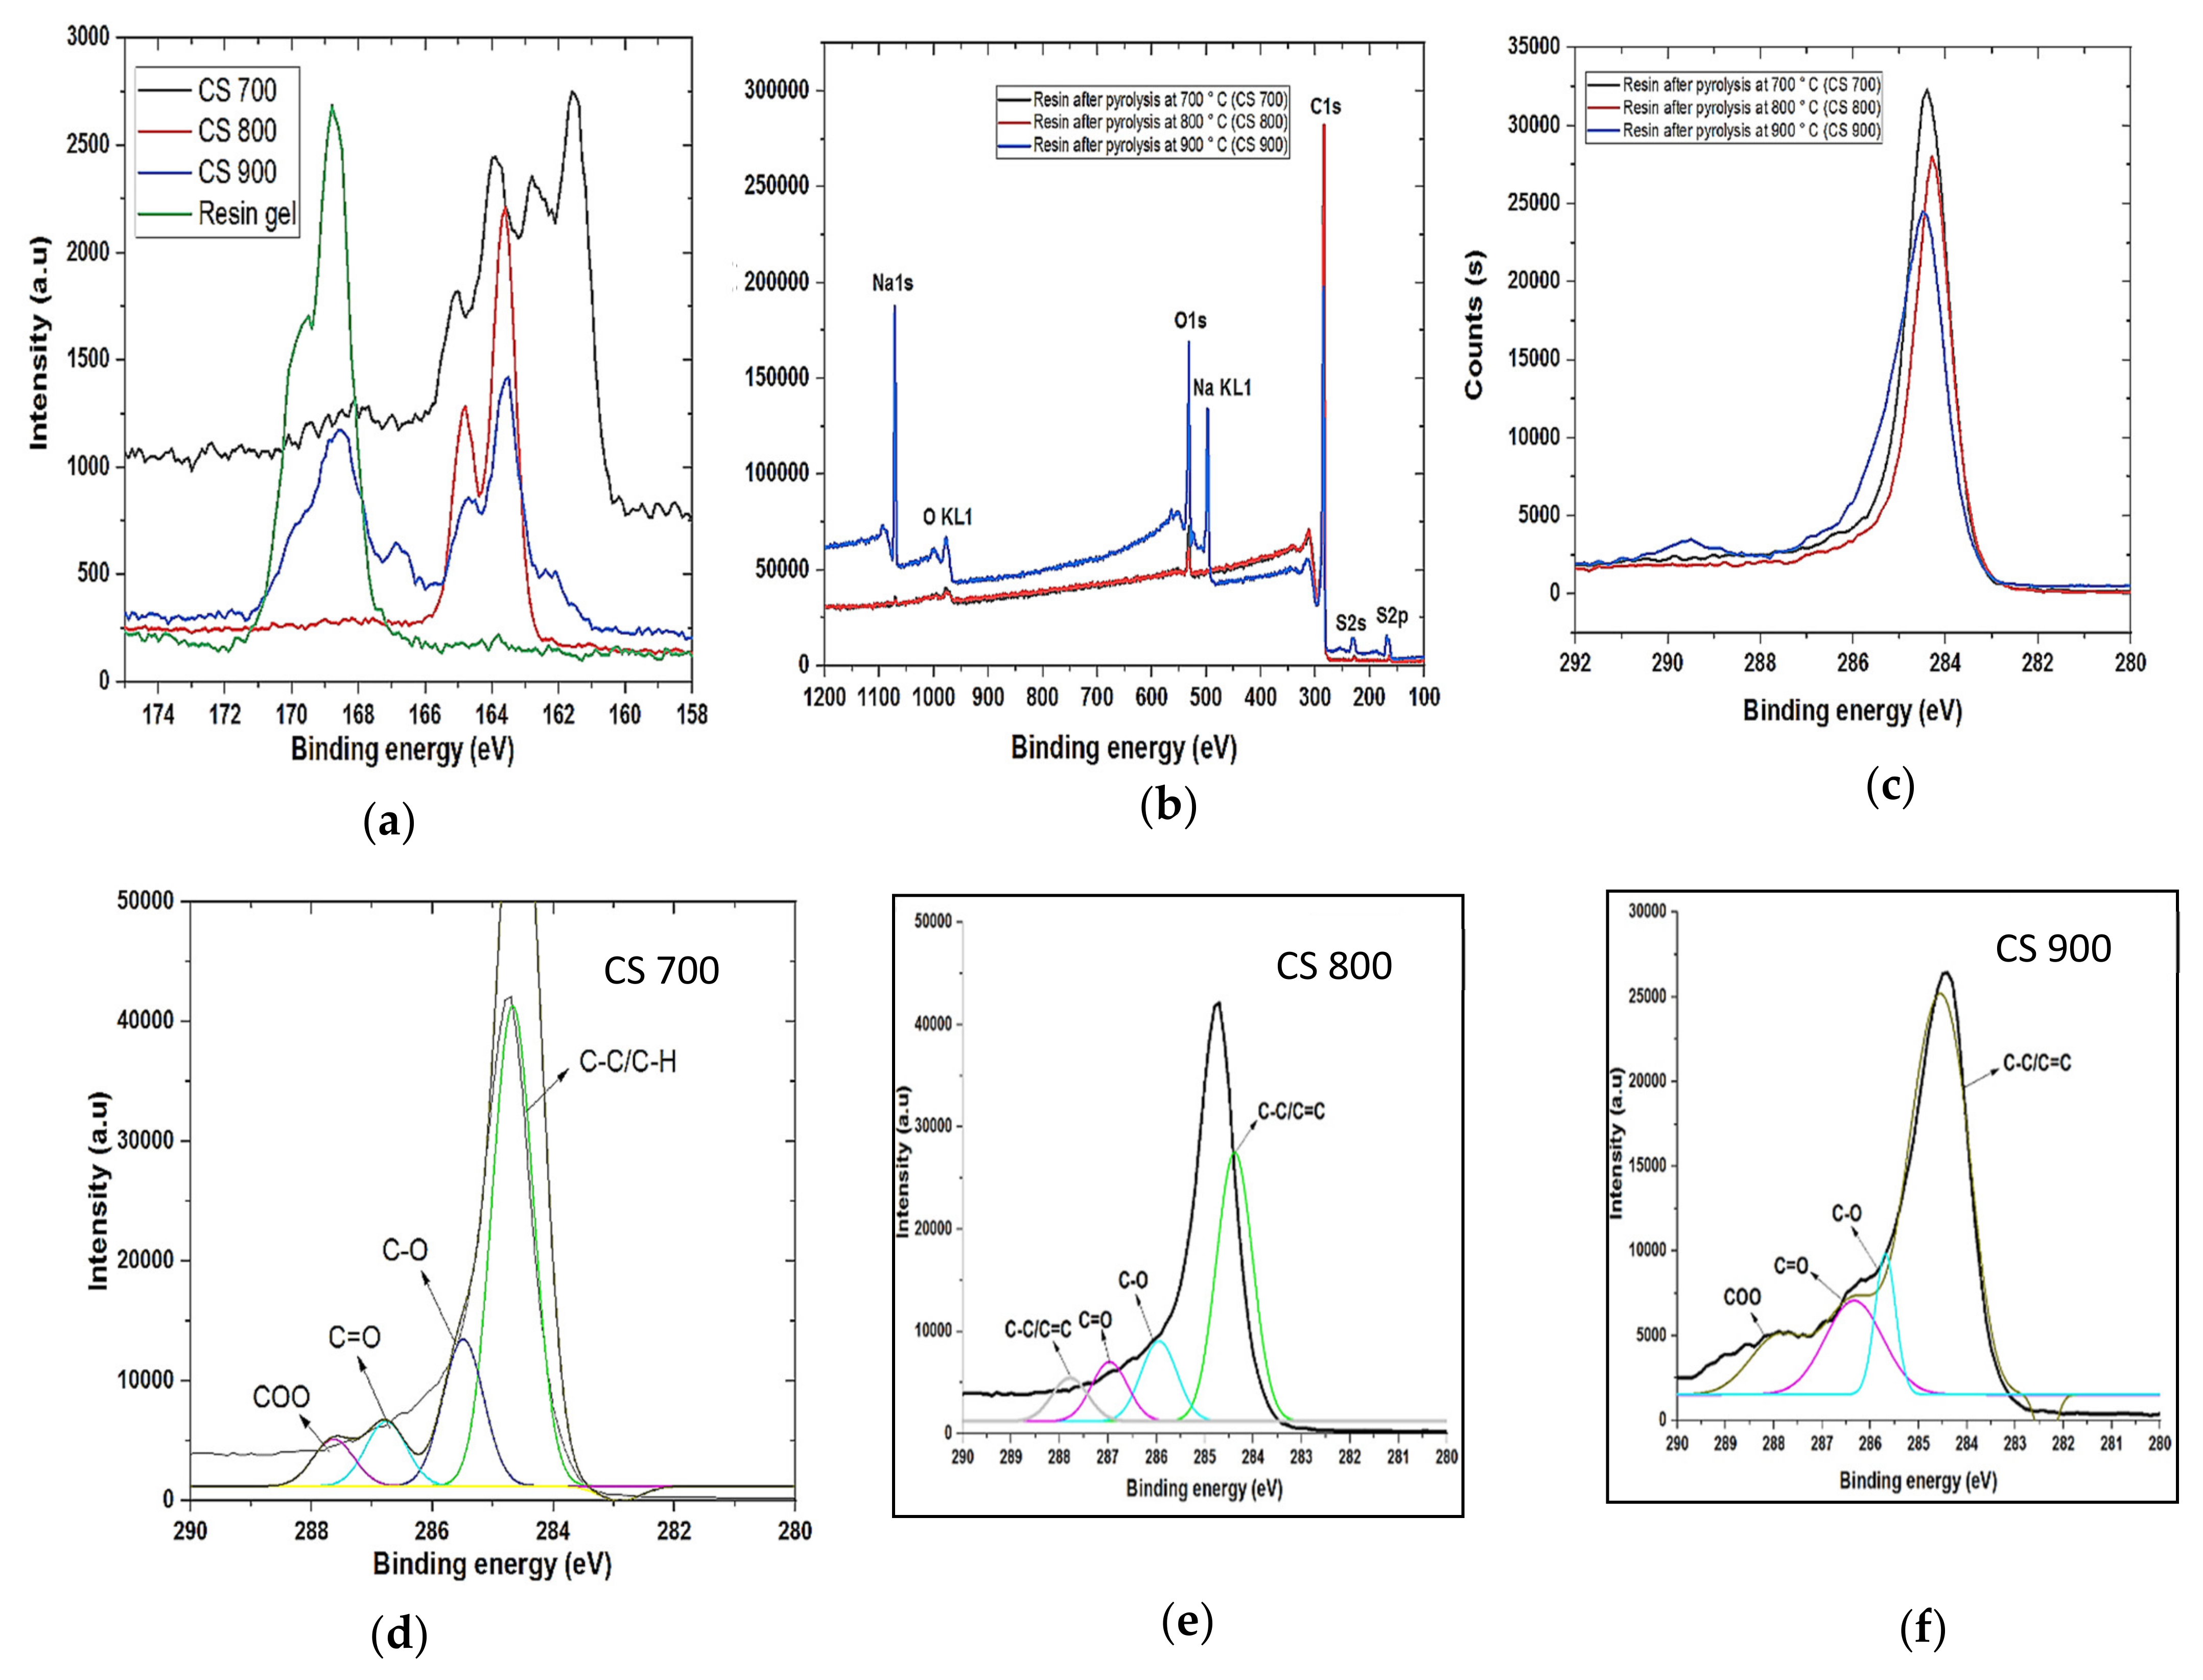
3.4. EDS, FTIR, and XPS Studies
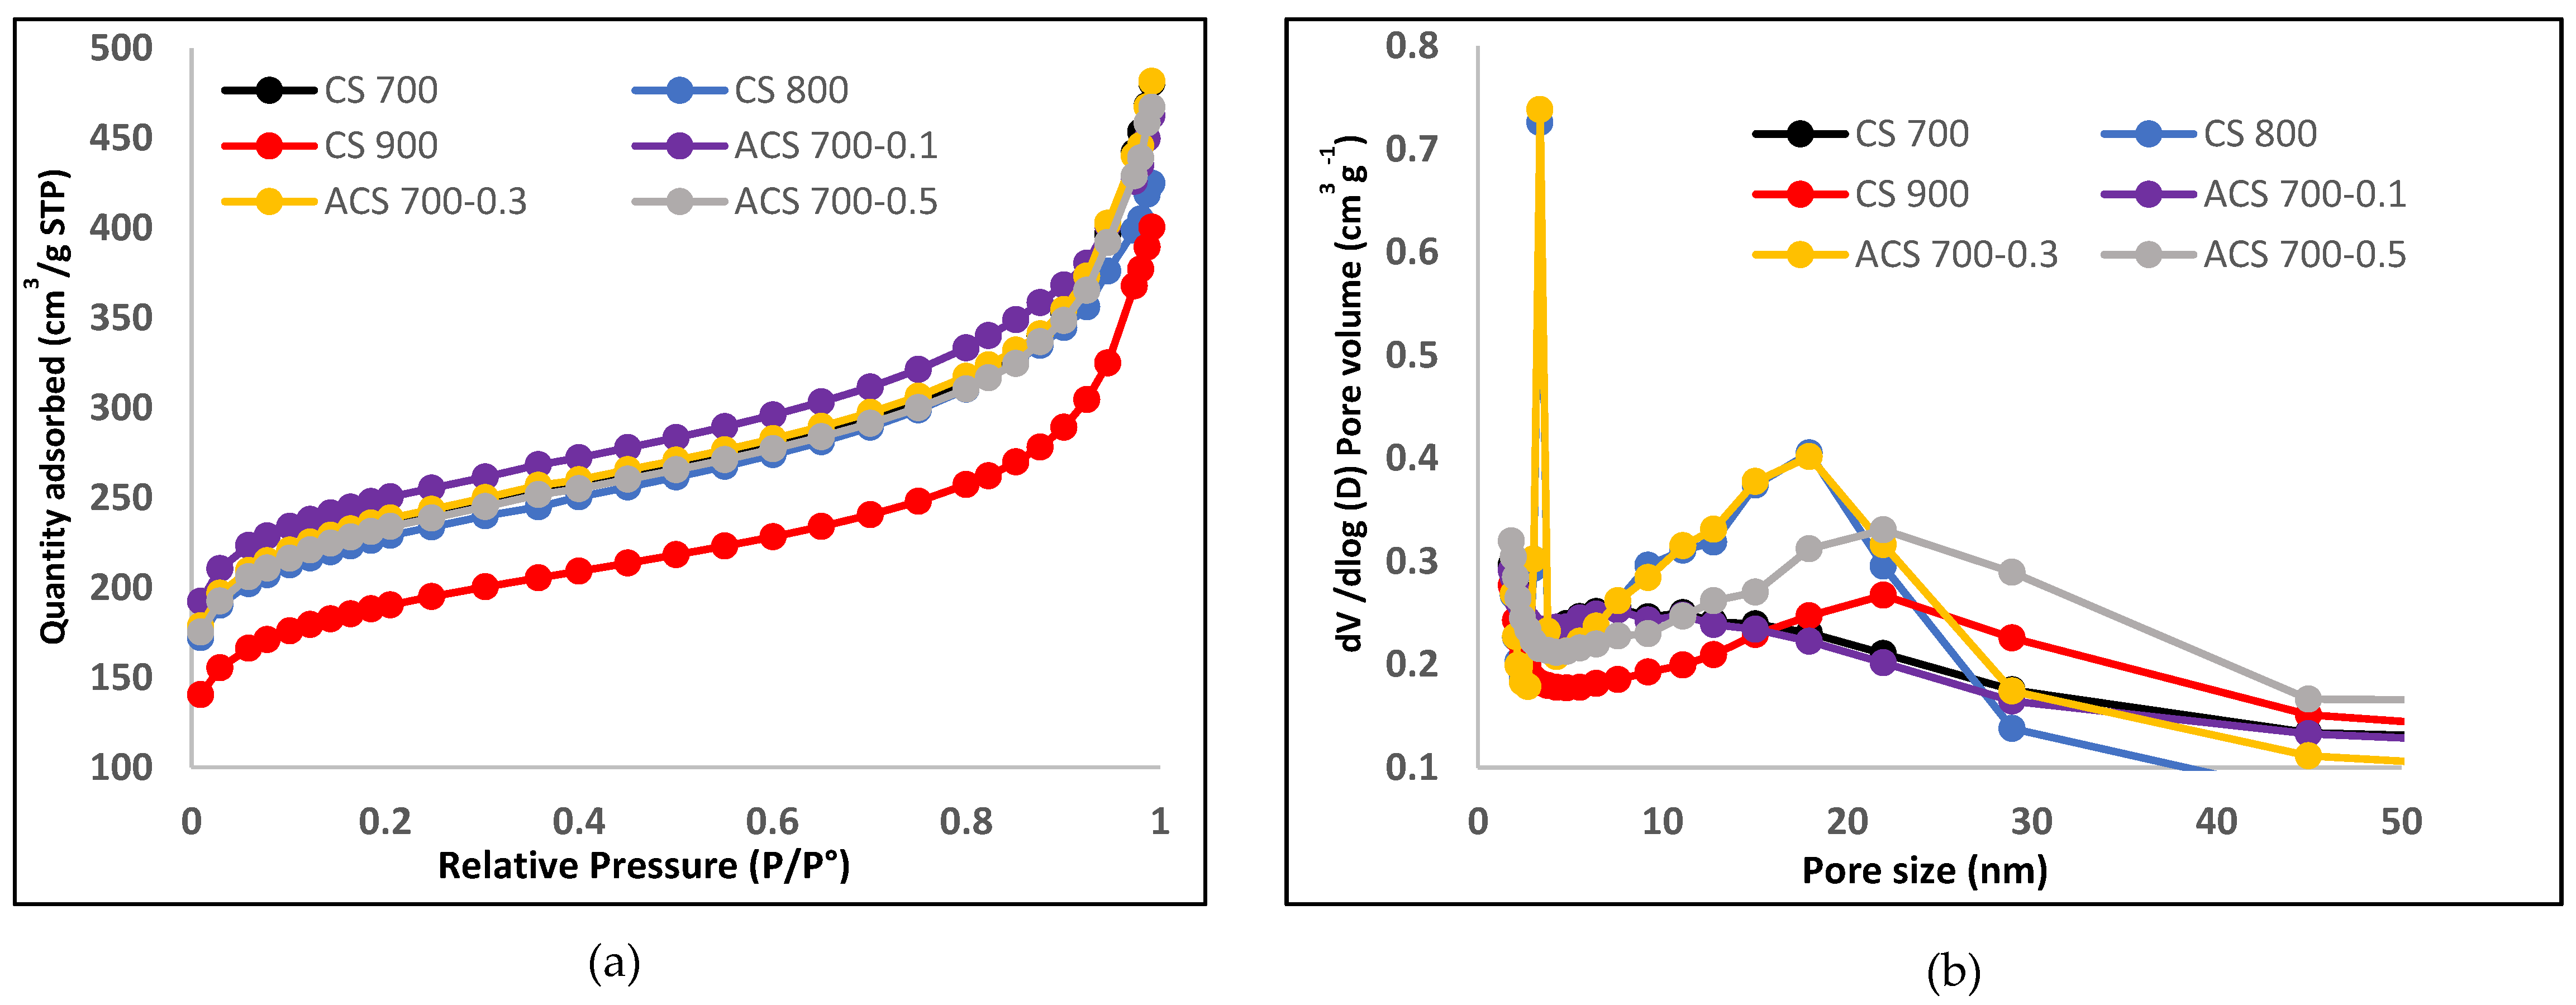
3.5. Textural Properties
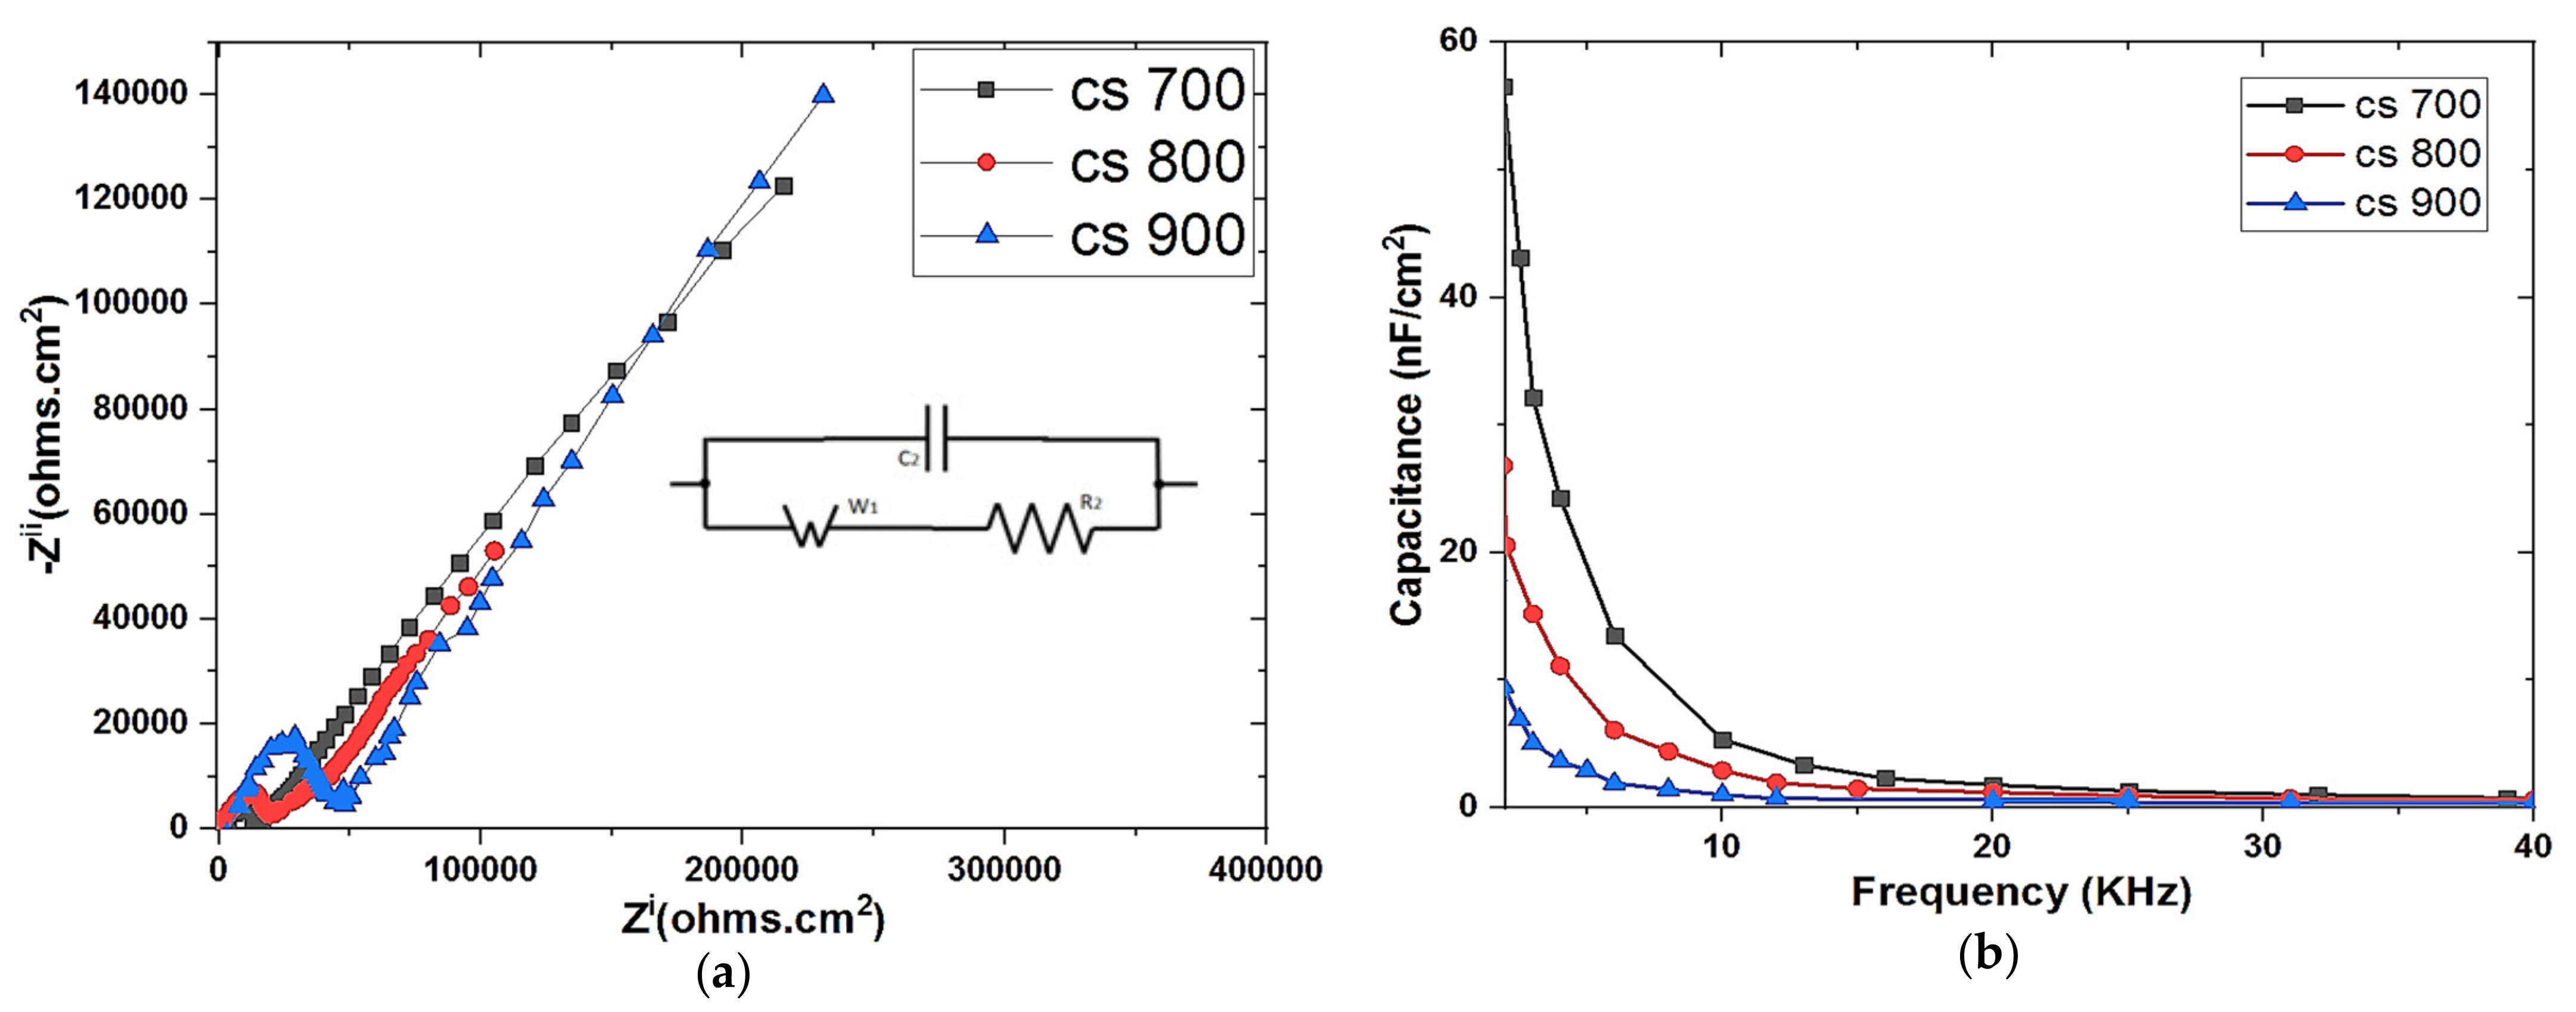
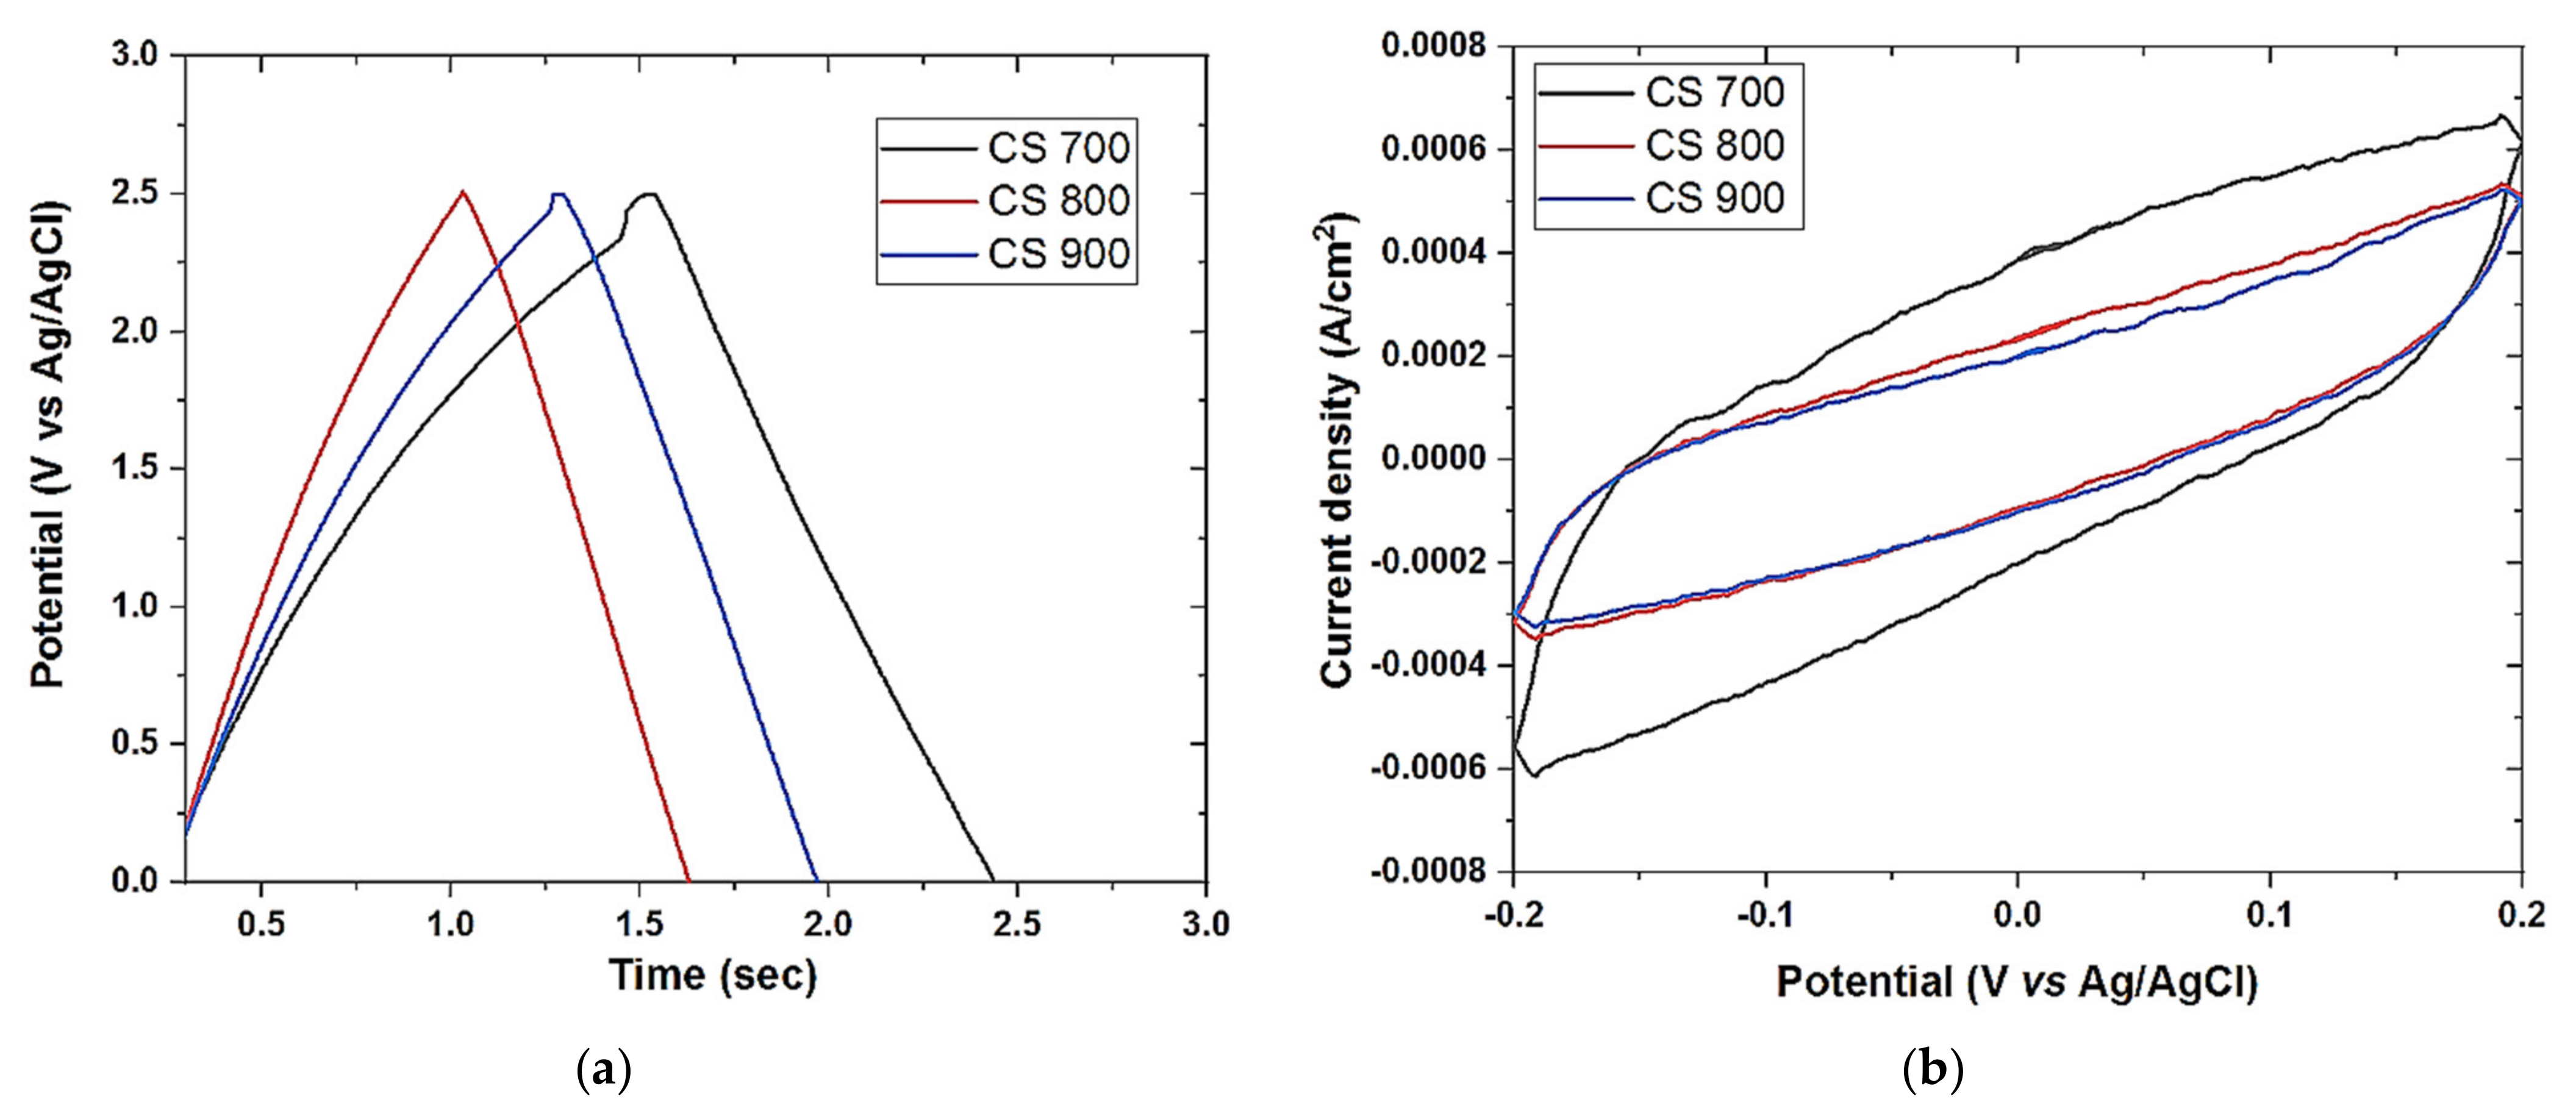
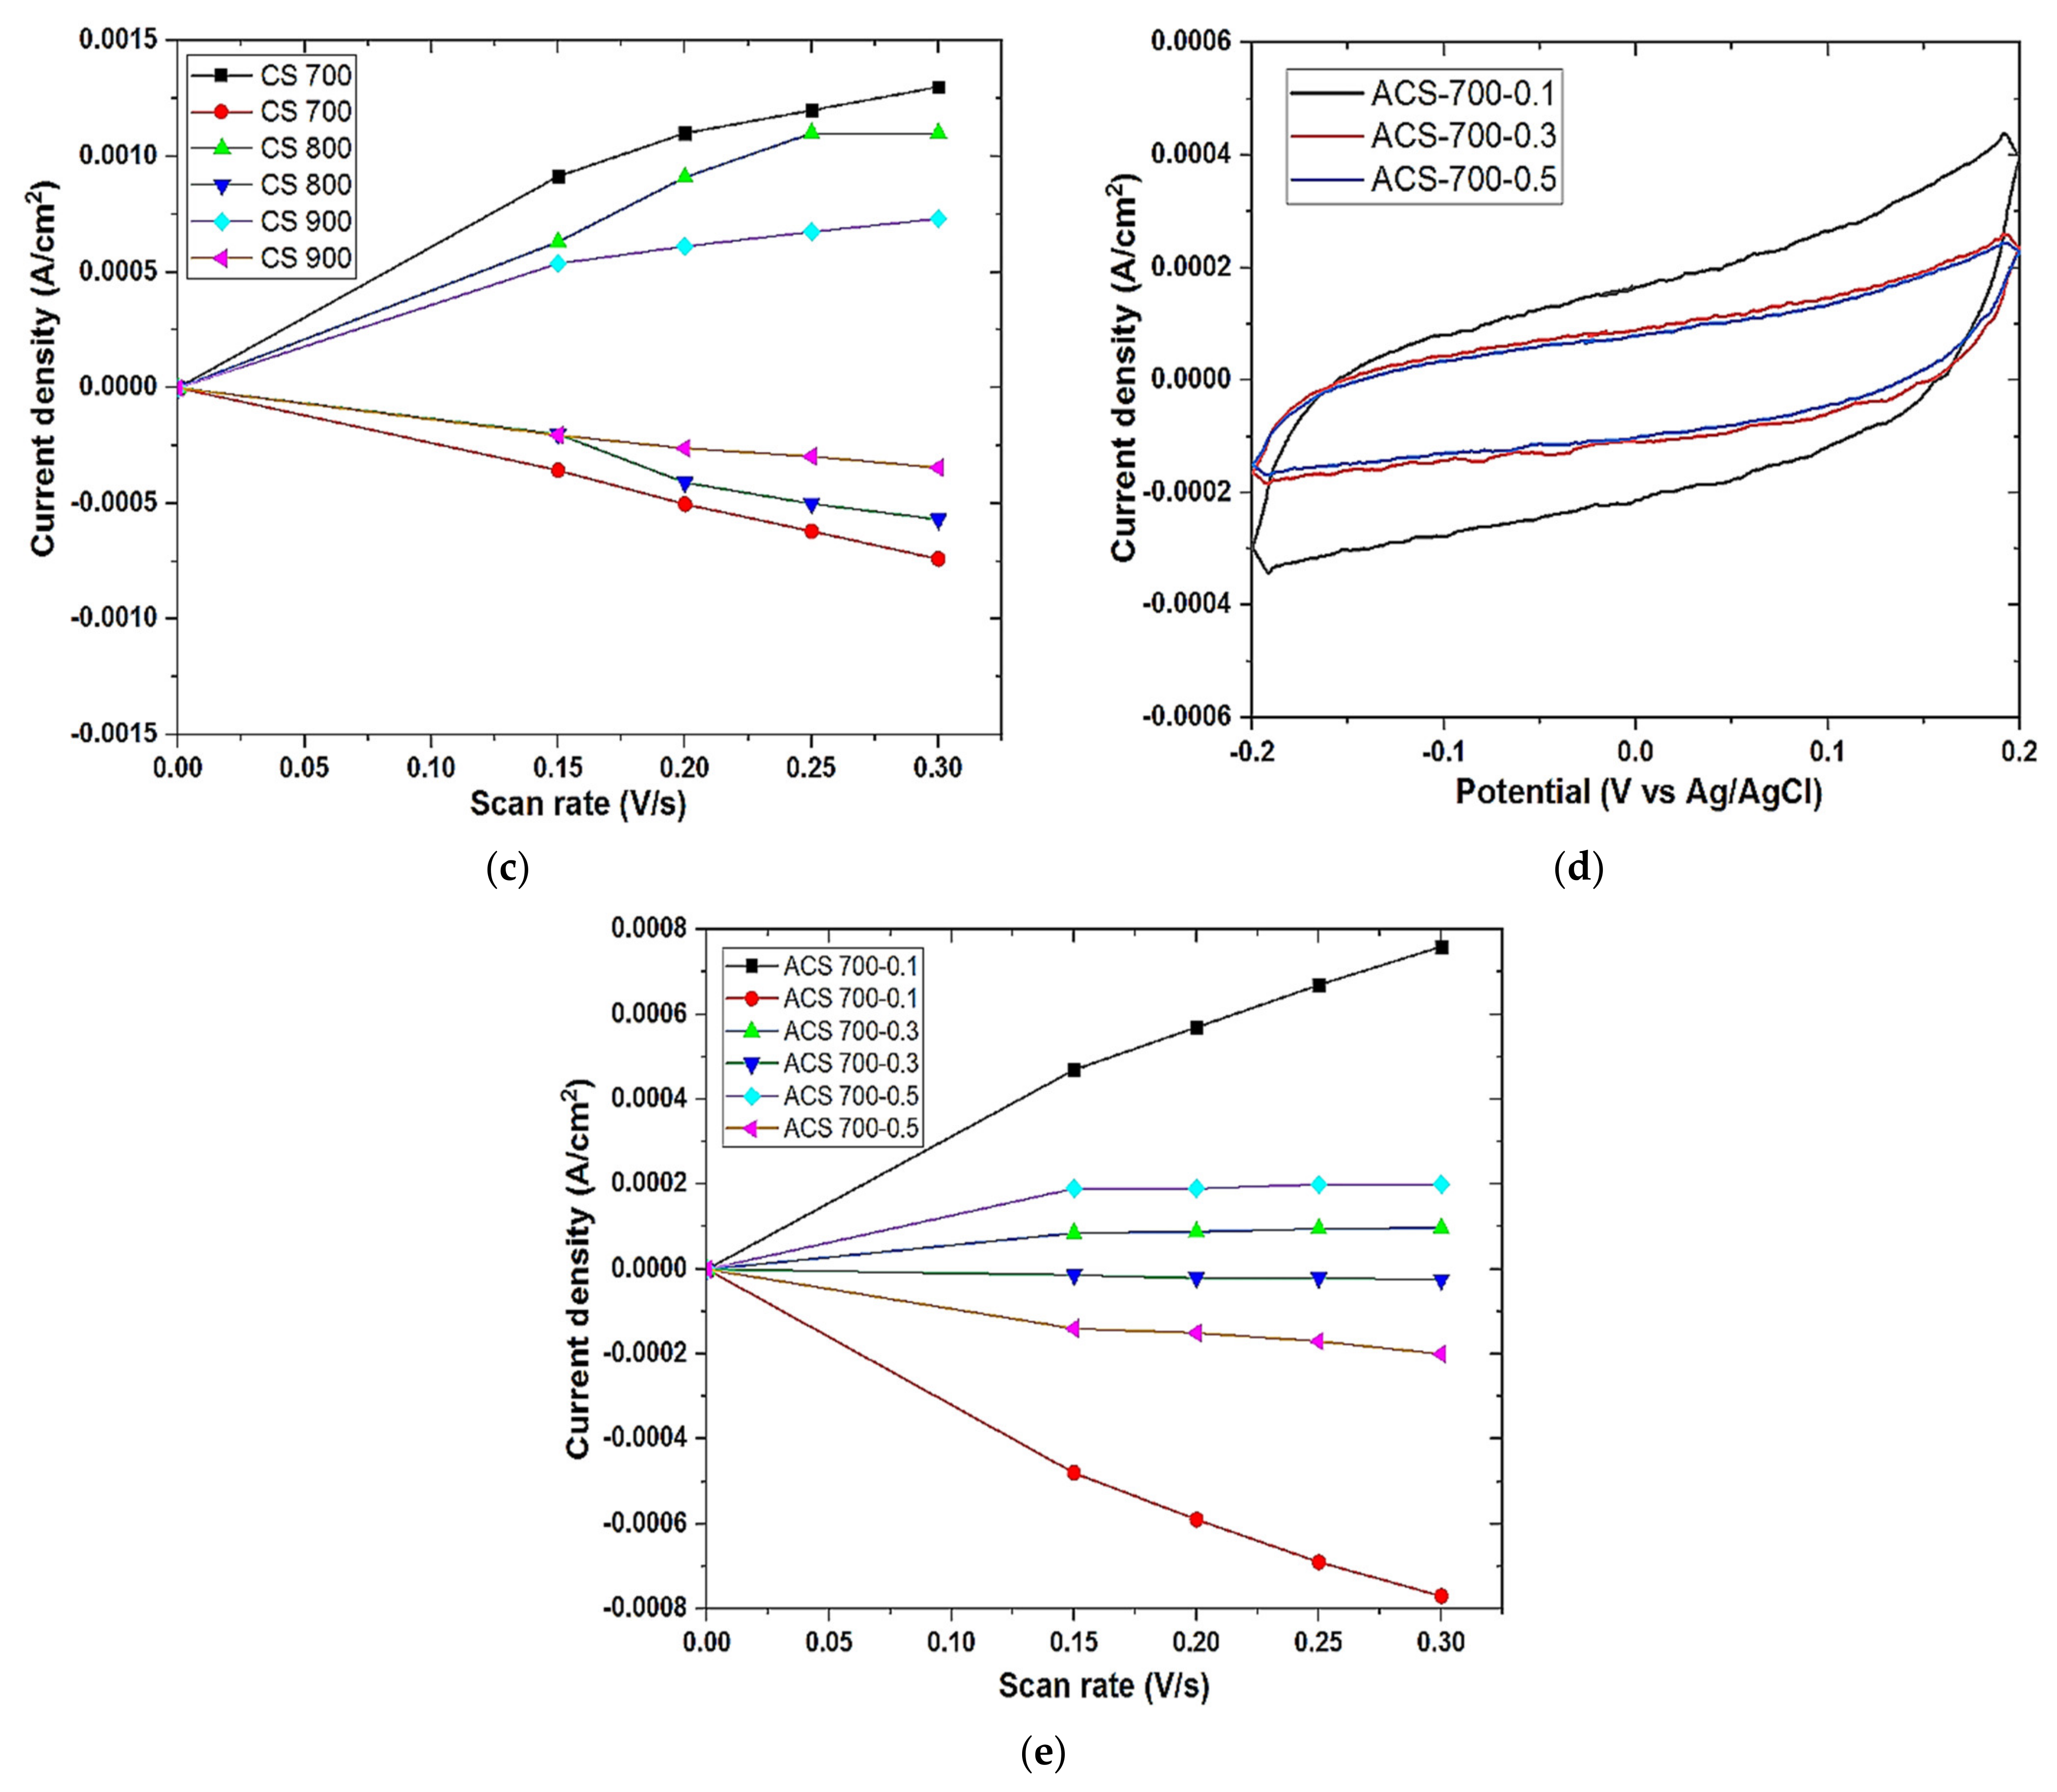
3.6. Electrochemical Studies
Galvanostatic Charge–Discharge and Cyclic Voltammetry
4. Conclusions and Future Perspectives
Supplementary Materials
Author Contributions
Funding
Institutional Review Board Statement
Informed Consent Statement
Acknowledgments
Conflicts of Interest
References
- Zhang, L.L.; Zhao, X.S. Carbon-based materials as supercapacitor electrodes Chem. Soc. Rev. 2009, 38, 2520. [Google Scholar] [CrossRef]
- Simon, P.; Gogotsi, Y. Materials for electrochemical capacitors. Nat. Mater. 2008, 7, 845. [Google Scholar] [CrossRef] [Green Version]
- Wang, G.; Zhang, L.; Zhang, J. A review of electrode materials for electrochemical supercapacitors. Chem. Soc. Rev. 2012, 41, 797–828. [Google Scholar] [CrossRef] [PubMed] [Green Version]
- Titirici, M.M.; Antonietti, M. Chemistry and materials options of sustainable carbon materials made by hydrothermal carbonization. Chem. Soc. Rev. 2010, 39, 103. [Google Scholar] [CrossRef] [PubMed]
- Mora, E.; Blanco, C.; Pajares, J.A.; Santamaría, R.; Menéndez, R. Chemical activation of carbon mesophase pitches. J. Colloid Interface Sci. 2006, 298, 341–347. [Google Scholar] [CrossRef] [PubMed]
- Folaranmi, G.; Bechelany, M.; Sistat, P.; Cretin, M.; Zaviska, F. Towards Electrochemical Water Desalination Techniques: A Review on Capacitive Deionization, Membrane Capacitive Deionization and Flow Capacitive Deionization. Membranes 2020, 10, 96. [Google Scholar] [CrossRef] [PubMed]
- Wang, X.Q.; Wang, P.; Ning, P.; Ma, X.Y.; Wang, F.; Guo, X.L.; Lan, Y. Adsorption of gaseous elemental mercury with activated carbon impregnated with ferric chloride. RSC Adv. 2015, 5, 24899. [Google Scholar] [CrossRef]
- Bonvin, F.; Jost, L.; Randin, L.; Bonvin, E.; Kohn, T. Super-fine powdered activated carbon (SPAC) for efficient removal of micropollutants from wastewater treatment plant effluent. Water Res. 2016, 90, 90–99. [Google Scholar] [CrossRef] [PubMed]
- Folaranmi, G.; Bechelany, M.; Sistat, P.; Cretin, M.; Zaviska, F. Comparative Investigation of Activated Carbon Electrode, and a Novel Activated Carbon/Graphene Oxide Composite Electrode for an Enhanced Capacitive Deionization. Materials 2020, 13, 5185. [Google Scholar] [CrossRef]
- Zhang, D.Y.; Hao, Y.; Zheng, L.W.; Ma, Y.; Feng, H.X.; Luo, H.M. Nitrogen and sulfur co-doped ordered mesoporous carbon with enhanced electrochemical capacitance performance. J. Mater. Chem. A 2013, 1, 7584. [Google Scholar] [CrossRef]
- Huo, S.L.; Liu, M.Q.; Wu, L.L.; Liu, M.J.; Xu, M.; Ni, W.; Yan, Y.M. Methanesulfonic acid-assisted synthesis of N/S co-doped hierarchically porous carbon for high performance supercapacitors. J. Power Sources 2018, 387, 81. [Google Scholar] [CrossRef]
- Cheng, L.L.L.; Hu, Y.Y.; Qiao, D.D.; Zhu, Y.; Wang, H.; Jiao, Z. One-step radiolytic synthesis of heteroatom (N and S) co-doped graphene for supercapacitors. Electrochim. Acta 2018, 259, 587. [Google Scholar] [CrossRef]
- Falco, C.; Marco-Lozar, J.P.; Salinas-Torres, D.; Morallón, E.; Cazorla-Amorós, D.; Titirici, M.M.; Lozano-Castelló, D. Tailoring the porosity of chemically activated hydrothermal carbons: Influence of the precursor and hydrothermal carbonization temperature. Carbon 2013, 62, 346. [Google Scholar] [CrossRef] [Green Version]
- Mao, L.; Zhang, Y.; Hu, Y.; Hung, H.K.; Ke, Q.; Liu, H.; Hu, Z.; Zhao, D.; Wang, J. Activation of sucrose-derived carbon spheres for high-performance supercapacitor electrodes. RSC Adv. 2015, 5, 9307–9313. [Google Scholar] [CrossRef]
- Lv, Y.; Chen, J.; Jia, W.; Wu, X.; Guo, J.; Ding, L.; Jia, D.; Tong, F. N/S co-doped coal-based porous carbon spheres as electrode materials for high performance supercapacitors. RSC Adv. 2020, 10, 11033–11038. [Google Scholar] [CrossRef]
- Wickramaratne, N.P.; Jaroniec, M. Activated Carbon Spheres for CO2 Adsorption. ACS Appl. Mater. Interfaces 2013, 5, 1849–1855. [Google Scholar] [CrossRef] [PubMed]
- Shen, C.; Yu, J.; Li, P.; Grande, C.A.; Rodrigues, A.E. Capture of CO2 from flue gas by vacuum pressure swing adsorption using activated carbon beads. Adsorption 2010, 17, 179–188. [Google Scholar] [CrossRef]
- Zeng, Y.; Wang, K.; Yao, J.; Wang, H. Hollow carbon beads for significant water evaporation enhancement. Chem. Eng. Sci. 2014, 116, 704–709. [Google Scholar] [CrossRef]
- Zeng, Y.; Wang, K.; Yao, J.; Wang, H. Hollow carbon beads fabricated by phase inversion method for efficient oil sorption. Carbon 2014, 69, 25–31. [Google Scholar] [CrossRef]
- Singh, G.; Kim, I.Y.; Lakhi, K.S.; Srivastava, P.; Naidu, R.; Vinu, A. Single step synthesis of activated bio-carbons with a high surface area and their excellent CO2 adsorption capacity. Carbon 2017, 116, 448–455. [Google Scholar] [CrossRef]
- Singh, G.; Lakhi, K.S.; Kim, I.Y.; Kim, S.; Srivastava, P.; Naidu, R.; Vinu, A. Highly Efficient Method for the Synthesis of Activated Mesoporous Biocarbons with Extremely High Surface Area for High-Pressure CO2 Adsorption. ACS Appl. Mater. Interface 2017, 9, 29782–29793. [Google Scholar] [CrossRef] [PubMed]
- Singh, A.; La, D. Preparation and characterization of activated carbon spheres from polystyrene sulphonate beads by steam and carbon dioxide activation. J. Appl. Polym. Sci. 2010, 115, 2409–2415. [Google Scholar] [CrossRef]
- He, P.; Haw, K.-G.; Yan, S.; Tang, L.; Fang, Q.; Qiu, S.; Valtchev, V. Carbon beads with a well-defined pore structure derived from ion-exchange resin beads. J. Mater. Chem. A 2019, 7, 18285. [Google Scholar] [CrossRef]
- Wu, D.C.; Hui, C.M.; Dong, H.C.; Pietrasik, J.; Ryu, H.J.; Li, Z.H.; Zhong, M.J.; He, H.K.; Kim, E.K.; Jaroniec, M.; et al. Nanoporous Polystyrene and Carbon Materials with Core-Shell Nanosphere-Interconnected Network Structure. Macromolecules 2011, 44, 5846. [Google Scholar] [CrossRef]
- Ouyang, Y.; Shi, H.; Fu, R.; Wu, D. Highly Monodisperse Microporous Polymeric and Carbonaceous Nanospheres with Multifunctional Properties. Sci. Rep. 2013, 3, 1430. [Google Scholar] [CrossRef] [Green Version]
- Liang, Y.; Chen, L.; Zhuang, D.; Liu, H.; Fu, R.; Zhang, M.; Wu, D.; Matyjaszewski, K. Fabrication and nanostructure control of super-hierarchical carbon materials from heterogeneous bottlebrushes. Chem. Sci. 2017, 8, 2101. [Google Scholar] [CrossRef] [Green Version]
- Lee, W.H.; Moon, J.H. Monodispersed N-Doped Carbon Nanospheres for Supercapacitor Application. ACS Appl. Mater. Interfaces 2014, 6, 13968. [Google Scholar] [CrossRef]
- Valante-Nabais, J.M.; Teixeira, J.G.; Almeida, I. Development of easy made low cost bindless monolithic electrodes from biomass with controlled properties to be used as electrochemical capacitors. Bioresour. Technol. 2011, 102, 2781–2787. [Google Scholar] [CrossRef] [PubMed] [Green Version]
- Farma, R.; Deraman, M.; Awitdrus, A.; Talib, I.A.; Taer, E.; Basri, N.H.; Manjunatha, J.G.; Ishak, M.M.; Dollah, B.N.M.; Hashmi, S.A. Preparation of highly porous binderless activated carbon electrodes from fibres of oil palm empty fruit bunches for application in supercapacitors. Bioresour. Technol. 2013, 132, 254–261. [Google Scholar] [CrossRef] [PubMed]
- Qiang, D.; Gang, W.; Bingqing, Q.; Chao, H.; Yuwei, W.; Jieshan, Q. Electrospun composites made of reduced graphene oxide and activated carbon nanofibers for capacitive deionization. Electrochim. Acta 2014, 137, 388–394. [Google Scholar]
- Ng, E.P.; Mintova, S. Quantitative moisture measurements in lubricating oils by FTIR spectroscopy combined with solvent extraction approach. Micro. Chem. J. 2011, 98, 177–185. [Google Scholar] [CrossRef]
- Feng, W.; He, P.; Ding, S. Oxygen-doped activated carbons derived from three kinds of biomass: Preparation, characterization, and performance as electrode materials for supercapacitors. RSC Adv. 2016, 6, 5949–5956. [Google Scholar] [CrossRef]
- Bamford, C.H.; Tipper, C.F.H. Comprehensive Chemical Kinetics, Volume 14: Degradation of Polymers; Elsevier: Amsterdam, The Netherlands, 1975; Chapter 1. [Google Scholar]
- Alabadi, A.; Razzaque, S.; Yang, Y.; Chen, S.; Tan, B. Highly porous activated carbon materials from carbonized biomass with high CO2 capturing capacity. Chem. Eng. J. 2015, 281, 606–612. [Google Scholar] [CrossRef]
- Basri, N.H.; Dolah, B.N.M. Physical and electrochemical properties of supercapacitor electrodes derived from carbon nanotube and biomass carbon. Int. J. Electrochem. Sci. 2013, 8, 257–273. [Google Scholar]
- Liang, Z.; Xia, H.; Liu, H.; Zhang, L.; Zhou, J.; Li, H.; Xie, W. Enhanced capacitance characteristic of microporous carbon spheres through surface modification by oxygen-containing groups. Results Phys. 2019, 15, 102586. [Google Scholar] [CrossRef]
- McCrory, C.C.L.; Jung, S.; Peters, J.C.; Jaramillo, T.F. Benchmarking Heterogeneous Electrocatalysts for the Oxygen Evolution Reaction. J. Am. Chem. Soc. 2013, 135, 16977–16987. [Google Scholar] [CrossRef]
- Cheng, J.; Minett, A.; Liu, Y.; Lynam, C.; Sherrell, P.; Wang, C.; Wallace, G.G. Direct Growth of Flexible Carbon Nanotube Electrodes. Adv. Mater. 2008, 20, 566. [Google Scholar] [CrossRef]
- Li, H.; Wang, Z.; Chen, L.; Huang, X. Research on Advanced Materials for Li-ion Batteries. Adv. Mater. 2009, 21, 4593. [Google Scholar] [CrossRef]
- Reimers, J.N.; Dahn, J.R.; von Sacken, U. Effects of Impurities on the Electrochemical Properties of LiCoO2. J. Electrochem. Soc. 1993, 140, 2752. [Google Scholar] [CrossRef]
- Ji, H.; Xin, Z.; Qiao, Z.; Jung, J.; Zhu, Y.; Lu, Y.; Zhang, L.L.; MacDonald, A.H.; Ruoff, R.S. Capacitance of carbon-based electrical double-layer capacitors. Nat. Commun. 2014, 5, 3317. [Google Scholar] [CrossRef]
- Lei, C.; Wilson, P.; Lekakou, C. Effect of poly(3,4-ethylenedioxythiophene) (PEDOT) in carbon-based composite electrodes for electrochemical supercapacitors. J. Power Sources 2011, 196, 7823–7827. [Google Scholar] [CrossRef] [Green Version]
- Yoon, D.H.; Yoon, S.H.; Ryu, K.S.; Park, Y.H. PEDOT: PSS as multi-functional composite material for enhanced Li-air-battery air electrodes. Sci. Rep. 2016, 6, 19962. [Google Scholar] [CrossRef] [PubMed]
- Gallegos, A.K.C.; Rincón, M. Carbon nanofiber and PEDOT-PSS bilayer systems as electrodes for symmetric and asymmetric electrochemical capacitor cells. J. Power Sources 2006, 162, 743–747. [Google Scholar] [CrossRef]


| Sample | d 002 (nm) | 100/101 (nm) | Lc (nm) | La (nm) | Lc/La | Np (Lc/d002) |
|---|---|---|---|---|---|---|
| CS 700 | 0.37 | 0.21 | 6.14 | 0.80 | 7.67 | 16.59 |
| CS 800 | 0.37 | 0.21 | 6.14 | 0.76 | 8.07 | 16.59 |
| CS 900 | 0.38 | 0.21 | 6.51 | 0.72 | 9.04 | 17.13 |
| Samples | CS 700 | CS 800 | CS 900 |
|---|---|---|---|
| R | 0.92 | 1.15 | 1.20 |
| Sample | Vt (cm3·g−1) | SBET (m2·g−1) | VMESO (cm3·g−1) |
|---|---|---|---|
| CS-700 | 0.65 | 811.96 | 0.43 |
| CS-800 | 0.62 | 778.75 | 0.40 |
| CS-900 | 0.56 | 654.57 | 0.41 |
| ACS 700−0.1 | 0.68 | 849.18 | 0.48 |
| ACS 700−0.3 | 0.66 | 812.74 | 0.47 |
| ACS 700−0.5 | 0.66 | 798.82 | 0.46 |
| Sample | R2 (KΩ.cm2) | Yo (µS) | Capacitance (nF) |
|---|---|---|---|
| CS 700 | 12.59 | 22.99 | 0.467 |
| CS 800 | 19.87 | 53.19 | 0.380 |
| CS 900 | 35.00 | 06.22 | 0.361 |
| ACS 700−0.1 | 3.33 | 2.83 | 1.780 |
| ACS 700−0.3 | 23.79 | 1.88 | 0.106 |
| ACS 700−0.5 | 9.34 | 21.60 | 0.185 |
| Sample | CS 700 | CS 800 | CS 900 | ACS 700−0.1 | ACS 700−0.3 | ACS 700−0.5 |
|---|---|---|---|---|---|---|
| CEDL (µF cm−2) | 5.10 | 4.50 | 2.90 | 9.00 | 5.00 | 4.20 |
| Carbonaceous Material | Electrolyte | Double Layer Capacitance (µF cm−2) | Ref. |
|---|---|---|---|
| Carbon black | 10% NaCl | 19.00 | [42] |
| 1 M H2SO4 | 8.00 | [42] | |
| 31 wt% KOH | 9.00 | [42] | |
| Carbon fiber cloth | 0.5 M Et4NbF4 | 6.90 | [42] |
| Graphite powder | 10% NaCl | 35.00 | [42] |
| Graphite cloth | 0.168 N NaCl | 10.70 | [42] |
| Glassy carbon | 0.9 N NaF | 13.00 | [42] |
| Carbon aerogel | 4 M KOH | 23.00 | [42] |
| ACS | 1 M NaCl | 9.00 | This work |
Publisher’s Note: MDPI stays neutral with regard to jurisdictional claims in published maps and institutional affiliations. |
© 2021 by the authors. Licensee MDPI, Basel, Switzerland. This article is an open access article distributed under the terms and conditions of the Creative Commons Attribution (CC BY) license (https://creativecommons.org/licenses/by/4.0/).
Share and Cite
Folaranmi, G.B.; Ekennia, A.; Ani, N.C.; Ehiri, R.C. Viability of Activated Carbon Derived from Polystyrene Sulphonate Beads as Electrical Double Layer Capacitors. C 2021, 7, 82. https://doi.org/10.3390/c7040082
Folaranmi GB, Ekennia A, Ani NC, Ehiri RC. Viability of Activated Carbon Derived from Polystyrene Sulphonate Beads as Electrical Double Layer Capacitors. C. 2021; 7(4):82. https://doi.org/10.3390/c7040082
Chicago/Turabian StyleFolaranmi, Gbenro Babajide, Anthony Ekennia, Nkiruka Chidiebere Ani, and Richard Chukwuemeka Ehiri. 2021. "Viability of Activated Carbon Derived from Polystyrene Sulphonate Beads as Electrical Double Layer Capacitors" C 7, no. 4: 82. https://doi.org/10.3390/c7040082
APA StyleFolaranmi, G. B., Ekennia, A., Ani, N. C., & Ehiri, R. C. (2021). Viability of Activated Carbon Derived from Polystyrene Sulphonate Beads as Electrical Double Layer Capacitors. C, 7(4), 82. https://doi.org/10.3390/c7040082