Article

Shedding of Cavitation Clouds in an Orifice Nozzle

1
College of Engineering, Nihon University, Koriyama 963-8643, Fukushima, Japan
2
SU Endoscope Development Department, Olympus Corporation, Hachioji 192-8507, Tokyo, Japan
3
College of Energy and Power Engineering, Lanzhou University of Technology, Lanzhou 730050, China
*
Authors to whom correspondence should be addressed.
Fluids 2024, 9(7), 156; https://doi.org/10.3390/fluids9070156
Submission received: 30 April 2024 / Revised: 1 June 2024 / Accepted: 28 June 2024 / Published: 5 July 2024
(This article belongs to the Special Issue Numerical Modeling and Experimental Studies of Two-Phase Flows)

Abstract

:
Focused on the unsteady property of a cavitating water jet issuing from an orifice nozzle in a submerged condition, this paper presents a fundamental investigation of the periodicity of cloud shedding and the mechanism of cavitation cloud formation and release by combining the use of high-speed camera observation and flow simulation methods. The pattern of cavitation cloud shedding is evaluated by analyzing sequence images from a high-speed camera, and the mechanism of cloud formation and release is further examined by comparing the results of flow visualization and numerical simulation. It is revealed that one pair of ring-like clouds consisting of a leading cloud and a subsequent cloud is successively shed downstream, and this process is periodically repeated. The leading cloud is principally split by a shear vortex flow along the nozzle exit wall, and the subsequent cloud is detached by a re-entrant jet generated while a fully extended cavity breaks off. The subsequent cavitation cloud catches the leading one, and they coalesce over the range of x / d 1.8 ~ 2.5 . Cavitation clouds shed downstream from the nozzle at two dominant frequencies. The Strouhal number of the leading cavitation cloud shedding varies from 0.21 to 0.29, corresponding to the injection pressure. The mass flow rate coefficient fluctuates within the range of 0.59 ~ 0.66 at the same frequency as the leading cloud shedding under the effect of cavitation.

1. Introduction

High-speed water jets, where pressurized water or liquid mixture is issued from a small nozzle at high speed, have been developed and applied to many fields of industry [1,2,3]. Among them, submerged water jets injected into still water have received much attention for their capacity to continually cause intensive cavitation impact with the collapse of cavitation bubbles [4,5,6]. For this particular property, submerged water jets are often used in various industry fields such as the cleaning of complex mechanical products, peening of metal materials, and decomposing and sterilizing of sewage waters [1,2,6,7]. However, their processing performance is closely dependent upon the unsteady behavior of cavitation clouds related to the nozzle system and operating conditions [8,9,10]. Although some experimental studies [11,12,13,14,15] were made on water jets concerning the effects of driven pressure, nozzle geometry, and standoff distance as well as temperature, etc., the inner structure of cavitating jets and the interaction between cavitation bubbles and liquid flow are still unclear with respect to the complexity of turbulent cavitating flow, especially in the case of high-pressure submerged water jets accompanying intensive cavitation. Hutli et al. [16] reported an experimental study on the frequency of cavitation clouds discharging in a high-pressure submerged water jet using image analysis of high-speed camera observations. There are few works on the inner structure of cavitating flow and the mechanism of cavitation cloud releasing within a narrow nozzle for the case of high-speed submerged water jets accompanying intensive cavitation [3,17,18].
Cavitation usually occurs in the high-velocity region of the nozzle throat once the local pressure decreases to a critical level. The occurrence of cavitation induces strong pressure fluctuations, noise, vibrations, and the erosion of nozzles, especially in intensively cavitating flows, where cavitation cavities break off and multi-scale cavitation clouds shed and collapse periodically [17,18]. The large pressure fluctuation is a major source of flow instability, resulting in liquid/vapor density variances. The sharp density variations, i.e., pure liquid, pure vapor, and liquid/vapor mixture, significantly alter the flow field distribution and cavity dynamics. Moreover, the transient multi-scale cavity behavior from small vapor bubbles to large-scale cloud cavities produces strong pressure loads, such as high-frequency pressure fluctuations and impulsive pressure peaks. Although numerical simulation has become a useful way to perform flow investigations, with great progress in computational resources, the modeling of unsteady cavitation flow requires careful consideration of cavitation dynamics and the interaction between bubble cavities and liquid flow. Due to the strong coherent interactions between the cavitation dynamics and the flow structure, numerical simulations of intensively cavitating water jets remain a challenge [19,20,21].
With the purpose of clarifying the unsteady cavitating flow structure of high-speed submerged water jets used for industry, such as water jet cleaning and peening, this paper presents a fundamental investigation of the flow pattern of cavitation cloud releasing in a simplified orifice nozzle by combined utilization of flow visualization and numerical simulation methods. High-speed camera observations of cavitation jets were conducted, and the periodicity of cloud shedding under different injection pressures was evaluated using image analysis. Concerned with the two-phase flow structure and the mechanism of cloud generation and release with the development of jet flow, a numerical analysis was performed by using a compressible gas-vapor/liquid mixture cavitation model in consideration of the effect of sharp density variation caused by cavitation [21]. The assumption of a homogenous gas–liquid two-phase fluid was adopted, and the gas phase contained in the cavitation bubbles was assumed to consist of vapor and non-condensable components. The compressibility of the vapor component was treated semi-empirically as a constant, and the growth rate of the gas void fraction was logically evaluated by using the sonic speeds in both gas and liquid fluid media. The model was embedded in an in-house unsteady Reynolds-averaged Navier–Stokes (URANS) solver for compressible fluids by employing the realizable k-ε turbulence model [22]. The relation between the flow structure and the unsteady behavior of cavitation cloud shedding, as well as the effect of a re-entrant jet, were then investigated.
The main findings of this work are summarized as follows: (1) One pair of ring-like clouds, consisting of a leading cloud and a subsequent cloud, occurs at the nozzle throat and shed downstream successively when the cavitation number decreased to below 0.5. (2) The leading cloud is principally split from the nozzle exit by the shear vortex flow, and the subsequent cloud is detached from the throat wall by the re-entrant jet generated while a fully extended cavity breaks off. The subsequent cavitation cloud catches the leading one, and they coalesce over the range of x/d ≈ 1.8~2.5. (3) Cavitation clouds shed from the nozzle at two dominant frequencies. The Strouhal number of the leading cavitation cloud shedding varies from 0.21 to 0.29, corresponding to the injection pressure. The mass flow rate coefficient fluctuates periodically in the range of 0.59 ~ 0.66 at the same frequency as the leading cloud shedding under the effect of cavitation. The above points are expected to be referential to understanding the unsteady flow structure of cavitating water jet and then improving the performance of jet nozzle.

2. Experimental Apparatus and Method

Figure 1 shows the schematic diagram of the experimental device. An open-type rectangular water tank made of acrylic acid resin is set horizontally and an orifice nozzle is installed at the center of the left side wall. The mean diameter of the nozzle d = 5.0 mm at its throat and the length of the throat L d = 0.6 d . The inlet diameter of the nozzle D = 2.6 d , and the length of inlet pipe is 6.0 d . To observe its inner flow behavior, the nozzle is also made of transparent acrylic material. The nozzle is connected to a closed pressure tank via a high-pressure hose. The lower half of the pressure tank is filled with tap water and the upper half is filled with pressurized air. The transparent observation water tank is also filled with tap water and the water depth is kept to the level of 450 mm by using an overflow pipe. Pressurized water supplied from the pressure tank is injected from the nozzle into the transparent observation tank and then a submerged water jet is generated. The absolute injection pressure is adjustable from 0.3 MPa to 0.8 MPa by adjusting the air pressure within the pressure tank with a compressor. For monitoring of the injection pressure, a high frequency pressure sensor (whose measuring error equals ± 0.4 kPa) is installed at the inflow pipe just in front of the nozzle inlet and its output is recoded in real-time via a universal recorder. Also, the timely averaged mean flow rate of the jet is measured by a turbine flow meter (FT200-030, Japan Flow Controls Co. Ltd., Tokyo, Joan), whose uncertainty is estimated as 2.0%. As an index of a cavitating water jet, cavitation number σ is defined as
σ = p o p v ( T ) P i n p o
where P i n denotes the injection pressure (absolute), p o represents the surrounding static pressure (absolute) at the nozzle exit, and p v denotes the saturated vapor pressure under the reference temperature T . Similarly, the flow rate coefficient c q of the nozzle is defined in terms of the mass flow rate q m as follows.
c q = q m 0.25 π d 2 V t h   ρ w
in which ρ w denotes the density of water under the given condition, and Vth represents the theoretical injection velocity defined as follows by neglecting all the hydraulic losses.
V t h = 2 P i n p o / ρ w 1 d / D 4
High-speed camera observation of unsteady cavitating water jet was performed and the unsteady behavior is evaluated via image analysis [23]. Instantaneous images of cavitation clouds, where cavitation bubbles are used as flow tracers, were captured and recorded by using a high-speed CMOS camera (Photron FASTCAM SA-NX2, 1024 × 1024 pixels with 12-bit gray level, Photron, Tokyo, Japan). The observation area was axisymmetrically fitted to the nozzle central axis and its size was adjusted from the inlet of the nozzle throat to the downstream of the nozzle exit ( ~ 60   m m i n   r a i a l   d i r e c t i o n × ~ 90   m m   ( i n   a x i a l   d i r e c t i o n ) according to the injection pressure. The image resolution of the camera was set to be 1024 × 512 pixels. Photographs were taken under transmission light conditions by setting a panel-type high-intensity LED lamp on the opposite side of the camera. The shooting frame rate was set to be 30,000 fps. For comparison, fluorescent nylon microparticles (Kanomax, Andover, NJ, USA, ORGASOL 0457, Light wave length λ = 590 ~ 610 nm) were also used as flow tracers and a long-wave pass polarizer filter ( λ 560 nm) was fitted to the camera lens for the purpose of decreasing scattered light reflection on bubble surfaces.
In order to describe the flow field, a cylindrical coordinate system (x, r) was adopted, where the origin was located at the nozzle exit and the coordinates, x and r, were, respectively, set along the streamwise direction and the radial direction. The components of the velocity vector in the x and r directions are denoted as u, v, respectively. Then, the compound velocity is defined by V = (u2 + v2)1/2.

3. Results and Discussions

3.1. Instantaneous Flow Visualization

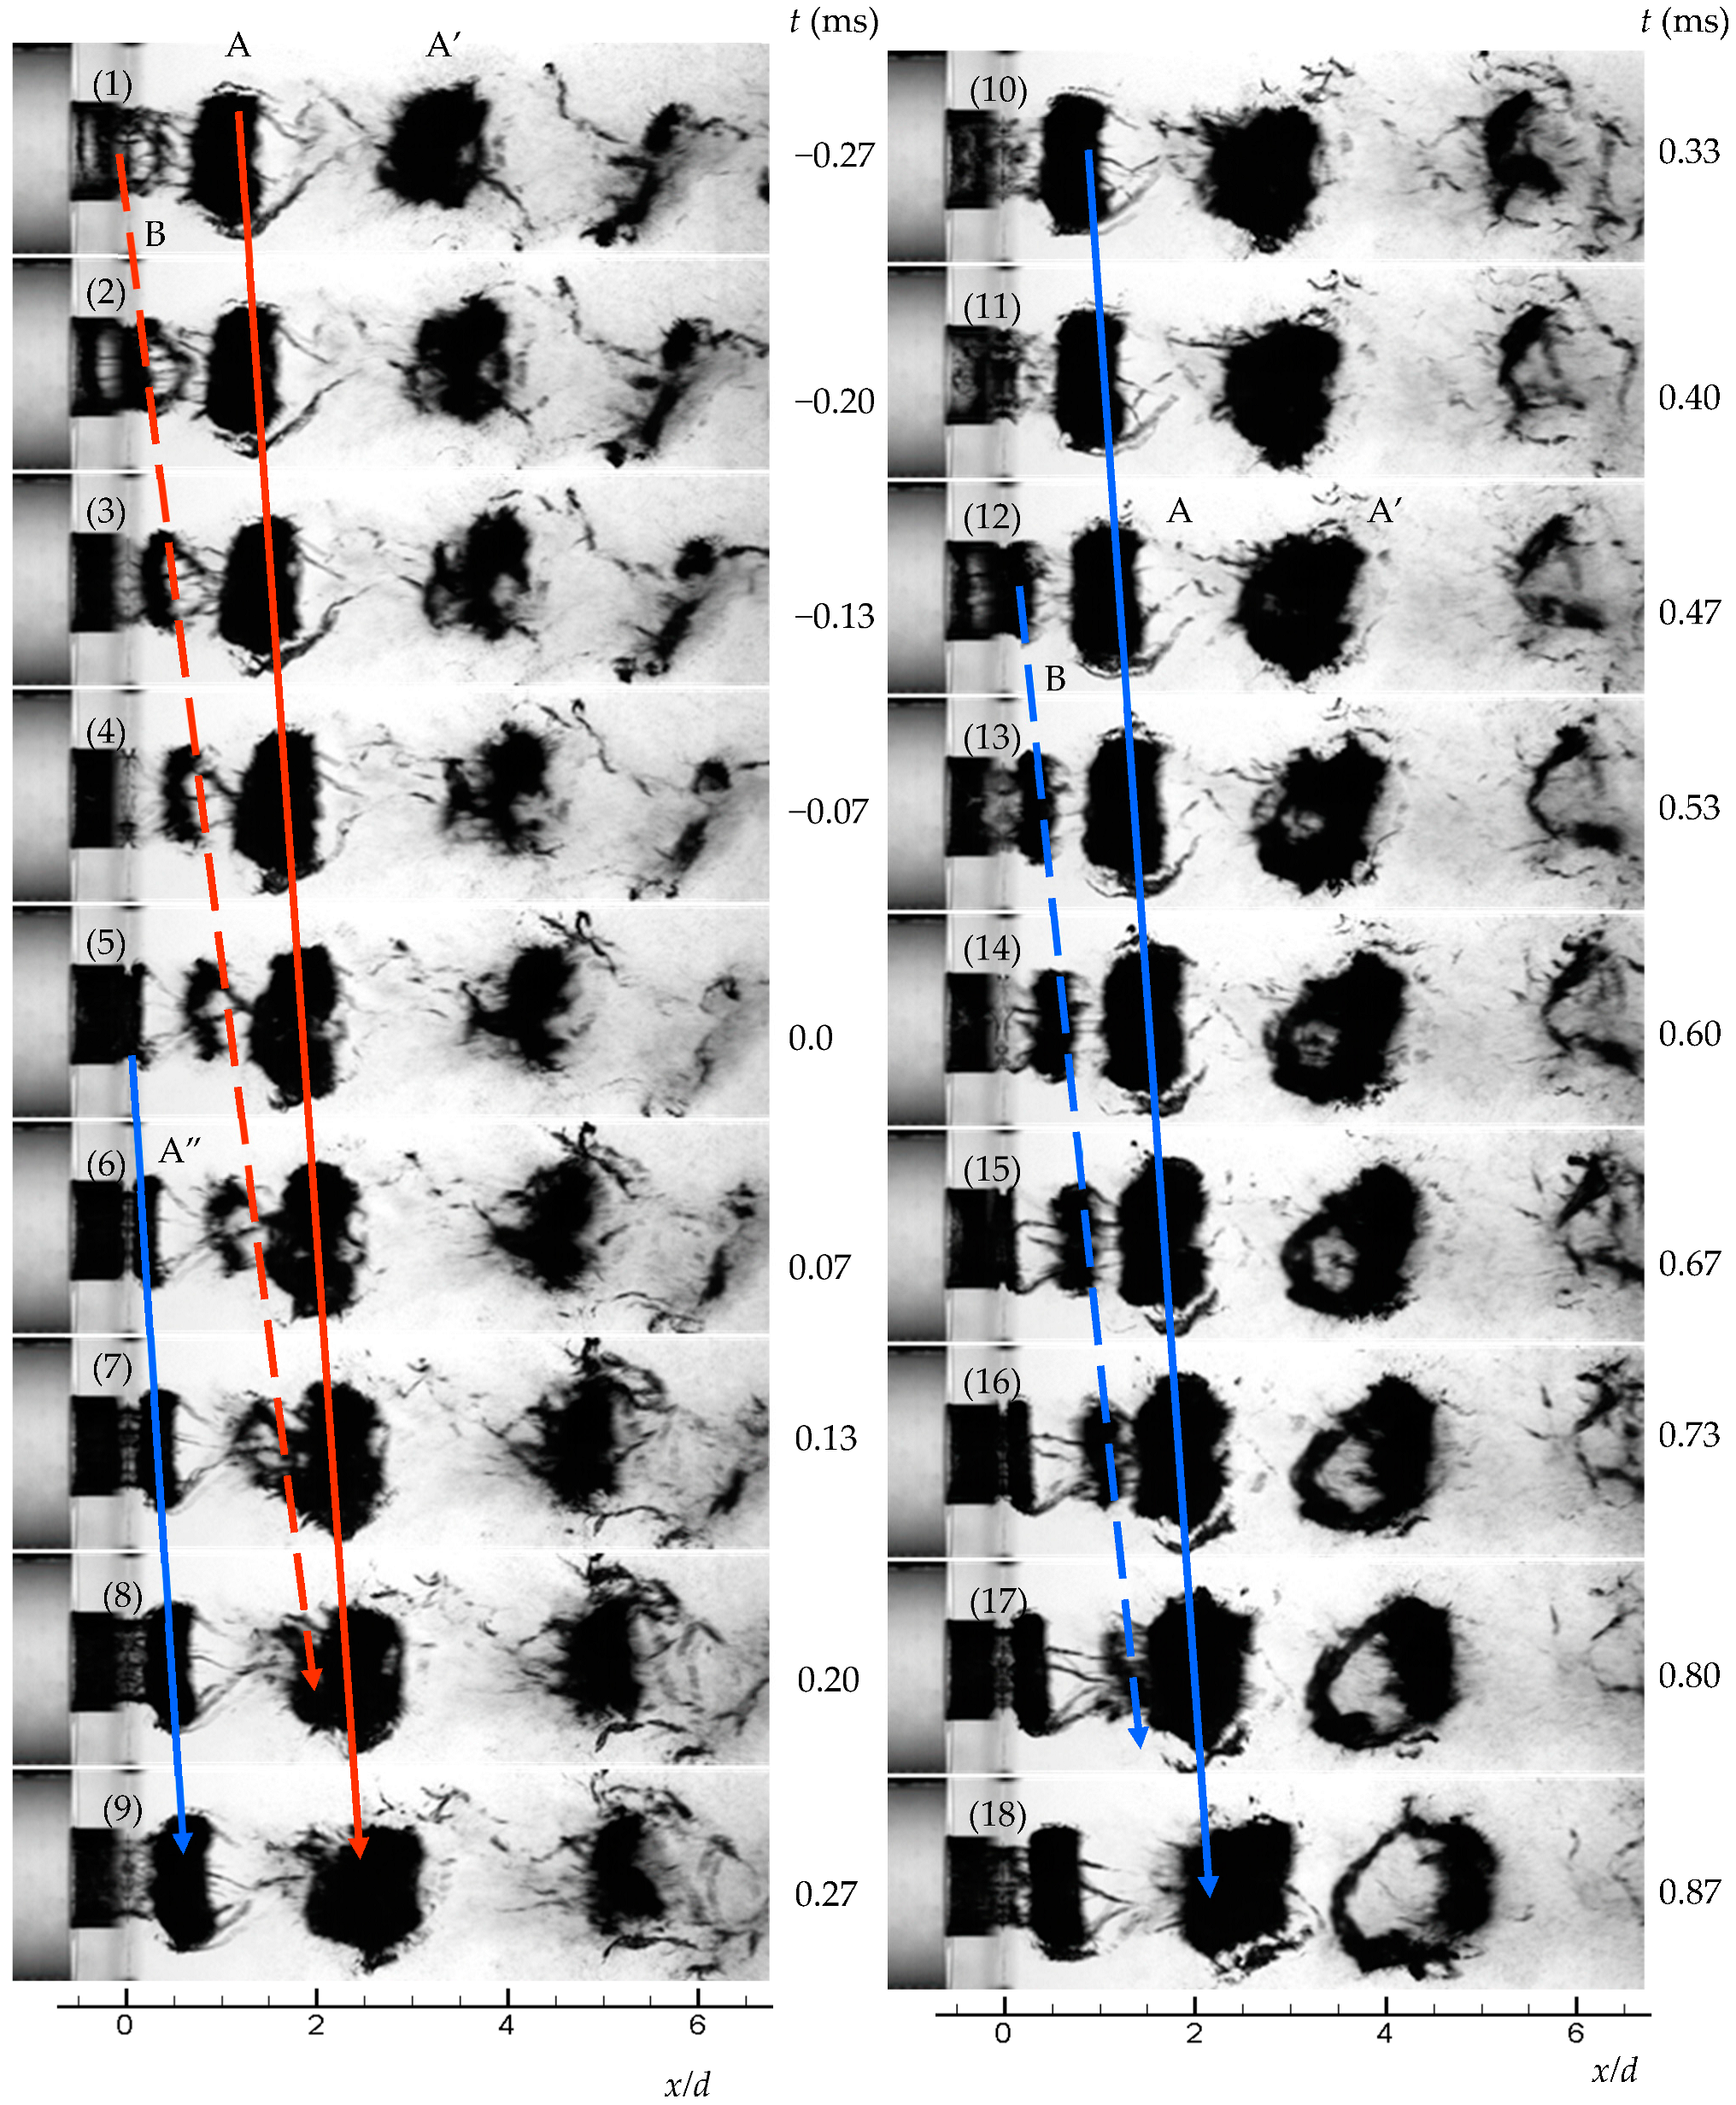
Figure 2 shows a sequence of visualization images demonstrating the behavior of cavitation cloud shedding from the nozzle at a well-developed stage when the injection absolute pressure P i n = 0.6 MPa. These photos were taken using transmission light, and cavitation clouds appear to be dark gray, and the background water appears to be bright white. Figure 2(1) shows an instantaneous flow distribution when two relatively large cavitation clouds, A (middle) and A’ (downstream), are released from the nozzle. The upstream cloud connected to the nozzle exit is denoted as B. Figure 2(2–4) show that cloud B is entirely detached from the nozzle and then runs after cloud A. Cloud A’ contracts and collapses while cloud A expands. Figure 2(5) indicates that a parent cavity is newly generated at the nozzle throat. Figure 2(6) shows that the parent cavity, which is denoted as A’’, grows up and expands nearly to its maximum. Then, it detaches from the nozzle wall as shown in Figure 2(7), whereupon a new cavitation cloud denoted by the blue solid line is released. Figure 2(6–9) demonstrate that cloud B catches up with cloud A, and then they coalesce. Thus, two new relatively large cavitation clouds are generated as shown in Figure 2(9). The solid red line with arrows denotes the motion of cloud A, and the dashed line with an arrow of cloud B. Figure 2(10,11) show the flowing of clouds newly released from the nozzle. Then, a new cloud is generated at the nozzle exit as shown in Figure 2(12), which is quite similar to Figure 2(1). Just the same as in Figure 2(1), the upstream three cavitation clouds near the nozzle exit are denoted as B, A, and A’, and Figure 2(13–18) show a repeat of the above releasing and coalescing process. Because clouds A and B are always released in order, cloud A is called to be the leading cloud cavity and B is the succeeding cloud. The solid lines with arrows denote the shedding of the leading cloud A and the dashed lines with arrows indicate the motion of the succeeding cloud B. The periodicity of cloud releasing and coalescing is demonstrated. According to the figure, we note that the ring-like cavitation clouds release from the nozzle throat and then coalesce consequently within the range x / d 3 . The large well-developed clouds collapse in the approximate range of 4 < x / d < 7 .

3.2. Periodicity of Cavitation Cloud Shedding

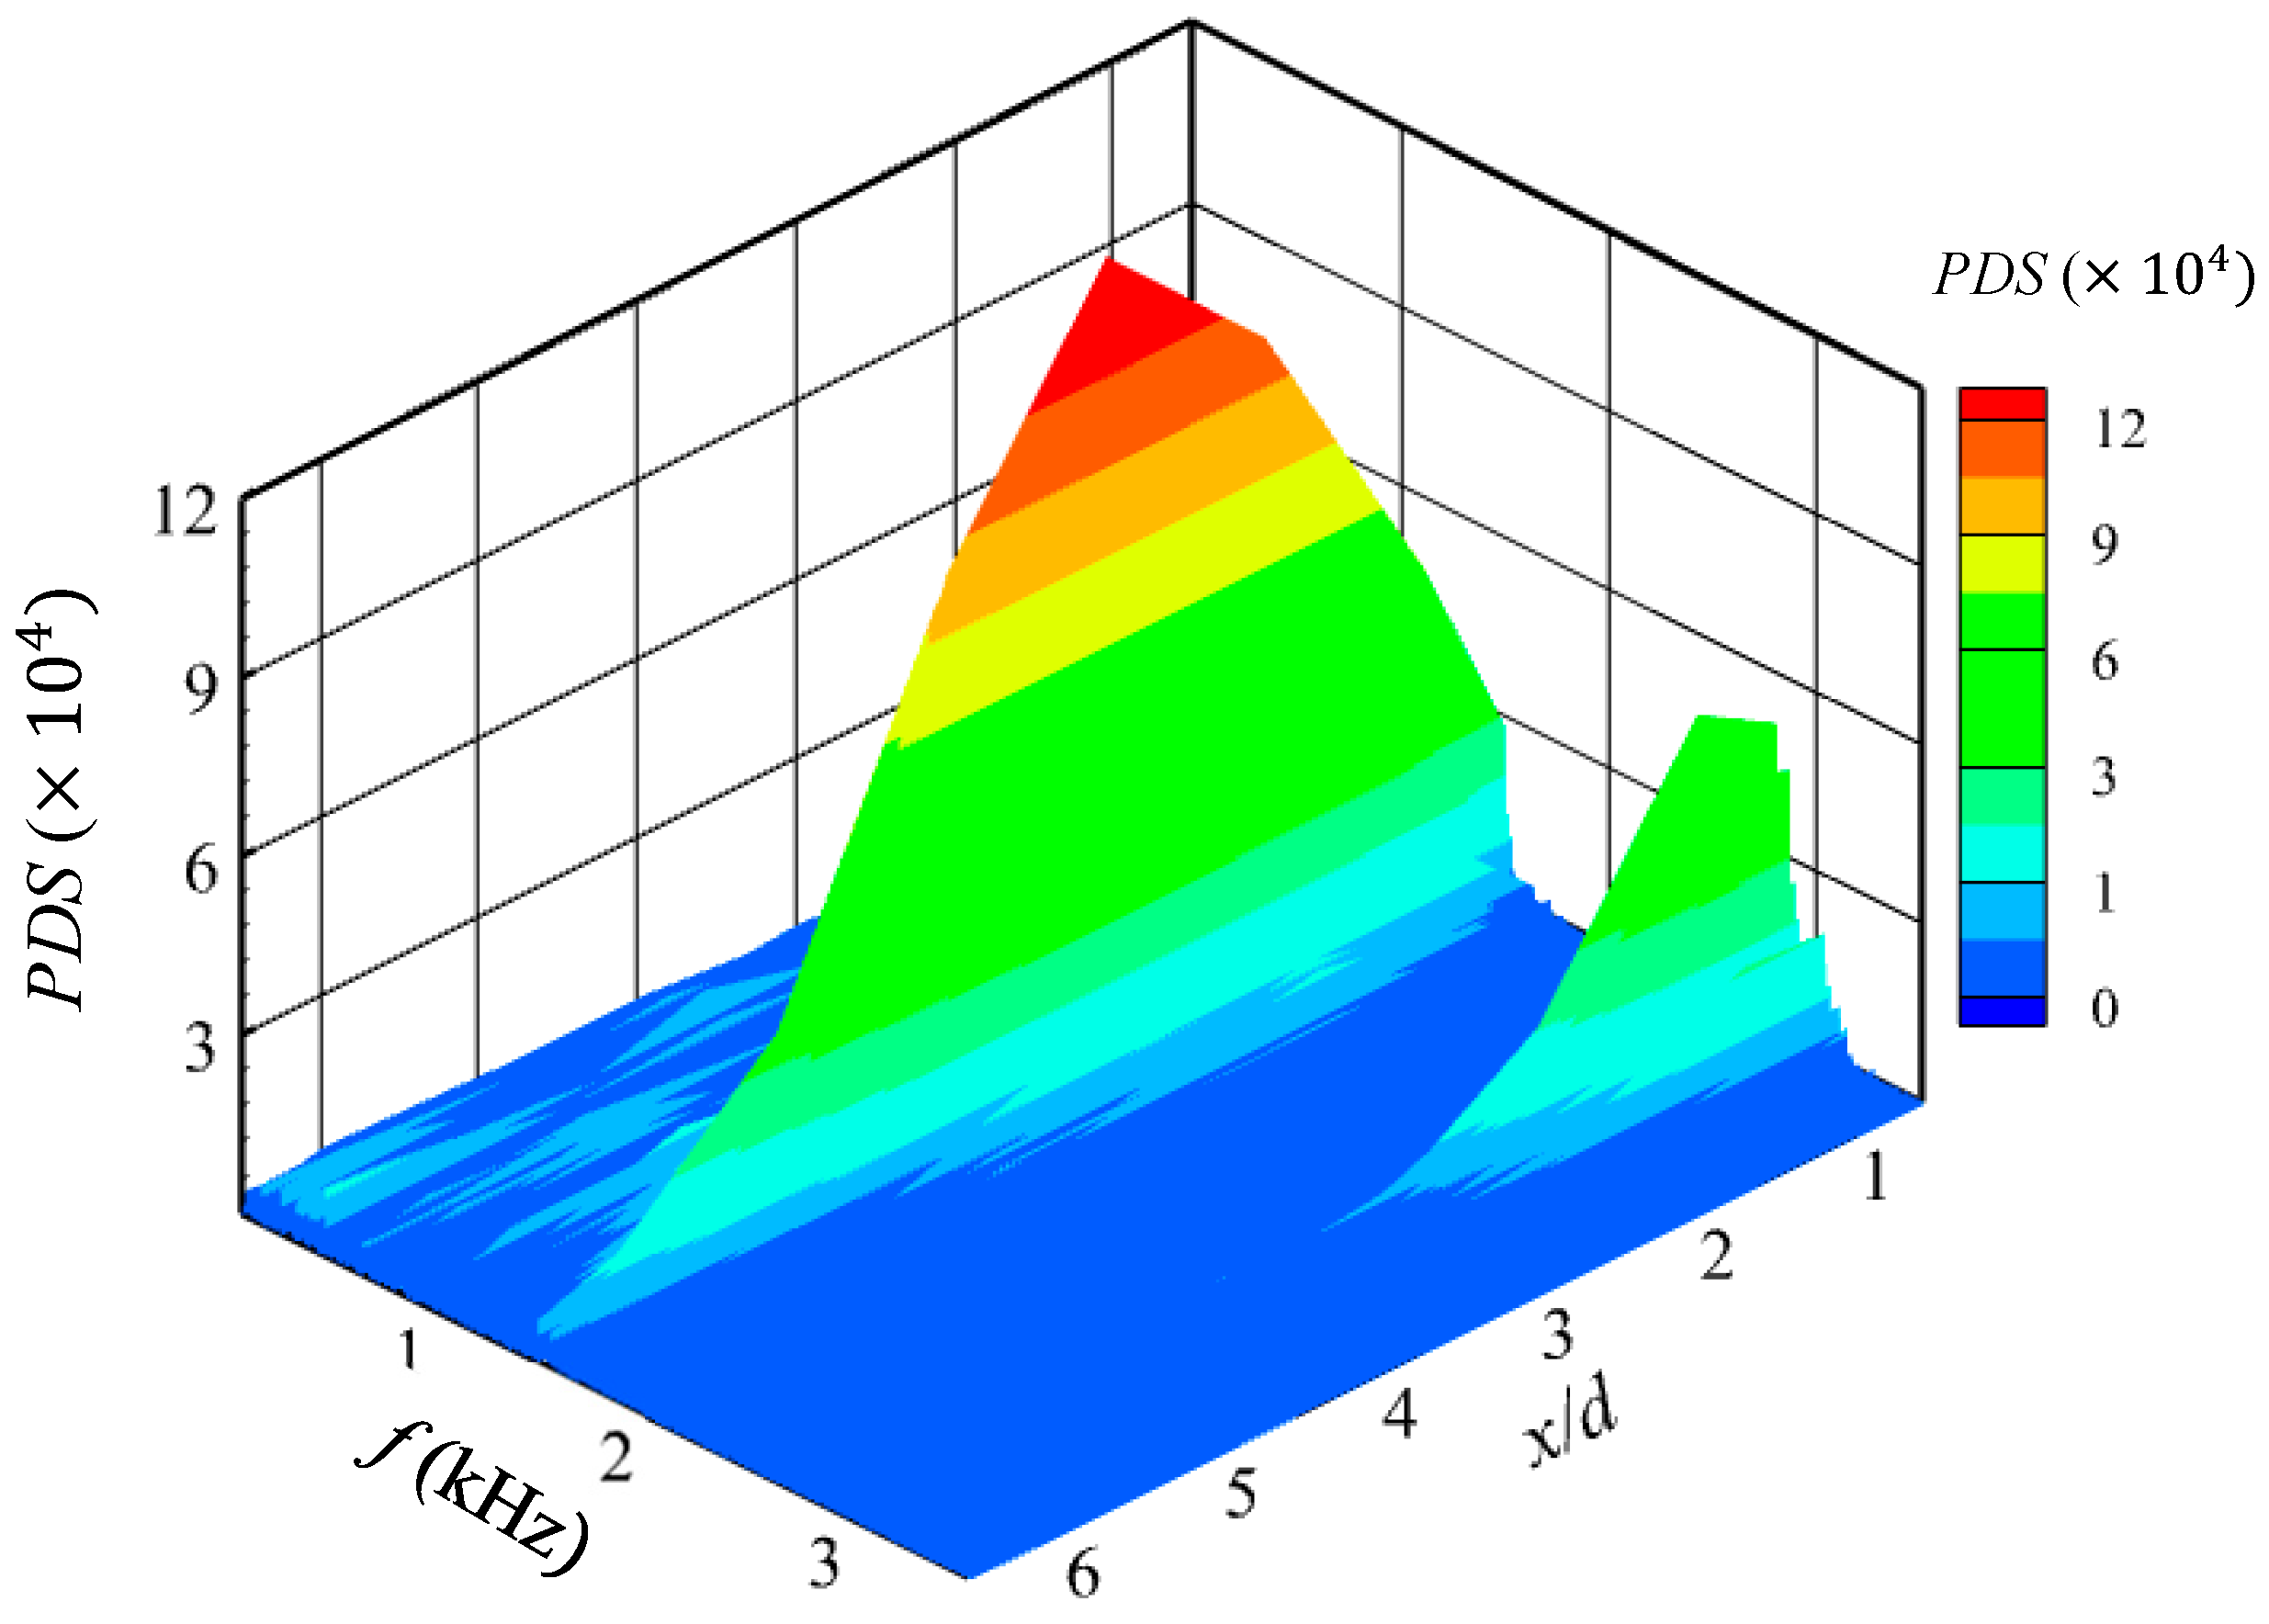
In order to evaluate the periodic characteristics of bubble cloud shedding, image analysis of high-speed camera photographs was performed by investigating the temporal variation of the gray level [23]. Sample images of one-pixel width in the axial direction were cut from a series of photographs taken by a high-speed camera at the positions of x / d = 0.5 , 1.0, 2.0, 3.0, 4.0, and 6.0, respectively. Then, the temporal variations of the gray level were investigated, and the waveform of the average gray level variation was analyzed. The periodic spectrum was calculated by fast Fourier transform analysis (FFT) [24]. Figure 3 shows the distribution of the power spectral density (PSD) of the average gray level oscillations, where the prominent large values are denoted in green to red colors for visibility. Two dominant frequency components, f 1 = 1483 Hz and f 2 = 2791 Hz, are demonstrated by the figure. That is to say, cavitation clouds release and coalesce at multiple frequencies. The first frequency f 1 appears in the range 0 x / d < 6 , which corresponds with the release of the leading cloud A. The second one appears in the range 0 x / d < 3 , which corresponds to the release of both the leading and the succeeding clouds A and B. They coalesce near x / d 1.8 ~ 2.5 , and f 2 / f 1 2 .
As a dimensionless index for such a periodic phenomenon, the Strouhal number, S t , is defined as follows by using the dominant frequency f of cavitation cloud shedding and the nozzle diameter d.
S t = f d / V t h  
Then, two Strouhal numbers corresponding to f 1 and f 2 are calculated to be S t 1 0.23 and S t 2 0.46 .
Table 1 shows the experimental results under different injection pressures, where the dominant frequencies and Strouhal numbers of cavitation cloud shedding are presented. As shown in the table, the dominant frequency of the leading cavitation cloud increases gradually with the increase of injection pressure and the Strouhal number S t 1 varies in the range of 0.21 0.29 . Similar results were reported by Nishimura et al. [25] The frequency f 2 denoting the motion of both the leading and the succeeding clouds appears within the range of x / d < 3 .

3.3. Mechanism of Cavitation Cloud Shedding

Regarding the flow structure as well as the interaction of cavitation cloud and flow field [26,27] numerical simulations were further conducted to clarify the interior of the intensively cavitating water jet. To capture the unsteady fluid dynamic effect of cavitation, a practical compressible gas-vapor/liquid mixture cavitation model based on the homogeneous multiphase flow approach was adopted, which allows for the practical treatment of the problem of high-speed cavitating water jets. The gas phase contained in the cavitation bubbles is assumed to consist of vapor and non-condensable components, and the compressibility of the vapor component is treated semi-empirically as a constant. The growth rate of the gas void fraction caused by cavitation is estimated by using the sonic speeds in both the gas and the liquid media. The model is embedded in an in-house unsteady Reynolds-averaged Navier–Stokes (URANS) solver for compressible fluids by employing the realizable k-ε turbulence model to evaluate the effect of turbulence. The details may be referred to in [21]. Numerical simulations were performed, and the relation between the flow structure and the unsteady behavior of cavitation cloud shedding was investigated. Then, the characteristics of cavitation cloud shedding, especially the process of cloud shedding and the effect of a re-entrant jet are analyzed.
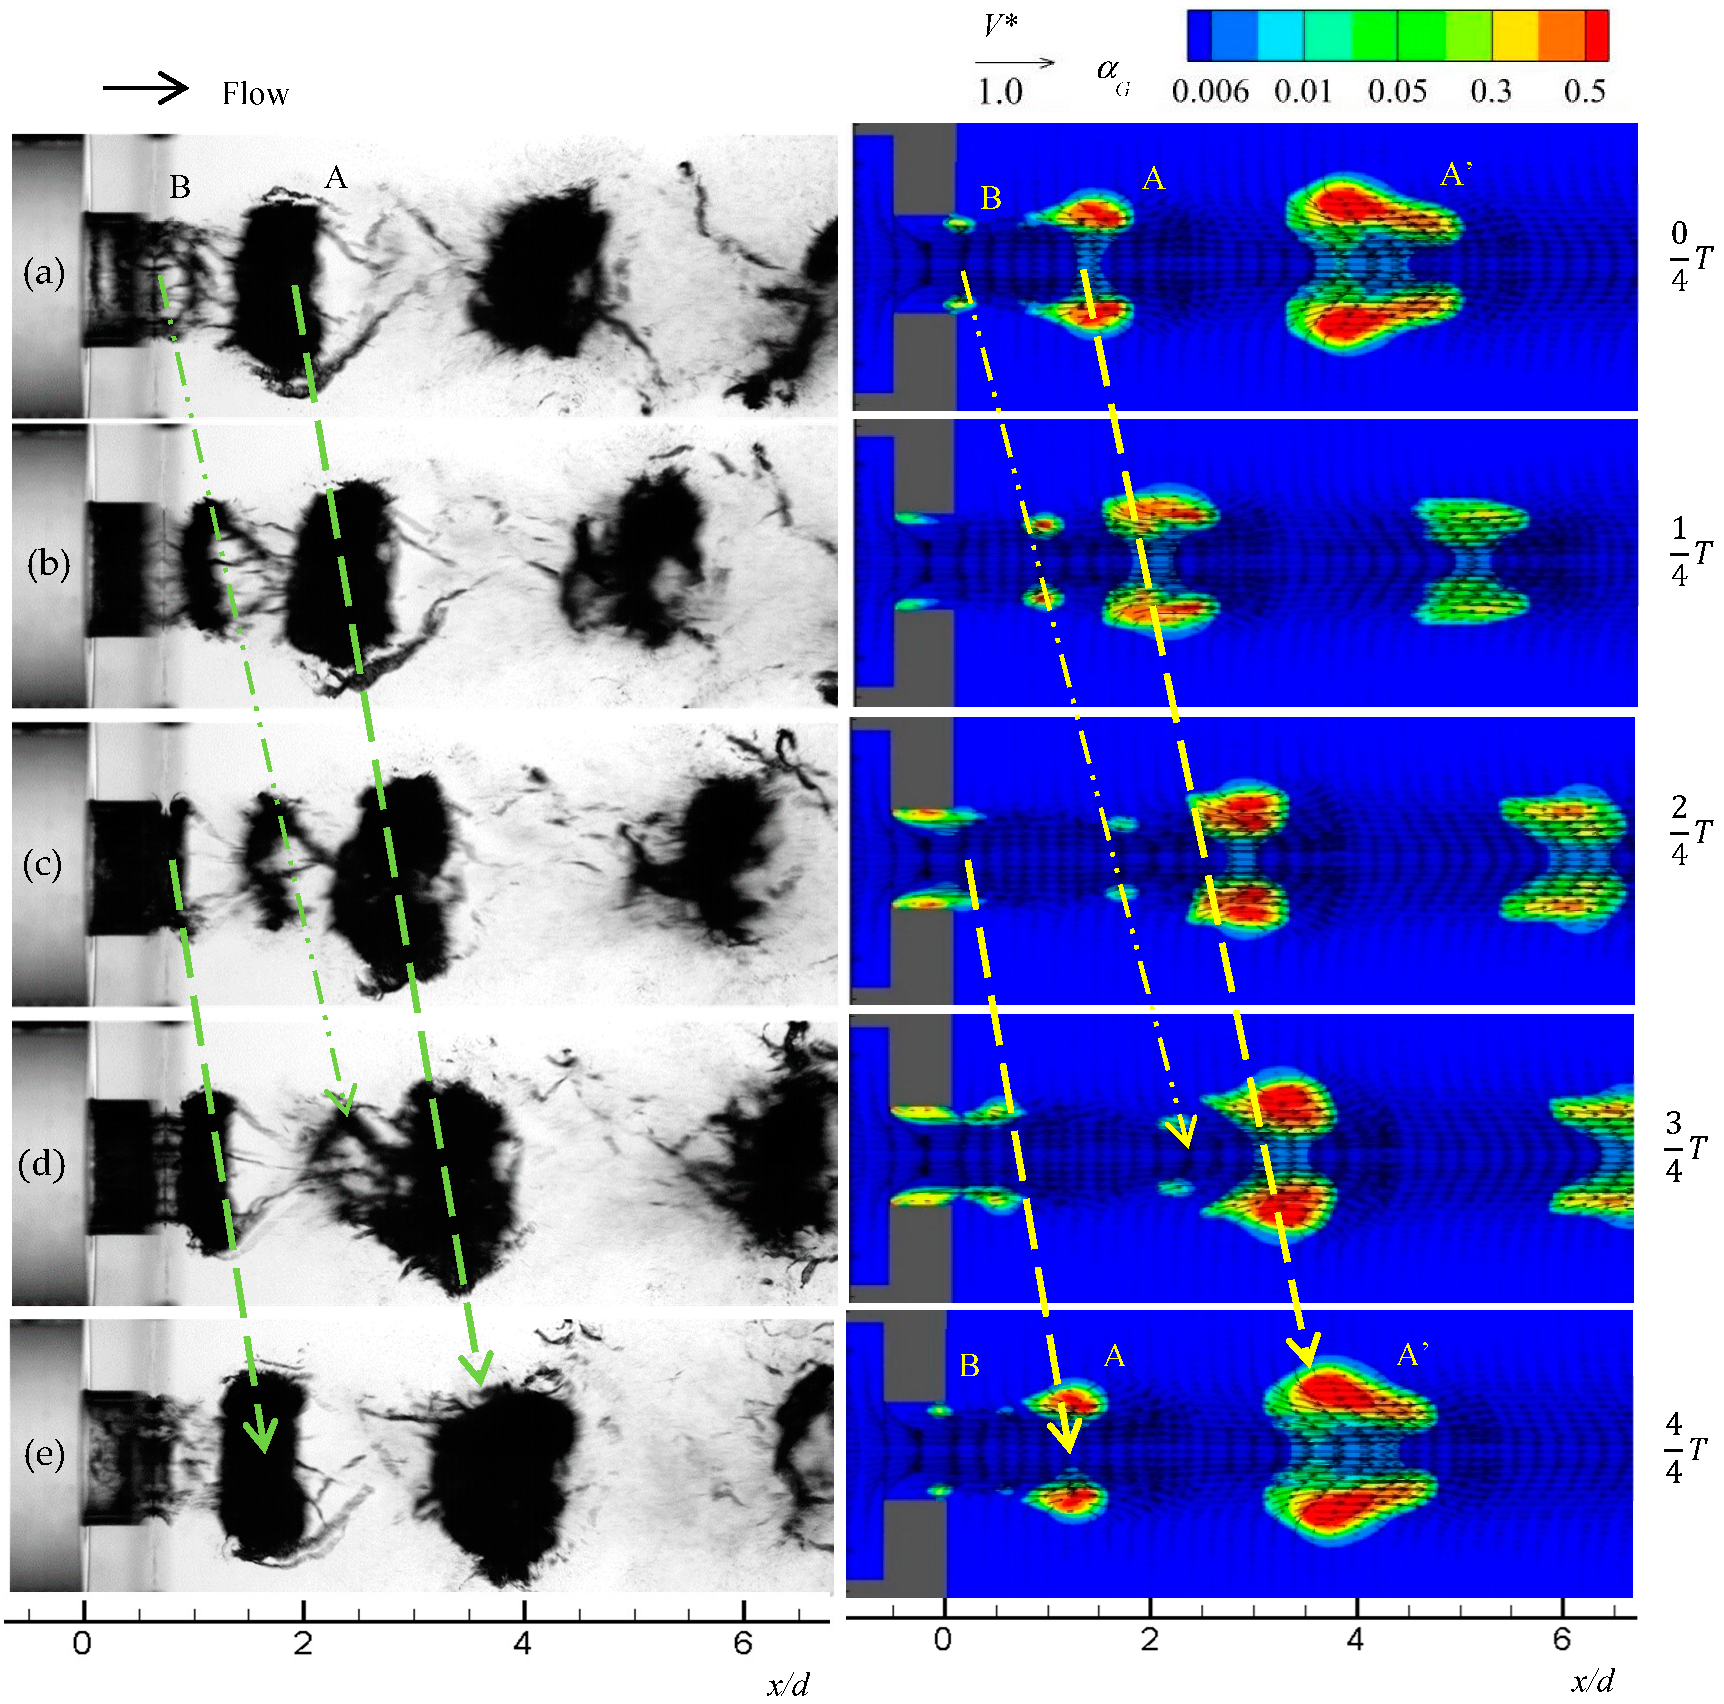
Figure 4 shows a comparison of experimental results and numerical ones, where a sequence of images demonstrating the periodic release and coalescence of ring-like cavitation clouds is presented. The right-hand side shows the computational results, where the instantaneous velocity vector distributions and contour maps of gas volumetric fraction α G in the x r section are presented in time sequence. The red color denotes the gaseous phase caused by cavitation and the blue color the liquid phase. The black vectors show the magnitude and the direction of local dimensionless velocities. The bright regions of α G 0.01 represent cavitation clouds. The right-hand side shows the experimental data of the flow visualization taken by the high-speed video camera under similar working conditions.
Figure 4a shows an instantaneous flow distribution when a succeeding cloud denoted as B is nearly detached from the nozzle exit, where two relatively large cavitation clouds denoted as A (middle) and A (downstream) are already released from the nozzle. Figure 4b,c show that cloud B becomes entirely detached from the nozzle and runs after cloud A while cloud A expands and cloud A contracts. Figure 4d indicates that a new parent cavity formed at the nozzle throat is fully extended and almost breaks into two parts under the effect of shear vortex flow formed at the nozzle exit, whereupon a new cavitation cloud is going to be released. The coalescence of clouds B and A is demonstrated. Figure 4e shows a repeat of the scenario in Figure 4a, where clouds A and B are combined as cloud A and a new cycle of cloud shedding is starting. Computational results show a good agreement with the experimental ones, and the periodic release and coalescence of cavitation clouds within the range of x / d   3 is predicted reasonably well, except the collapse pattern of cloud A ( x / d > 4 ) . The reason may be concluded to be that the assumption of axisymmetric flow was adopted in the numerical simulations to reduce the computation cost.
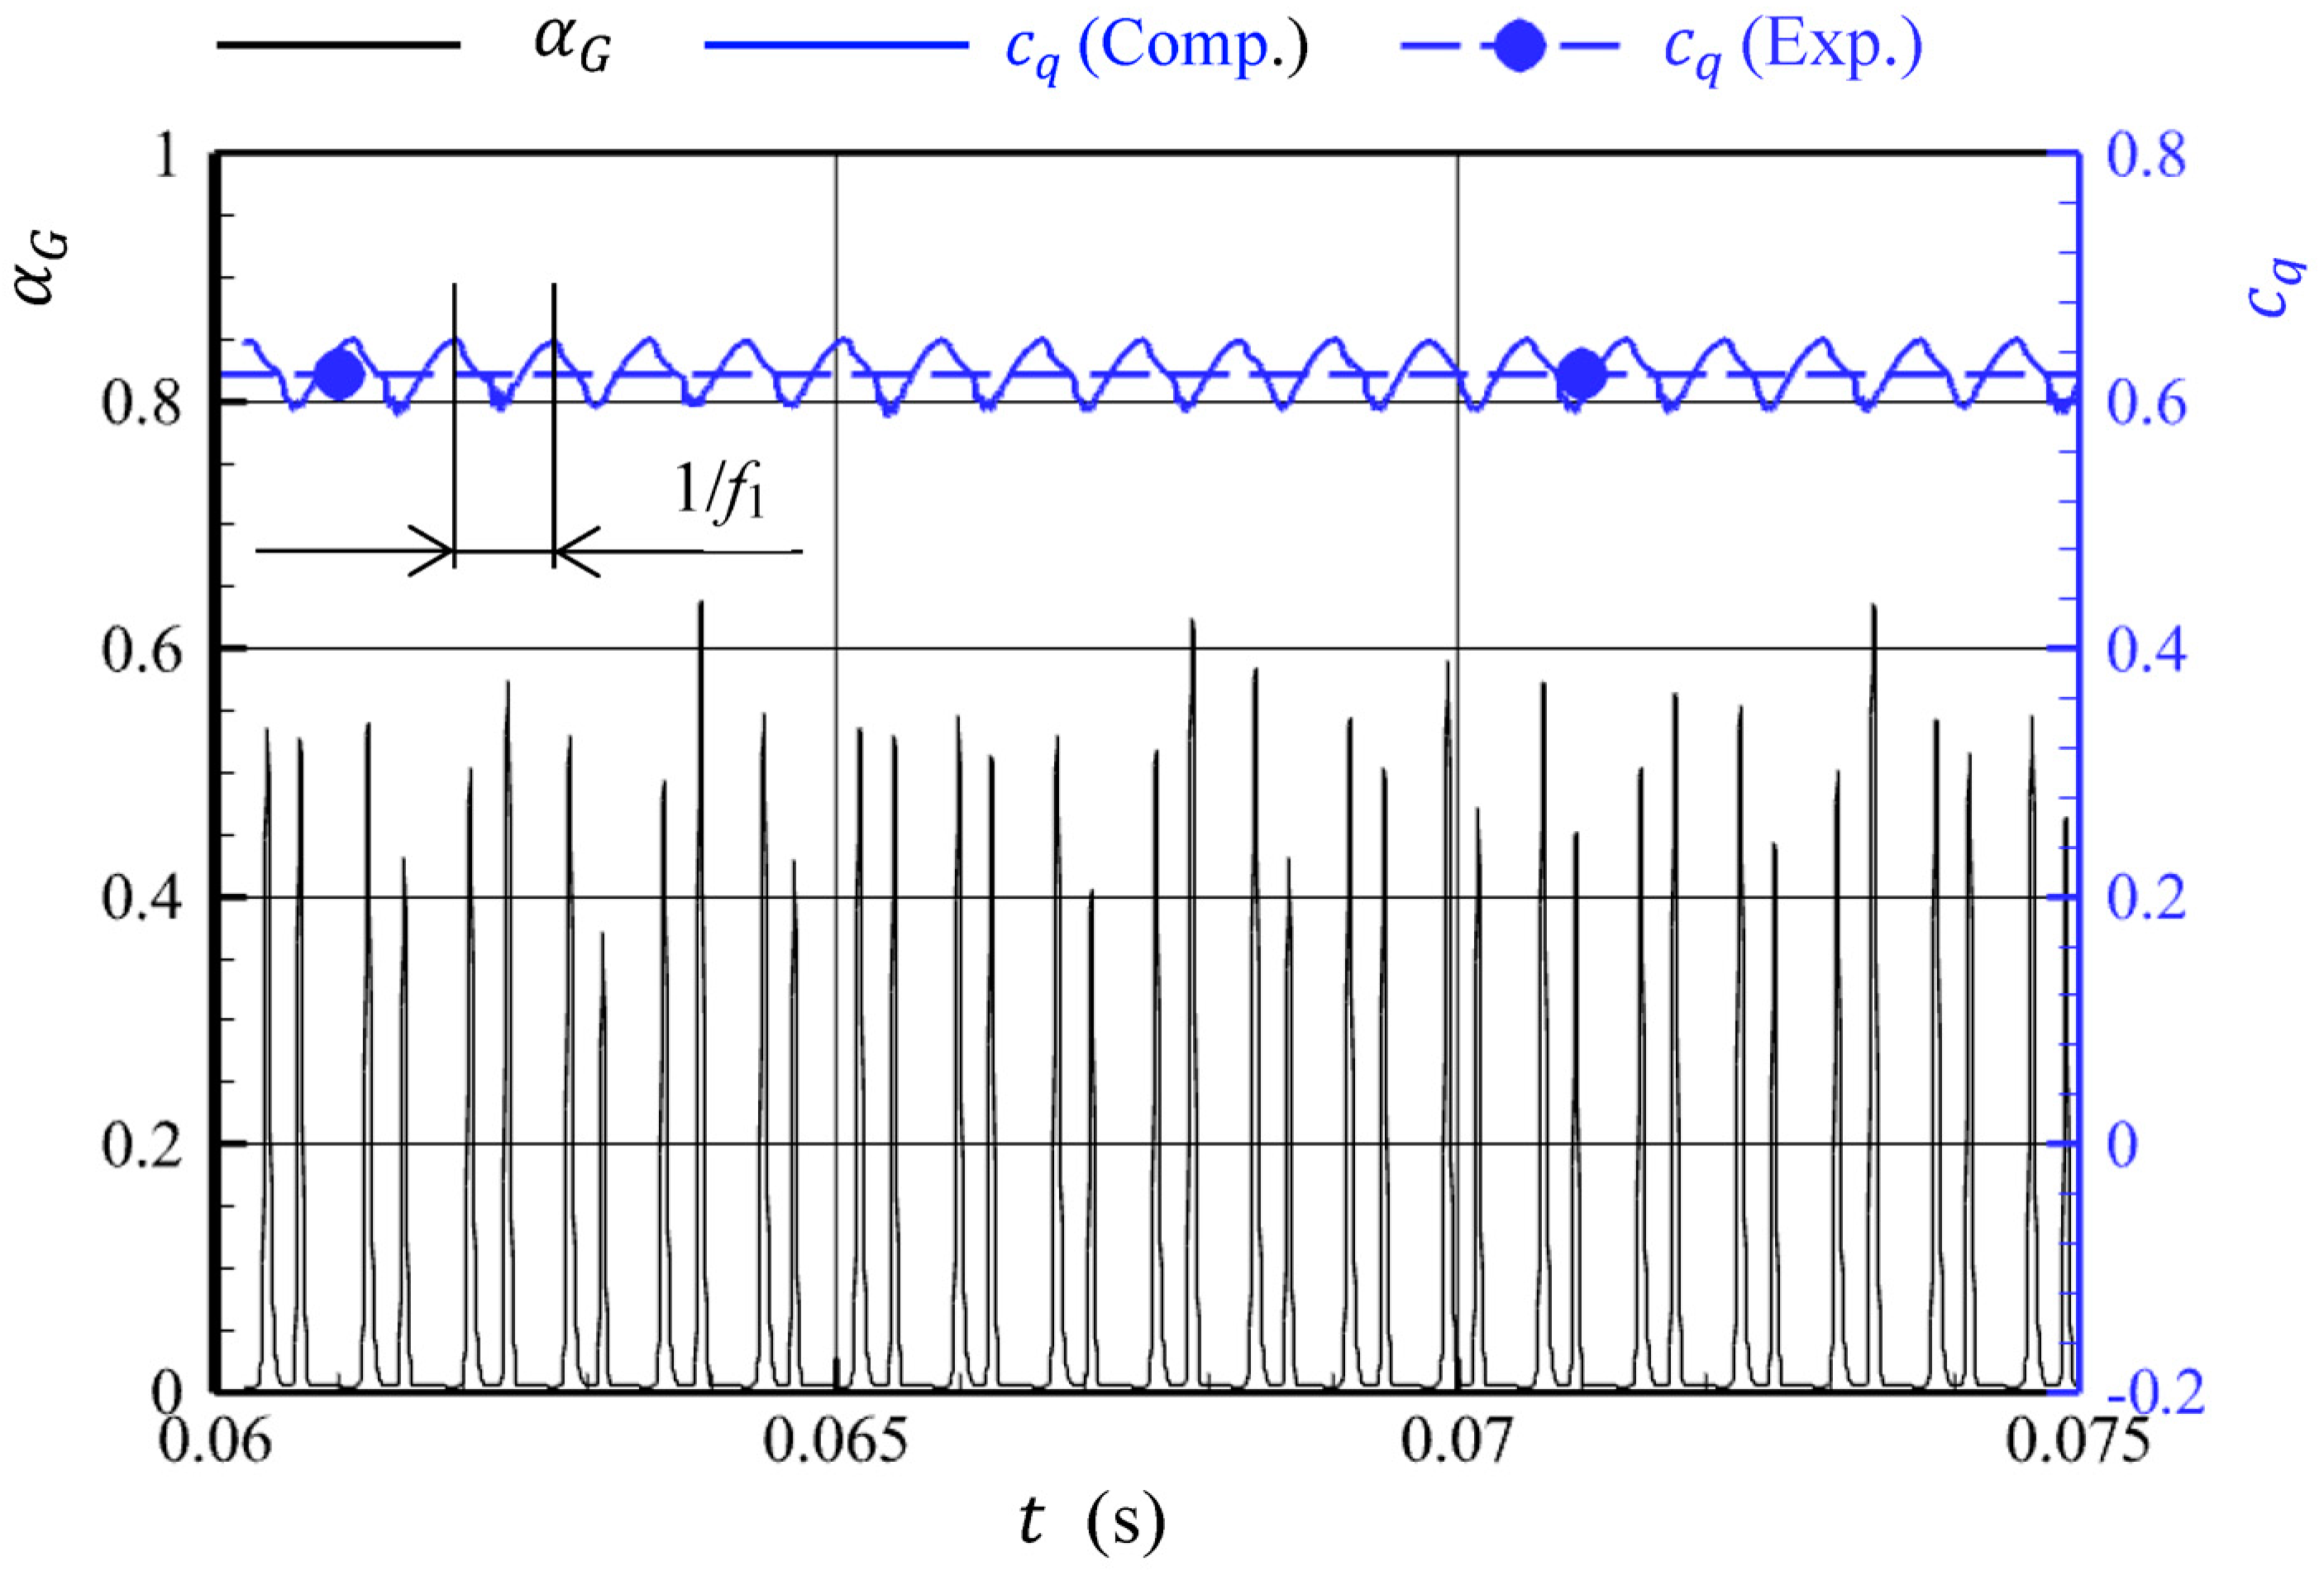
Figure 5 shows the temporal pulsation of the mass flow rate coefficient at the well-developed stage. The solid blue line denotes the computational result of mass flow rate coefficient c q . The dashed blue line with a solid circle shows the results of experimental measurement by a turbine flowmeter (10 Hz response) under the same working condition, where the high-frequency fluctuation of the flow rate is not detected for the limitation of the flowmeter response. The black solid line denotes the temporal variation of gas volumetric fraction α G at a given scanning position ( x / d = 2.0 , r / d = 0.48 ). The figure demonstrates that α G pulsatively varies from 0.002 to 0.6 at the scanning position, reflecting the periodic release of cavitation clouds during the developed stage. The flow rate coefficient pulsates from 0.59 to 0.65 approximately, where the effect of cavitation cloud shedding is demonstrated. The frequency of the flow rate coefficient pulsation agrees to the value of f 1 evaluated by image analysis of high-speed camera observation. The average value of c q evaluated from the numerical simulation results coincides with the experimental ones [28], and the reliability of present simulations is further confirmed.
Concerning the inner flow structure of the cavitating jet and the mechanism of cloud shedding, the unsteady flow behavior in the local region of the nozzle throat was investigated. Figure 6 shows an instantaneous flow distribution of the cavitating jet and the succeeding cloud-releasing, coalescing, and generating process. The top panel presents a contour map of the gas void fraction α G and velocity vector distribution in the x r section when a ring-like cavitation cloud attached to the nozzle throat expands to the outside of the nozzle exit. The red color denotes the gaseous phase and the blue color the liquid phase. The figure demonstrates that the cloud attached to the nozzle throat extends nearly to its maximum while previously released ring-like clouds travel downstream.
The lower panels of Figure 6 illustrate one circle of cavitation cloud shedding in a time sequence. Figure 6(1) shows an enlargement of the local flow field near the nozzle throat, where the fully extended cavity (cavitation cloud) begins to break under the effect of shear vortex flow. At step (2), the extended cavity splits into a leading part, which is marked as A, and a subsequent part attached to the nozzle wall. Corresponding to the breakdown of the large cavity, a re-entrant jet is formed along the throat wall as shown in (3). At step (3), the leading cavity A travels downstream and the subsequent cavity begins to contract, while the re-entrant jet detaches the cavity from the adjacent wall. In steps (4) and (5), a reverse flow region forms in the nozzle throat near the wall under the action of the re-entrant jet, and most parts of the wall-attached subsequent cavity become separated from the wall. At step (6), the subsequent cavity detaches from the parent cavity attached to the leading edge of the nozzle throat, and it is marked as B. In steps (7) and (8), cavity B runs after the leading cloud A while the leading edge attached parent cavity gradually extends. At step (9), the subsequent cavity combines with the leading cavity, while the wall-attached cavity expands quickly. At step (10), the wall-attached cavity is nearly fully extended to begin a new cycle as shown in step (1). The solid red line denotes the release of the leading cloud A, and the dashed line that of the subsequent cloud B. The length of the fully extended cavity, which is one of important parameters indicating the intensity of cavitation, is estimated to be L c 1 / d 0.8 1.1 . Summarizing the above, we know that the leading cloud A is principally split by the shear flow, and the subsequent cloud B is principally detached by the re-entrant jet. They successively shed downstream, and this process is periodically repeated.

4. Conclusions

The property of cavitation cloud shedding in a sharp-edged orifice nozzle has been investigated by combined utilization of high-speed camera observation and flow simulation. The inner structure of the cavitating jet and the mechanism of cloud shedding are clarified. The results demonstrate that:
(1) One pair of ring-like clouds, consisting of a leading cloud A and a subsequent cloud B, is successively shed downstream, and this process is periodically repeated in the well-developed stage.
(2) The leading cloud is principally split by the shear vortex flow, and the subsequent cloud is detached by the re-entrant jet generated while a fully extended cavity breaks down. The subsequent cavitation cloud B catches the leading cloud A, and they coalesce over the range of x / d 1.8~2.5.
(3) The Strouhal number of the leading cavitation cloud shedding varies from 0.21 to 0.29, corresponding to the injection pressure. The mass flow rate coefficient fluctuates from 0.59 ~ 0.66 at the same frequency as the shedding of the leading cloud, and its average equals approximately 0.63 under the given condition.

Author Contributions

Conceptualization, T.O. and G.P.; methodology, T.O., H.J. and G.P.; investigation, T.O. and K.L.; writing—original draft preparation, T.O.; writing—review and editing, H.J. and G.P.; supervision, G.P.; project administration, G.P.; funding acquisition, G.P. All authors have read and agreed to the published version of the manuscript.

Funding

This research was partly supported by JSPS KAKENHI (C) 17K06169.

Data Availability Statement

The data presented in this study are available from the corresponding author upon reasonable request.

Acknowledgments

The authors would like to thank K. Yoshida, R. Ishizuka, and K. Shirota, former students of Nihon University, for their assistance in the experiments and computations.

Conflicts of Interest

Author Taihei Oishi was employed by the company Olympus Corporation. All authors declare that the research was conducted in the absence of any commercial or financial relationships that could be construed as a potential conflict of interest.

References

  1. Howell, J.; Ham, E.; Jung, S. Ultrasonic Bubble Cleaner as a Sustainable Solution. Fluids 2023, 8, 291. [Google Scholar] [CrossRef]
  2. Kalumuck, K.M.; Chahine, G.L. The use of cavitating jets to oxidize organic compounds in water. J. Fluids Eng. 2000, 122, 465–470. [Google Scholar] [CrossRef]
  3. Hutli, E.A.F.; Nedeljkovic, M.S.; Radovic, N.A.; Bonyár, A. The relation between the high speed submerged cavitating jet behaviour and the cavitation erosion process. Int. J. Multiph. Flow 2016, 83, 27–38. [Google Scholar] [CrossRef]
  4. Safaei, S.; Mehring, C. Effect of Dissolved Carbon Dioxide on Cavitation in a Circular Orifice. Fluids 2024, 9, 41. [Google Scholar] [CrossRef]
  5. Cui, Y.; Zhao, M.; Ding, Q.; Cheng, B. Study on Dynamic Evolution and Erosion Characteristics of Cavitation Clouds in Submerged Cavitating Water Jets. J. Mar. Sci. Eng. 2024, 12, 641. [Google Scholar] [CrossRef]
  6. Soyama, H. Cavitating jet: A review. Appl. Sci. 2020, 10, 7280. [Google Scholar] [CrossRef]
  7. Mohod, A.V.; Teixeira, A.C.S.C.; Bagal, M.V.; Gogate, P.R.; Giudici, R. Degradation of organic pollutants from wastewater using hydrodynamic cavitation: A review. J. Environ. Chem. Eng. 2023, 11, 109773. [Google Scholar] [CrossRef]
  8. Michael, M.; Wright, B.E.; Dropkin, A.; Truscott, T.T. Cavitation of a submerged jet. Exp. Fluids 2013, 54, 1541–1543. [Google Scholar]
  9. Peng, K.; Tian, S.; Li, G.; Huang, Z.; Zhang, Z. Cavitation in water jet under high ambient pressure conditions. Exp. Therm. Fluid Sci. 2017, 89, 9–18. [Google Scholar] [CrossRef]
  10. Peng, G.; Itou, T.; Oguma, Y.; Shimizu, S. Effect of ventilation on the velocity decay of cavitating submerged water jet. In Fluid-Structure-Sound Interactions and Control; Zhou, Y., Lucey, A.D., Liu, Y., Huang, L., Eds.; Springer: London, UK, 2018; Volume 9, pp. 93–98. [Google Scholar]
  11. Ullas, P.K.; Dhiman Chatterjee, S. Vengadesan; Experimental study on the effect of throat length in the dynamics of internal unsteady cavitating flow. Phys. Fluids 2023, 35, 023332. [Google Scholar] [CrossRef]
  12. Liu, Y.; Huang, B.; Zhang, H.; Wu, Q.; Wang, G.   Experimental investigation into fluid–structure interaction of cavitating flow. Phys. Fluids 2021, 33, 093307. [Google Scholar] [CrossRef]
  13. Huang, S.; Huang, J.; He, K. Research on Erosion Effect of Various Submerged Cavitating Jet Nozzles and Design of Self-Rotating Cleaning Device. Appl. Sci. 2024, 14, 1433. [Google Scholar] [CrossRef]
  14. Ge, M.; Manikkam, P.; Ghossein, J.; Subramanian, R.; Coutier-Delgosha, O.; Zhang, G. Dynamic mode decomposition to classify cavitating flow regimes induced by thermodynamic effects. Energy 2022, 254, 124426. [Google Scholar] [CrossRef]
  15. Ge, M.; Zhang, G.; Petkovšek, M.; Kunpeng Long, K.; Coutier-Delgosha, O. Intensity and regimes changing of hydrodynamic cavitation considering temperature effects. J. Clean. Prod. 2022, 338, 130470. [Google Scholar] [CrossRef]
  16. Hutli, E.A.F.; Nedeljkovic, M.S. Frequency in shedding/discharging cavitation clouds determined by visualization of a submerged cavitating jet. J. Fluids Eng. 2008, 130, 021304. [Google Scholar] [CrossRef]
  17. Franc, J.P.; Michel, J.M. Fundamentals of Cavitation; Kluwer Academic Publishers: Dordrecht, The Netherlands, 2004; pp. 1–55. [Google Scholar]
  18. Podbevšek, D.; Petkovšek, M.; Ohl, C.D.; Dular, M. Kelvin-Helmholtz instability governs the cavitation cloud shedding in Venturi microchannel. Int. J. Multiph. Flow 2021, 142, 103700. [Google Scholar] [CrossRef]
  19. Peng, G.; Yang, C.; Oguma, Y.; Shimizu, S. Numerical analysis of cavitation cloud shedding in a submerged water. J. Hydrodyn. 2016, 28, 986–993. [Google Scholar] [CrossRef]
  20. Cruz-Ávila, M.; León-Ruiz, J.; Carvajal-Mariscal, I.; Klapp, J. CFD turbulence models assessment for the cavitation phenomenon in a rectangular profile Venturi tube. Fluids 2024, 9, 71. [Google Scholar] [CrossRef]
  21. Oishi, T.; Peng, Y.; Ji, H.; Peng, G. Numerical simulations of cavitating water jet by an improved cavitation model of compressible mixture flow with an emphasis on phase change effects. Phys. Fluids 2023, 35, 073333. [Google Scholar] [CrossRef]
  22. Shih, T.H.; Liou, W.W.; Shabbir, A.; Yang, Z.; Zhu, J. A new k-ϵ eddy-viscosity model for high Reynolds number turbulent flows—Model development and validation. Comput. Fluids 1995, 24, 227–238. [Google Scholar] [CrossRef]
  23. Peng, G.; Wakui, A.; Oguma, Y.; Shimizu, S.; Ji, H. Periodic behavior of cavitation cloud shedding in submerged water jets issuing from a sheathed pipe nozzle. J. Flow Control Meas. Vis. 2018, 6, 15–26. [Google Scholar] [CrossRef]
  24. Lin, Y.; Kadivar, E.; Moctar, O. Experimental study of the cavitation effects on hydrodynamic behavior of a circular cylinder at different cavitation regimes. Fluids 2023, 8, 162. [Google Scholar] [CrossRef]
  25. Nishimura, A.; Takakuwa, O.; Soyama, H. Similarity law on shedding frequency of cavitation cloud induced by a cavitating jet. J. Fluid Sci. Technol. 2012, 7, 405–420. [Google Scholar] [CrossRef]
  26. Liu, H.; Kang, C.; Zhang, W.; Zhang, T. Flow structures and cavitation in submerged waterjet at high jet pressure. Exp. Therm. Fluid Sci. 2017, 88, 504–512. [Google Scholar] [CrossRef]
  27. Liu, B.; Pan, Y.; Ma, F. Pulse pressure loading and erosion pattern of cavitating jet. Eng. Appl. Comput. Fluid Mech. 2019, 14, 136–150. [Google Scholar] [CrossRef]
  28. Nurick, W.H. Orifice cavitation and its effect on spray mixing. J. Fluids Eng. 1976, 98, 681–687. [Google Scholar] [CrossRef]
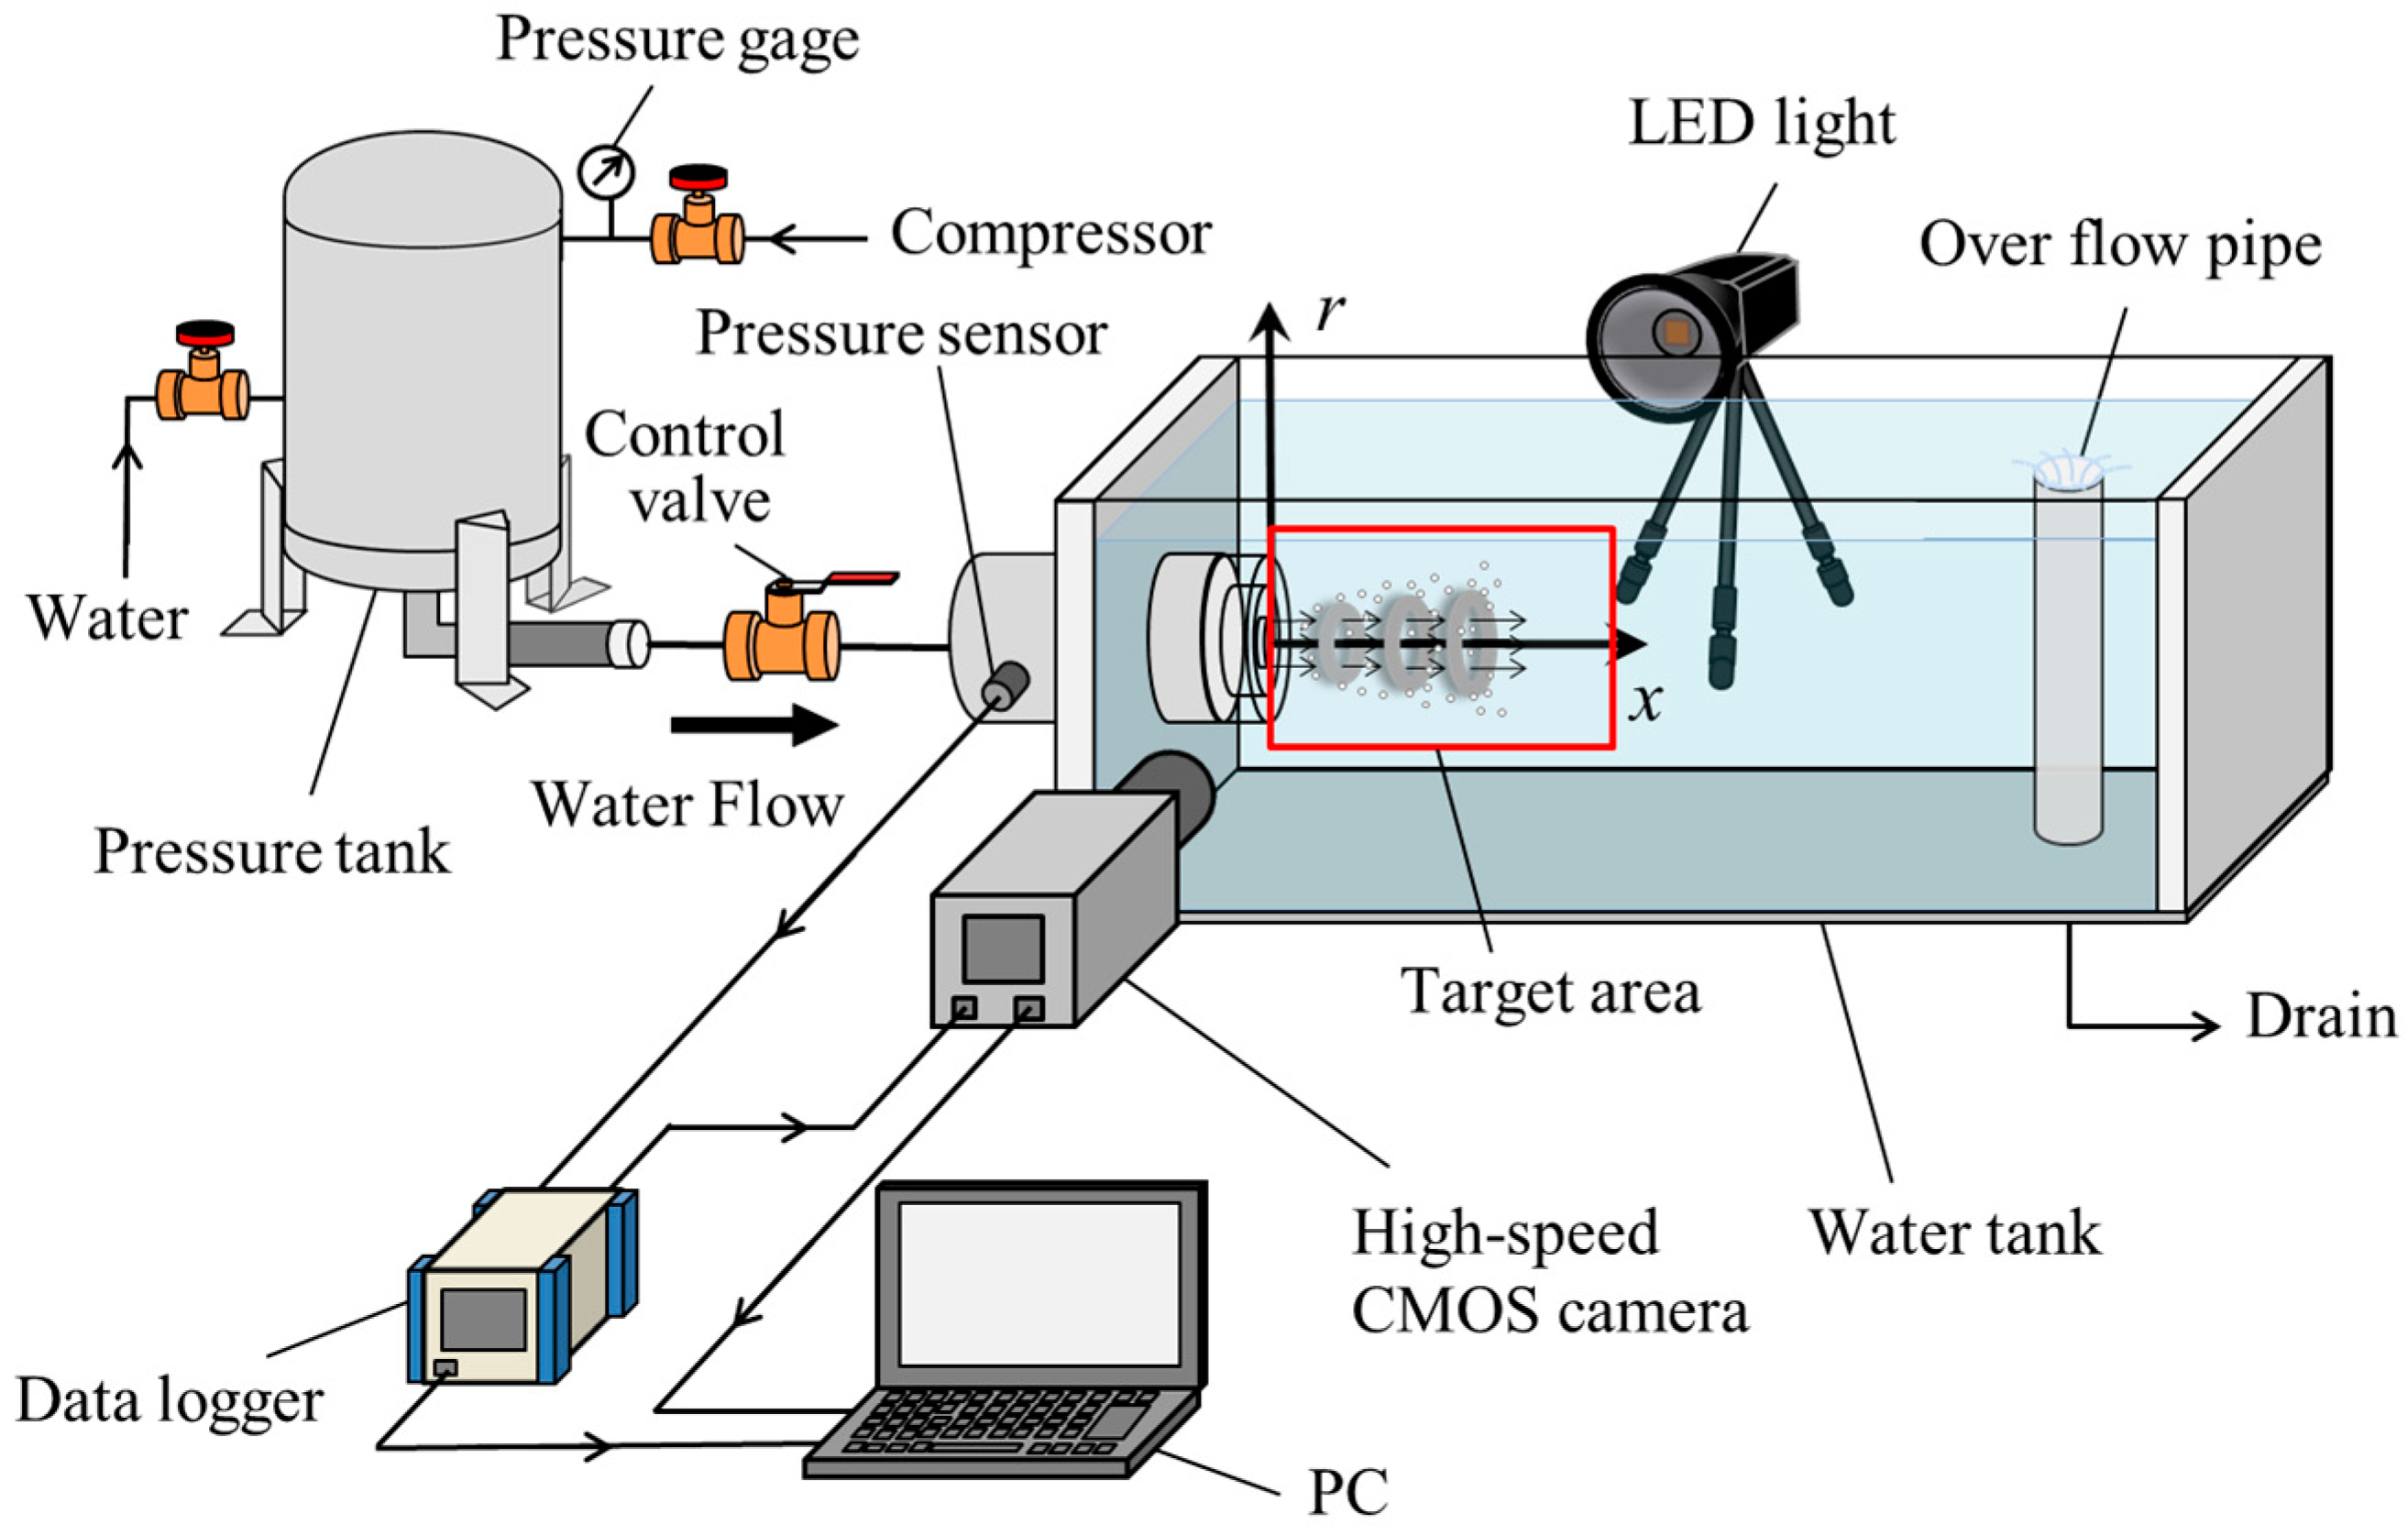
Figure 1. Scheme of experimental device.
Fluids 09 00156 g001
Figure 2. Periodic shedding of cavitation clouds ( P i n = 0.6   M P a ,   σ 0.18 ) .
Fluids 09 00156 g002
Figure 3. Dominant frequencies of cavitation cloud shedding ( P i n = 0.6   M P a ,   σ 0.18 ) .
Fluids 09 00156 g003
Figure 4. Periodic release and coalescence of cavitation clouds at the developed stage: (ae, left) experimental high-speed video camera observations in a time sequence and (ae, right) contour map of gas void fraction obtained by numerical simulation.
Fluids 09 00156 g004
Figure 5. Temporal pulsation of the mass flow rate coefficient c q and the variation of gas void fraction α G at a given sampling position ( x / d = 2.0 ,   r / d = 0.48 ).
Fluids 09 00156 g005
Figure 6. Instantaneous flow distributions of cavitating water jet, where (1)–(10) show a circle of cavitation cloud shedding from the nozzle throat in time sequence.
Fluids 09 00156 g006
Table 1. The dominant frequencies and Strouhal numbers of cloud shedding.
P i n (MPa) V t h (m/s) Re   ( × 10 5 ) f 1 (s−1) S t 1 f 2 (s−1) S t 2
x / d < 6 x / d < 3
0.320.30.711610.2923220.57
0.424.90.814430.2928560.57
0.528.60.913730.2427250.48
0.632.01.014830.2327910.44
0.735.01.115450.2230760.44
0.837.81.215710.2131240.41
Disclaimer/Publisher’s Note: The statements, opinions and data contained in all publications are solely those of the individual author(s) and contributor(s) and not of MDPI and/or the editor(s). MDPI and/or the editor(s) disclaim responsibility for any injury to people or property resulting from any ideas, methods, instructions or products referred to in the content.