1. Introduction
Aqueous foams, characterized by a high volume fraction of gas bubbles in a small liquid volume [
1], have gained significant attention due to their wide range of applications in industries such as cosmetics, oil recovery, and deliquification of natural gas [
2,
3,
4,
5]. Understanding the dynamics of foams and the flow within the films was crucial, encompassing various factors such as drainage properties, surfactant materials, surfactant concentration, and the Marangoni effect [
6,
7,
8].
The Marangoni effect, named after Carlo Giuseppe Matteo Marangoni who introduced this flow in his doctoral thesis in 1865 [
9], is caused by the gradient of surface surfactant concentrations [
10]. Surfactants are chemical components that can be dissolved in water and possess a complex molecular shape [
11,
12]. These surfactant molecules consist of a hydrophilic “head” region and a hydrophobic “tail” region. The head groups are attracted to the water phase, allowing surfactants to occupy the free surface and effectively reducing the surface tension [
13]. This unique molecular arrangement enables surfactants to play a crucial role in modulating interfacial properties and driving the Marangoni effect.
The study of the Marangoni flow attracted considerable attention due to its relevance in understanding dynamic patterns, stability, and interfacial behaviour. In recent years, several research papers have contributed to the understanding of the Marangoni flow in aqueous foams and related interfaces. Schmitt and Stark [
14] investigated the Marangoni flow at droplet interfaces and provided a three-dimensional solution along with practical applications. Pototsky et al. [
15] explored the dynamics of self-propelled surfactant particles and their impact on thin liquid layers, studying mode instabilities, dynamic patterns, and stability. Sergievskaya et al. [
16] and Ermakov et al. [
17] examined the damping of surface waves in the presence of oil slicks and oil emulsion films, shedding light on the interplay between Marangoni effects and wave dissipation. Rajan et al. [
18,
19] investigated the dissipation and resonance of interfacial Marangoni waves with capillary-gravity waves, while Stetten et al. [
20] explored the enabling of the Marangoni flow at air–liquid interfaces through the deposition of aerosolized lipid dispersions.
Marangoni flows exhibited their presence in diverse processes and systems that involve aqueous foams, encompassing phenomena like recirculation, photo-surfactant, and foam fractionation. Pitois et al. [
21] introduced the initial model for the recirculation counterflow, which was propelled by the Marangoni effect near the plateau border (PB) of the film. Building upon this model, Rezaee et al. [
22] conducted additional investigations to deepen the understanding of these flows.
The Marangoni effect induced by photo-surfactants was triggered by UV light, as examined in the study conducted by Chevallier et al. [
23]. The researchers investigated the impact of UV light on the drainage process of thin aqueous films, exploring the interplay between photo-surfactants and Marangoni flow dynamics.
Foam fractionation is a high-speed process, which is due to the sharp increase in surfactant concentration in the foam column [
24]. The reflux system plays a vital role in uniformly enriching the column with a surfactant concentration, causing surfactant diffusion from the PB to the film [
24,
25]. Foam fractionation has been utilized in various industrial applications, including the removal of contaminants from wastewater and protein skimming, where hydrophobic molecules are separated from liquid solutions using a reflux system [
26].
In this study, we focused solely on Marangoni flow optimization parameters to enhance the performance of the fractionation column. The investigation involves analysing the dependence of the Marangoni velocity profile on the initial surfactant concentration of the plateau border (PB). The initial surfactant concentration of the PB is varying due to the ratio of surfactant concentration in the reflux column or PB to the surfactant concentration of the film. Furthermore, it was observed that the equilibrium time was influenced by the surfactant concentration in the reflux column, with higher surfactant concentrations leading to faster equilibrium times. The equilibrium time played a crucial role in foam fractionation processes as it directly impacted the overall efficiency and productivity of the fractionation column. The study also examined the influence of the Boussinesq number (Bo) on the Marangoni flow, considering various values including slip and rigid walls. Additionally, a comparison was made between the behaviour of the Marangoni flow in the exterior film and the interior film. Finally, the investigation explored the impact of different Bo numbers on the flow behaviour in the exterior film. By conducting a comprehensive analysis of the Marangoni flow in foam fractionation and optimizing the associated parameters, this research contributed to a deeper understanding of foam dynamics and offered valuable insights for enhancing the performance of fractionation columns.
2. Model Geometry and Methodology
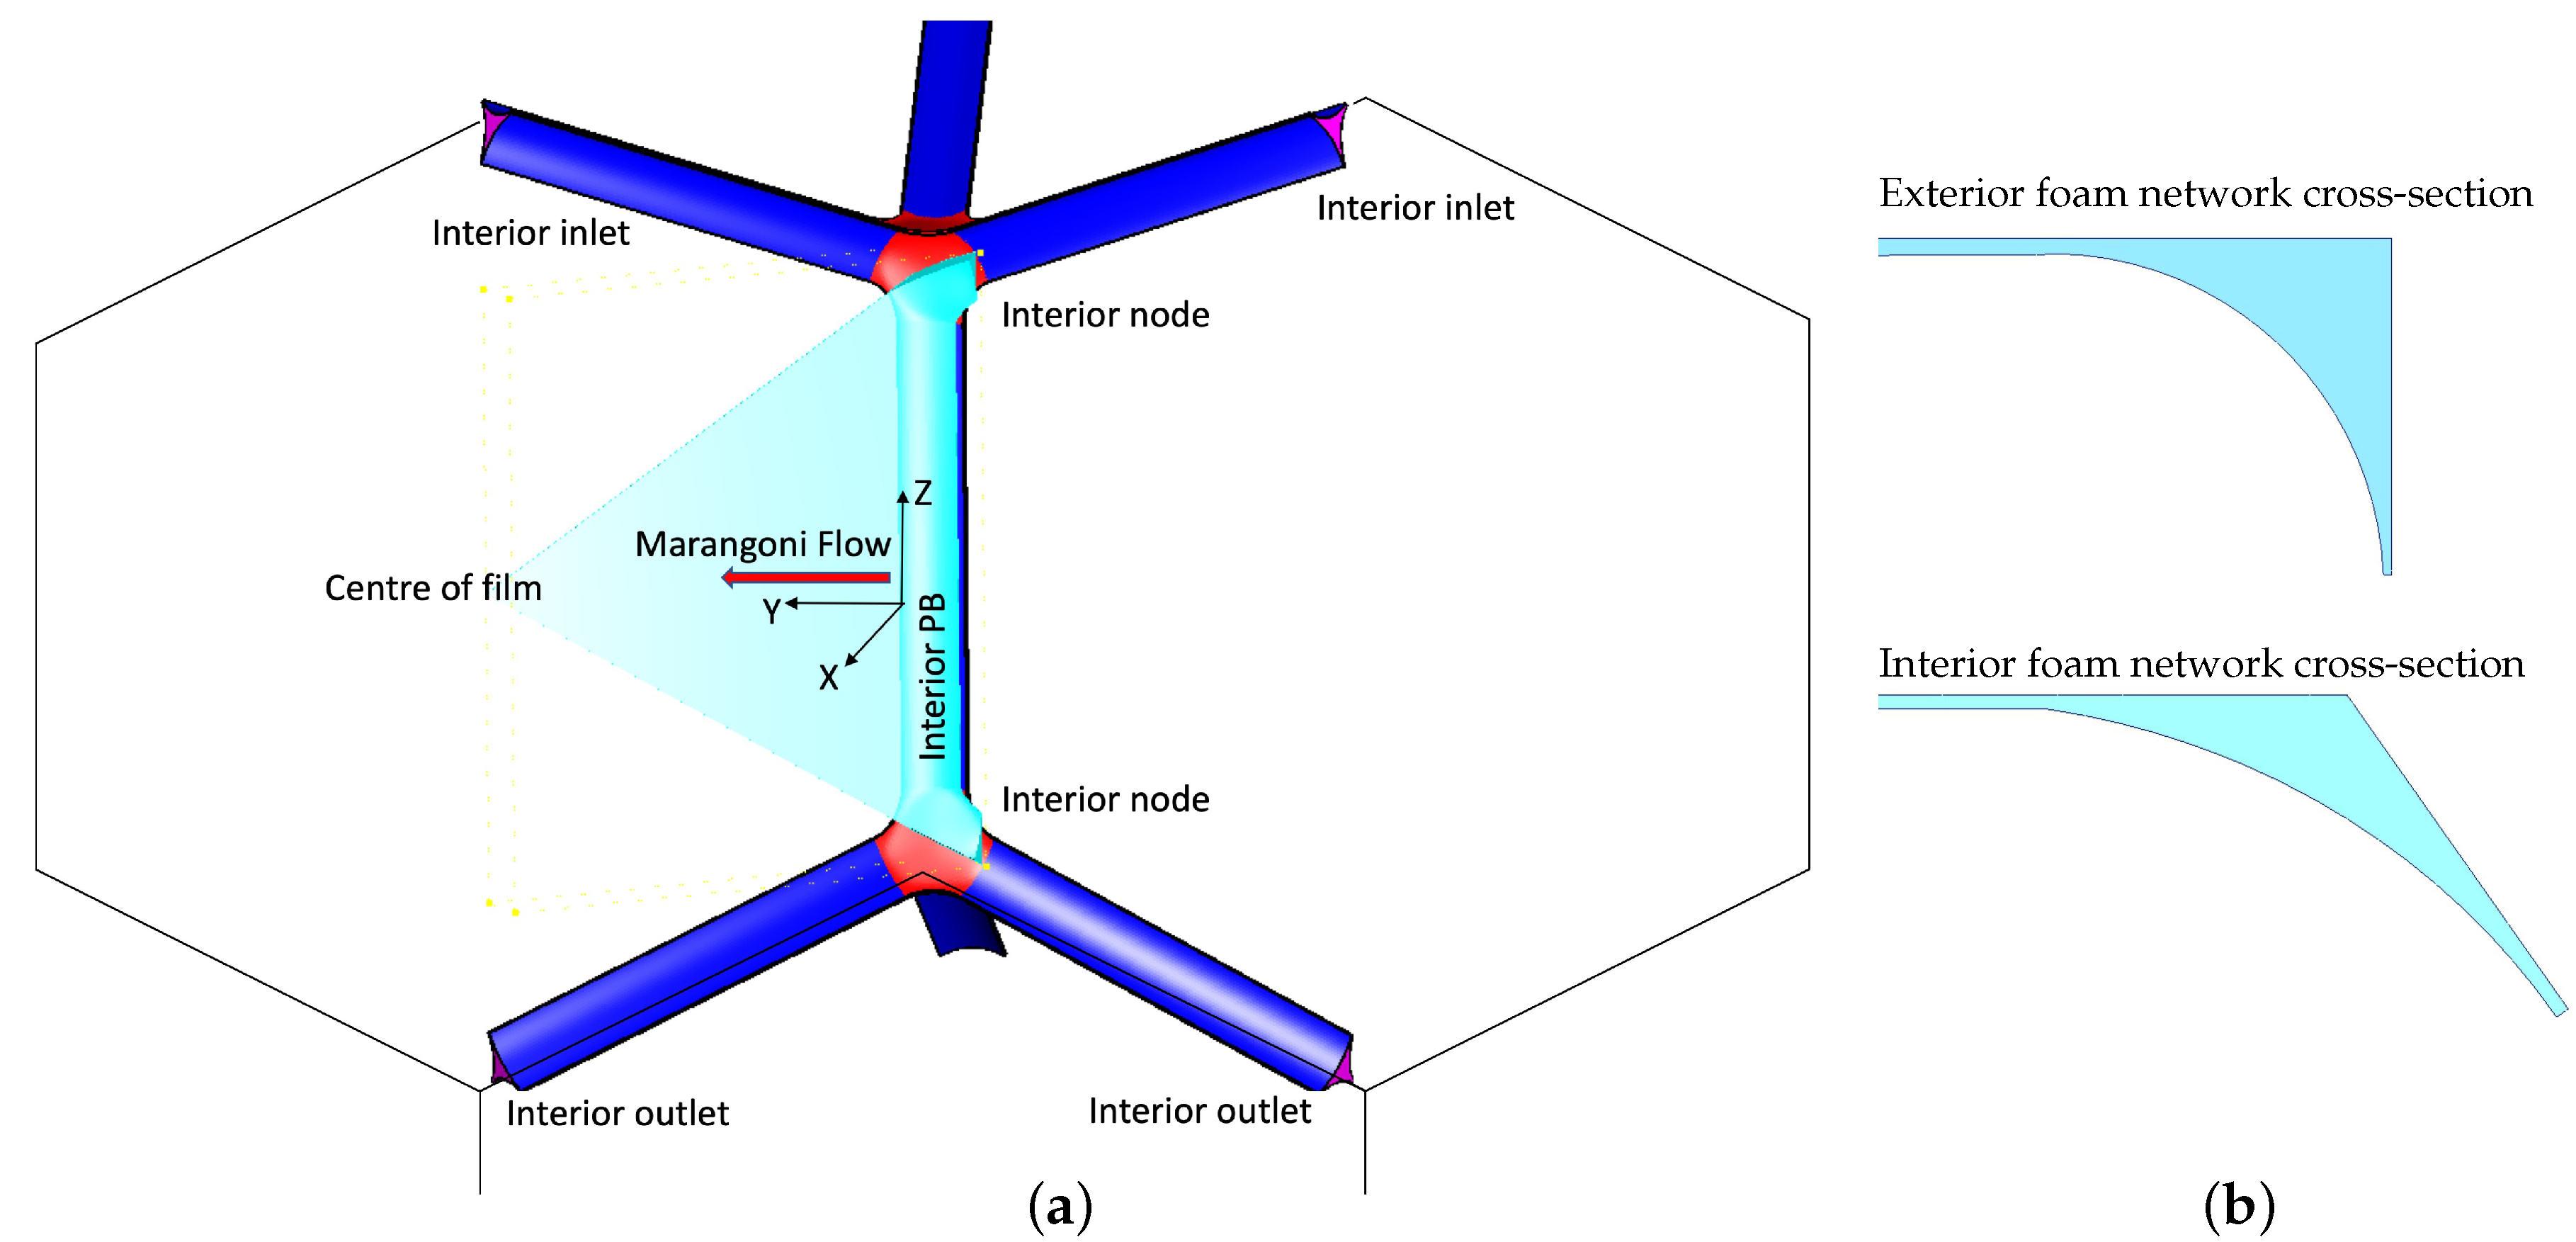
In this study, a three-dimensional geometry of a dry micro-scale foam containing PBs, nodes, and films was utilized, following the approach presented by Rezaee et al. [
22]. The simulations were based on volume-approached models that were applied to the interior and exterior of the micro-foam geometry. Interior foams were formed in the interstitial region between the three neighbouring bubbles, while exterior foams were formed in the region between the two neighbouring bubbles and a rigid container wall. The conjunction with the exterior wall led to a change in the geometry of the exterior foams. The difference in the cross-sectional between the interior and exterior foam networks is illustrated in
Figure 1b.
The geometries were based on the tetrakaidecahedral shape of the bubbles, assuming a sixfold symmetry. This was depicted in
Figure 1a, where the symmetry areas of the geometries were represented by the sky-blue-coloured regions. Furthermore, the direction of the Marangoni flow was indicated by the arrow from the PB to the centre of the film.
In this study, the film width (including PB width) was set to
μm, the transverse radius of curvature was set to
μm, and the film thickness was set to
μm. The list of above values are listed in
Table 1. It is worth noting that this study assumed no film drainage and fixed thickness of the film. As a result, the velocity of the film surface was solely determined by the interfacial mobility, Bo, and the Marangoni flow.
The modelling methods employed in this study were based on the Eulerian frame of reference and utilized a cell-centred finite volume approach for discretizing the governing equations. The exterior and interior geometries were constructed using GAMBIT software and subsequently imported into AVL FIRE 2017.0 commercial software. The interior geometry was composed of 99 k cells, while the exterior geometry consisted of 75 k cells.
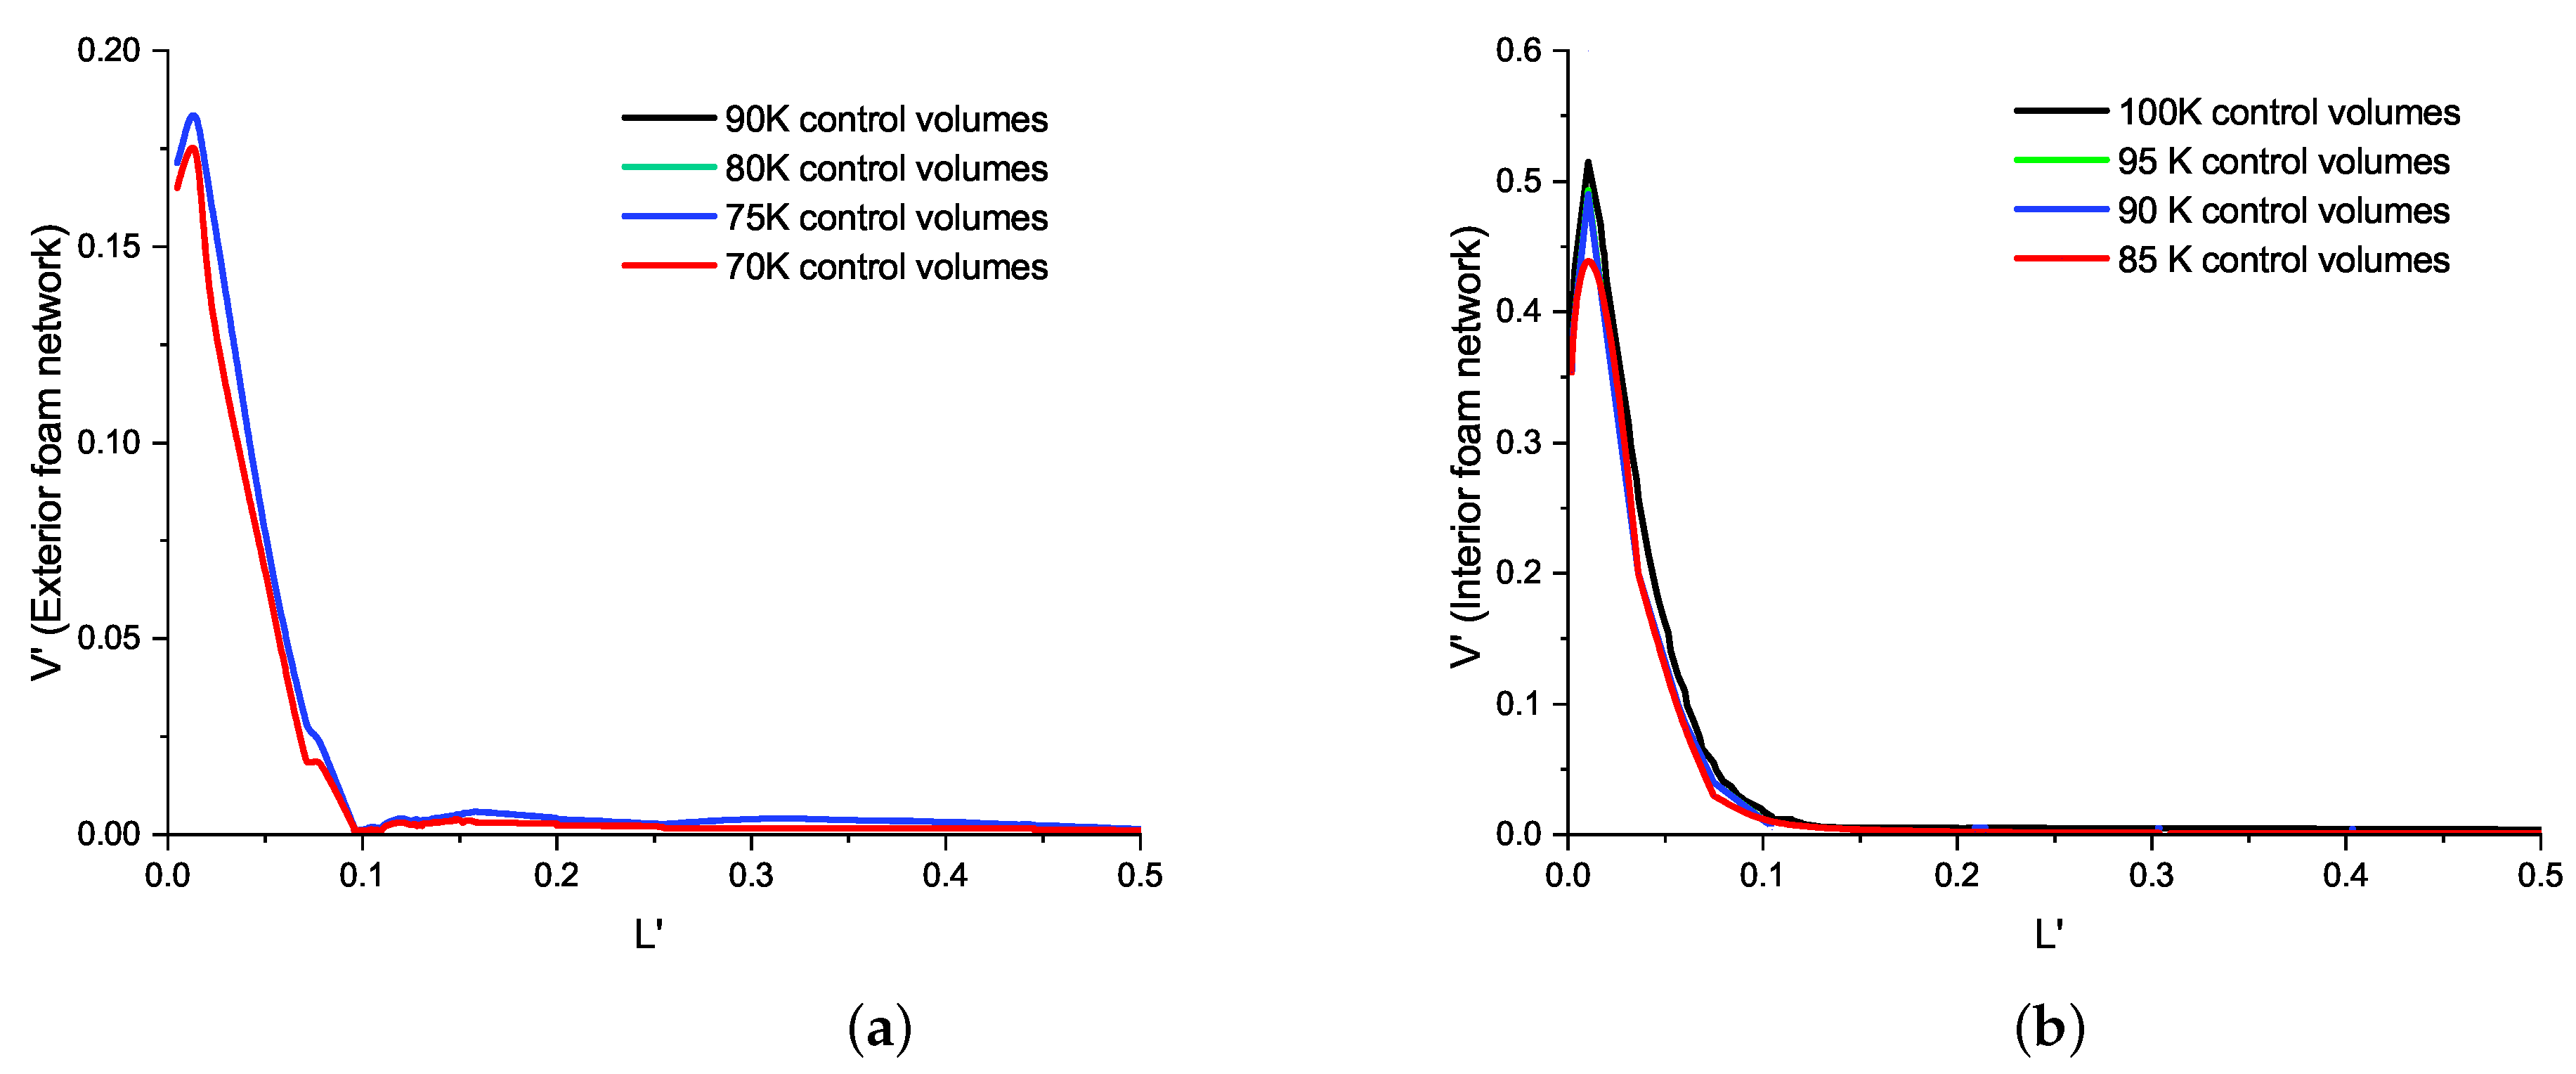
To ensure the grid independence of the simulations, the scaled velocity profiles were carefully analysed for different grid densities (see
Figure A2). The comparison of velocities across these various grid densities revealed that there were no significant differences observed between the results obtained using 75 k and 90 k grids for the exterior network. Likewise, no variations were observed for grid densities of 95 k and higher for the interior network. These findings indicated that the flow behaviour within the foam network was independent of the grid densities, specifically for grids with densities of 75 k and higher in the exterior foam and 95 k and higher in the interior foam network.
3. Theoretical Model
The simulation of the flow was based on the time-dependent three-dimensional Navier–Stokes equations. To account for time-dependent effects, we consider a time-transient simulation. The governing equations of the system in the Euler frame were the conservation of mass, momentum, and passive scalar as follows:
Here, the fluid velocity vector was denoted by U, and the divergence operator was represented by .
The momentum conservation equation:
where
p,
and
were the static pressure, bulk viscosity and the gravitational body force, respectively.
Furthermore, the surfactant concentration was governed by the passive scalar conservation law, describing the mass balance of the surfactant [
27,
28,
29,
30]:
Here, represented the surface surfactant concentration, was the velocity on the surface, and t denoted time. This equation stated that the temporal change in surfactant concentration was balanced by the divergence of the product of the concentration and the surface velocity. In the simulation, the central differencing scheme with second-order accuracy was used for both momentum and mass conservation.
Boundary Conditions
The boundary conditions applied to the geometry of our Marangoni flow model for foam fractionation in the lamellar film were as follows:
1. The fluid was assumed to be laminar, Newtonian, and incompressible. The flow was modelled as unsteady with a time-step of 0.001 s and 100 s of convergence criteria time per time-step to accurately simulate the dynamics of the system.
2. The sixfold symmetry was chosen for the flow across the net in the geometrical model, as shown in
Figure 1, to ensure a more realistic and precise representation of the foam fractionation process.
3. In this study, it was assumed that the surface concentration of the surfactant on the PB remained constant throughout the simulation. The interface between the liquid and air for the PB was modelled using the following equation:
where
was the surface viscosity. The normal and tangential coordinates of the air–liquid interface were represented by
n and
s, respectively.
4. The liquid–air interface equation coupled with Marangoni flow was used to model the behaviour of the film by using the following equation:
This equation represents the decoupling of the surface and bulk layers, allowing for separate consideration of their respective behaviours. Therefore, the Bo number plays a critical role in determining the flow behaviour at the liquid–air interface, which was defined as
[
22].
The third term in the equation was defined as the Marangoni stress:
where
represents the tangential surface surfactant concentration gradient, and
was the Gibbs elasticity. Gibbs elasticity quantified the sensitivity of the surface tension to changes in surfactant concentration [
12,
31]. Therefore, the equation of Marangoni stress demonstrated the relation between the Marangoni stress and the tangential surface surfactant concentration gradient.
5. The thickness of the film was assumed to be constant along its length [
32].
These boundary conditions were critical in accurately modelling and analysing the behaviour of the Marangoni flow in both the interior and exterior of the micro-foam and evaluating the effects of the surfactant concentration and interface mobility on the flow velocity in the film.
4. Results and Discussion
In this study, the behaviour of the flow from the PB to the film was investigated with greater accuracy by utilizing a three-dimensional model [
22]. Sodium Dodecyl Sulfate (SDS) was selected as the material for the initial simulations, with Bo = 0.5. The primary goal of this research was to explore the parameters that can affect the Marangoni flow during foam fractionation, with the ultimate aim of enhancing the model and developing a better understanding of foam fractionation in the reflux system.
The simulation parameters were based on previous studies [
7,
21,
33], as summarized in
Table 1. The Marangoni flow variation over time was examined for different initial conditions, such as varying initial ratio of surface surfactant concentration of PB to film. Additionally, the relation of Bo numbers and Marangoni flow for both interior and exterior geometries was investigated.
In this study on foam fractionation, the quantities required for calculations were scaled to their non-dimensional values (as presented in
Table 2). The length parameter of the film (Y) was scaled by the length of the film from the PB to the centre of the film. The normalised length was denoted by
. The velocities were scaled by
, where
represented the gravity force in the system, and
A and
represented the cross-section area and bulk viscosity. The scaled surfactant concentration was denoted by
, which was defined as
. The non-dimensional factor for time was
, where
L,
G and
were the half-length of the film, Gibbs number, and half-thickness of the film. The scaled time was presented as
.
4.1. Marangoni Velocity Evolution
The simulations conducted in this study were based on the assumption of a fixed film thickness, meaning that no film thinning occurs during the simulation. During the initial stages of the simulation, a notable surface concentration gradient appeared between the reflux material (PB) and the film, resulting in a higher surface surfactant concentration gradient. This concentration gradient acted as the driving force for the Marangoni flow, causing the surfactant to be transported towards the centre of the film over time. As a result, the detection of the Marangoni velocity became more prominent during these early stages, characterized by a significant surface tension gradient. On the other hand, the equilibrium value corresponded to a steady state condition where the surface surfactant concentration remained constant. Once the system reached this equilibrium state, the surfactant distribution and surface concentration stabilized, reflecting a balance between the Marangoni flow and other governing factors.
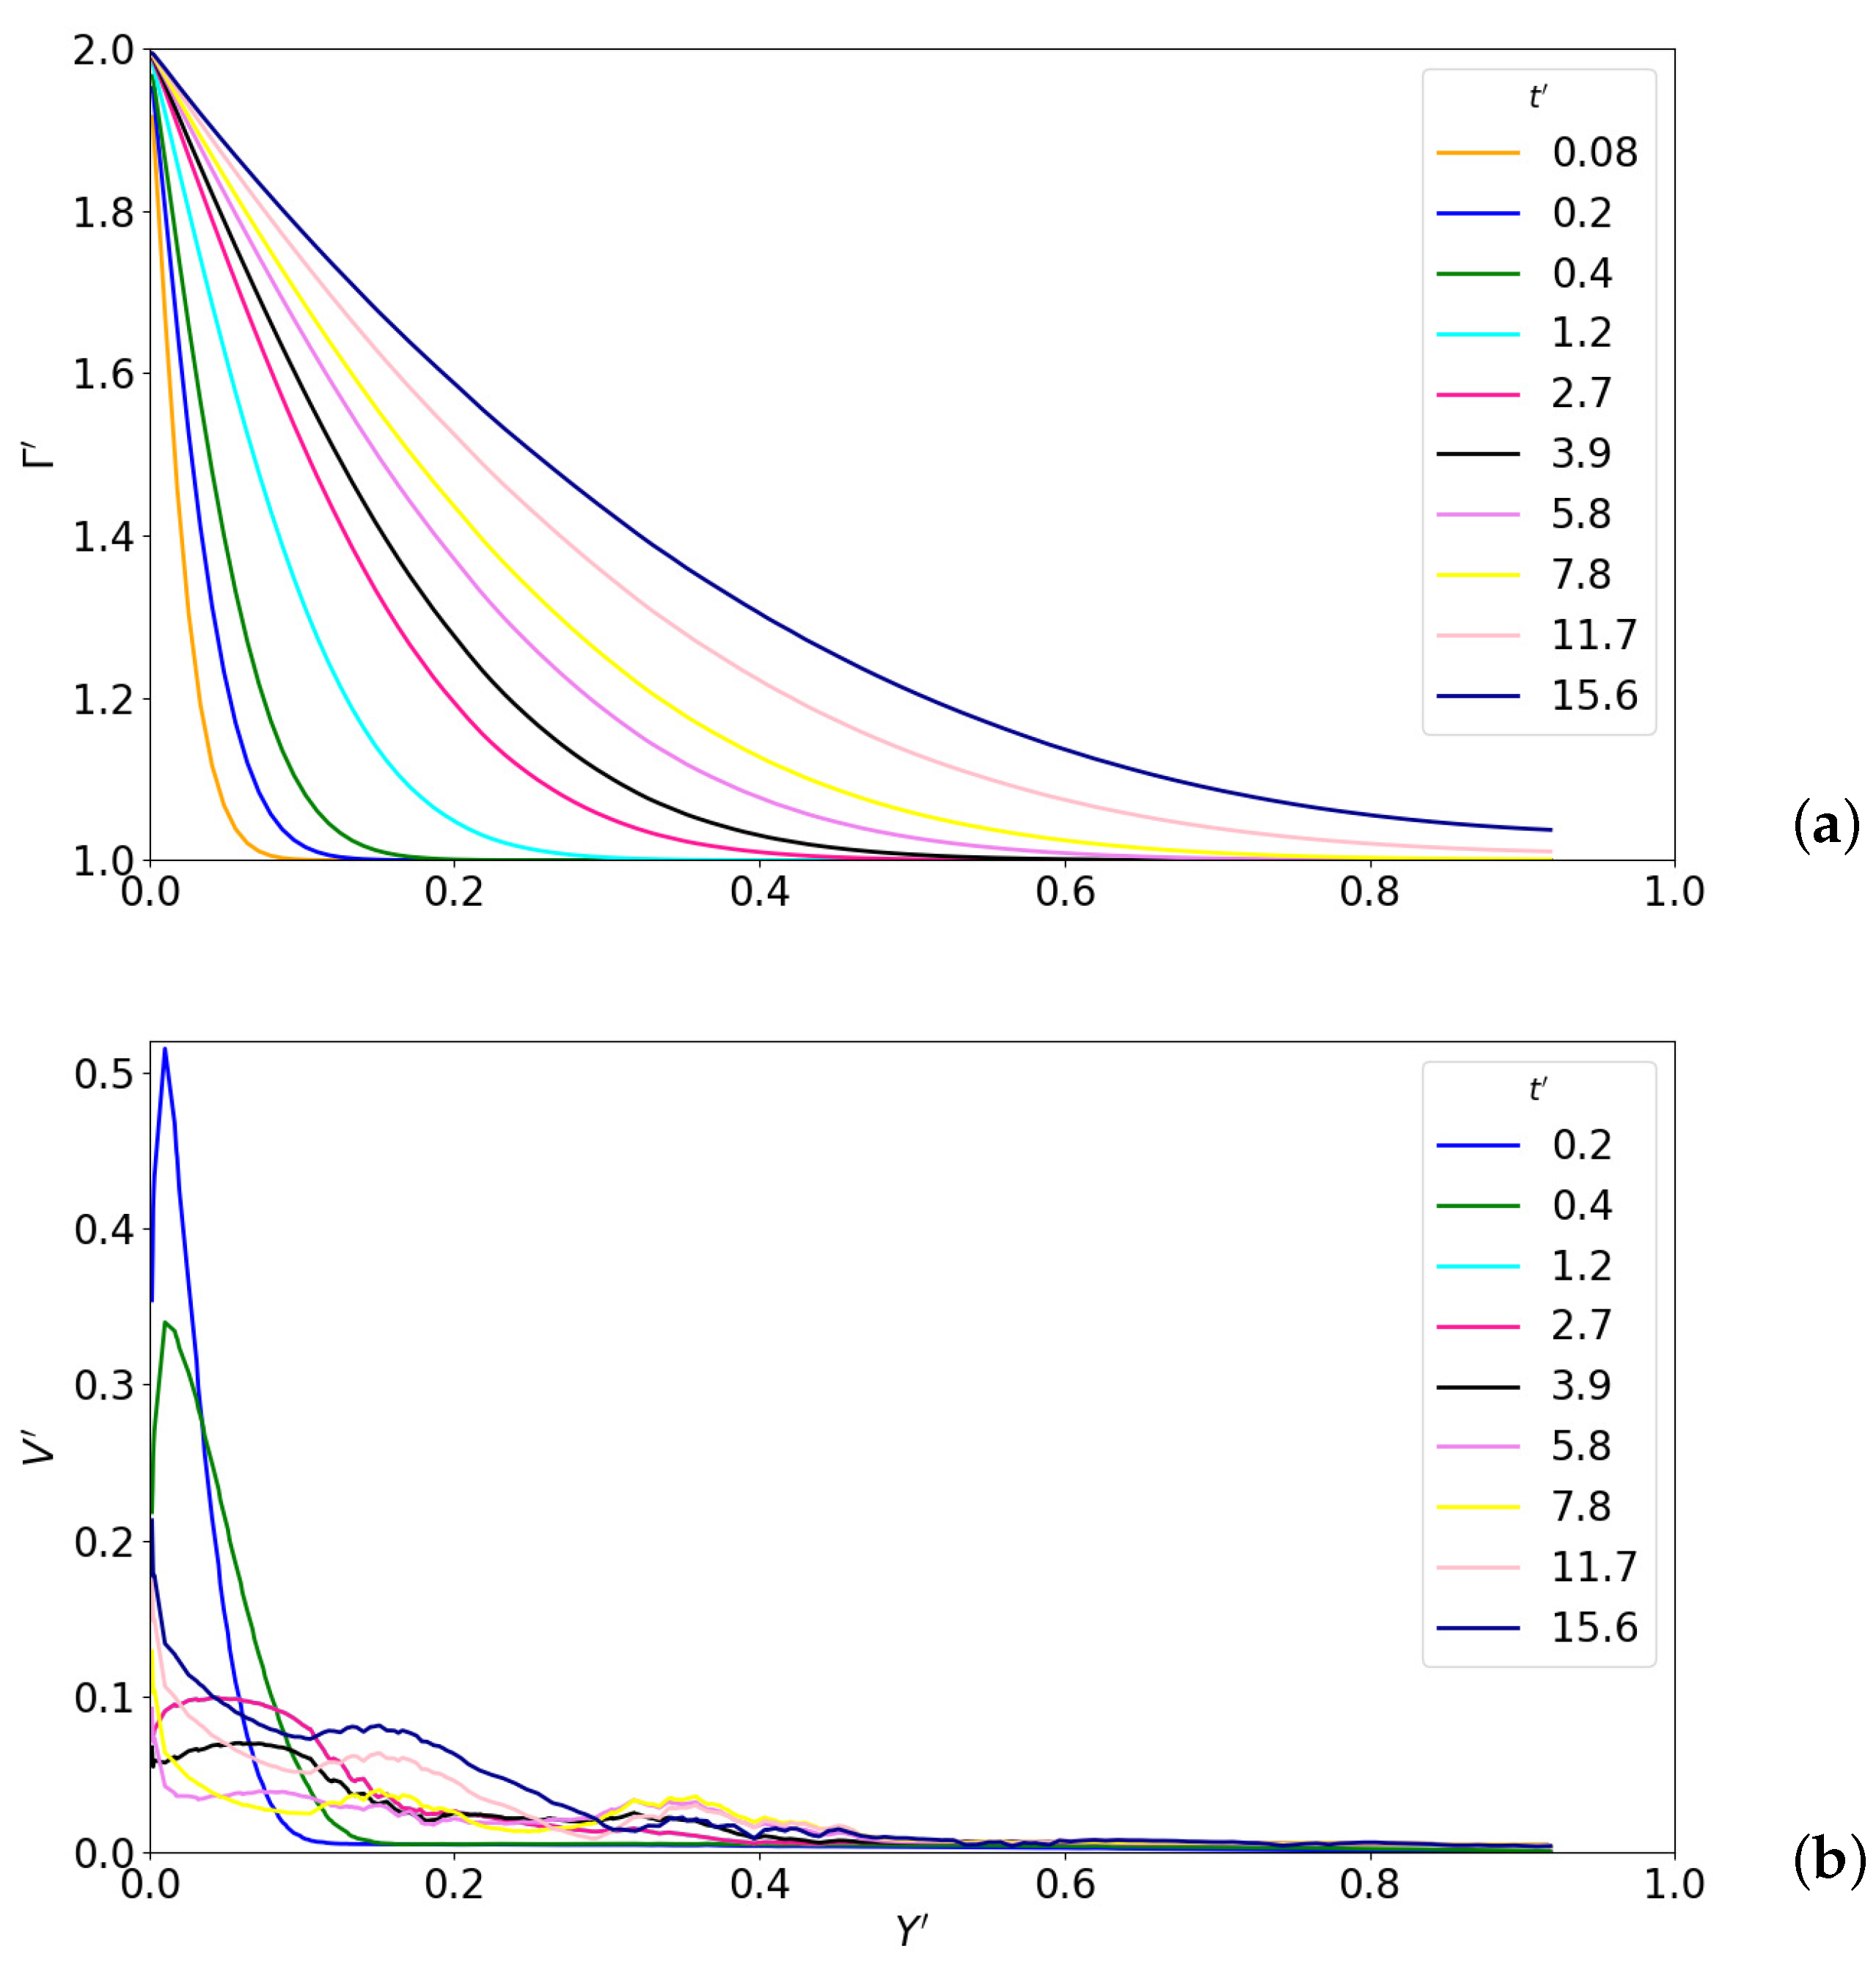
The evolution of both the surfactant surface concentration and Marangoni velocity was shown in
Figure 2. In
Figure 2a, the transformation of the surfactant from the PB to the centre of the film was shown during the early times.
In
Figure 2b, the Marangoni velocity was investigated over time. As shown, the maximum Marangoni velocity occurs at
= 0.2 for the location (
) near the PB. Over time, these velocity peaks shifted to a lower value of velocity and a higher value of
. Therefore, as time progressed, the velocity profile peaks dampened toward the centre of the film.
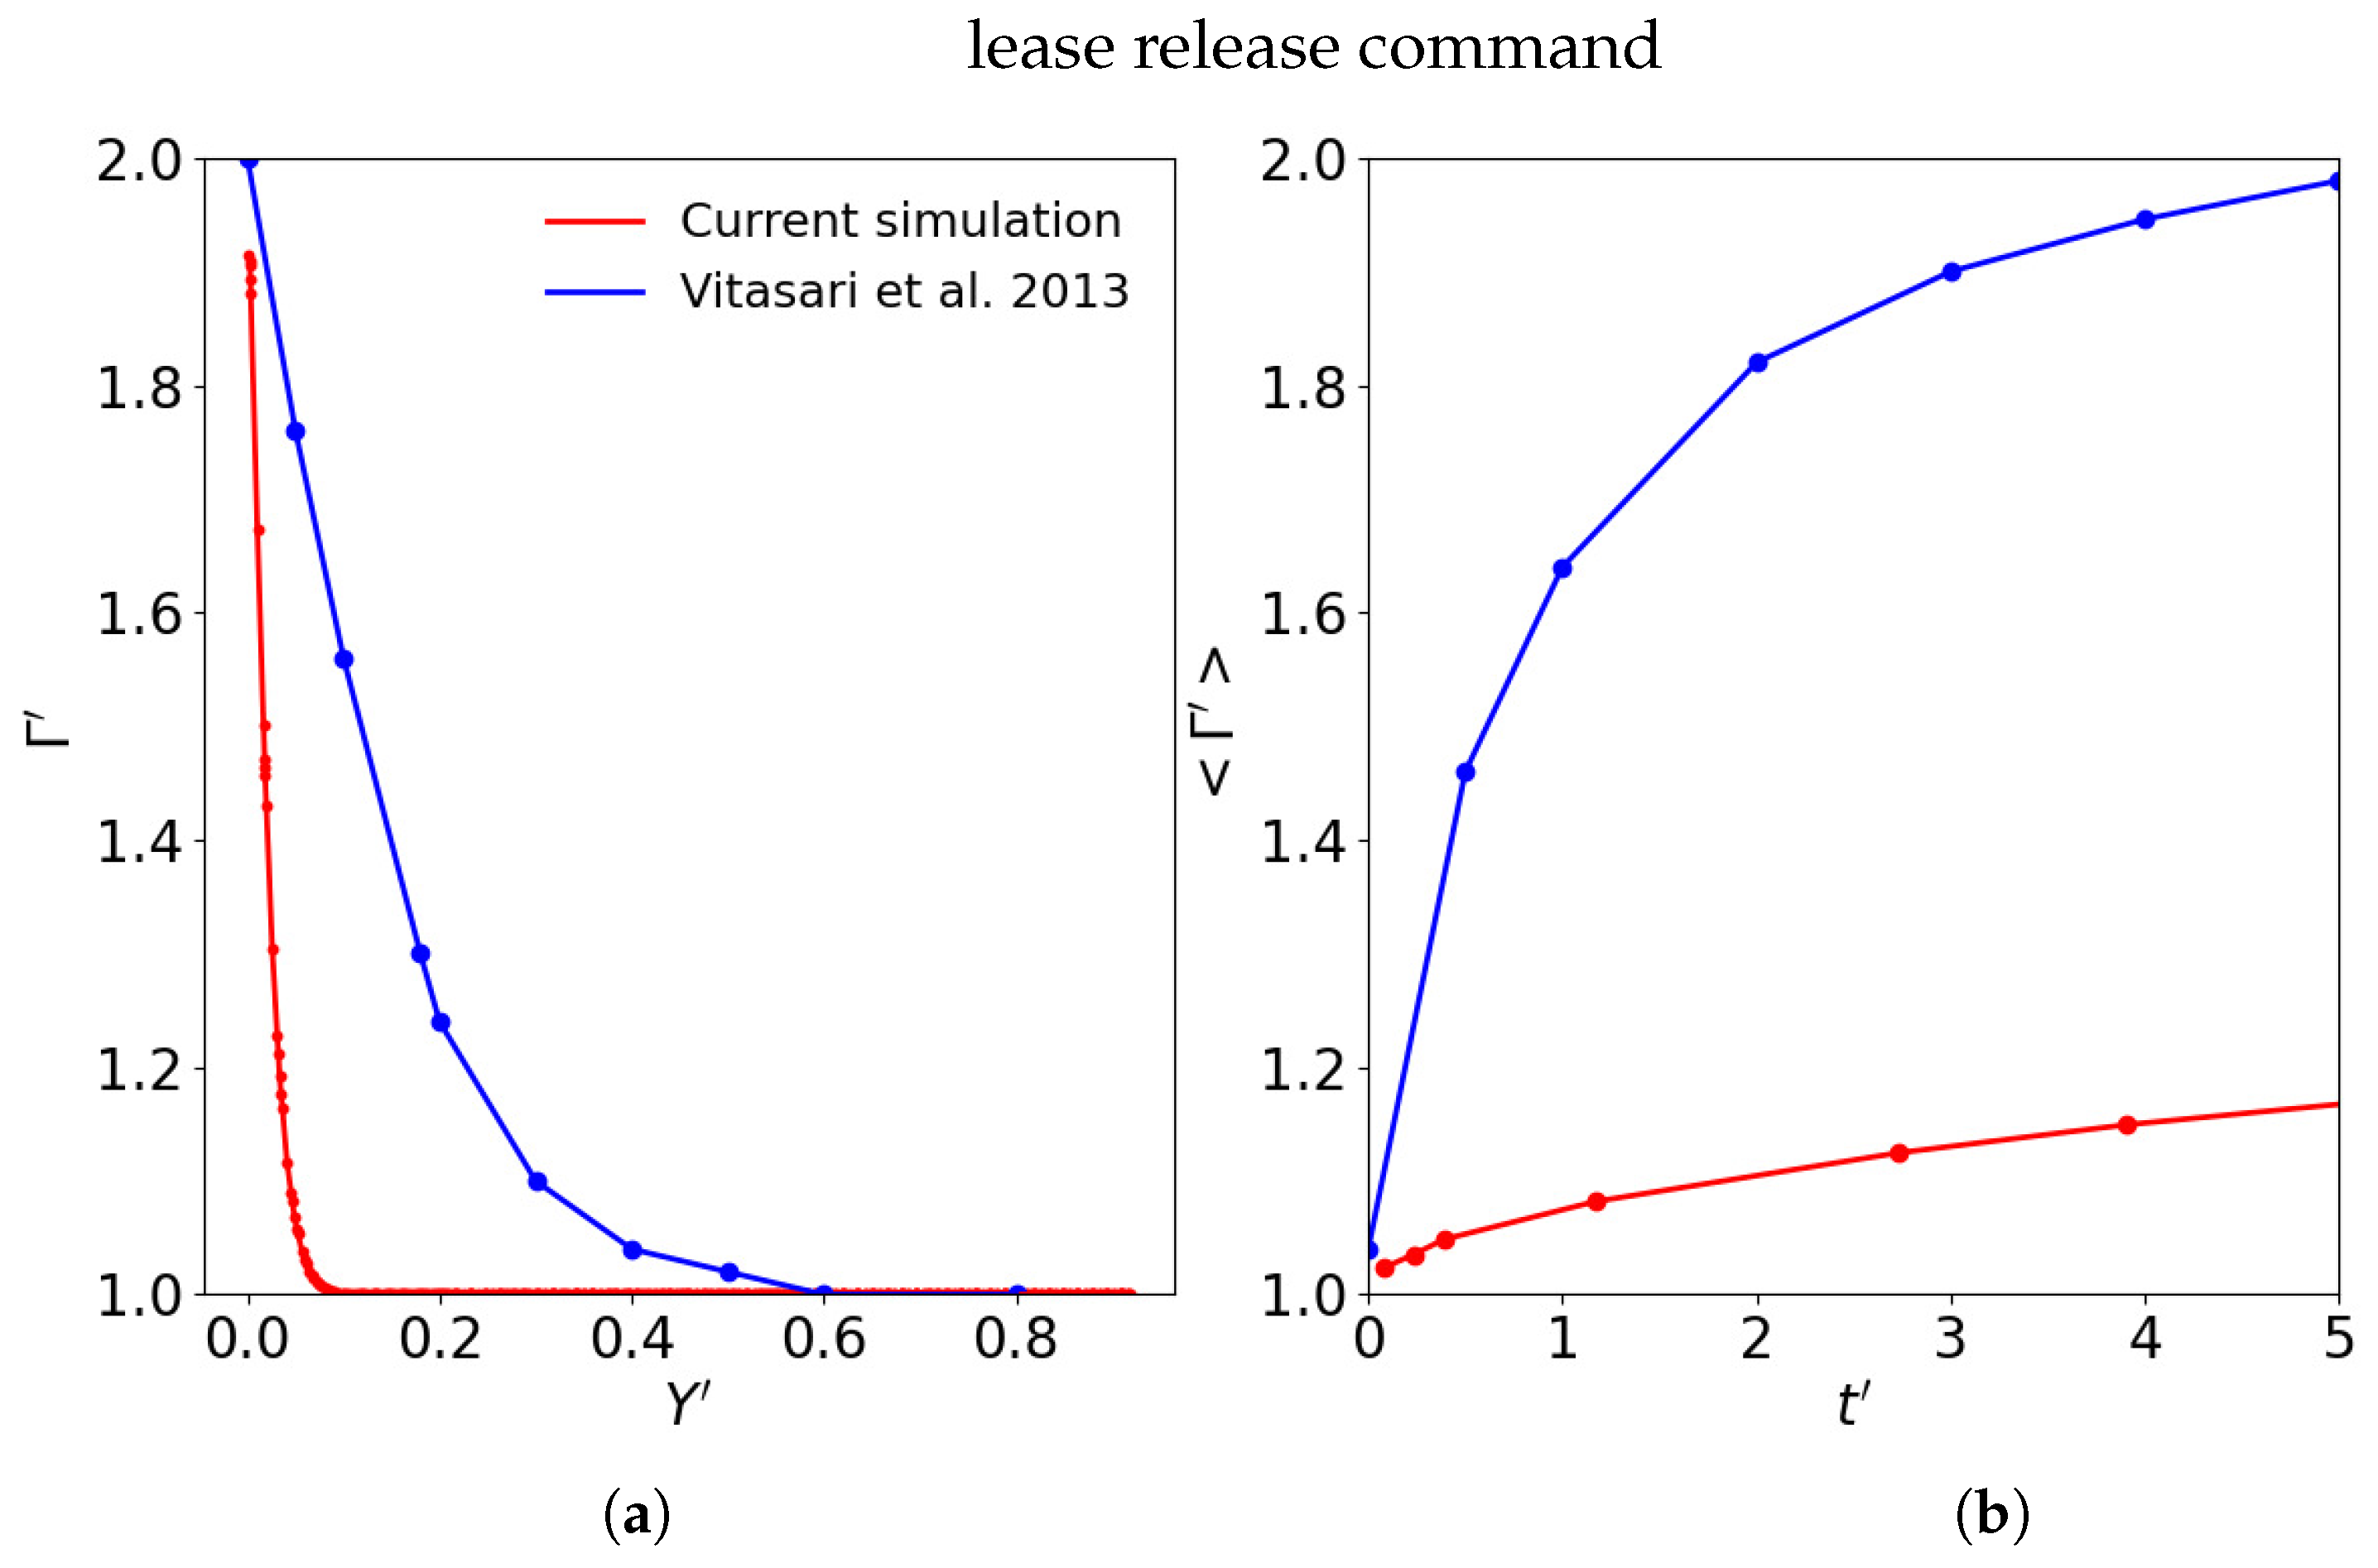
The time required for the system to reach equilibrium, denoted as , was defined as the time at which the surface surfactant concentration in the centre of the film reached the same value as the surfactant concentration in the PB, or when was equal to the surfactant concentration of the reflux column. In our simulation, considering a ratio of , the equilibrium was achieved after a time period of units.
Vitasari et al. [
7] analytically estimated the final equilibrium time to be
= 4.47 in dimensionless scale. However, it has been observed by Martin et al. [
24] that the actual equilibrium time (
) in foam fractionation experiments can vary from minutes to hours. The specific duration of
depends on factors such as the foam size, film thickness, and surfactant concentration in the reflux columns.
Therefore, Vitasari et al. [
7] found that in the absence of film thinning, the surfactant on the film surface reaches equilibrium relatively quickly. In our study, however, we have observed that our method requires a longer time to reach the equilibrium point (see
Figure A2). This observation was consistent with the experimental range introduced by Martin et al. [
24], indicating that our results align more closely with the experimental findings.
4.2. Influence of Reflux Column Surfactant Concentration on Marangoni Flow in Film
The role of the reflux column in the foam fractionation process was important as it facilitated the separation of materials from the liquid. In this method, a feeding source was utilized to inject a higher concentration of surfactant into the foam, leading to an increased surfactant concentration in the PBs [
34].
Due to the fast continuous feeding process, the PBs did not exhibit a surface tension gradient. However, there was a surface tension gradient between the reflux-enriched PBs and the films, which was dependent on the concentration of the surfactant in the PBs and the specifically chosen chemical surfactant [
35]. Therefore, the variation in the surfactant amount in the reflux column, represented by
, affected
and subsequently influenced the Marangoni flow. The mobility of the interface or the Bo number of the liquid also played a significant role in the Marangoni flow, as discussed in the following section.
In this study, the effect of various values of
was examined, encompassing a range from
to
mol·m
. These values were chosen to be lower than the maximum surface excess for SDS (
mol·m
) [
35]. It should be noted that surfactant diffusion was not considered in this study, resulting in the surfactant remaining localized at the interface rather than diffusing into the bulk of the film [
7,
36,
37].
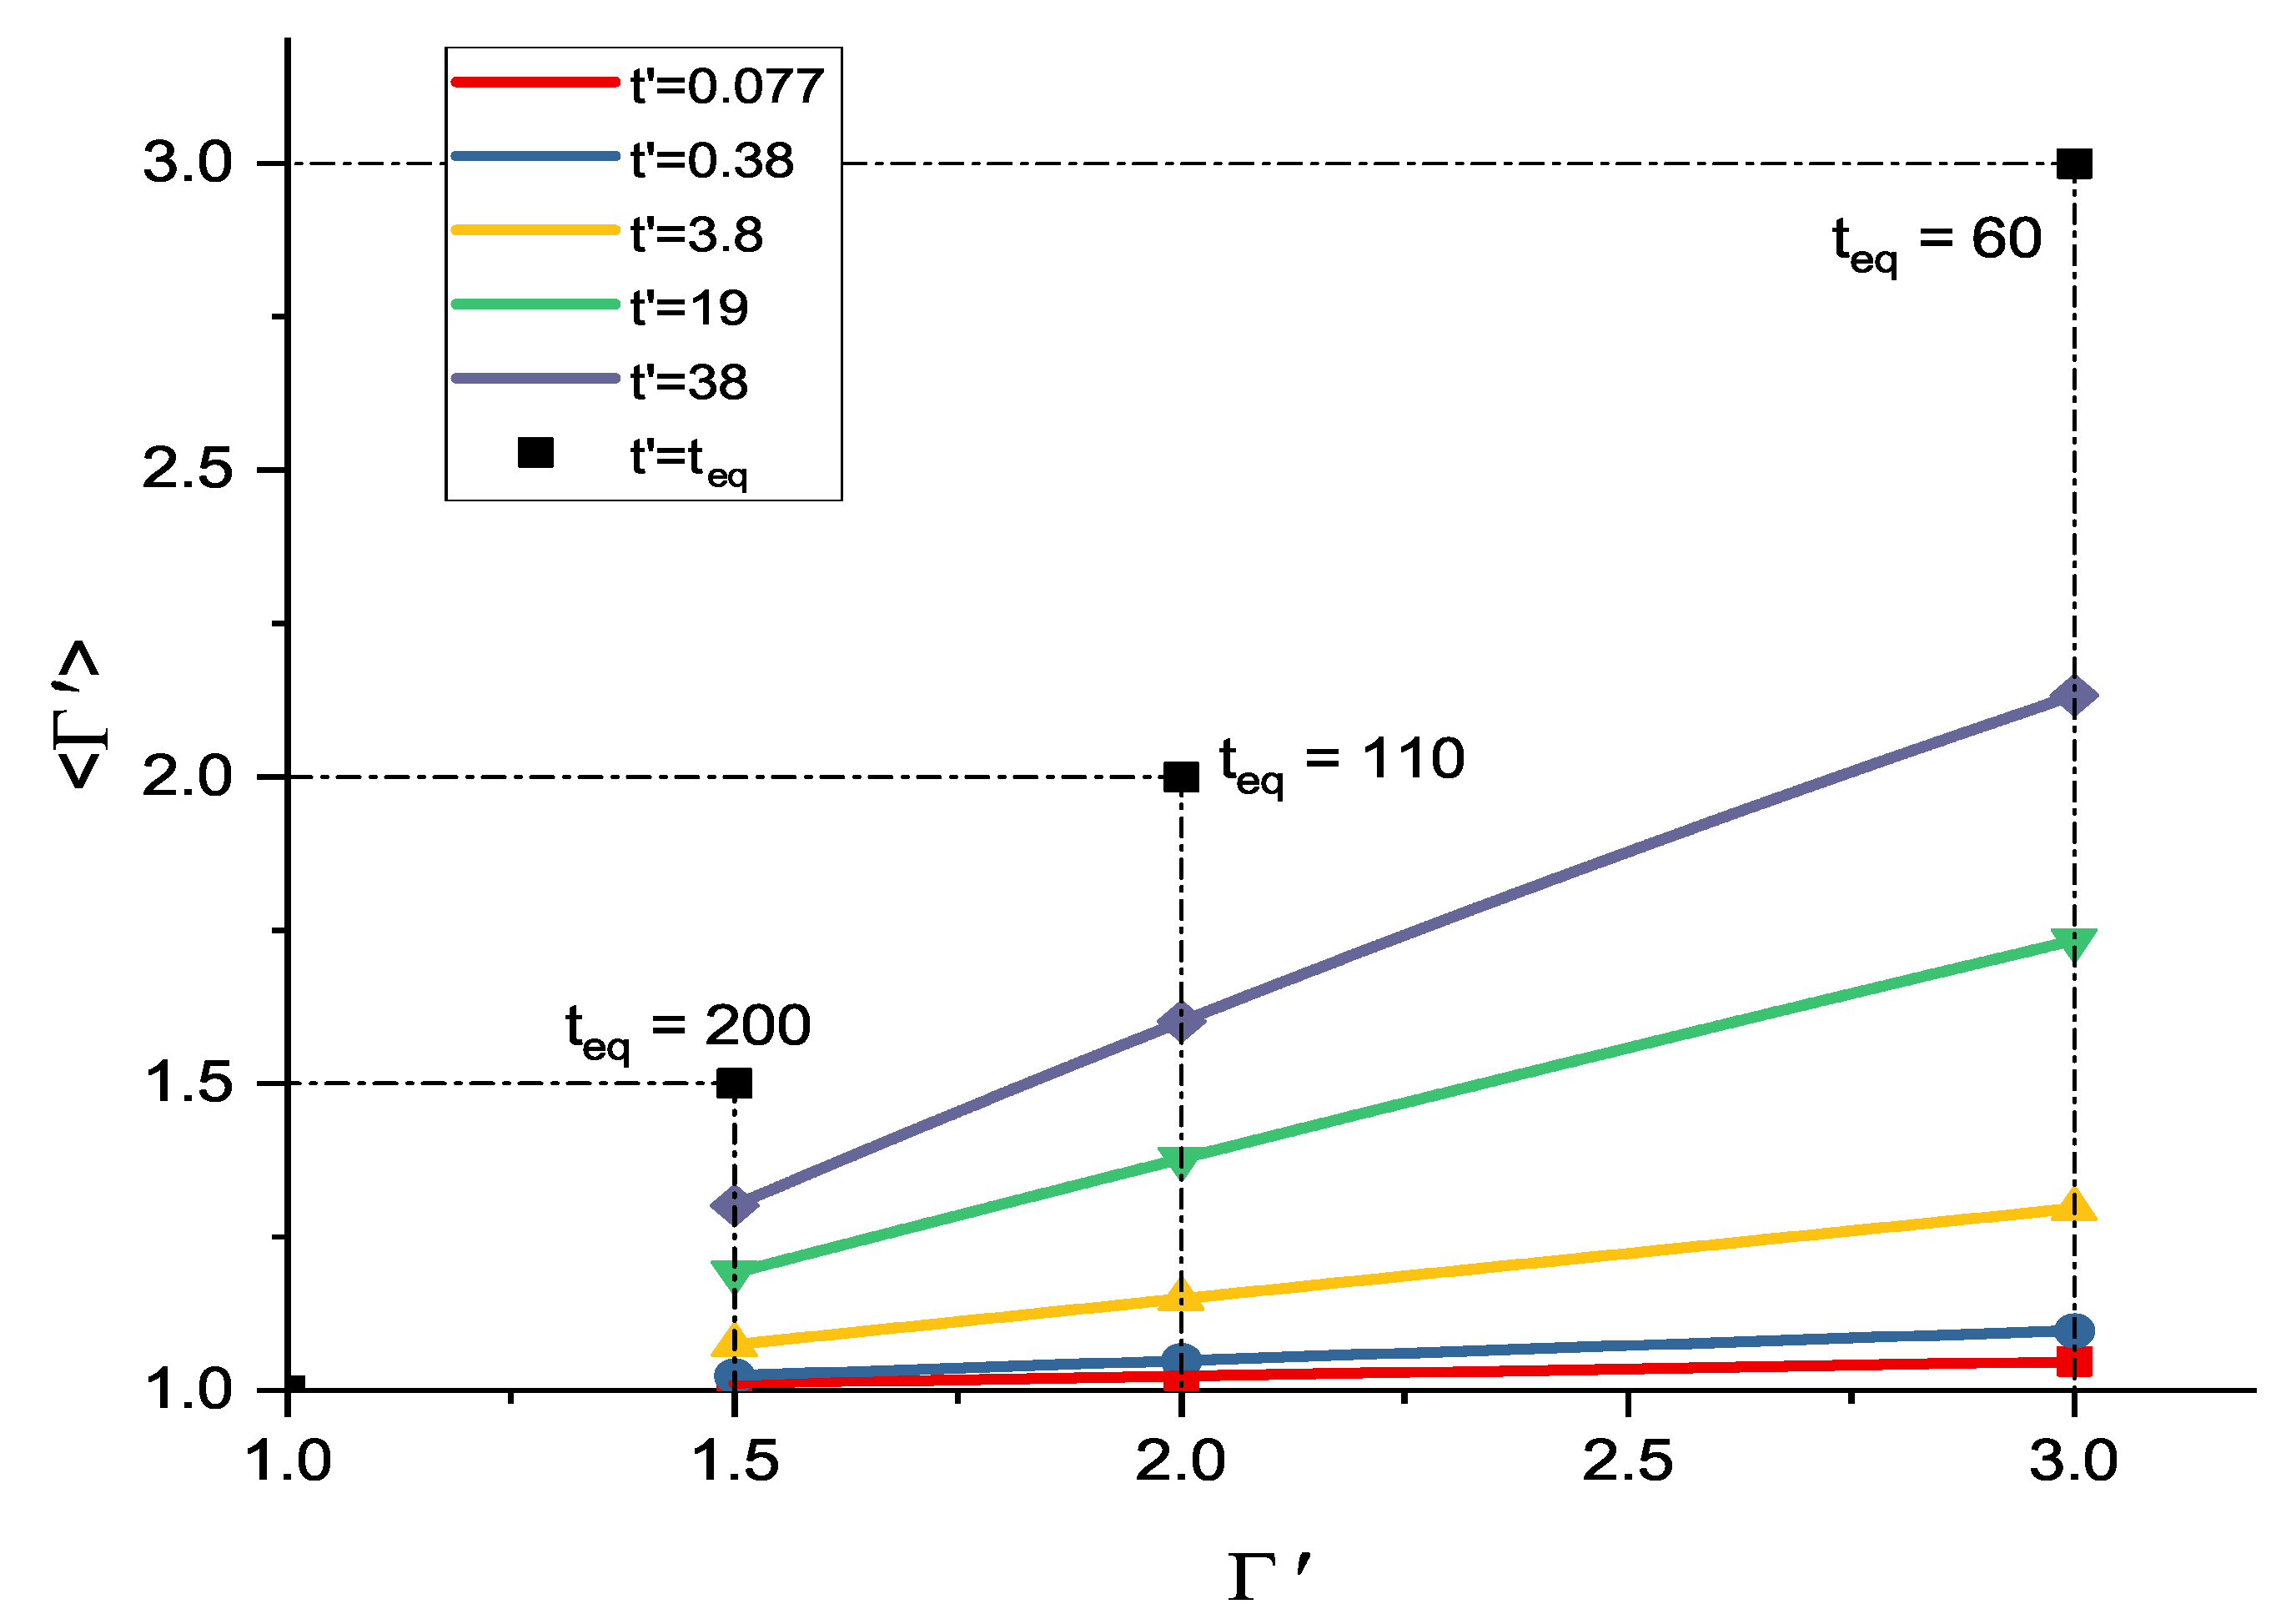
Figure 3 displayed the evolution of the surfactant concentration for the range of
. The average surfactant surface concentration
was observed to correspond to the different concentrations in the reflux column. It was evident that a higher amplitude of
resulted in a greater amount of surfactant excess being transported to the film, thereby inducing a higher Marangoni stress within the film. Furthermore, the relationship between
and the surfactant concentration in the reflux column was demonstrated in
Figure 3, revealing that a higher surfactant concentration was associated with a shorter equilibrium time.
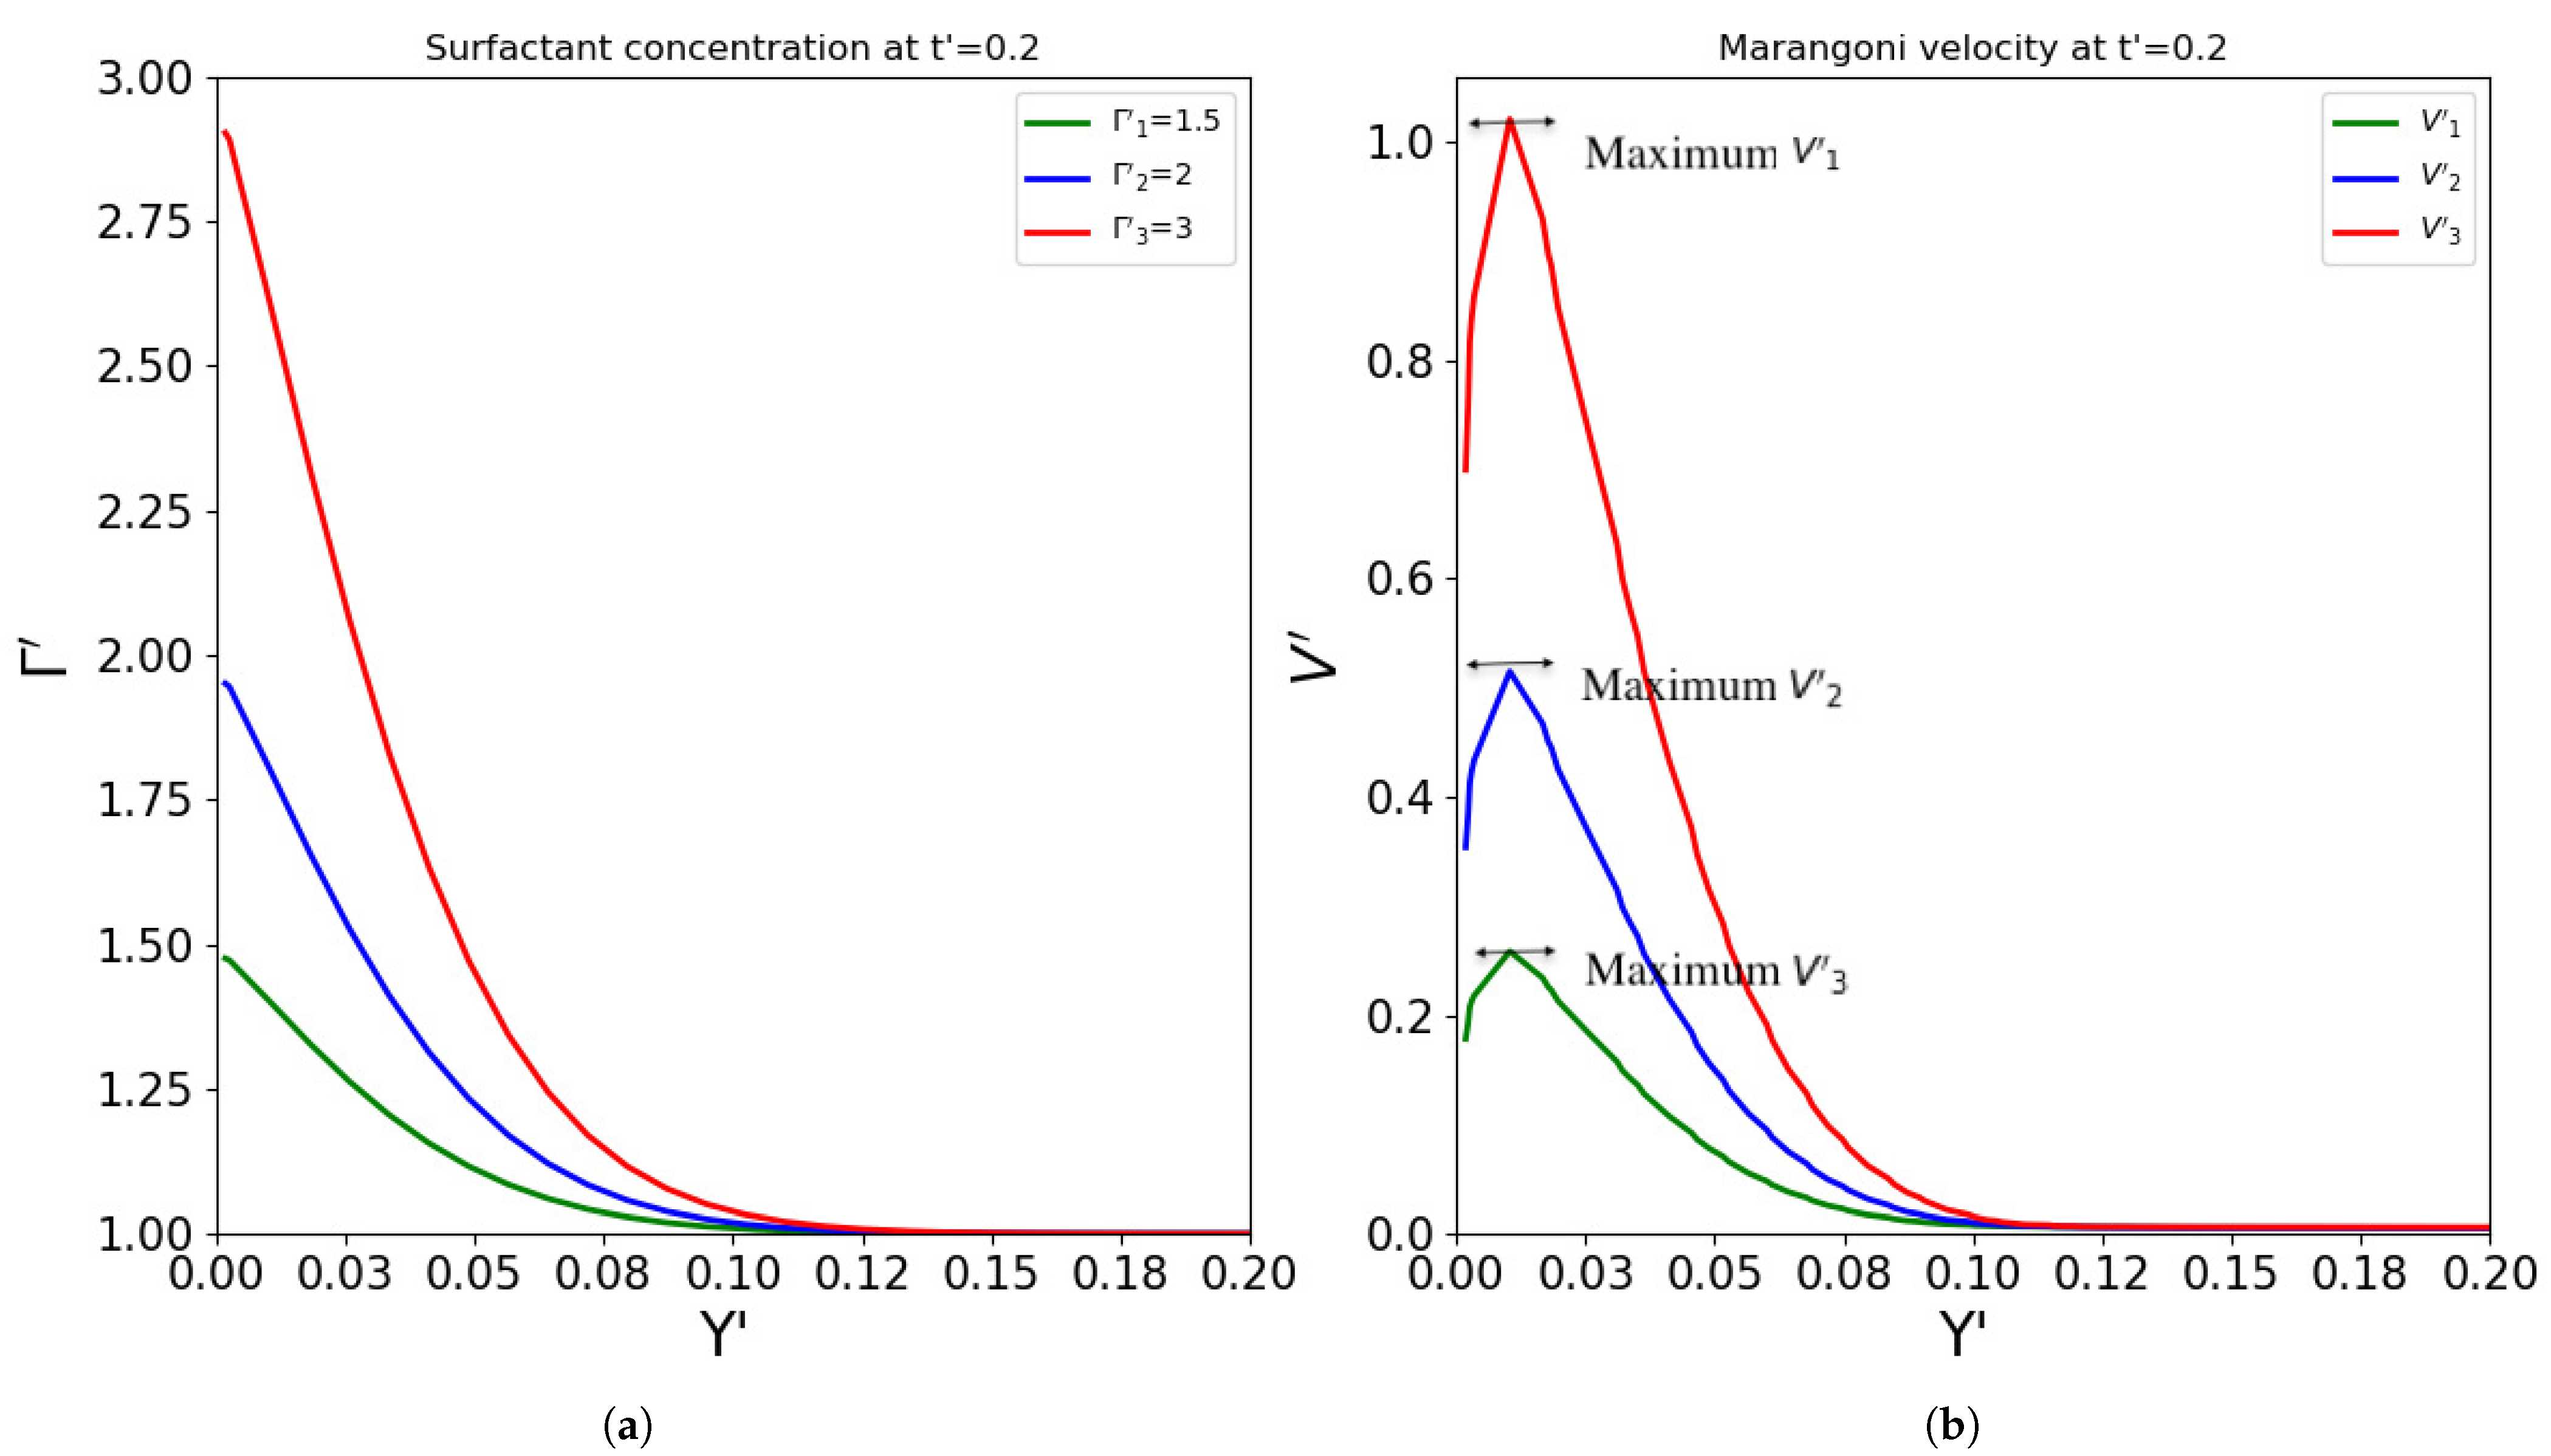
Comparing the maximum Marangoni velocities for different
enabled us to find a relation between
and
and, consequently, a better understanding of the reflux system and improvement of our foam fractionation model. Therefore, in
Figure 4, the maximum Marangoni velocities for
were compared. As observed, when
, the maximum Marangoni velocity
was 0.25 units, whereas the velocity value
for
was approximately 1 unit. Hence, it can be concluded that within the investigated range of
, the Marangoni velocity exhibited a significant dependence on the value of
.
4.3. Marangoni Flow in the Interior and Exterior Films
An interior PB was defined as an interstitial region located between two neighbouring bubbles, whereas an exterior PB was defined as the region situated between a bubble surface and a no-slip flat container wall. Consequently, an exterior film with a thickness encompassed two sides, with one side being in rigid contact with the wall, while the other side represented the liquid–gas interface. It is important to note that there were two distinct types of interior films: one situated between two PBs that were perpendicular to an exterior PB, and the second type existed between PBs that did not branch from the exterior PBs. In this paper, the latter type of interior film was studied and compared with the exterior film.
Distinct differences in flow behaviours between the interior and exterior foams were observed due to the intrinsic differences between the exterior and interior foam geometries, which introduced varying boundary conditions. Specifically, the zero-velocity boundary condition was applied at the intersection of the PB and film with the container wall, creating a region of zero velocity. These differences in boundary conditions contributed to the distinct flow behaviours observed in the interior and exterior regions of the foam.
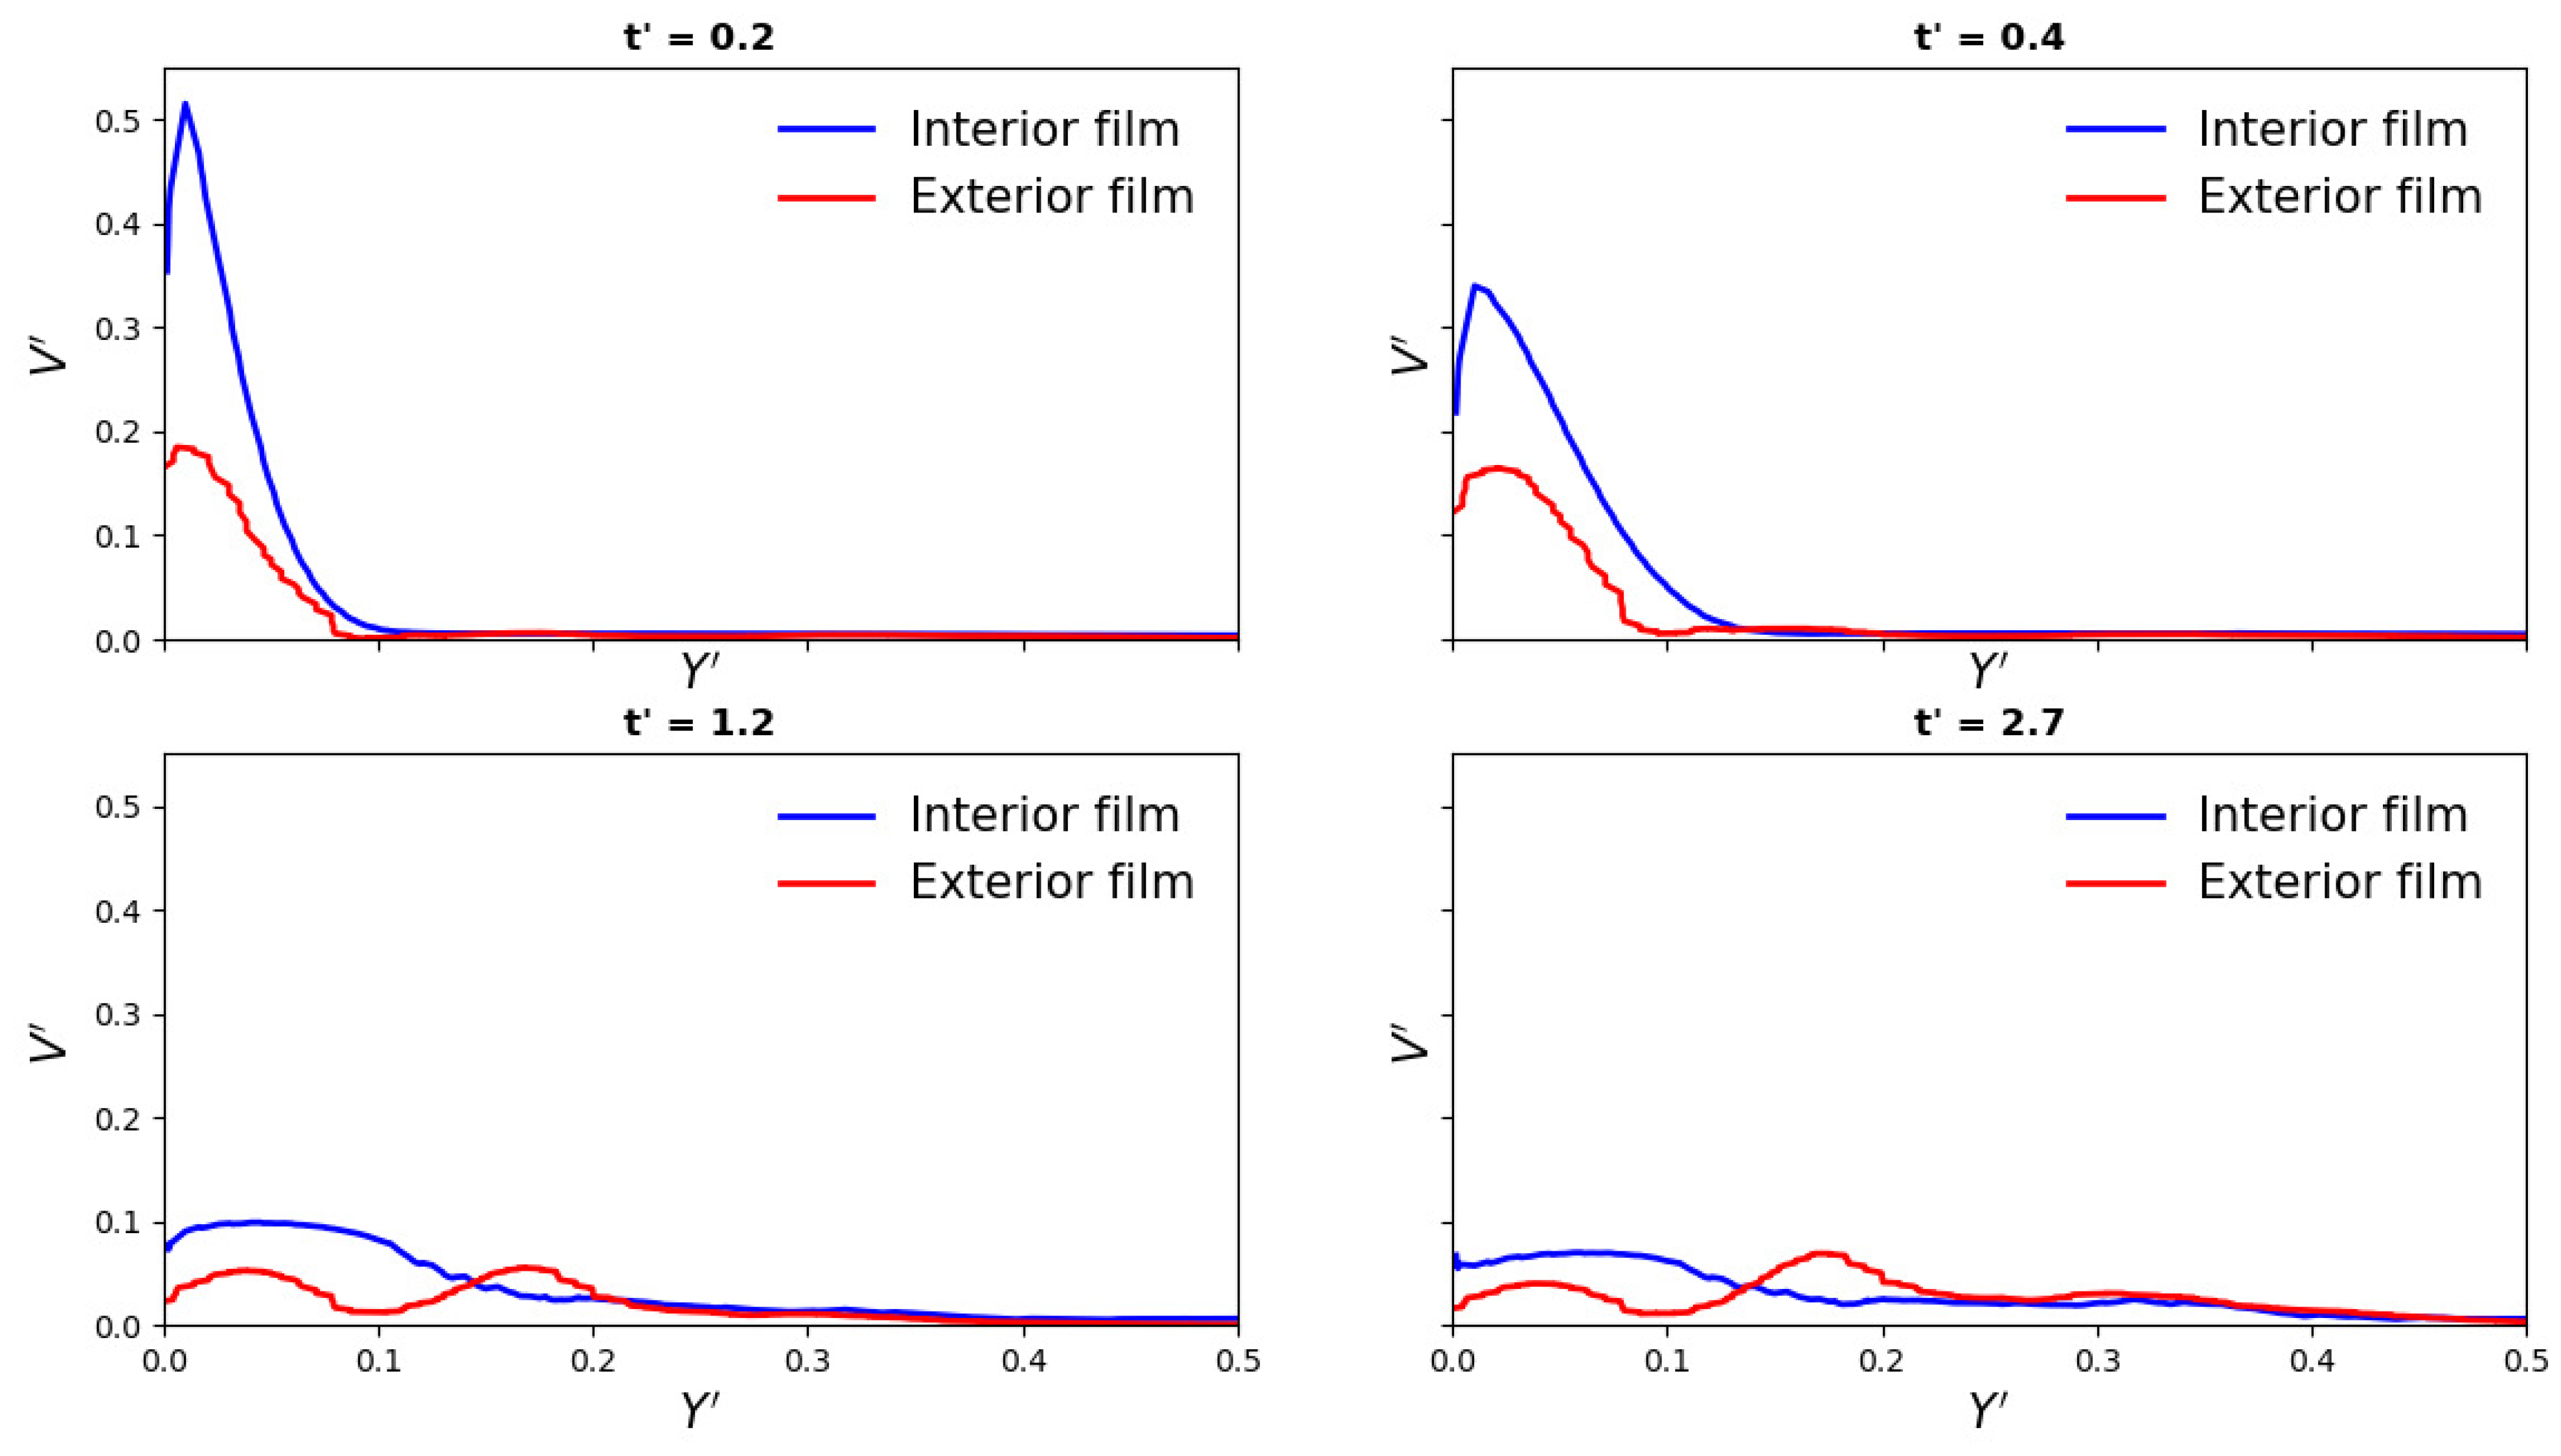
The behaviour of the Marangoni flow in the interior and exterior films was compared in
Figure 5 at different times. As shown, the difference was more evident at
and
, where the maximum velocity in the interior film was measured about three times more than in the exterior film. Over time, the Marangoni flow showed a different behaviour in the exterior film. While the maximum velocity occurred at the beginning of the velocity profile (as a first peak) in the interior film, this trend in the exterior film occurred as a second peak of the velocity profile during later times at
and afterwards (shown in
Figure 5).
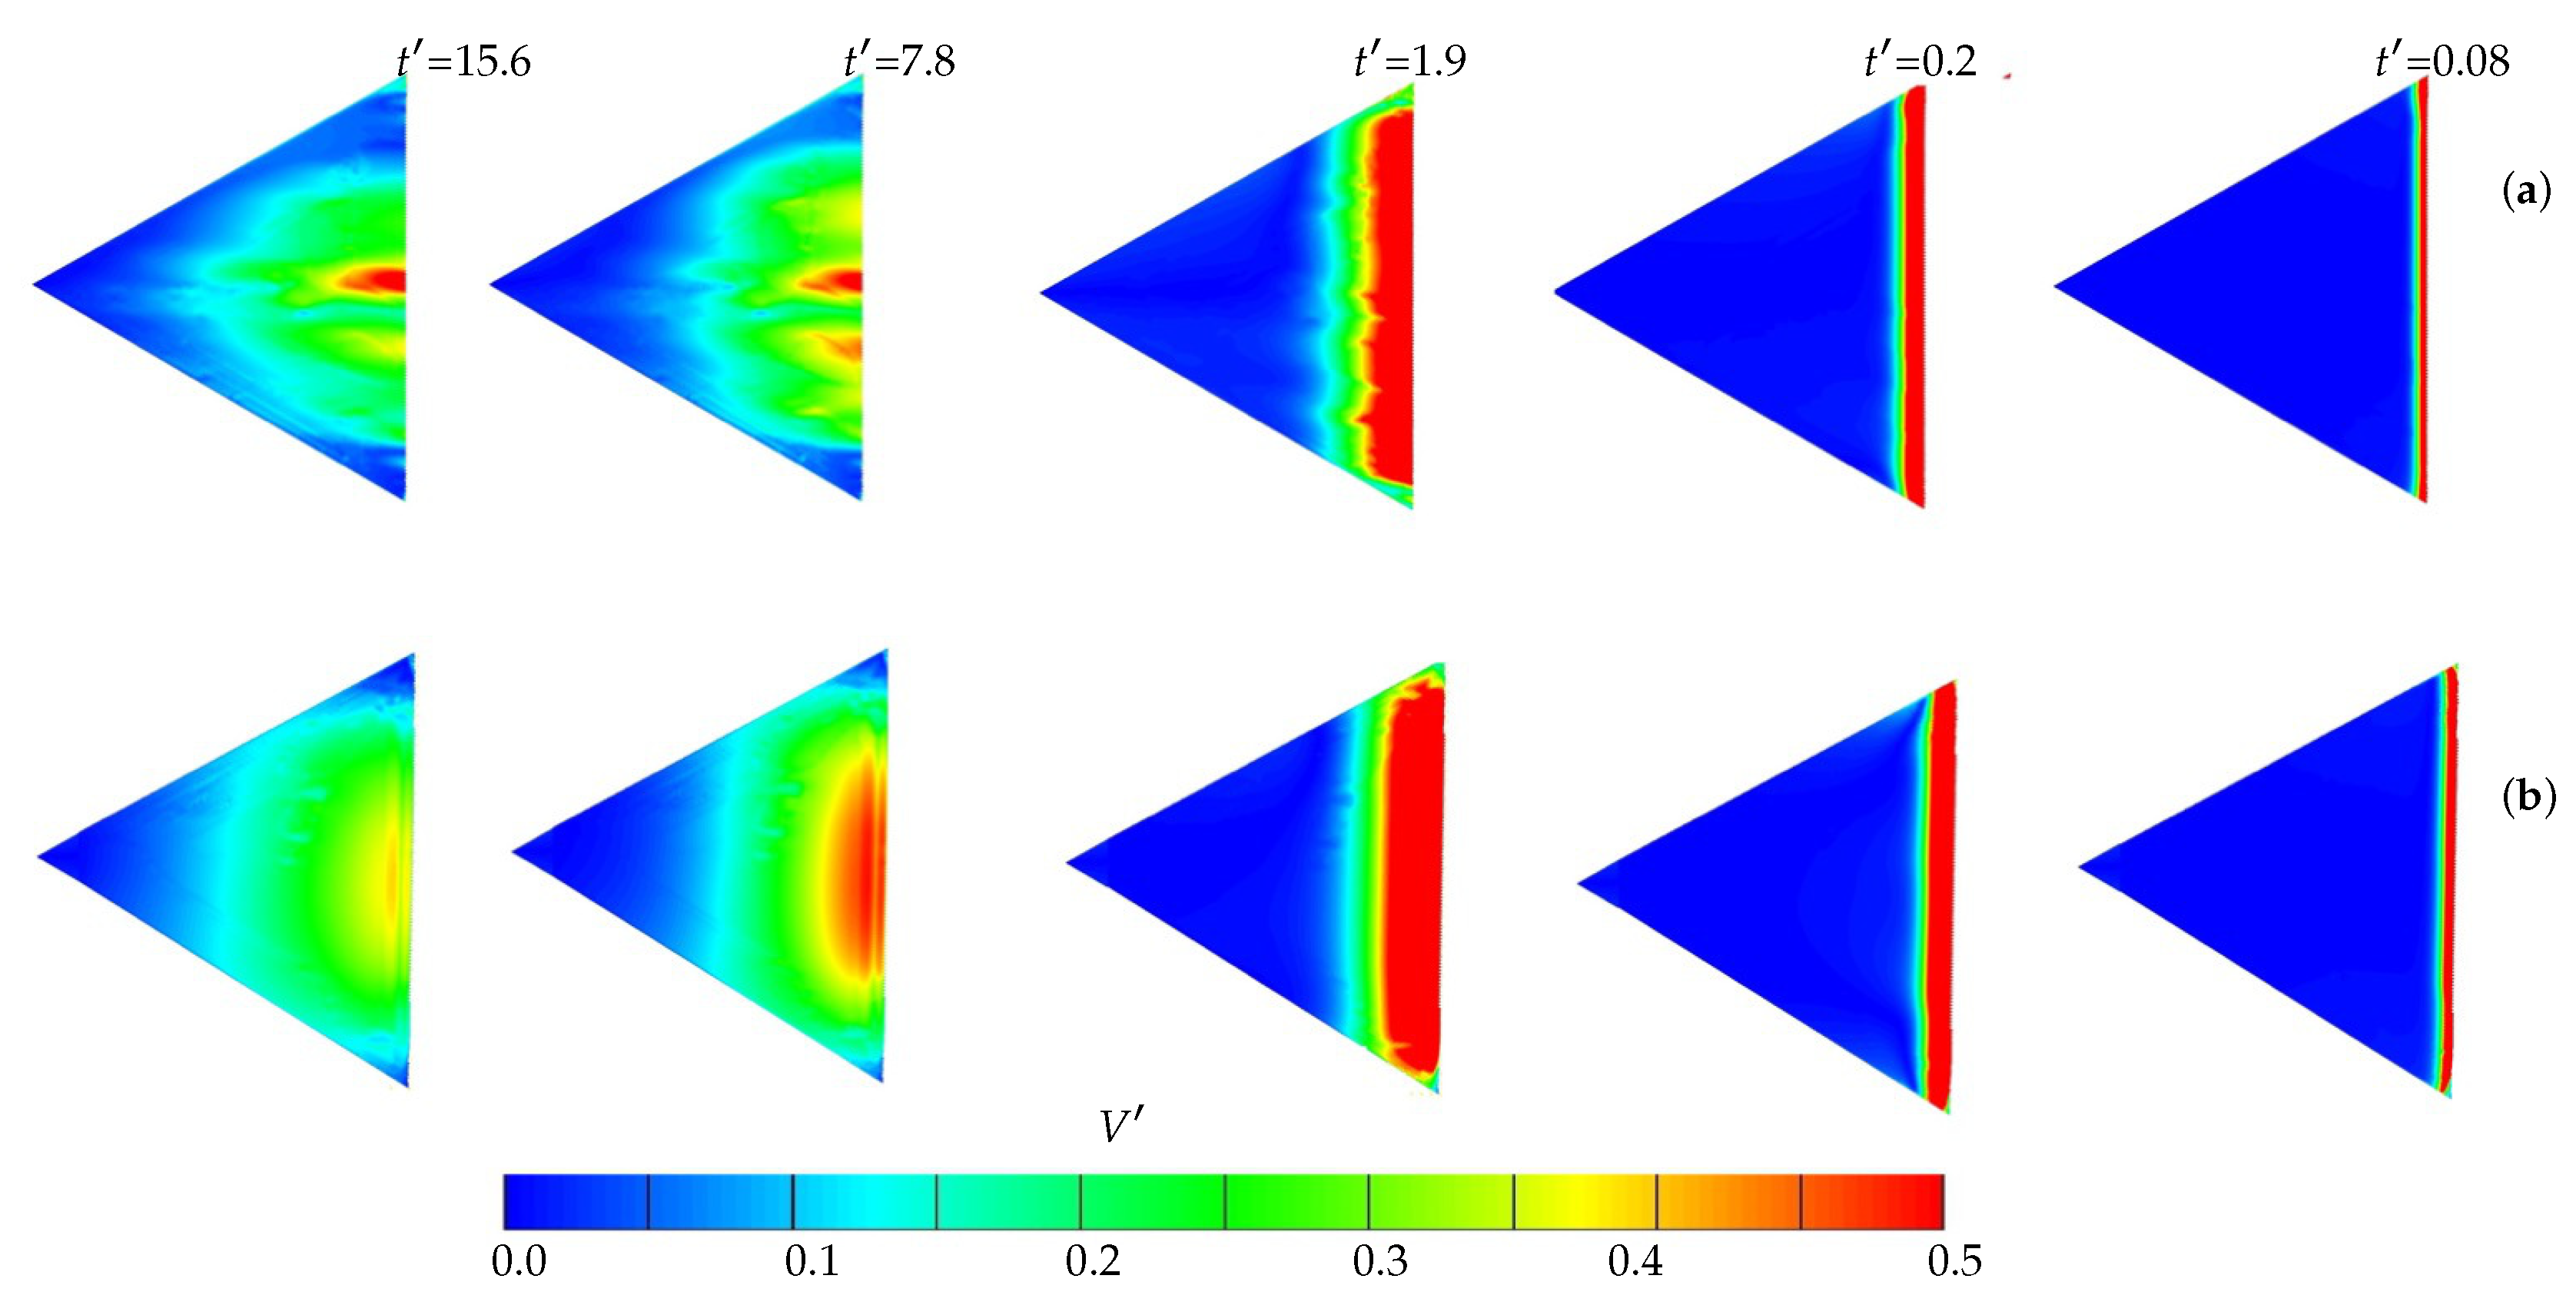
Figure 6 depicted the impact of a wall on the velocity profile during the fractionation process. The figure presented the velocity profiles for both interior and exterior films as a function of time. It demonstrated how the Marangoni velocities facilitated the transportation of surfactants towards the centre of the film as time progressed. As a result, the maximum Marangoni velocities shifted towards the film centre in both interior and exterior films, although their trends differed at later times. Notably, at
in
Figure 6, the Marangoni velocity in the interior geometry exhibited the highest value directed towards the film centre. Conversely, in the case of the exterior film, the velocity profile was more widespread and lacked a focused direction towards the film centre due to the presence of the wall.
4.4. Influence of Bo Number on the Marangoni Film for Both Interior and Exterior Film
The interfacial shear viscosity and surface mobility could vary depending on the choice of surfactant materials. The control of surface mobility was achieved through the Bo number, which was influenced by factors such as the transverse radius of curvature (R), surface viscosity, and bulk viscosity. Thus, in this study, the influence of the Bo number, serving as an indicator of interfacial mobility, on the Marangoni velocity in both interior and exterior films during foam fractionation was investigated.
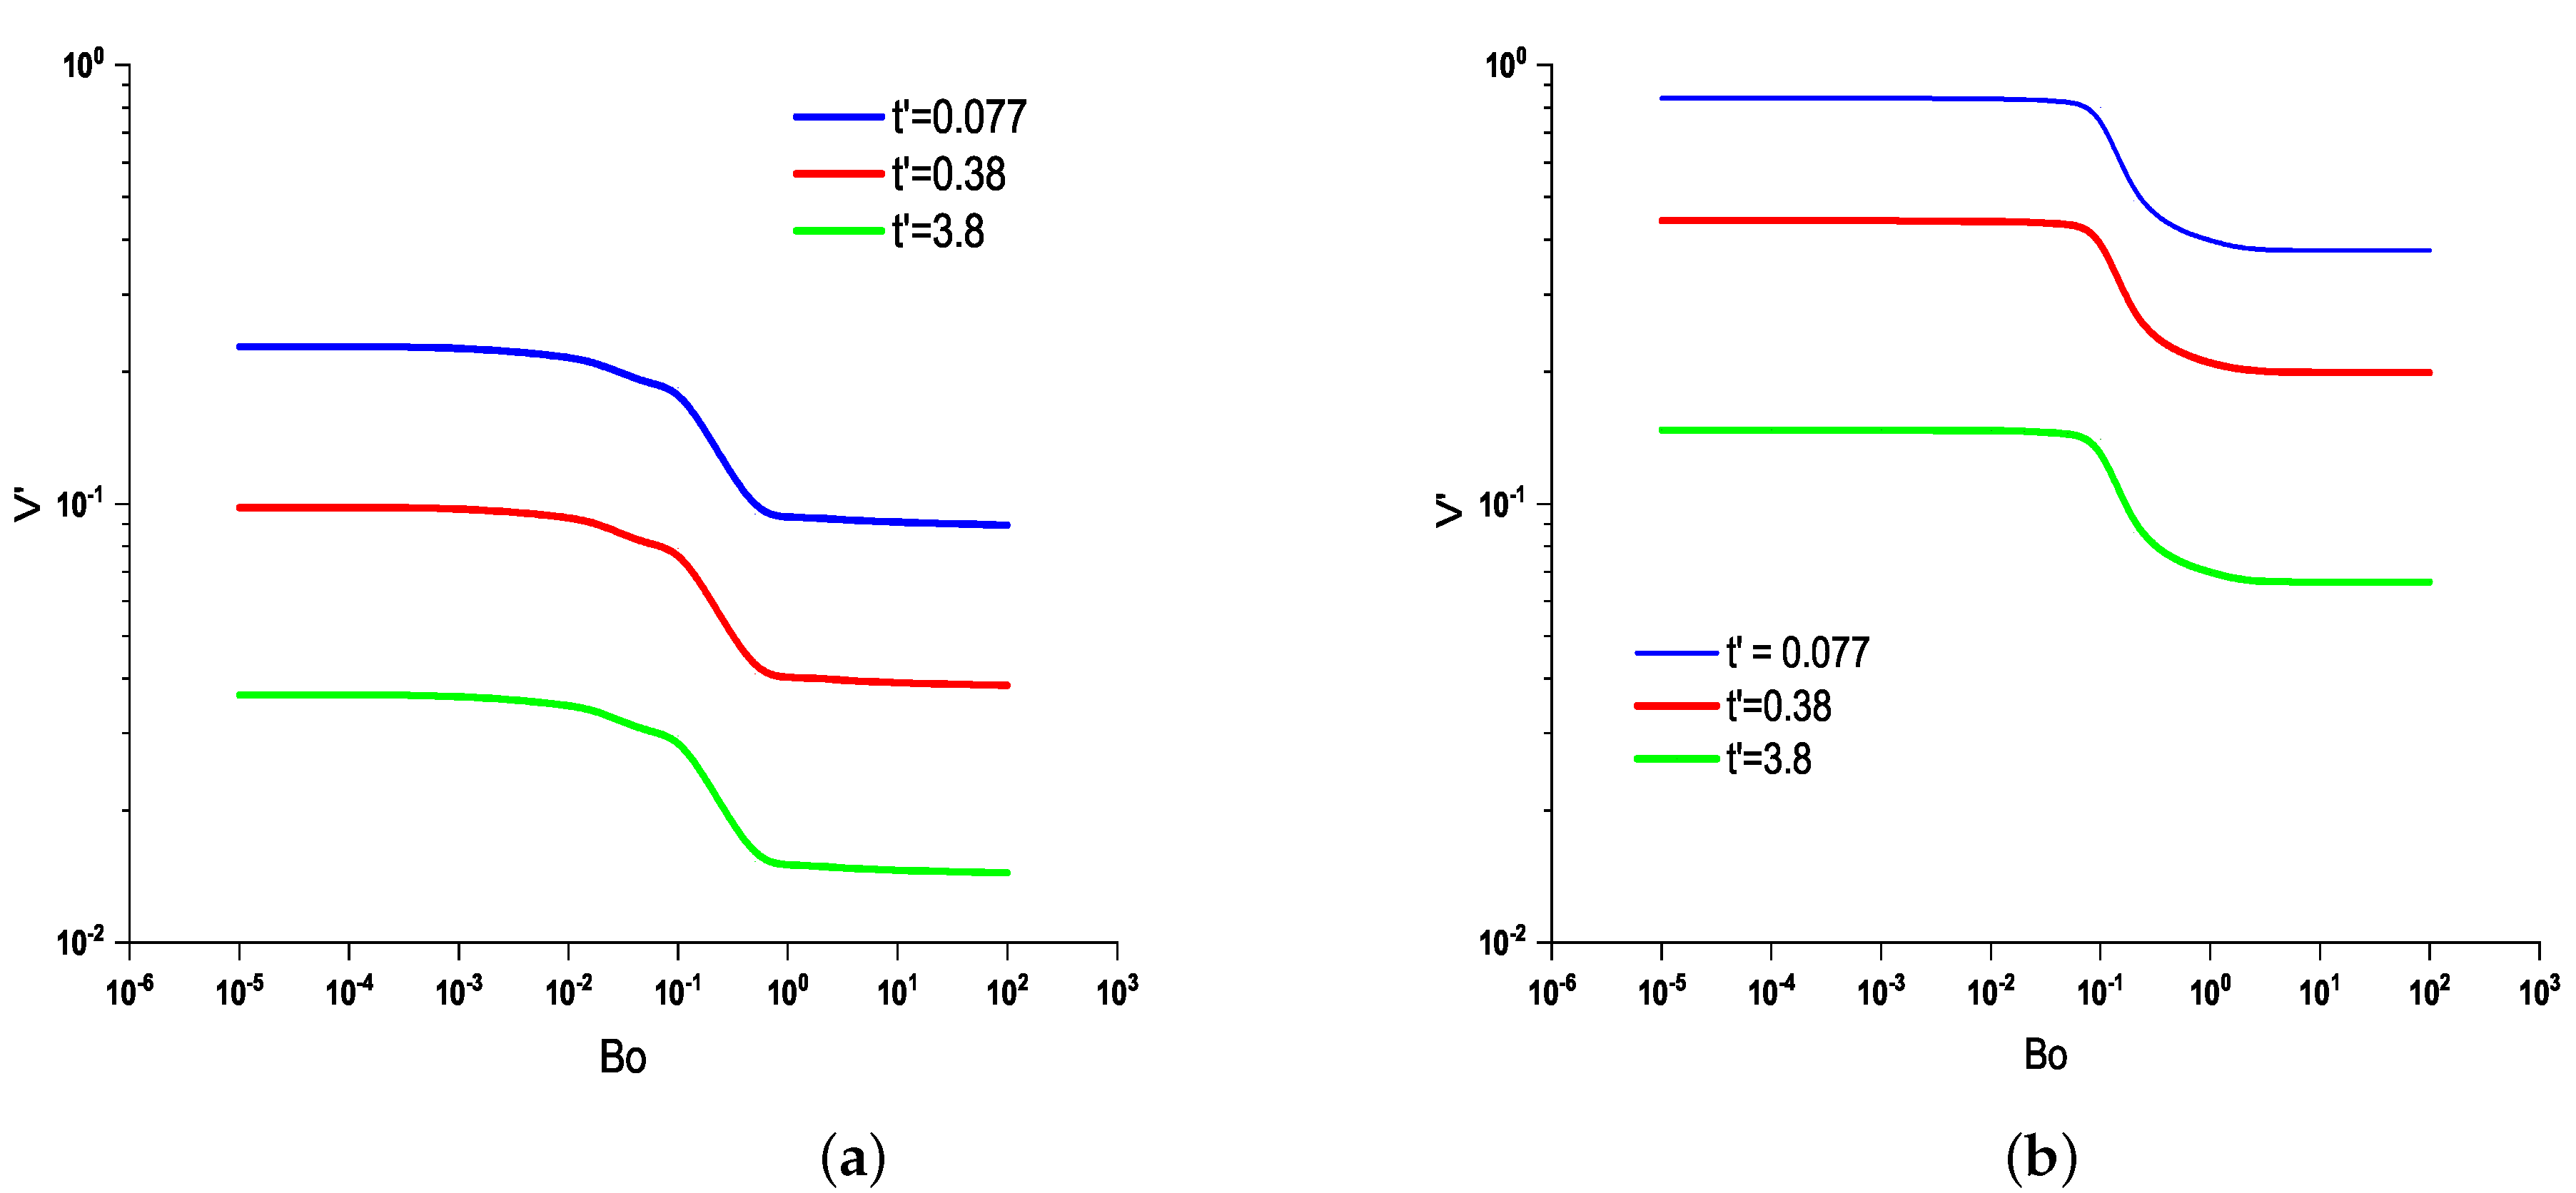
As the Bo number was reduced, the mobility was increased and the velocity was increased. It was indicated that with the increasing mobility of the air–liquid interface or the decreasing Bo number, the Marangoni flow was intensified. The influence of the Bo number on the Marangoni flow for the interior and exterior films was investigated in
Figure 7a,b, respectively, considering different surface mobilities from a rigid wall to a slip wall (
).
As observed, the maximum Marangoni velocity occurred at
in both the interior and exterior films. However, in the interior film, the maximum variation of Marangoni velocity occurred for
, while in the exterior film, the higher variation of Marangoni velocity was observed for
, as depicted in
Figure 7a,b, respectively. Additionally, the findings revealed that the Marangoni velocity in the interior film was approximately twice that of the exterior film. Therefore, the graphs could be a useful toolbox to calculate any reflux Marangoni velocity with any interfacial mobility.
Furthermore, this study reveals that the Marangoni flow exhibits the same trend with changes in the Bo number over time, as illustrated in both
Figure 7a,b for the selected times
,
, and
.
5. Conclusions
In this study, a numerical investigation was conducted on the Marangoni flow during the foam fractionation process in a three-dimensional node–film–PB system for both the interior and exterior films. The model utilized in this research was based on the previous work by Rezaee et al. on recirculation flow studies [
22] and extends it to explore the Marangoni flow in the context of foam fractionation [
24,
25].
Our analysis began by examining the evolution of surface surfactant concentration and Marangoni velocity profiles over time. Notably, we observed that the maximum velocity of reflux Marangoni occurs at at a location with a normalized length of near the PB.
Furthermore, the influence of the surfactant concentration of the reflux column () on the Marangoni flow in the interior film was investigated. The results highlight the significant impact of the initial value of the reflux column on the Marangoni flow from the PB to the centre of the film and the equilibrium time required to homogenize the surfactant concentration throughout the film. Additionally, a direct relationship between the chosen value of and the maximum Marangoni velocity was found.
The effect of the interfacial mobility, controlled by the Boussinesq number (), on the Marangoni velocity in both interior and exterior films was explored. The findings indicate that the Marangoni velocity increases when the Bo number was reduced, while an increase in Bo or the imposition of a rigid wall interface leads to a decrease in the Marangoni velocity. Moreover, an inflection range of the Marangoni velocity was observed for in the interior foam and in the exterior foam.
It should be noted that this study solely focused on the Marangoni flow phenomenon, without considering the influence of film drainage. Future research endeavours could investigate the impact of film thickness and drainage on the flow behaviour within the three-dimensional film-node-PB system for both interior and exterior films. By considering these factors, a more comprehensive understanding of foam fractionation processes can be achieved.


