Article

Evolution of Air Plastron Thickness and Slip Length over Superhydrophobic Surfaces in Taylor Couette Flows

by
Ahmed Faraj Alarbi Alsharief
1,2,*,
Xili Duan
1 and
Yuri S. Muzychka
1
1
Department of Mechanical Engineering, Faculty of Engineering and Applied Science, Memorial University of Newfoundland (MUN), St. John’s, NL A1B 3X5, Canada
2
Department of Mechanical Engineering, Faculty of Engineering, Omar Al-Mukhtar University, Albyda P.O. Box 991, Libya
*
Author to whom correspondence should be addressed.
Fluids 2023, 8(4), 133; https://doi.org/10.3390/fluids8040133
Submission received: 28 February 2023 / Revised: 2 April 2023 / Accepted: 9 April 2023 / Published: 17 April 2023

Abstract

:
Drag reduction (DR) using superhydrophobic surfaces (SHSs) has received intensive interest due to the emergence of SH coating technology. The air layer (plastron “δ”) trapped between the SHS and the water controls the flow slip over the SHSs. We demonstrate slippage over three fabricated SHSs in laminar and low turbulent Taylor–Couette flows. We experimentally investigate how the slip length increases with a higher Reynolds number (Re) over the tested SHSs; simultaneously, the air plastron thickness investigates using a viscous model. The mean skin friction coefficient (Cf) can be fitted to a modified semi-empirical logarithmic law expressed in the Prandtl–von Kármán coordinate. An effective slip length is estimated in the 35–41 µm range with an achieved 7–11% DR for the tested surfaces. Statistical analysis is used to develop a regression model from the experimental data. The model shows an R2 of 0.87 and good agreement with the experimental data. This shows the relation between the dimensionless slip length (b+), the dimensionless plastron thickness (δ+), and the Reynolds number, which is directly proportional. The regression model shows that b+ and Reynolds numbers have a higher impact on the δ+ than the surface wettability, which attribute to the small difference in the wetting degree between the three tested surfaces. The practical importance of the work lies in its ability to provide a deep understanding of the reduction in viscous drag in numerous industrial applications. Furthermore, this research serves as a groundwork for future studies on hydrophobic applications in internal flows.

1. Introduction

1.1. Unstructured Superhydrophobic Surfaces

The recent widespread superhydrophobic technologies open doors to many applications, from personal to very complex industrial applications, such as anti-icing [1], anti-corrosion [2], self-cleaning [3], and drag reduction [4]. The superhydrophobic coating (unstructured) surfaces result from a combination of the hydrophobicity of the surface material (chemically hydrophobic) and surface topography (physically rough) [5]. Many superhydrophobic coating products give a high contact angle of fluids, which measures slippage on SHS and the degree of surface wetting. By trapping air pockets between the individual topographical features of the nano–micro scale, the non-wetting state allows fluids to slip over the solid–air interface, which is known as the Cassie–Baxter state [6]. Besides carefully designing the fabricated surface morphology, the composite interface can withstand pressure-induced wetting transitions over a wide range of liquid surface tensions and externally applied pressure differences [7]. Unlike regular structured surfaces, SHSs with random micro/nanopillars can be produced by relatively reasonable, affordable, and easily scalable techniques, for example, spray-coating, sandblasting, and chemical or electrochemical etching, which are currently widely used in industrial-scale surface treatment operations [8]. Moreover, many studies correlate the slip length to roughness in terms of surface roughness scale parameters, which is a challenging task. Although most SH surfaces of high roughness do not perform equally well to achieve drag reduction, many other anti-wetting surfaces showed drag enhancement in turbulent flow, even when they remain perfectly non-wet underwater [9,10].

1.2. Mechanisms for Slip-On Coated Superhydrophobic Surfaces

The drag forces on the walls of confined flows can reduce the fluid flow’s momentum, which leads to a reduction in efficiency of the designed system. The most practical approach used to achieve the overall viscous shear drag reduction (DR) is the passive technique (e.g., changing the wall topology) [11,12,13]. The slip over the SH coating surface could be explained as a combination of direct and indirect effects. In laminar flows, a reduction in skin friction drag can be analyzed by comparing the slip length to the characteristic length of the flow geometry [10]. Air–water interfaces on or in roughness elements are usually used to describe the effective slip length, which is the direct effect. The main forces dominating the flow region near the wall are the viscous drag force parallel to the wall and the flow’s liquid pressure—which is normal to the wall. In random roughness, as hydrostatic pressure increases, the trapped air layer (plastron) becomes gradually thinner, and its dynamics can only be predicted in an average or statistical manner [10]. Thus, the slip length values in the laminar region are lower than those in turbulent flow regions. When the Reynolds number is high, shear stress and pressure fluctuation are caused by turbulence enhancing the wetting [13], which is an indirect effect. By modelling the air diffusion process of a plastron as a nonlinear oscillation system, Piao and Park [14] investigated the effects of fluctuating air–water interfaces. The study suggested that the interaction between the air compression due to fluctuating water pressure and the water impalement due to gas diffusion determines the plastron’s response to the unsteady environment. In contrast to regularly structured roughness, the random roughness morphology is thought to suffer from the negative effect of the spanwise slip being identical to the streamwise slip, as well as the inability to maintain a full plastron resulting in non-uniform asperities impaling the water [14].

1.3. Air Plastron Generation over Coated Superhydrophobic Surfaces

The air layer trapped between the SH surface and the water is commonly called the air plastron. The air plastron, as a lubricator, reduces viscous skin friction and enhances the effective slip velocity [15]. The plastron and the drag reduction effects disappear when the SH surface transits from a non-wetted Cassie–Baxter state to a wetted Wenzel state. Consequently, preventing or delaying the transition to the Wenzel state is crucial since it is typically the more thermodynamically advantageous state [16]. Increasing the Laplace pressure by using small air buckets or increasing the hydrophobicity of the surface can achieve this tendency [17].
For drag reduction to be sustained, it is also necessary to minimize gas diffusion from the plastron into the liquid. This can be achieved, for example, by increasing the volume of the saturated gas in the liquid, e.g., gas or bubbles injection technique [17,18]. The gas is transported from the plastron into the liquid at an accelerated rate with higher flow velocities, giving shorter effective diffusion lengths [18]. The plastron air layer connected to ambient air showed enhancement of the achieved drag reduction compared with the same case of the isolated plastron layer. This enhancement refers to the ambient air entraining the plastron layer [19].
Only a limited number of investigations have characterized the plastron air thickness since it is challenging. Different techniques have been used to investigate the plastron layer growth at low and high Reynolds number flows. In stagnant water, Bobji et al. [18] used the total internal reflection (TIR) of light at the air–water interface to visualize air pockets over SHSs with regular and random textures. They observed that the air pockets gradually dissolved in water, and the surface became completely wet. The intensity of light reflected from the plastron and confocal microscopy to characterize the time-dependent morphology of trapped air over an SHS in stagnant water was used by Poetes et al. [20]. Initially, they observed that the SHS was covered in a complete plastron, but air diffusion into the water gradually made the plastron thinner. They observed exponential increases in diffusion rate with increasing immersion depths (static pressures) in SHS. Spherical cup-shaped bubbles are formed as the plastron reaches a critical thickness. They also dissolve in water over time. Samaha et al. [21] measured the longevity of the air pockets using an optical spectroscopy system based on the intensity of reflected light. They observed that reduction in the reflected light from the plastron over time is correlated with a decrease in both drag reduction and the contact angle of the SHS.
Few studies were performed to investigate the air plastron layer as it was subjected to the flow. Most of them were carried out in a water tunnel using TIR and high-speed camera techniques for optical observations [13,20,21] or tracer-based methods such as particle image velocimetry (PIV) technique [22]. It is challenging to visualize the plastron in large-scale flow facilities in turbulent flows. Moreover, a large volume of water with high ionicity, temperature control, and mechanical vibration of the facility also contribute to challenges [23]. The study of Ling et al. [24] showed that when the roughness elements are exposed to the turbulent flow, the Reynolds stresses become the main contributor to the wall shear stress, resulting in less drag reduction. In addition, the mechanical interaction between the plastron and solid pollutants in the liquid, or the tracer particles used in the intrusive measurement techniques, showed the plastron’s instability; its lifetime was shortened by approximately 50% [21,25]. With the use of a cone-and-plate rheometer, Lee et al. [26] showed that a larger gas fraction at the air–water interface increases effective slip over the structured SHS, though the plastron becomes unstable. Later, they observed that an SHS’s DR performance is significantly limited by the plastron’s stability at high velocity.

1.4. Objective and Structure of the Paper

The current paper investigates the relationship between air plastron thickness, slip length, and the wettability of various SHSs. The Taylor–Couette (TC) flow cell of a rheometer is used to characterize these parameters simultaneously. Three SHSs were used, and all of them were fabricated with commercial SH coatings on the outer surface of the TC cell. The outer surface was selected as the tested surface of the TC cell because of the high dynamic pressure compared with the inner surface [27]. This high dynamic pressure will decrease the static pressure and allow the air to entrain in the plastron layer. According to previous studies [28], this can potentially allow the plastron to last longer than it has in cases where the inner wall is coated. The surface morphology was investigated by scanning electronic microscopy; the wetting degree was characterized by measuring each sample’s static and dynamic angles. The experimental data of the flow are used to calculate the slip length and the plastron thickness. The plastron thickness is calculated based on the viscous model of the slippage of water suggested by V. Olga [29]. A statistical regression method is used to analyze the experimental data and investigate the relationship between the air plastron thickness and the slip length (independent variables) and the Reynolds number, shear stress, viscous ratio, and surface hydrophobicity (dependent variables). The original TC cell with superhydrophobic surfaces enables us to study the growing plastron thickness and the achieved slip length under well-controlled conditions.
The paper is organized as follows: Section 2 presents the experimental setup, procedure, and characterization of the surfaces’ hydrophobicity, morphology, and flow regimes. Section 3 illustrates the experimental results of viscous skin friction measurements, slip length, and plastron thickness. It also includes the slip length and plastron thickness regression models. Section 4 concludes the discussion and spotlights future considerations.

2. Experimental Methods and Surfaces Characterization

2.1. Experimental Setup and Surface Fabrication

This study used an MRC 302 Compact Rheometer from Anton Paar GmbH Québec QC, Canada as the measurement’s device, an integrated 360° capacitive normal force sensor (50 N), and a high-resolution optical encoder that allows it to have torque measurement ability from 0.5 nNm to 200 mNm. An original CC27 cylindrical measurements setup was used as a Taylor–Couette (TC) cell, as shown in Figure 1. The concentric disposal cups (CDC) were used for the test surface in the rheology study. The inner surface of each cup was coated with superhydrophobic coating materials through a dipping and spinning technique. All surfaces were cured at room temperature for more than seven days, as recommended by the coating manufacturer. Three commercial superhydrophobic coatings were used in this study which are from FlouroPel Coating (FPC-800M) Cytonix Manufactures LLC Beltsville, MD, USA, Ultra-Ever Dry (UED) from UltraTech International, Inc., Jacksonville, FL, USA and SuperHydrophobic Binary Coating (SHBC) from NASIOL of Artekya Technology Group Başakşehir, İstanbul, Turkey. The UED and SHBC coatings have a structure of binary layers; the first layer is the base coat, which binds the substrate and the second layer of a superhydrophobic topcoat. The FPC-800M is a monolayer.

2.2. Characterization of Surfaces Hydrophobicity

The surface fabrication process for all the used CDC samples changes the TC cell geometry. The dry film thickness of coatings for all CDC surfaces was verified to avoid any measurement errors during the experimental work. A nonferrous ultrasonic probe of an Elcometer 456 Model coating thickness gauge from Elcometer, Warren, MI, USA, which was used to take the thickness measurements with a resolution of ±1 µm. More than 72 points were measured for each sample, and the average value was considered. The binary layer coating of UED and SHBC showed a thickness of 13.4 ± 4 and 18.1 ± 8 µm, respectively. The FPC-800M coating showed a thickness of 5.0 ± 0.2 µm. Scanning electron microscope (SEM) photographs were used to investigate the surface topography. An MLA 650FEG model, SEM from FEI Co., LabX Media Group, Midland, ON, Canada, was used to take SEM images of the samples. Figure 2 shows the SEM images with a final magnification of 22,000 × ; it depicts the geometry of hills (the brighter region) and valleys (the darker region) in the micrometer range. The SEM images for the FPC-800M inspected the large pore sizes of 1–5 µm with surfaces of nano roughness of an isotropic sponge-like structure. The SHBC surface also showed an isotropic sponge-like structure. Figure 2c shows an SEM image with no detail from depth composition optical micrography of the UED sample surface since the used SEM device was unable to capture it. The SEM image focused on two air bubble spots generated during the applied coating process.
To examine the wetting properties of the fabricated surfaces, the static contact angle (SCA) and receding and advancing dynamic contact angles were measured for the prepared samples. Under the ambient laboratory conditions, a droplet of 20 μL deionized water was utilized with ten replications for each surface, and the average value was taken. The contact angle measurements led us to estimate the wettability state of the fabricated surfaces with the experimental liquid. The contact angles were measured with an OCA15 optical contact angle instrument (DataPhysics Instruments USA Corp, Charlotte, NC, USA). For droplet analysis and operating parameter control, DataPhysics SCA20 software was used. A polynomial fitting model was used to calculate the droplet’s contour; this approach overcomes the difficulty of the surface curvature of the substrates and gives accurate measurements in comparison to other models.
The UED sample shows a high SCA compared to the SHBC and FPC-800M samples The contact angle hysteresis (CAH) of UED is 1°, and SHBC has a CAH of 6°, while the FPC-800M sample shows 2°. The interpretation for this low SCA and high CAH is that the used dipping and spanning coating technique in this work is contrary to the producer’s recommendations. Table 1 summarizes more details for the measured static and dynamic contact angles for all surfaces used in this work.

2.3. Experimental Procedure and Measurements Uncertainties

The rheometric torque measurements can be used to investigate area-averaged liquid-slip phenomena across vast, random (and anisotropic) topographies. In order to avoid experimental errors and reduce measurement uncertainties, the original setup of the rheometer device was used as a Taylor–Couette cell. In the present work, a narrow-gap Taylor–Couette cell with a radius ratio of η = r i r o = 0.92 was used along with the CDCs and the measuring bob of model CC27, as shown in Figure 1. The inner radius of the measuring Bob (Ri) is 13.329 mm, and the outer radius (Ro) is 14.464 mm, which is the inner radius of the baseline CDC (smooth surface). The gap length (L) is 39.999 mm, corresponding to a length-to-gap ratio of Γ = 36.4. The maximum shear rate used in this study was 2000 s−1, performed with a maximum rotational speed of 1557 rpm. The rheometer is equipped with a sensitive torque sensor fixed in the measuring arm and an integrated temperature sensor to maintain constant temperature using the Peltier plate and lift motor, which offers an accurate end zero-gap setting. The rheometer’s lift motor in the stand provides precise zero-gap settings and automatically compensates for gap change, and the end effect correction factor is considered to be CL = 1. The time-averaged wall shear stress (τ) is calculated based on the measured torque from Equation (1) [30].
τ = 1 + η 2 2000 · η 2 · M 2 · π · r i 2 · C L ,
where M is the measured global torque and η is the ratio of Radii. The shear rate ( γ ˙ ) is calculated as follows [26]:
γ ˙ = ω · 1 + η 2 η 2 1 ,
and the angular velocity ω = π 30 · n , where n is the rotational speed.

2.4. Characterization of the Flow Regimes of the Taylor–Couette Flows

Understanding the complexity of the Taylor–Couette (TC) flows has long been a challenge to a physicist [31]. It depends on the operational and geometrical conditions. In the low range of Reynolds numbers, the flows are governed by geometry conditions, and the work of Couette [32] proved this hypothesis. In high Reynolds number flows, one could anticipate the specifics of the force to fade away and a universal pattern to emerge, and the global properties of the system could be expected to scale with Reynolds number to some power [33]. Figure 3 shows the flow regimes for our experimental setup based on the work of [34]. There are five flow regimes separated by four critical Reynolds numbers, as presented for the fixed external and rotating internal cylinders, which are the circular Couette flow regime (CCF), Taylor vortex flow regime (TVF), wavy vortex flow regime (WVF), modulated wavy vortex flow regime (MWVF), and turbulent Taylor vortex flow regime (TTVF).
The flow regimes in the TC cell used in this work were identified by the torque acting on a smooth internal surface of the outer cylinder, which was measured with a maximum angular speed (n) of 1552 rpm and to compare data using deionized water. Frictional heating causes thermal effects on estimating the correct fluid viscosity, as was mentioned by Hall [35]. However, all measurements were conducted using a constant volume of deionized water of 19 mL and at a constant temperature of 20 ± 0.10 °C since the CDCs sit on a stress-controlled Rheometer’s fixed thermal Peltier plate (MRC-302 Anton–Paar, Québec, QC, Canada) [30]. The non-dimensional toque G is given by
G = τ ρ · ν 2 · L ,
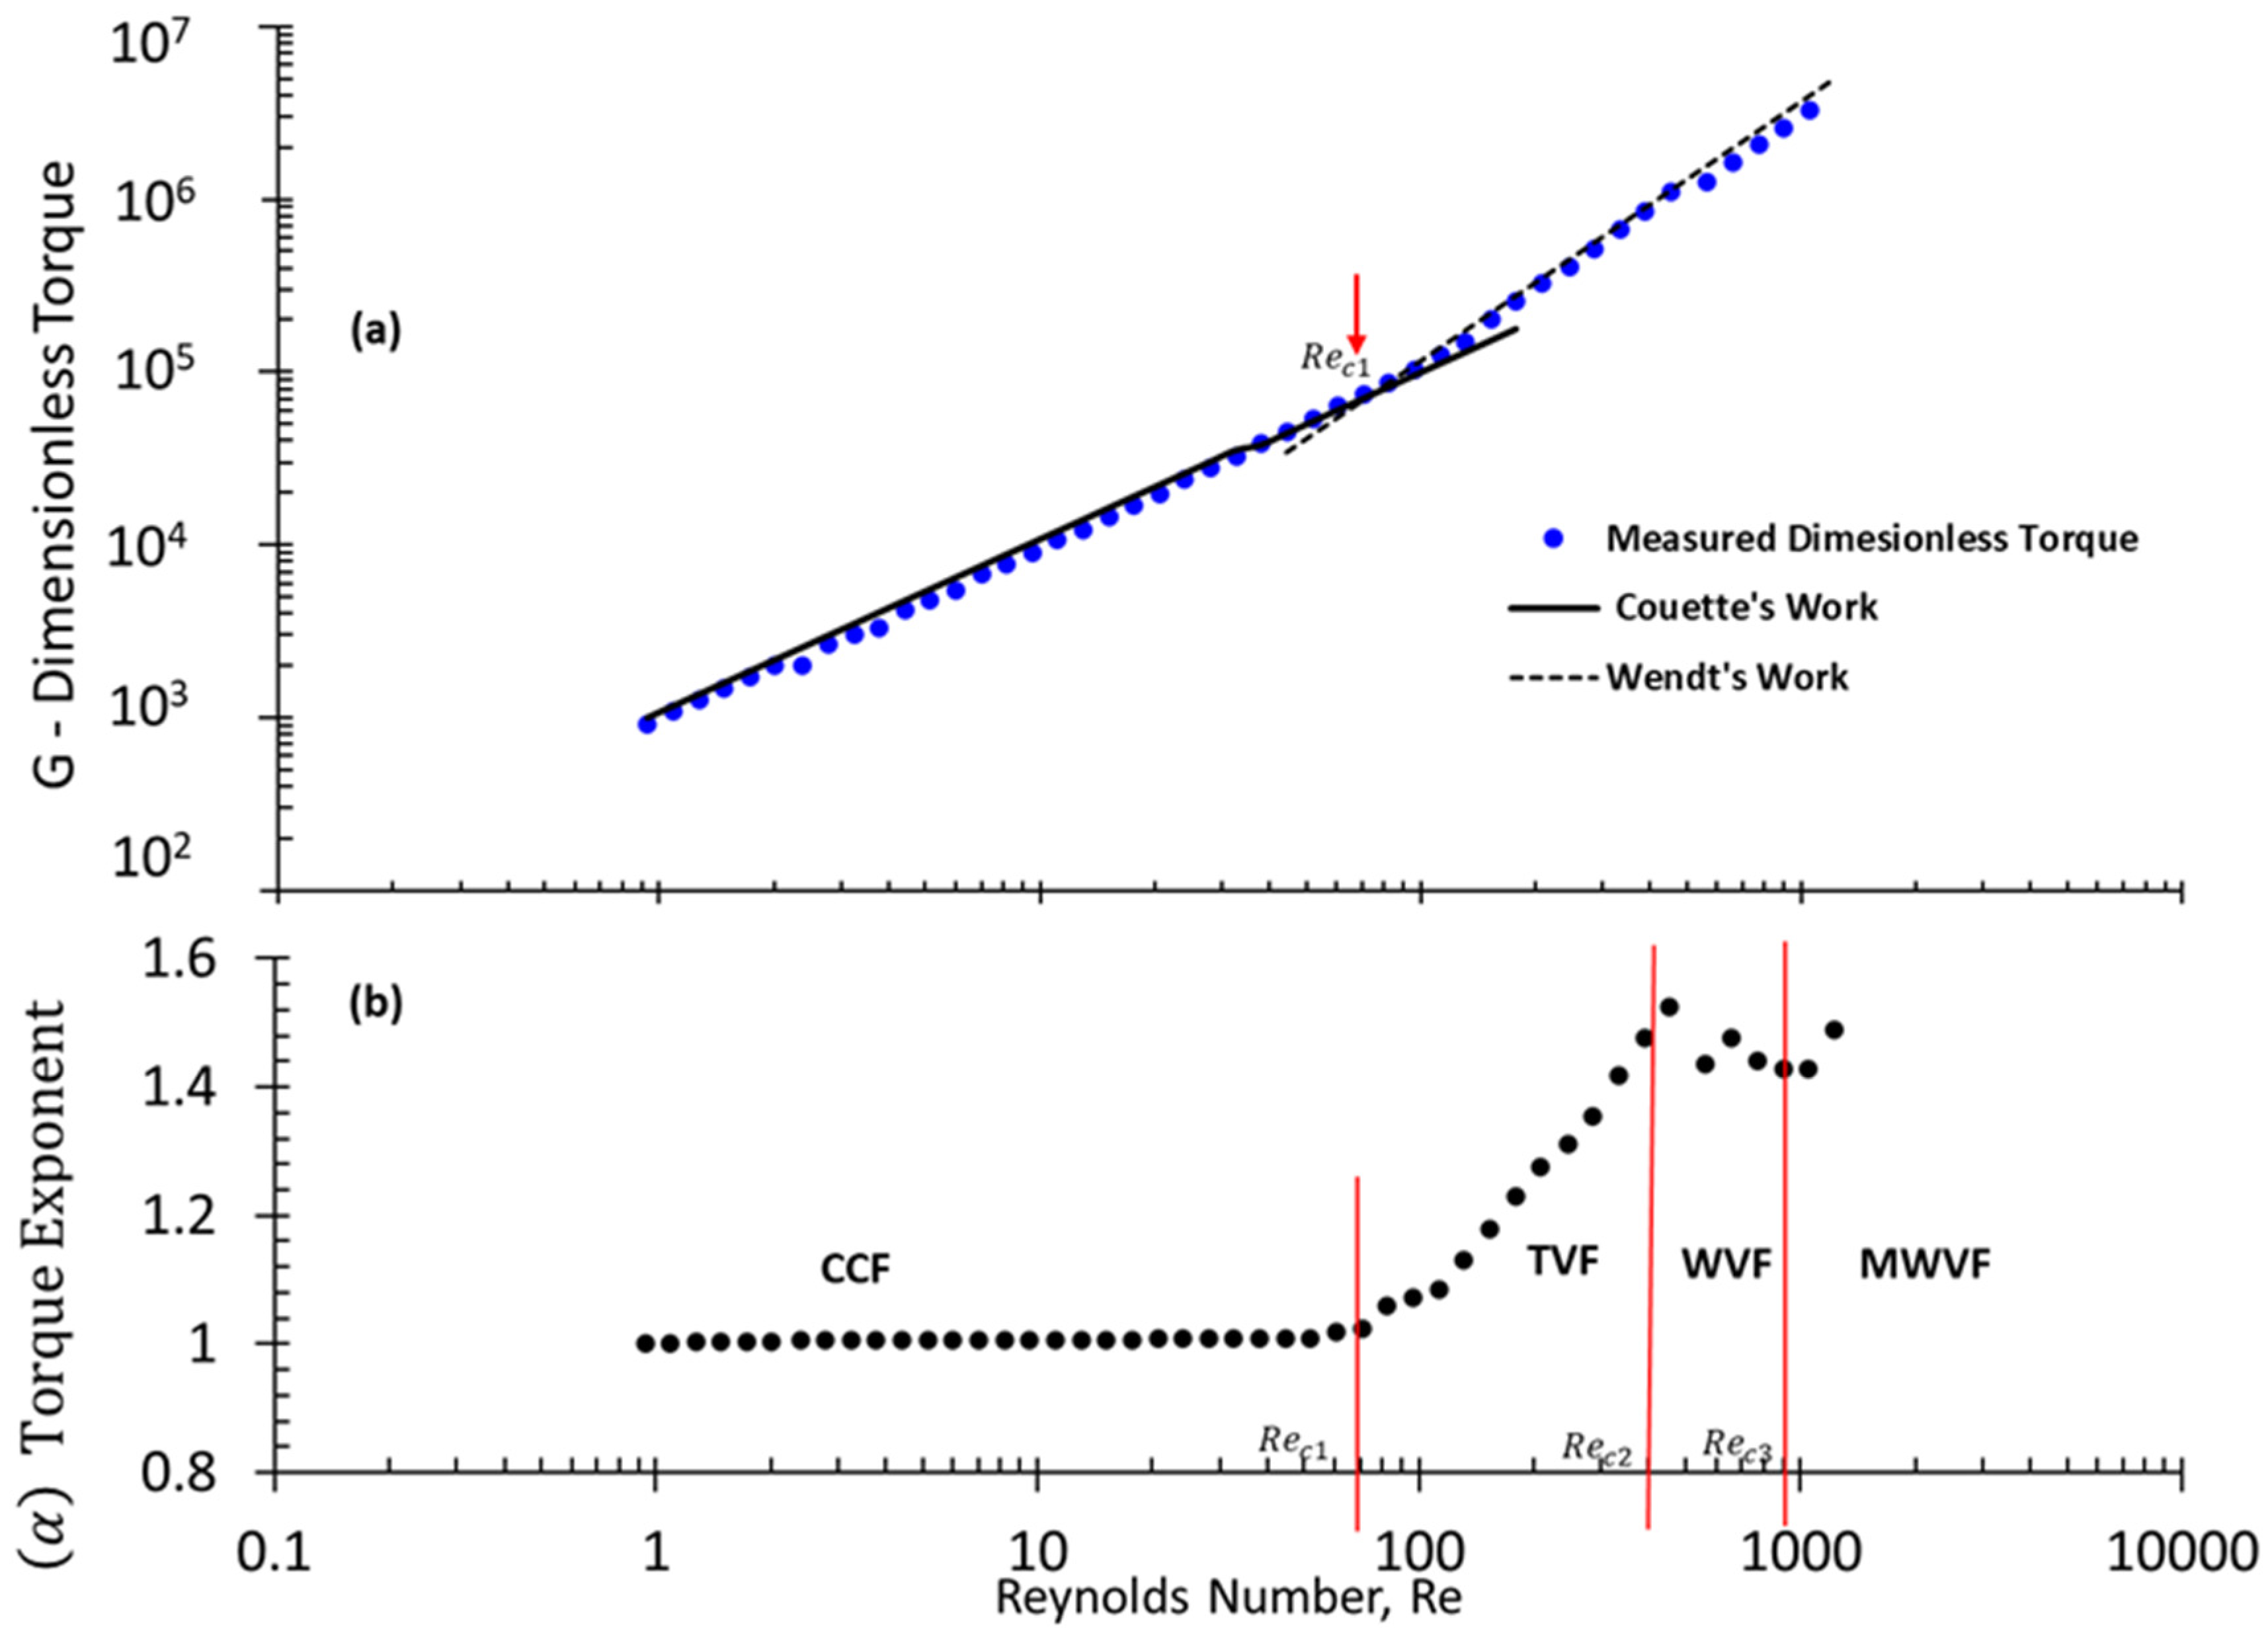
where ρ and ν are the working fluid’s density and kinematic viscosity, respectively. Figure 4a shows the measured dimensionless torque versus the Reynolds number. In the laminar range, the measurements show good agreement and are identical to the reference work of Couette [32], which adapts the following empirical equation [31]:
G = 4 · π · η · R e 1 + η · 1 η 2   For   Re   <   400 ,
where η is the radius ratio. After the critical Reynolds number, the flow comes to the instability regimes, as described in Figure 3. The reference work of Wendt [36] was used to compare our results in these flow regimes. The comparison showed good agreement with Wendt’s work as he fitted his measurements in this regime to the following correlation [31,36,37]:
G = 1.45 · η 3 2 1 η 7 4 · R e   For   400   <   Re   <   10 4 ,
The critical Reynolds number can be seen easily from Figure 4a when the intersection of both fitting correlations at Re of 82. To identify the critical Reynolds numbers or transition points for the flow regimes, we followed Lathrop et al. [31,33] and assumed a power-law scaling torque exponent α of the torque given by
G = R e α ,
The torque exponent α is computed as follows:
α = d log 10 G d log 10 R e ,
The measurements of the deionized water allow us to determine the local exponent α at a low Reynolds number of 2.5. The local exponent α determined from the slope of the graph. A sliding linear least square fitting technique similar to that utilized by Lathrop et al. [33] was used to compute the slope across 13 adjacent data points, which is equivalent to log 10 G vs. log 10 R e (corresponding to a window of Δ log 10 R e = 0.8 wide). A sliding window with an 85% overlap with the previous window was used because direct numerical differentiation emphasizes noise in the data [8,33]. The result of α calculations from data in Figure 4a is presented in Figure 4b. Although the torque exponent α varies with Reynolds numbers, the torque exponent α remains reasonably constant around 1 with a torque measurement error of ± 3.5% for Re < 82. These results agree with the early work of Couette (1890) for the laminar Couette flow regime, and are similar to recently published works [37,39].
The earlier predictions by [33,38] showed that the dimensionless torque does not follow a fixed power-law scaling (i.e., G~Re α, where α is a constant value) for flows of 800 < Re < 1.23 × 10⁶. Here, after the CCT regime, the flow developed into transition regimes, and the flow structure depended on Reynolds numbers. The first transition regime starts with the Taylor vortex flow regime (TVF) in the Reynolds number range of 82 < Re < 455. The TVF is known as the unstable spiral axisymmetric vortices’ regime [34]. The torque exponent increases monotonically from 1.2 to 1.52, indicating that the flow becomes unstable but not turbulent. Subsequently, as the rotation speed is increased beyond Re > 450, the TC cell flow undergoes a new kind of instabilities known as non-axisymmetric instabilities, which lead to a state of great spatio-temporal complexity, known as wavy vortex flow (WVF) [34]. The WVF regime in the present TC cell flow starts Rec2 = 455. Although the dimensionless torque is identical to Wendt’s empirical fitting correlation, the torque exponent will not be constant; it decreases beyond Re = 455 from 1.52 to 1.42 at Rec3 = 900, which agrees with the literature in this transition regime [33,37]. In case Re > 900, the present study has limited data, which allowed investigating up to a maximum Reynolds number of 1227. The Rec4 should be at α = 1.66, which indicates the flow transition from a modulated wavy vortex flow regime (MWVF) to a turbulent Taylor vortex flow regime (TTVF) at a high Reynolds number larger than 104 [8,33,37]. The present study shows an increase in α from 1.43 at Re = 900 to 1.49 at Re = 1227, which agrees with all data in the literature on the MWVF regime [31,33,34,37].

3. Experimental Results and Statistical Analysis

This study investigates the development of the plastron thickness and the slip length experimentally over three different fabricated SH surfaces. In addition, a regression analysis was performed to predict the wettability effects on the achieved drag reduction (DR%).

3.1. Skin Friction Coefficient Measurement

The baseline shear stress (τω) for the TC cell in this work was obtained using an uncoated surface of Aluminum CDCs, which was computed from Equation (1). The dimensionless wall shear stress is typically expressed using a skin friction coefficient. The skin friction coefficient is plotted versus Reynolds numbers to investigate the flow behaviour. The skin friction coefficient is given by the following:
C f = τ 1 2 · ρ · U i 2 = 2 · u τ U i ,
Here, Ui = r i · ω is the measuring bob linear velocity for our system and u τ = ( τ ω ρ ) 0.5 is the friction velocity. The theoretical friction coefficient of the laminar Couette flow can be expressed by [39]
C f = 2 2 + d r o · 2 R e   Re   <   100 ,
and for turbulent flow [40,41]
C f = 3.52 · ln R e · C f + 4.1   Re   >   100 ,
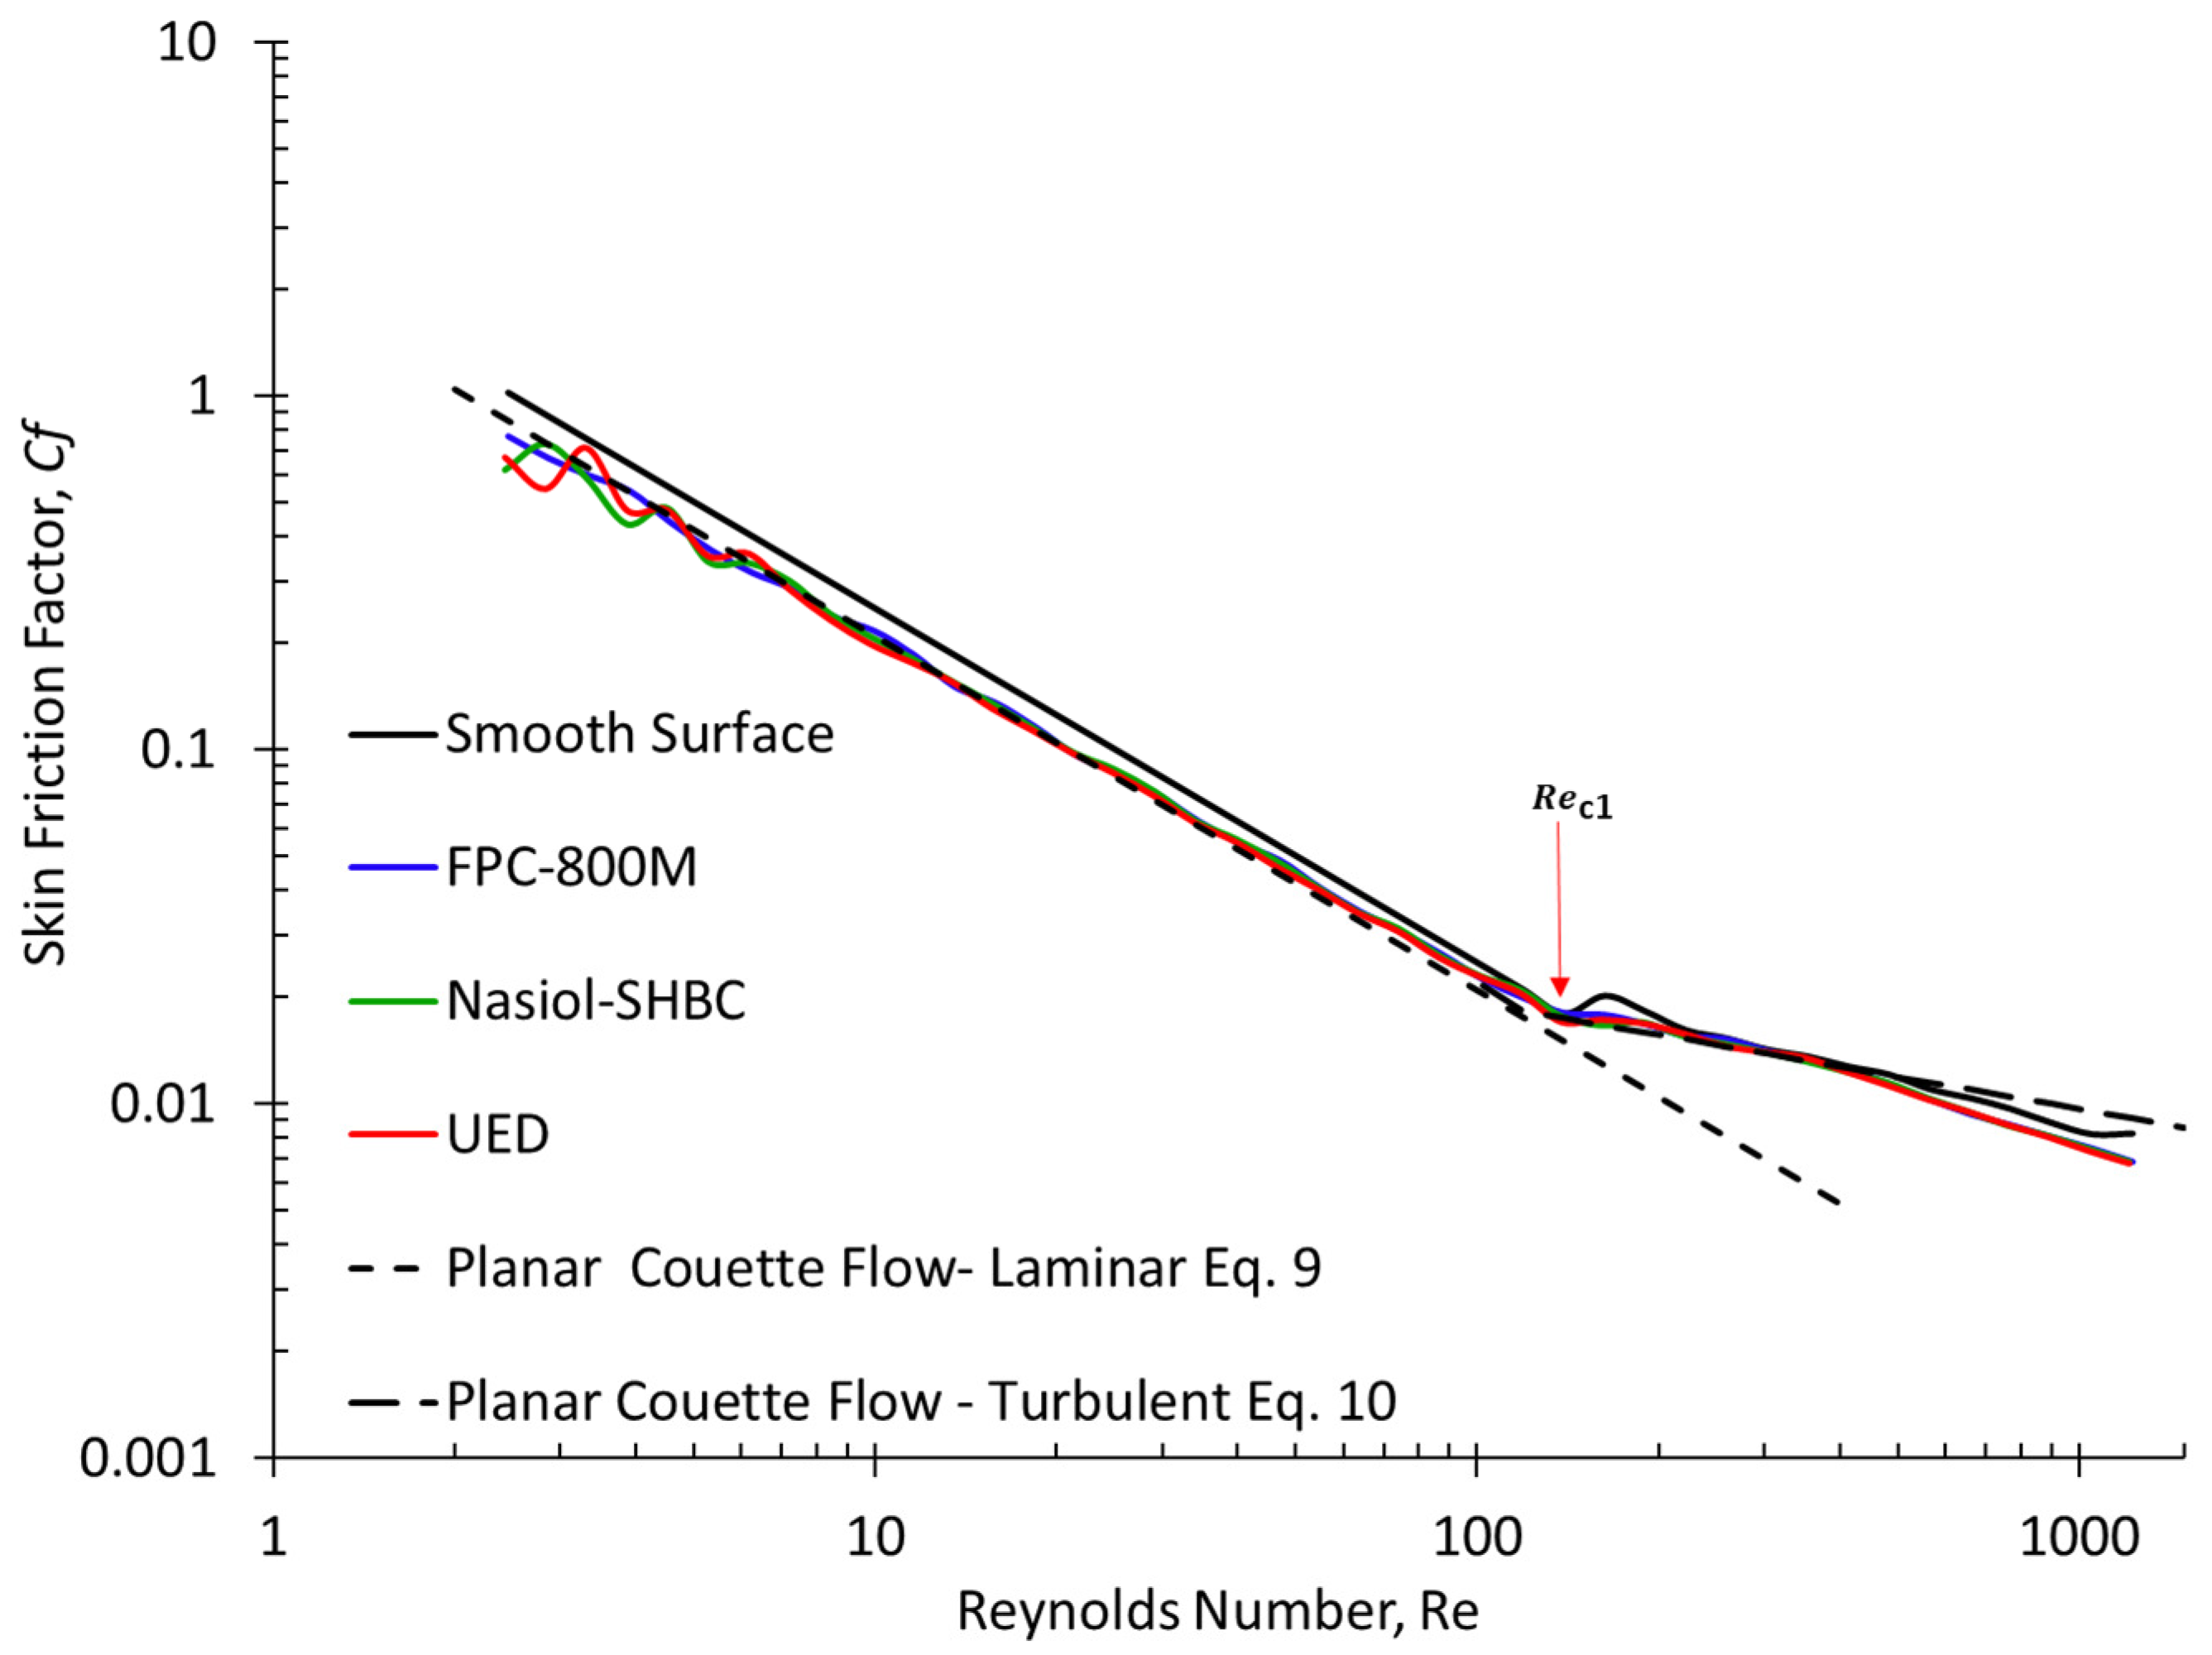
The coefficient of friction values decreases with higher Reynolds numbers for all fabricated surfaces, as shown in Figure 5. However, it can be seen that the laminar Couette flow regions (Re < 82) slightly differ from the smooth surfaces (baseline) for all tested samples. This behaviour is expected since the flow in these regions is controlled by the flow geometry [41]. The standard deviation error of the measurements is 0.5%. The turbulent region can detect no difference between the fabricated and smooth surfaces. The method used by Panton [42] showed that the coefficient of friction in turbulent Taylor–Couette flows should obey a logarithmic friction law expressed in the form of Prandtl–von Kármán [8,19,31,43] as follows:
2 C f = M ln R e C f 2 + N ,
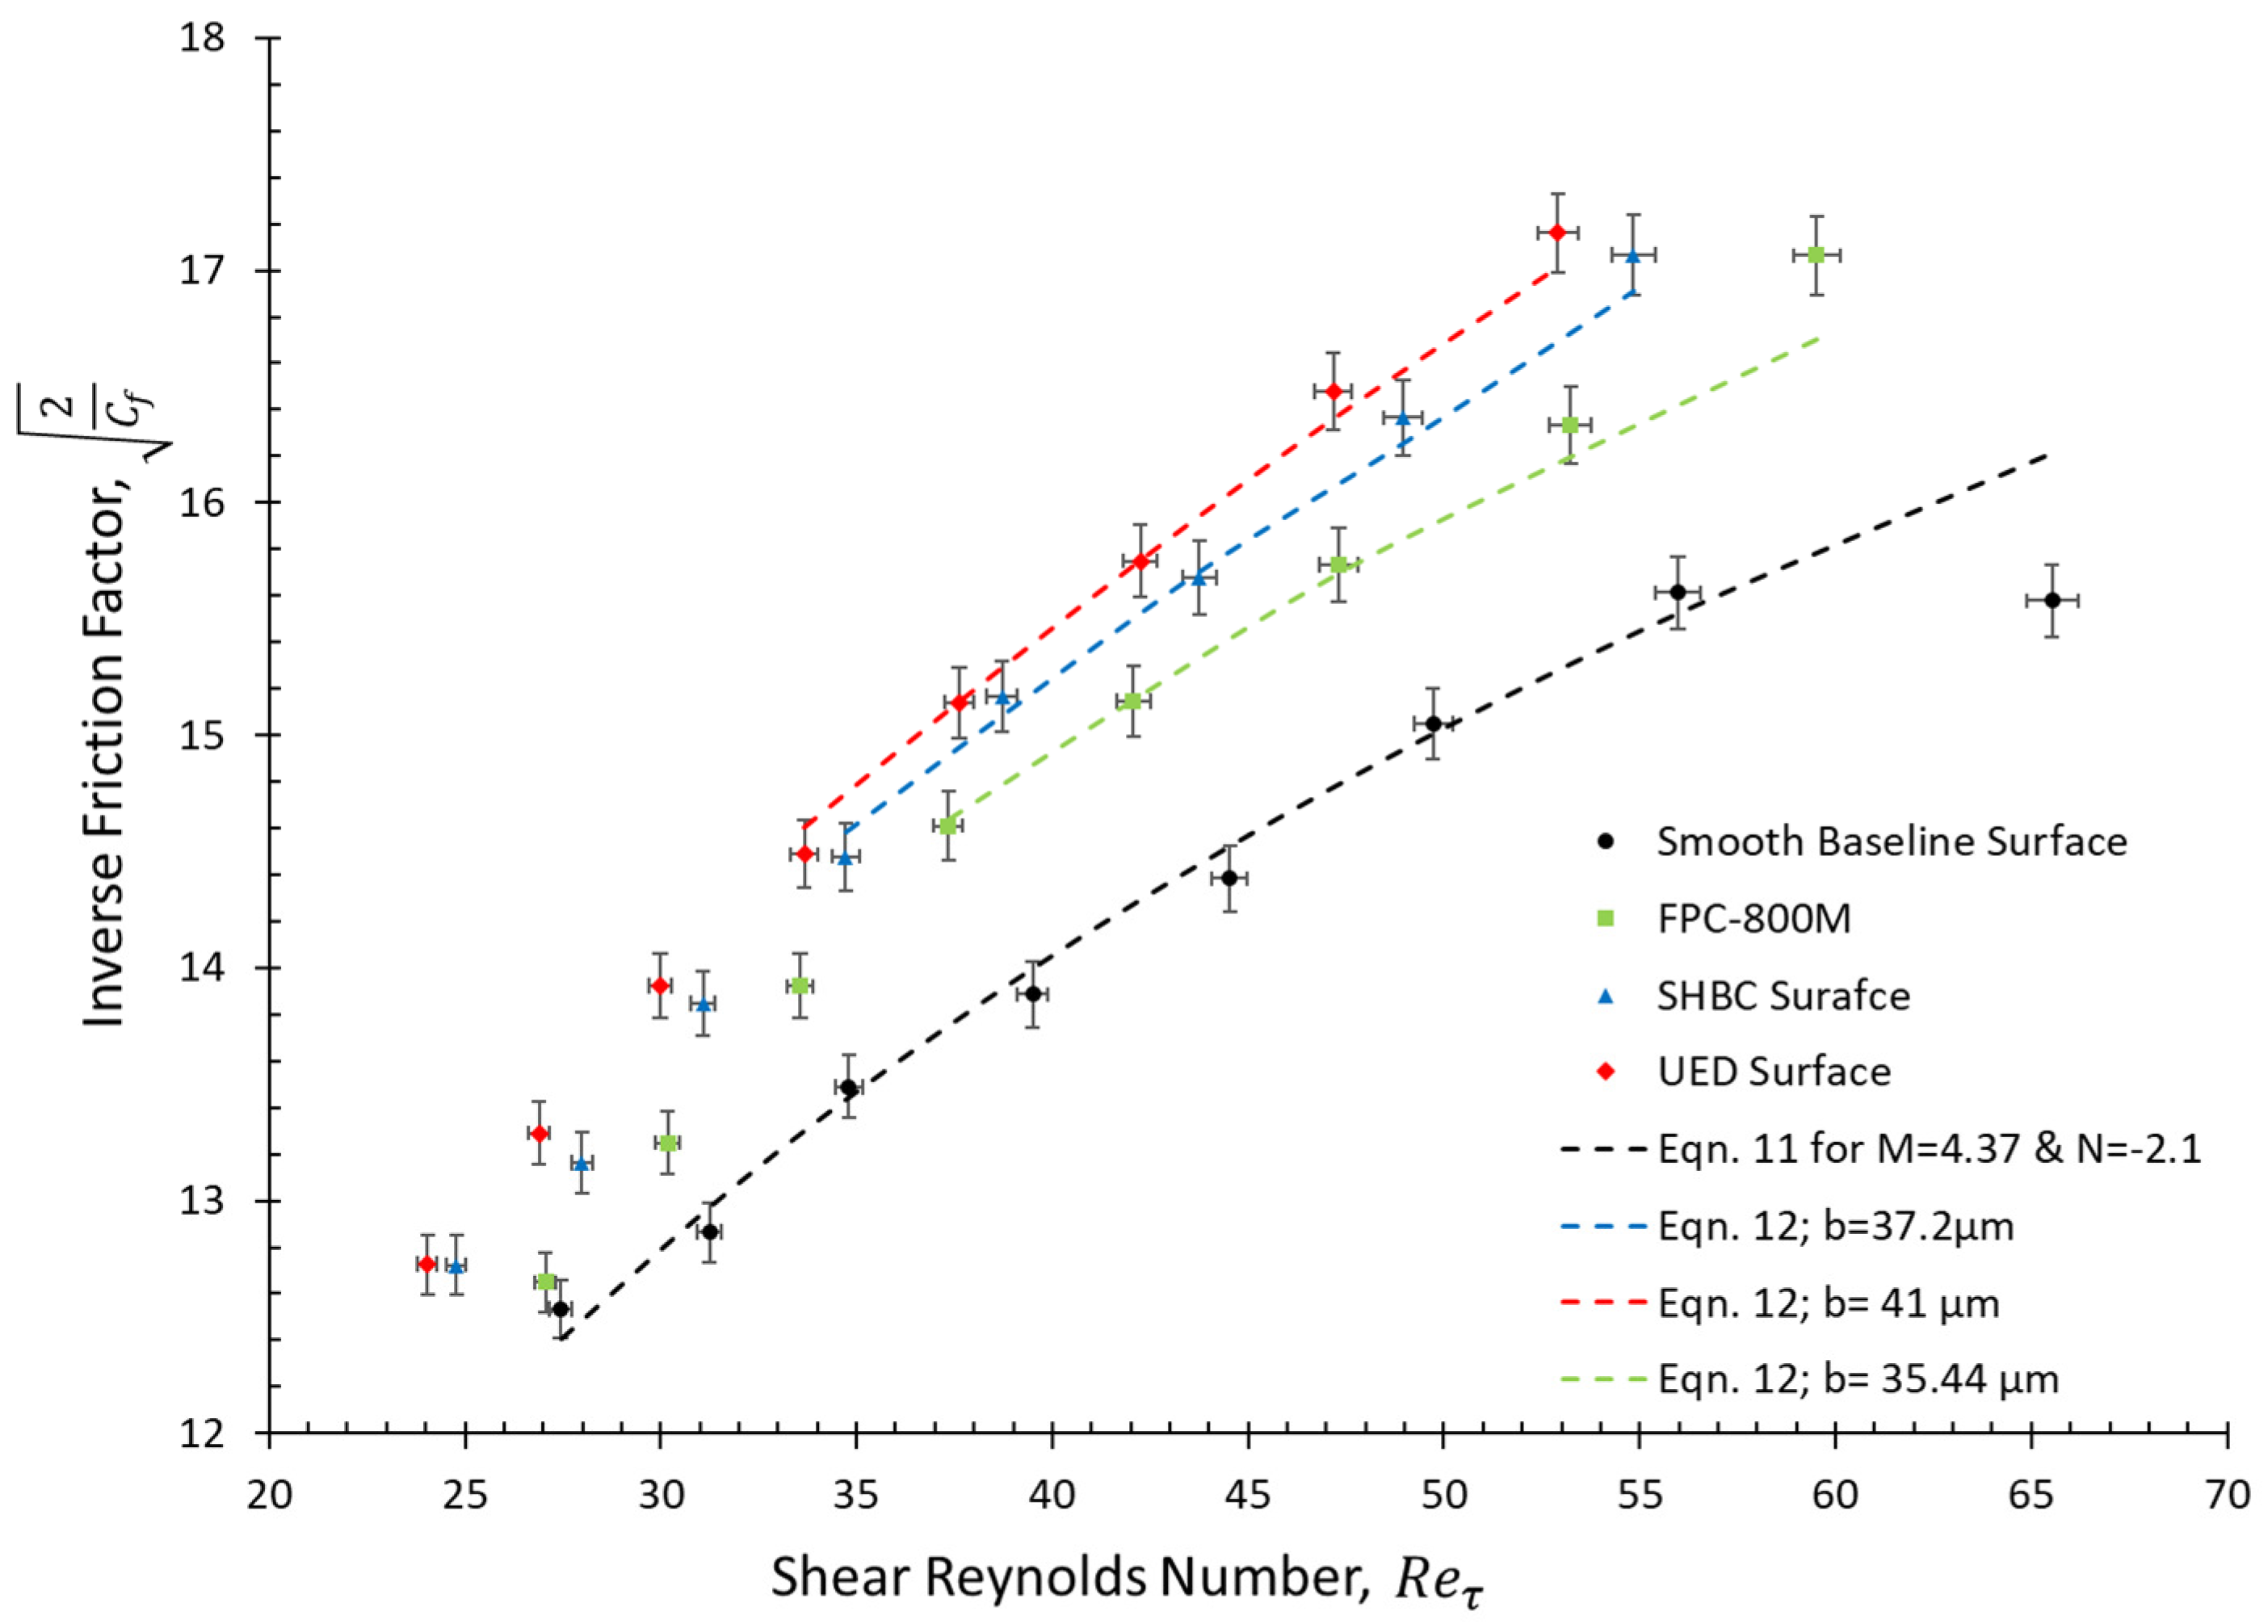
where M and N are constants that depend on the radius ratio (η = r i r o ) of the TC cell geometry. Plotting the baseline data curve allowed us to verify that our baseline measurements conformed to this logarithmic law. The measured skin friction coefficient data for the smooth outer surface were plotted in Prandtl–von Kármán coordinates (for Re > Rec1), as seen in Figure 6. A least-square fit of the smooth surface data to Equation (11) yielded the values M = 4.37 and N = −2.1 for the present TC cell, which has η = 0.92. With superhydrophobic coating applied on the outer surface of the TC cell, these areas become almost shear-free boundaries, which allow local flow to slip. The no-slip condition is still applied to the inner surface, which is the measuring bob. Srinivasan et al. [19] determined how the Navier slip adjusts the skin friction presented in Equation (11) when applied on the inner surface. They applied Panton’s angular momentum defect theory [42] and incorporated finite wall slips at the inner surface. The existence of the core region was verified experimentally and numerically with a weakly varying angular momentum dependence, as well as thin layers near the inner and outer cylinders, which are characterized by a sharp decay in the angular momentum [19,42,44].
Using the defect theory, Panton [42] matches the approximately constant angular momentum in the bulk of the TC flow to that of the wall layers to derive a logarithmic friction law of the form expressed in Equation (11). Srinivasan et al. [19] showed that the outer flow is significantly affected by a composite boundary condition that imposes an “effective” spatially averaged slip length at the rough SH wall. They modified this theory by deriving a friction law, analogous to Equation (11), for rough SH texture applied to the inner surface of their TC cell. A similar concept was used in this work to derive the friction law for rough SH texture applied to the outer TC cell surface (a detailed description of the derivation is given in the Supplemental Material). The obtained logarithmic friction law has the final form as follows:
2 C f = M ln R e C f 2 + N + b + ,
The dimensionless slip length is defined as b + = b e f f δ ν , where δ ν is the viscous length of the turbulent flow and is introduced as δ ν = ( ρ ν ) 2 τ ω . Whereas b + increases with the Reynolds number, as will be shown in the next subsection, earlier experimental and numerical works showed that the b+ is independent of the high Re in turbulent flows [8,19,45,46]. The effective slip length was estimated from the TC cell measurements using all fabricated SH surfaces in different flow regimes. The effective slip length is used as the characteristic parameter quantifying the drag-reducing ability of our SH surfaces. The TC cell in this work has a high radius ratio (0.92), which limited our ability to obtain data in the fully turbulent regime. The inverse of skin friction is no longer linearly related to the shear Reynolds number ( R e τ = R e · C f 2 ) when plotted in Prandtl–von Kármán coordinates due to the last term of b+ in Equation (12). A nonlinear regression for SH surfaces data using Equation (12) [8,19] results in the best-fit single-constant value of b+ for each SH surface. The experimentally measured data and corresponding fit data of Equation (12) are plotted in Figure 6. The present TC setup has a limited experimental range (limited Reynolds number), so the single value of b+ measures the friction-reducing performance of each surface, as shown in Figure 6. It can be seen that the UED in the regime of Re > Rec1 has a high value of the inverse friction coefficient compared to the PFC-800 and SHBC.

3.2. The Achieved Effective Slip Length

The torque measurements for the TC cell in the rheometer setup allow for calculating the apparent shear stress over the SH surfaces. Navier’s definition of slip velocity is
u s = b e f f d u d y ,
where beff is the slip length and d u d y is the shear rate. This general definition is not useful to describe the slip over the superhydrophobic surface, where the slip length is related to the way the liquid contacts the engineered surfaces. An effective slip length has been introduced to estimate the slippage over the fabricated hydrophobic surfaces [7,47,48]:
b e f f = M w o c M c 1 · d = τ w o c τ c 1 · d ,
where Mwoc is the measured torque without coating, and Mc is the torque with SH coatings. The ratio of these two torques can be used to find the effective slip length. Similarly, τ w o c τ c is the ratio of the measured shear stresses without coating and with the SH coating, which can also be used to find the effective slip length. In the rheometer measurements, the shear stress is related to the applied torque, which is affected by the surface wettability. One can see that from Equation (14), the slip length is directly related to the average shear stress that is by the viscous length, which is given as δ ν = ρ ν 2 τ c = ν u τ . In the laminar flow regime, the magnitude of effective slip length is governed by the surface feature–length scale and the wetted solid fraction [19]. For anisotropic and random surface morphology, the effective slip length is calculated in this study using Equation (14). In Figure 7, the calculated values of b+ for all fabricated surfaces are plotted against the Reynolds number. The laminar region has low slip length values, which agrees with the literature. The maximum slip length increases from the TVF regime, but a more explicit increase is seen from the WVF regime to the end of flow in the MWVF regime. The UED surface shows the highest b+ value of 16, with a mean effective slip length of beff ≈ 72 μm with a 95% upper confidence limit of 114 μm and a 95% lower confidence limit of 30 μm. The FPC-800M and SHBC showed the highest values at 14.4 and 14.2 for b+, respectively. Although the slip length varies with all surfaces through TVF and WVF regimes, the early stage of the MWVF regime shows a monotonically increase in the flow over all surfaces. The present TC cell with a high radius ratio (η = 0.92) did not allow measurement in the TTVF regime, despite a maximum rotational speed (Ω) of 1557 rpm being used.

3.3. The Air Plastron Thickness

Since the existence and condition of the plastron are more difficult to maintain and measure in the TC flows, it is critical to explore the impacts of random roughness morphology surface and Reynolds number on the plastron. The capillary force of the air–water interface trapped on the asperity (roughness) top counteracts the hydrostatic pressure of water, causing the concave deflection [10]. Suppose the local contact angle of water on the sidewall of roughness exceeds the advancing contact angle. In that case, the interface is depinned (released) from the asperity top and slides into the roughness, therefore initiating the wetting transition. There would be no precise critical hydrostatic pressure if the roughness were random [10]. Instead, as hydrostatic pressure increases, the plastron becomes thinner and thinner. The plastron and the DR are lost as the SH surface transitions from a non-wetted (Cassie–Baxter state) to a wetted (Wenzel) state. As the Wenzel state is often the thermodynamically more preferred state, preventing or delaying this transition is critical. Two mechanisms can accomplish this transition by using SH coatings: first, by lowering the size (spaces between nanoparticles) of the asperities in which the air is trapped in order to enhance the Laplace pressure; second, by increasing the surface’s hydrophobicity (reducing the surface energy). Another thing to consider in maintaining DR is the diffusion of air from the plastron into the liquid, which may be accomplished by increasing the amount of saturated air in the liquid [16,17,49,50]. Many previous studies in the literature showed that in high flow velocity, the air plastron volume could be lost by the convection–diffusion mechanism [8,16]. Flows with large velocities produce shorter effective diffusion lengths, resulting in an accelerated dissolving of the air plastron into the liquid [18]. Turbulent flows with Reynolds number of (5 × 10⁵ ≤ Re ≥ 1.5 × 10⁶) showed steady movement and variations in the thickness of the air plastron, which was caused by the pressure fluctuations in the flow boundary layer [23].
Many previous studies were performed experimentally and analytically to determine the thickness of the air plastron [50,51]. The slippage viscous model introduced by Olga V. [52] says that if the surface is considered ideal (neglecting the roughness effect), and an average value μa characterizes the viscosity of the air plastron adjacent to the wall, the slip length due to the thickness of air plastron δ can be expressed as follows:
δ = b e f f ( μ l μ a 1 ) ,
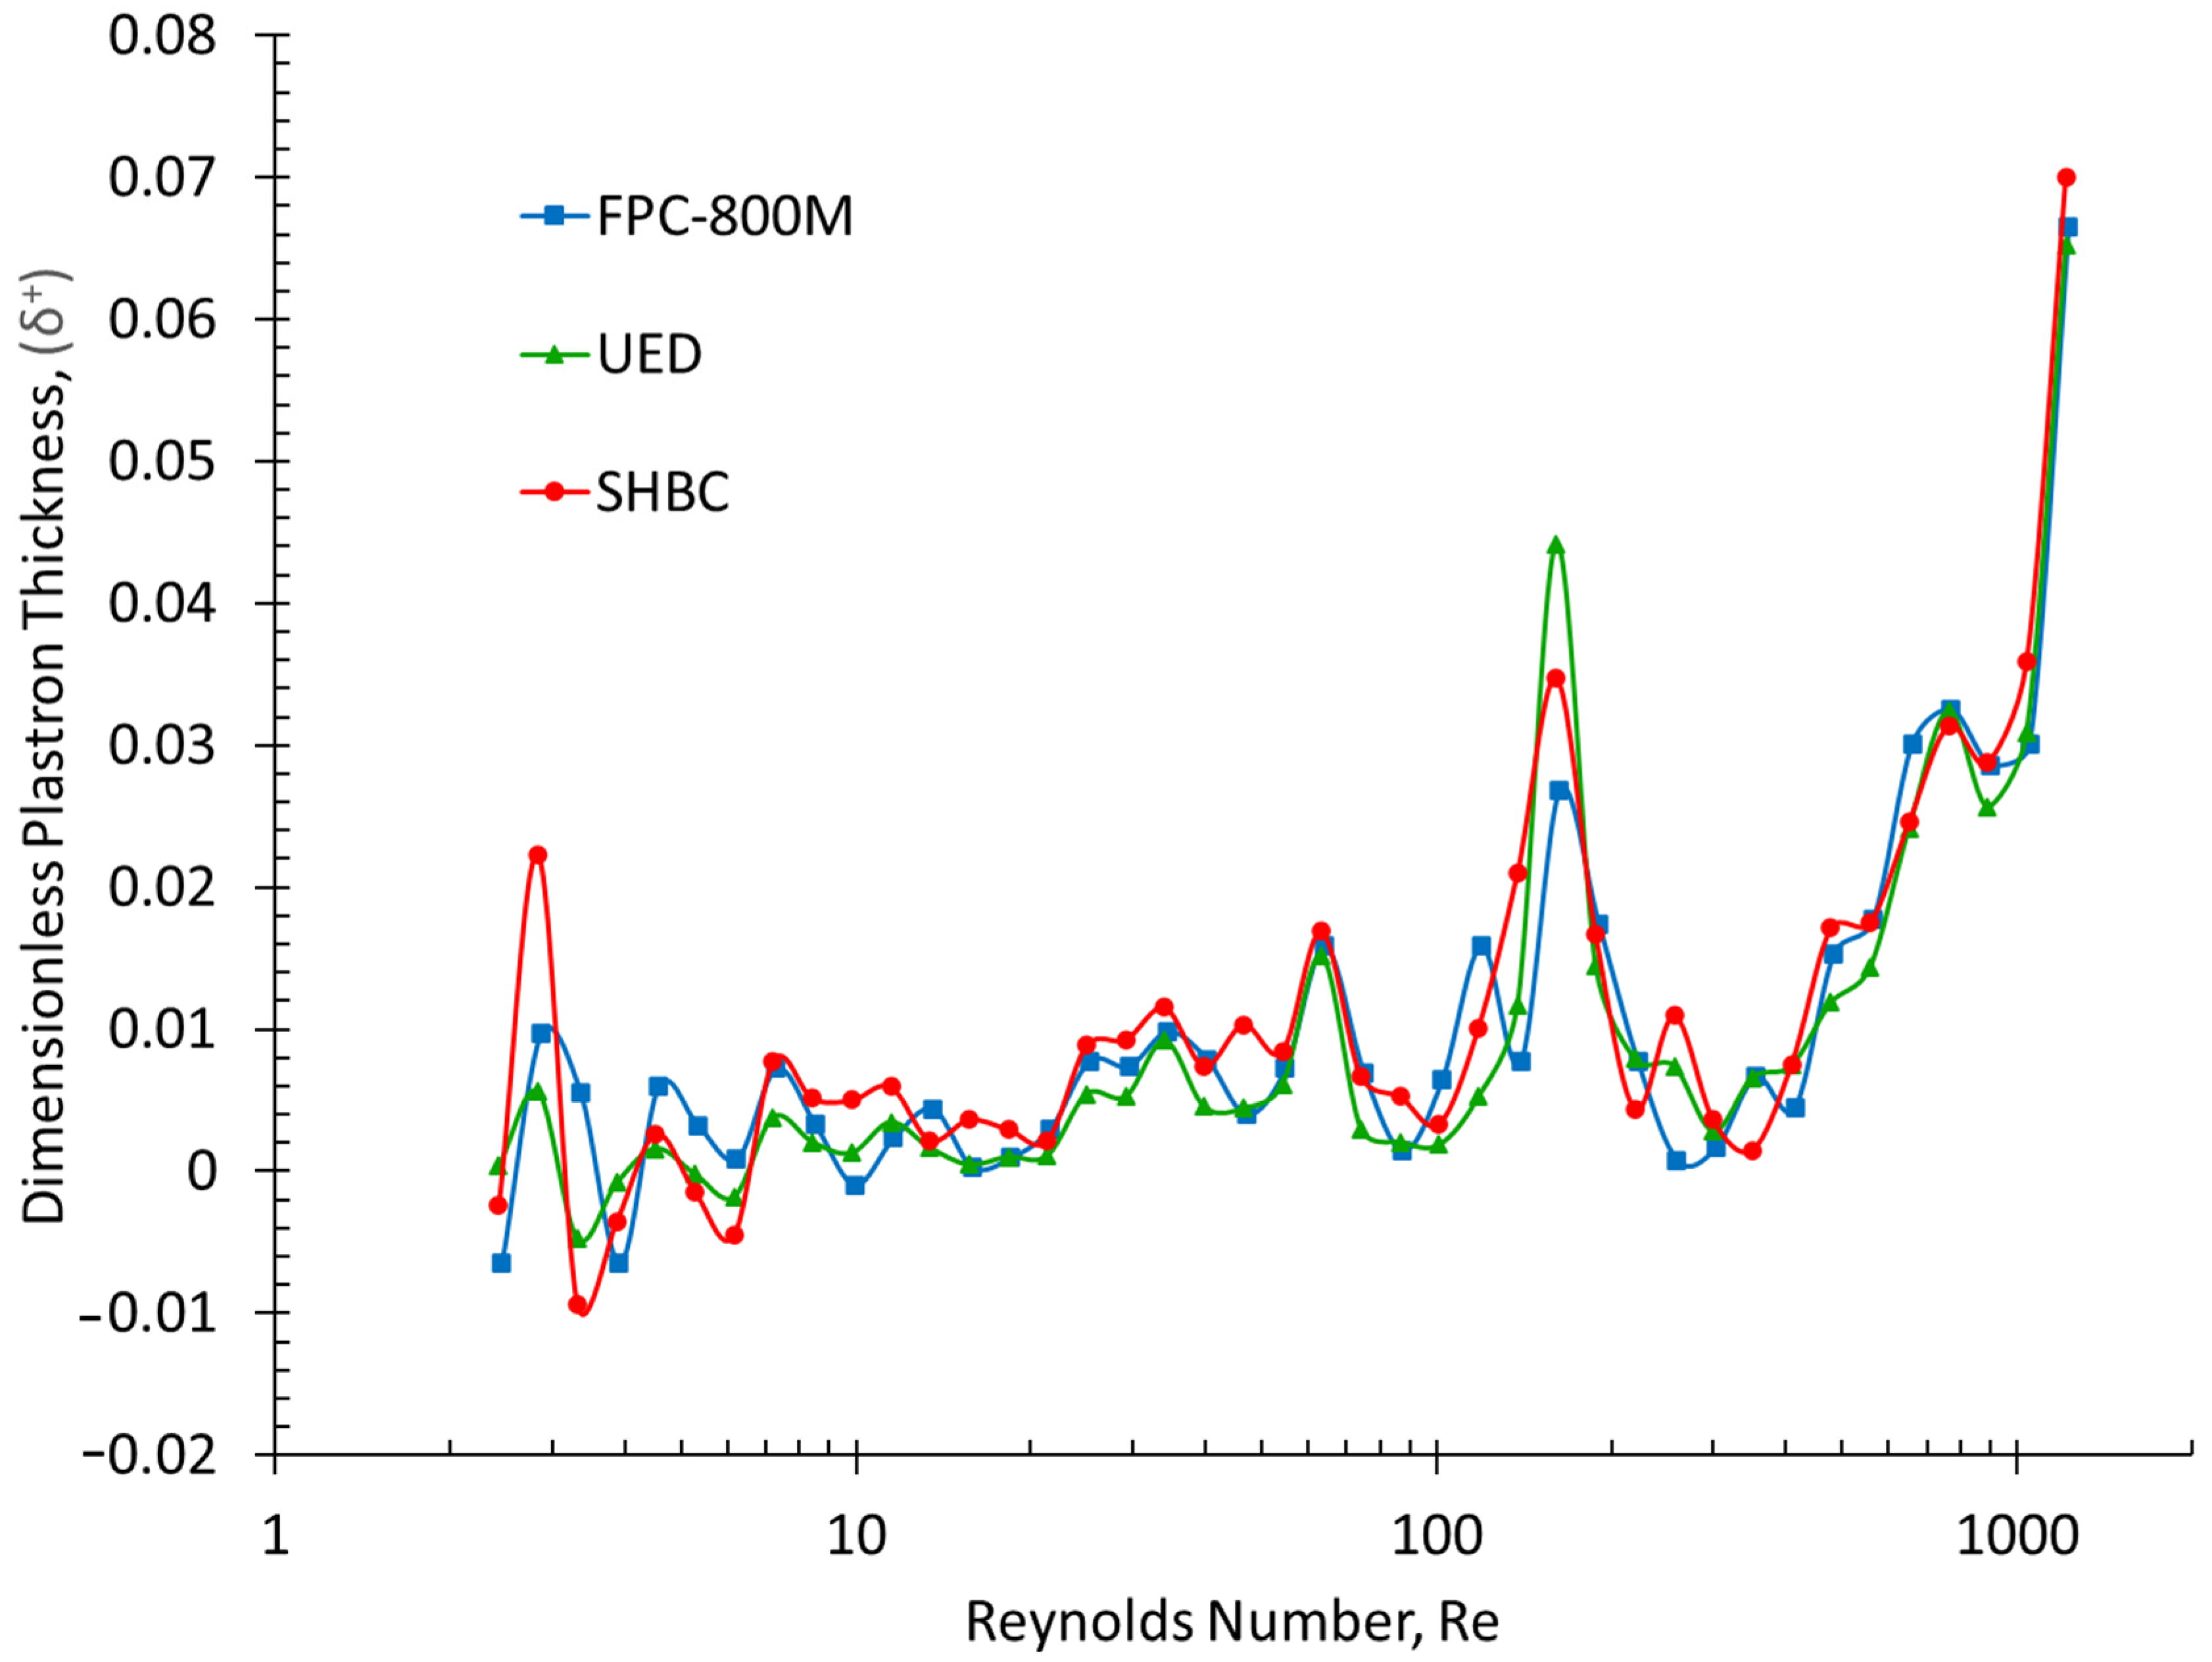
Although the fabricated CDCs have a 42 mL capacity in the present work, they are filled with just 19 mL of tested fluid, which means the SH surface is not fully submerged; this was implemented to create a connection between the air plastron and the ambient air in the lab (see Figure 1a). Based on Srinivasn’s work [19], this procedure offered more drag reduction than the case where the air plastron was isolated for the same Reynolds number in their study. Figure 8 presents the present study’s dimensionless air plastron thickness δ+ for all fabricated surfaces versus the used Reynolds number. Although the maximum Reynolds number in the present work is lower than the turbulent Reynolds number mentioned in the literature, it can be seen that the air plastron thickness is close to being constant among each fluid flow. The results of air plastron thickness δ are directly proportional to the slip length, as shown in Figure 7 and Figure 8, which have around 4.2 μm over all fabricated surfaces. The geometry of the TC setup used in the present work did not show high Reynolds number flows, which placed limitations on observing any change in the air plastron thickness over all the used surfaces.

3.4. Regression Analysis for the Slip Length and the Air Plastron Thickness

The rheometer data were analyzed to study the relationship between the dimensionless plastron thickness (the dependent variable) and several predictor variables: the dimensionless slip length, the ratio of the dynamic viscosity of water to air, the Reynolds number, and the advancing dynamic contact angle as a measure of wettability. Those predictors are the most important parameters that significantly impact the dependent’s value. This statistical analysis aimed to understand how these predictor variables influence the dimensionless plastron thickness and to make predictions about the thickness based on known values of the predictor variables. The multiple linear regression (MLR) method was used to analyze the data using the statistical package from the IBM SPSS software. A model was statistically formulated for the predicted dimensionless air plastron thickness δ+. Overall, 164 measured points for all 3 SH surfaces and 1 smooth surface are used; the descriptive statistics are presented in Table 2. Various options and preferences in the setting can be customized by the user to modify the behaviour of the SPSS software, such as data editor, output viewer, syntax editor, and general settings. These settings can be accessed and modified through the “Options” menu in SPSS. The regression model presents the impact of the predictors on the dependent δ+, which is summarized in Equation (16), and the model summary is illustrated in Table 3 with the coefficient of determination R2 = 0.871.
δ + = 2 + 5 · b + + 0.0358 · μ W μ a + 0.01066 · R e + 0.0001 · C o s θ a d v ,
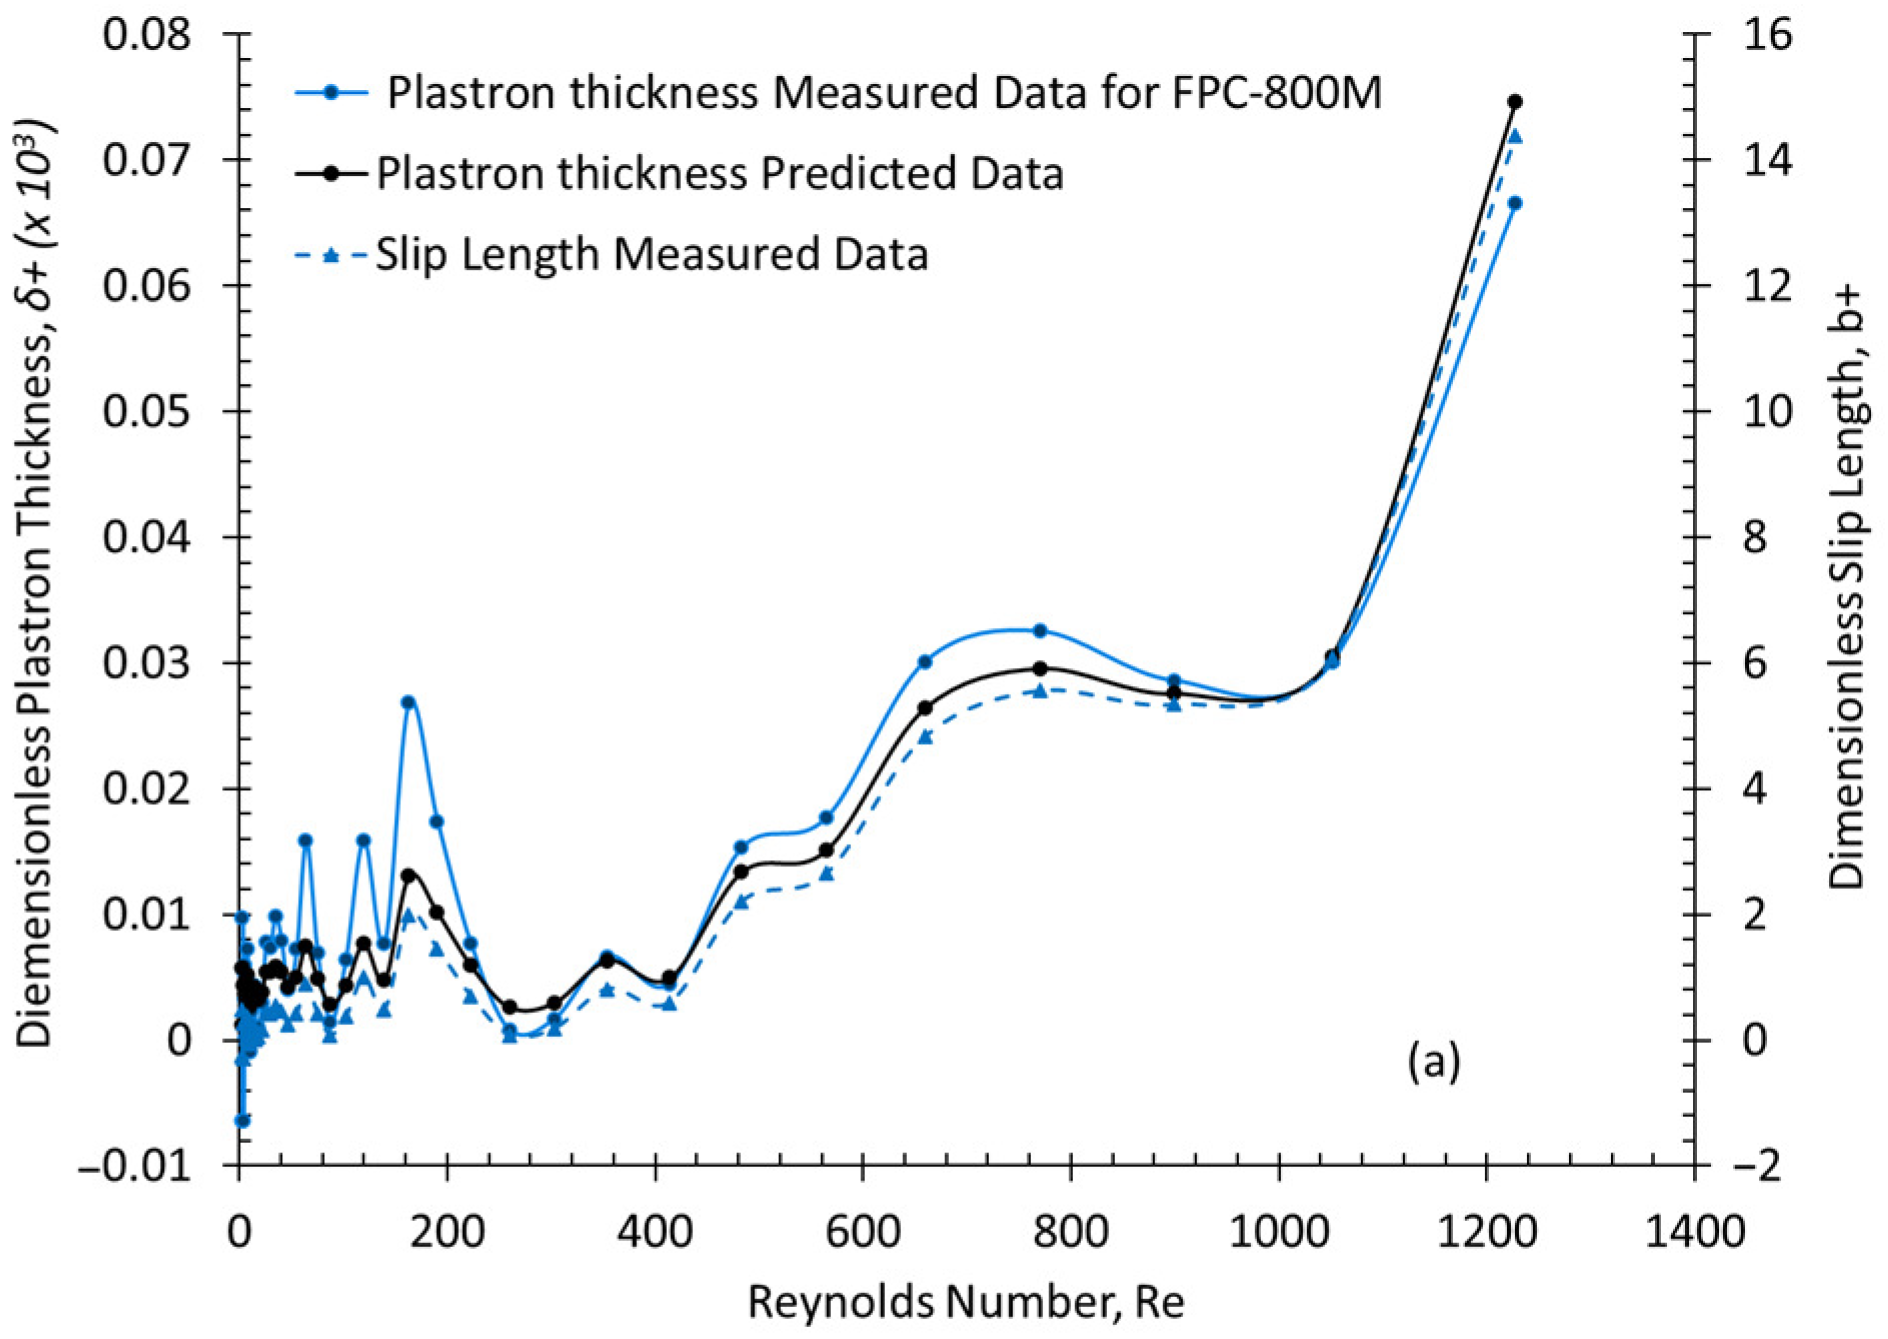
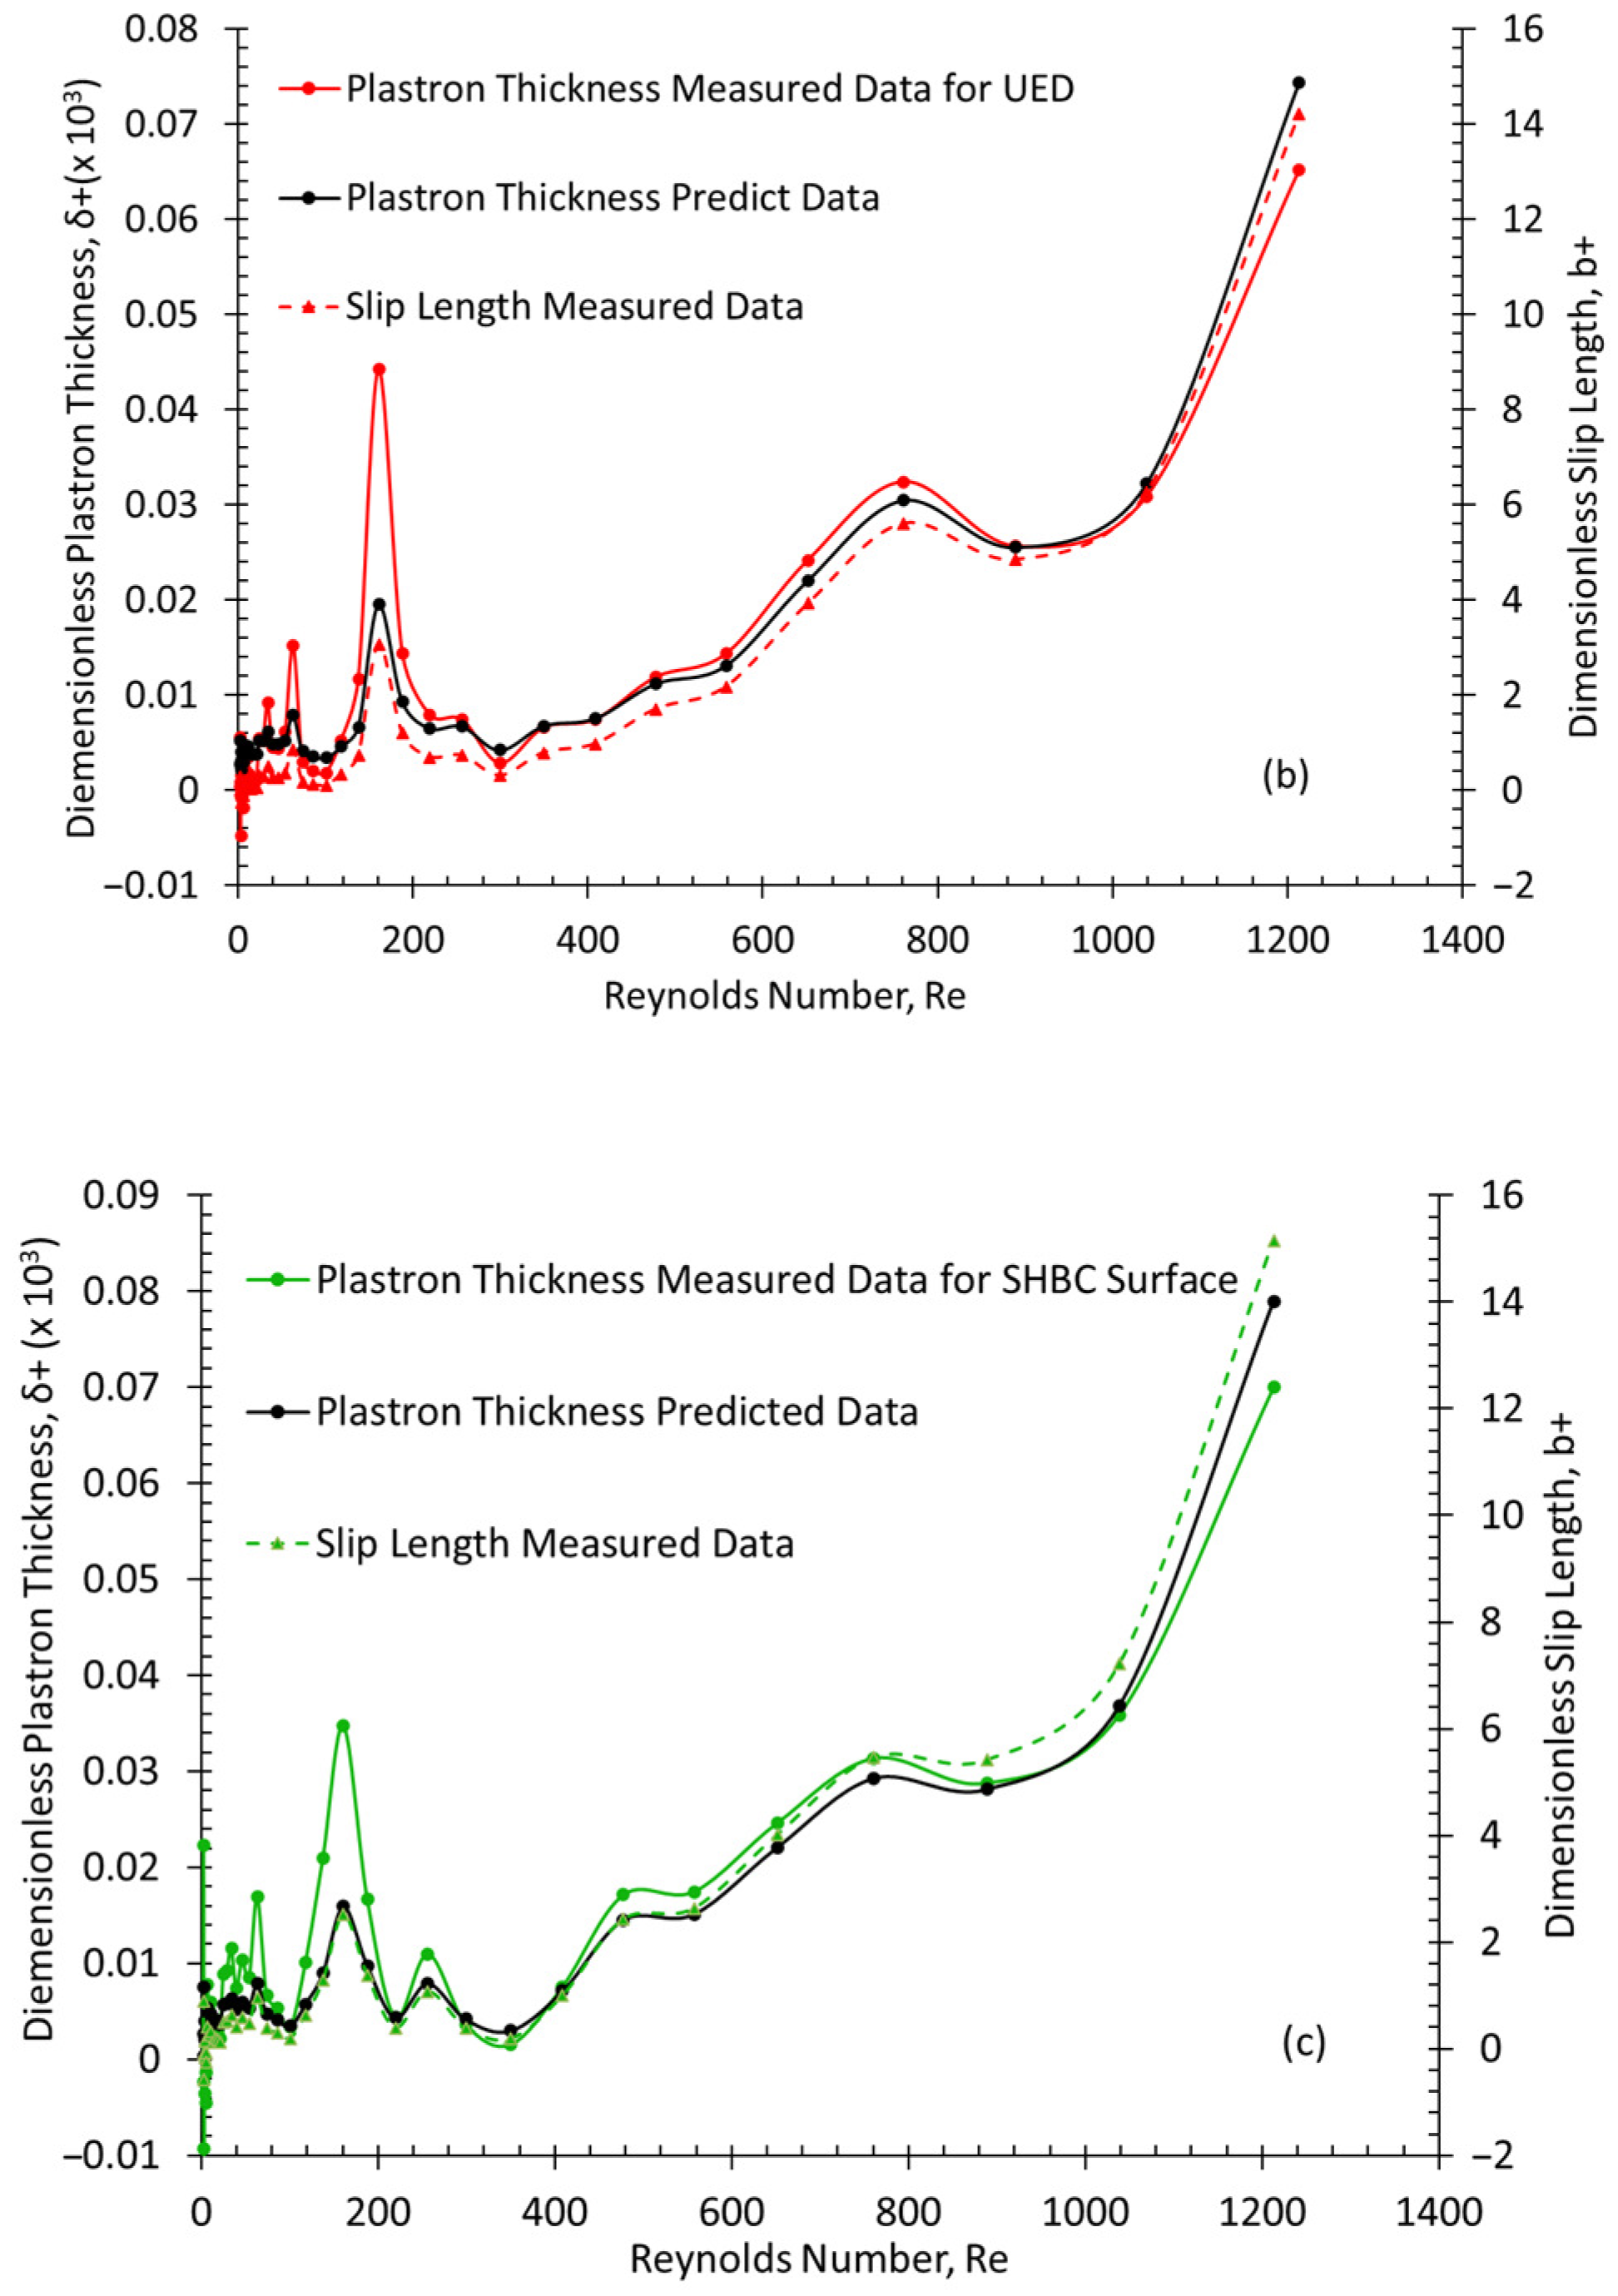
The measured and predicted δ+ and b+ are presented individually in Figure 9 for each tested SH surface. It was revealed from the regression analysis that all the predictors have a positive impact on the predicted δ+. In other words, all predictors are positively associated with the predicted δ+. The predicted and measured dimensionless air plastron thickness δ+ for each used SH surface was compared with the achieved dimensionless slip length b+. Figure 9a–c present the variation of the predicted and measured δ+ vs. the operating Reynolds numbers for the UED, FPC-800, and SHBC. The regression model agrees well with the measured δ+ for all surfaces; it shows a statistically significant 95% confidence level.
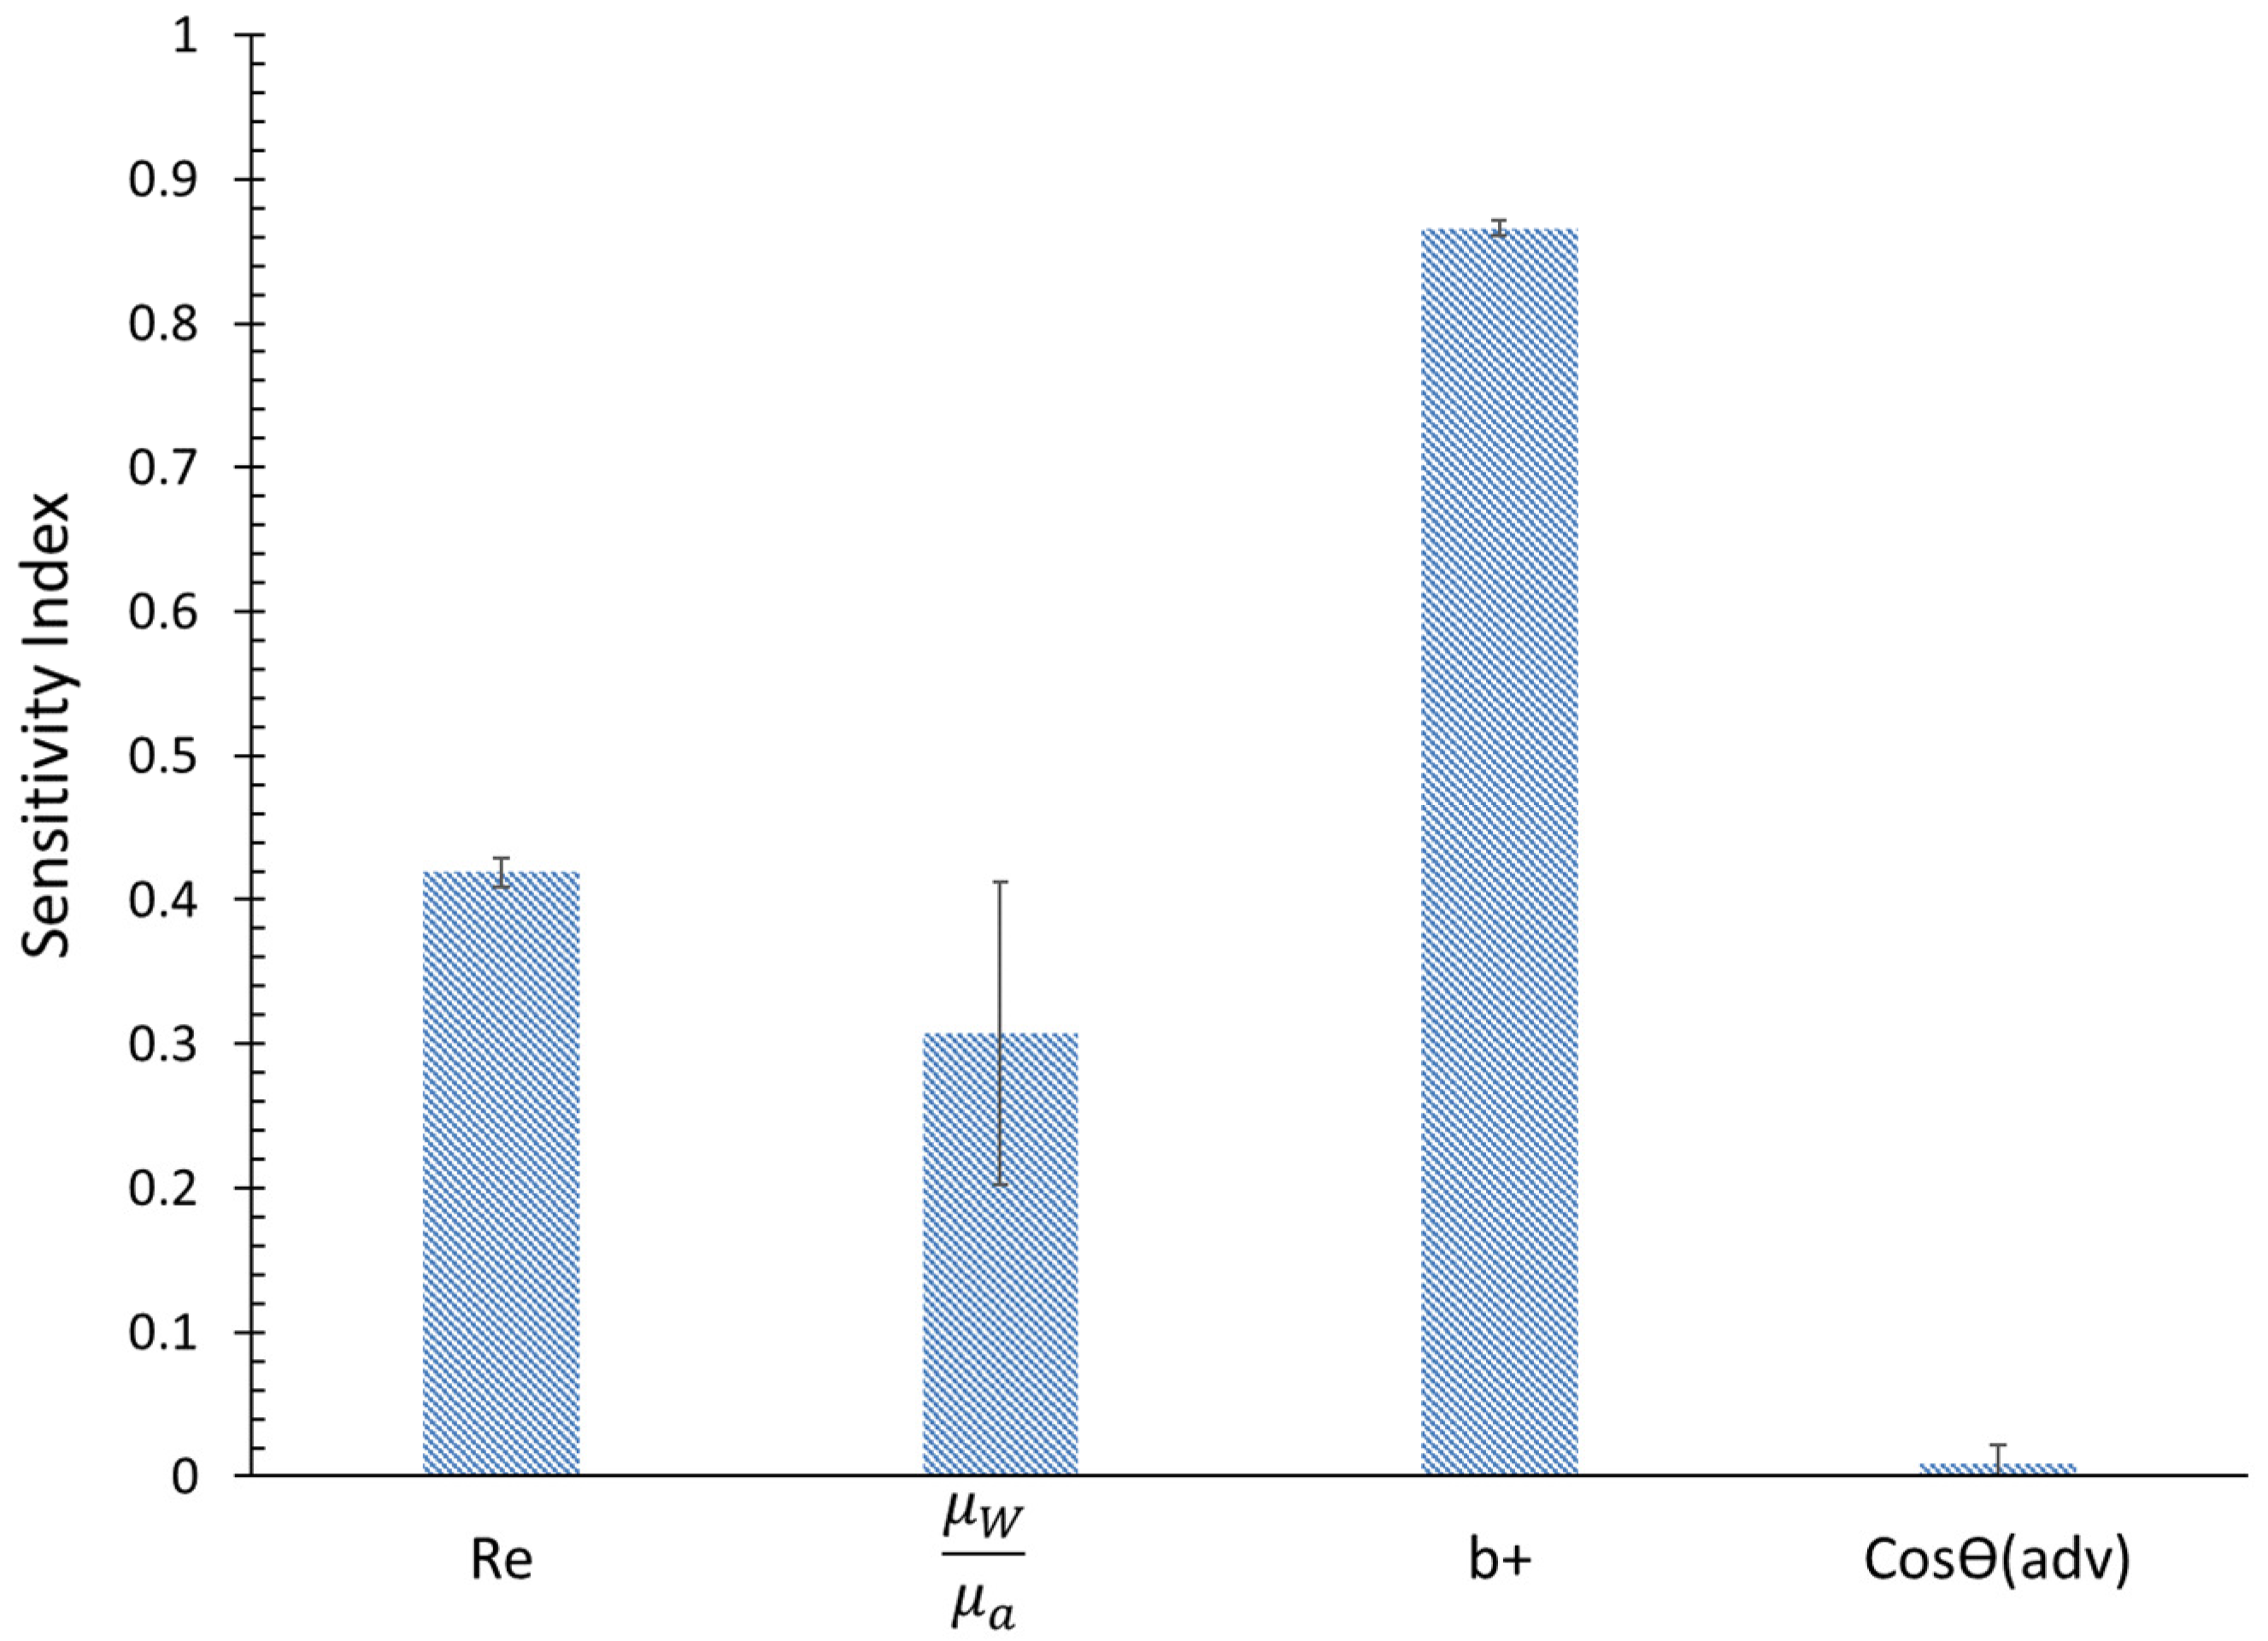
Furthermore, the comparison between the achieved values and the predicted δ+ and measured b+ values showed a high level of correlation. A sensitivity analysis was performed using the stepwise method to investigate each predictor’s effect and determine the most significant predictor’s impact on the model. The sensitivity analysis indicates that the b+, Reynolds number, and the dynamic viscosity ratio are the most influential parameters that affect the regression model, as illustrated in Figure 10. It shows the sensitivity index of all predictors, and the achieved b+ has the highest sensitivity index of 0.87 with the lowest RMSE of 0.005. On the contrary, the advancing dynamic contact angle (Ɵadv) has the lowest sensitivity index of 0.01. This small contribution of (Ɵadv) interprets the limited wetting degrees of the three tested samples and one plain sample used in the present work. In comparison, the b is the major predictor parameter affecting the regression model, which is expected, as introduced in the slippage viscous model of Equation (15).

4. Conclusions

In this paper, the plastron thickness and its relation to the slip length above three SHSs was investigated experimentally and statistically. A rheometer was utilized to measure the torque of submerged flow tests with three different SHSs and a smooth surface as a reference, using CDCs as the torque-measuring cells at a maximum Reynolds number of 1227, characterized by measuring the θs and θadv. The main findings of this paper can be summarized as follows:
  • Despite minor variations among the tested surfaces, the UED demonstrated the highest static and advanced dynamic contact angles. The used TC cell showed limited turbulence due to its high radius ratio of 0.92, which enabled the flow structure phase diagram to reach the MWVF region at a high rotational speed provided by the rheometer before entering the TTVF region.
  • A modified version of the Prandtl–von Kármán skin friction law was developed by applying boundary layer (angular momentum defect) theory to turbulent TC flow. The study allowed for the determination of an effective slip length, “b”, that describes the non-wetting behaviour of superhydrophobic surfaces (SHS) on the outer wall of the TC cell used in WVF and MWVF regions. The results demonstrate that even though super hydrophobic surfaces typically exhibit effective slip lengths of only a few micrometers, they are capable of reducing skin friction in the early turbulent stages (WVT-MWVT) flows.
  • A slippage viscous model is used to calculate the plastron thickness at each Reynolds number for all tested SHSs. The comparisons of all the measurement data show a clear relationship between the plastron thickness and the slip length; the UED surface has the highest values of δ+ and b+ among the tested surfaces.
  • The attainable drag reduction in TC flows with the three fabricated SHSs is in the range of 7 to 11%.
  • The developed regression model shows a direct relation between δ+ and b+ for all tested SHSs. The comparisons between the predicted and measured data showed good agreement. Although there is a small difference in the wetting degree between the tested SHSs, the plastron thickness is directly proportional to the slip length and the water/air dynamic viscosity ratio. The limited number of tested surfaces showed a low impact on the regression model.
Further investigations could entail conducting experiments to measure the DR% under various liquids with varying viscosities while keeping the same SHSs to gain insight into the drag reduction mechanism. Additionally, a TC flow configuration with a more extensive TC cell gap distance could be employed to reach the MWVF and TTVF regimes while maintaining the same applied shear rate as the current study. The accumulation of these data would enable the creation of a statistical model utilizing regression analysis to determine the effect of the predicted parameters on the plastron thickness relative to the present setup.

Supplementary Materials

The following supporting information can be downloaded at: https://www.mdpi.com/article/10.3390/fluids8040133/s1, Supplementary Material: Defect Theory Derivation of the Outer Wall of Taylor-Couette Cell Flow.

Author Contributions

A.F.A.A.: Conceptualization; methodology; validation; formal analysis; investigation; data curation; review and editing, X.D. data curation; Review—Editing; Supervision; project administration; funding acquisition; resources, Y.S.M.: Supervision; Project Administration; Review—Editing. All authors have read and agreed to the published version of the manuscript.

Funding

The Natural Sciences and Engineering Research Council of Canada (NSERC) Discovery Grants for the second author (Grant Number: RGPIN-2021-02504). The first author is also funded under the Libyan Ministry of Education grant, and Memorial University has provided financial support for this study.

Data Availability Statement

The data that support the findings of this study are available upon reasonable request from the authors.

Acknowledgments

We thank Anand Yethiraj for his input in the experimental work. The research was founded by the Natural Sciences and Engineering Research Council of Canada (NSERC) Discovery Grant for the second author. The first author is also funded under the Libyan Ministry of Education grant, and Memorial University has provided financial support for this study. The authors would also like to thank the Memorial University Libraries Open Access Author Fund, which assisted with funding this paper.

Conflicts of Interest

The authors declare that they have no conflict of interest that could have appeared to influence the work reported in this paper.

Nomenclature

Abbreviation
DRDrag Reduction
SHSSuperhydrophobic Surface
SCAStatic Contact Angle
CAHContact Angle Hysteresis
CDCConcentric Disposal Cups
SEMScanning Electron Microscope
TCTaylor–Couette
Letters
bSlip Length
b+Dimensionless Slip Length
beffEffective Slip Length
CLThe End Effect Correction Factor
CfFriction Coefficient
dTC Gap Distance
GDimensionless Global Torque
nRotational Speed
NConstant based on Radius Ratio
MConstant based on Radius Ratio
MCGlobal Torque over Superhydrophobic Surface
MWOCGlobal Torque over Smooth Surface
riInner radius of the TC cell
roOuter radius of the TC cell
ReReynolds number
ReτShear Reynolds number
uStreamwise velocity
uτFriction Velocity
UiMeasured Velocity
yNormal flow axis
Greek Symbols
αTorque Exponent
ΔRatio of Radii
δPlastron Thickness
δ+Dimensionless Plastron Thickness
δ ν Viscous Length
ρDensity
ηRadius Ratio
γ ˙ Shear Rate
ΓLength to Gap Ratio
µDynamic Viscosity
µaAir Dynamic Viscosity
µwWater Dynamic Viscosity
νKinematic Viscosity
τShear Stress
τcCoating surface shear stress
τwSmooth surface (wall) shear stress
ωAngular Speed

References

  1. Sullivan, A.; Duan, X. Anti-icing performance of a superhydrophobic and electrothermal coating on metallic substrates. In Proceedings of the 8th Thermal and Fluids Engineering Conference (TFEC-2023), Collage Park, MD, USA, 26–31 March 2023; p. 45657. [Google Scholar]
  2. Shi, T.; Liang, J.; Li, X.; Zhang, C.; Yang, H. Improving the corrosion resistance of aluminum alloy by creating a superhydrophobic surface structure through a two-step process of etching followed by Polymer modification. Polymers 2022, 14, 4509. [Google Scholar] [CrossRef] [PubMed]
  3. Nanda, D.; Varshney, P.; Satapathy, M.; Mohapatra, S.S.; Bhushan, B.; Kumar, A. Single step method to fabricate durable superliquiphobic coating on aluminum surface with self-cleaning and anti-fogging properties. J. Colloid Interface Sci. 2017, 507, 397–409. [Google Scholar] [CrossRef] [PubMed]
  4. Alsharief, A.; Duan, X.; Nyantekyi-Kwakye, B.; Muzychka, Y. Experimental investigation of drag reduction over superhydrophobic surfaces in an open channel flow. In Proceedings of the 8th Thermal and Fluids Engineering Conference (TFEC-2023), Collage Park, MD, USA, 26–31 March 2023; p. 45753. [Google Scholar]
  5. Lee, C.; Choi, C.H.; Kim, C.J. Superhydrophobic drag reduction in laminar flows: A critical review. Exp. Fluids 2016, 57, 176. [Google Scholar] [CrossRef]
  6. Cassie, A.; Baxter, S. Wettability of porous surfaces. Faraday Soc. Trans. 1944, 40, 546–550. [Google Scholar] [CrossRef]
  7. Srinivasan, S.; Choi, W.; Park, K.C.; Chhatre, S.S.; Cohen, R.E.; McKinley, G.H. Drag reduction for viscous laminar flow on spray-coated non-wetting surfaces. Soft Matter. 2013, 9, 5691–5702. [Google Scholar] [CrossRef]
  8. Rajappan, A.; Golovin, K.; Tobelmann, B.; Pillutla, V.; Choi, W. Influence of textural statistics on drag reduction by scalable, randomly rough superhydrophobic surfaces in turbulent flow. Phys. Fluids 2019, 31, 042107. [Google Scholar] [CrossRef]
  9. Golovin, K.B.; Gose, J.; Perlin, M.; Ceccio, S.L.; Tuteja, A. Bioinspired surfaces for turbulent drag reduction. Philos. Trans. R. Soc. A Math. Phys. Eng. Sci. 2016, 374, 20160189. [Google Scholar] [CrossRef]
  10. Park, H.; Choi, C.H.; Kim, C.J. Superhydrophobic drag reduction in turbulent flows: A critical review. Exp. Fluids 2021, 62, 229. [Google Scholar] [CrossRef]
  11. Fu, Y.F.; Yuan, C.Q.; Bai, X.Q. Marine drag reduction of shark skin inspired riblet surfaces. Biosurface Biotribol. 2017, 3, 11–24. [Google Scholar] [CrossRef]
  12. Sreenivasan, K.R.; White, C.M. The onset of drag reduction by dilute polymer additives, and the maximum drag reduction asymptote. J. Fluid Mech. 2000, 409, 149–164. [Google Scholar] [CrossRef]
  13. Samaha, M.A.; Tafreshi, H.V.; Gad-el-Hak, M. Superhydrophobic surfaces: From the lotus leaf to the submarine. Comptes Rendus Mec. 2012, 340, 18–34. [Google Scholar] [CrossRef]
  14. Piao, L.; Park, H. Two-Dimensional Analysis of Air-Water Interface on Superhydrophobic Grooves under Fluctuating Water Pressure. Langmuir 2015, 31, 8022–8032. [Google Scholar] [CrossRef]
  15. Ou, J.; Perot, B.; Rothstein, J.P. Laminar drag reduction in microchannels using ultrahydrophobic surfaces. Phys. Fluids 2004, 16, 4635–4643. [Google Scholar] [CrossRef]
  16. Bullee, P.A.; Verschoof, R.A.; Bakhuis, D.; Huisman, S.G.; Sun, C.; Lammertink, R.G.H.; Lohse, D. Bubbly drag reduction using a hydro-phobic inner cylinder in Taylor-Couette turbulence. J. Fluid Mech. 2019, 883, A61. [Google Scholar] [CrossRef]
  17. Zhang, P.; Lv, F.Y. A review of the recent advances in superhydrophobic surfaces and the emerging energy-related applica-tions. Energy 2015, 82, 1068–1087. [Google Scholar] [CrossRef]
  18. Xiang, Y.; Huang, S.; Lv, P.; Xue, Y.; Su, Q.; Duan, H. Ultimate Stable Underwater Superhydrophobic State. Phys. Rev. Lett. 2017, 119, 134501. [Google Scholar] [CrossRef]
  19. Srinivasan, S.; Kleingartner, J.A.; Gilbert, J.B.; Cohen, R.E.; Milne, A.J.B.; McKinley, G.H. Sustainable drag reduction in turbulent Tay-lor-Couette flows by depositing sprayable superhydrophobic surfaces. Phys. Rev. Lett. 2015, 114, 014501. [Google Scholar] [CrossRef]
  20. Vajdi Hokmabad, B.; Ghaemi, S. Turbulent flow over wetted and non-wetted superhydrophobic counterparts with random structure. Phys. Fluids 2016, 28, 015112. [Google Scholar] [CrossRef]
  21. Hokmabad, B.V.; Ghaemi, S. Effect of Flow and Particle-Plastron Collision on the Longevity of Superhydrophobicity. Sci. Rep. 2017, 7, srep41448. [Google Scholar] [CrossRef]
  22. Seo, J.; Mani, A. Effect of texture randomization on the slip and interfacial robustness in turbulent flows over superhydro-phobic surfaces. Phys. Rev. Fluids 2018, 3, 044601. [Google Scholar] [CrossRef]
  23. Reholon, D.; Ghaemi, S. Plastron morphology and drag of a superhydrophobic surface in turbulent regime. Phys. Rev. Fluids 2018, 3, 104003. [Google Scholar] [CrossRef]
  24. Ling, H.; Srinivasan, S.; Golovin, K.; McKinley, G.H.; Tuteja, A.; Katz, J. High-resolution velocity measurement in the inner part of turbulent boundary layers over superhydrophobic surfaces. J. Fluid Mech. 2016, 801, 670–703. [Google Scholar] [CrossRef]
  25. Gose, J.W.; Golovin, K.; Boban, M.; Mabry, J.M.; Tuteja, A.; Perlin, M.; Ceccio, S.L. Characterization of superhydrophobic surfaces for drag reduction in turbulent flow. J. Fluid Mech. 2018, 845, 560–580. [Google Scholar] [CrossRef]
  26. Lee, C.; Choi, C.H.; Kim, C.J. Structured surfaces for a giant liquid slip. Phys. Rev. Lett. 2008, 101, 064501. [Google Scholar] [CrossRef]
  27. Perlin, M.; Ceccio, S. Mitigation of Hydrodynamic Resistance-Methods to Reduce Hydrodynamic Drag; Mitigation of Hydro-dynamic Resistance; World Scientific Co Pte. Ltd.: Hackensack, NJ, USA, 2015. [Google Scholar]
  28. Reinke, P.; Schmidt, M.; Beckmann, T. The cavitating Taylor-Couette flow. Phys. Fluids 2018, 30, 104101. [Google Scholar] [CrossRef]
  29. Vinogradova, O.I. Drainage of a thin liquid film confined between hydrophobic surfaces. Langmuir 1995, 11, 2213–2220. [Google Scholar] [CrossRef]
  30. AP Inc. MCR 302e Manuel and Guideline; Paar, A., Ed.; AP Inc.: Quebec, QC, Canada, 2015. [Google Scholar]
  31. Lathrop, D.P.; Fineberg, J.; Swinney, H.L. Transion to shear driven turbulence in couette taylor flow. Phys. Rev. A 1992, 46, 6390. [Google Scholar] [CrossRef]
  32. Maurice Frédéric Alfred Couette. Études sur le Frottement des Liquides; Gauthier-Villars: Paris, France, 1890. [Google Scholar]
  33. Lathrop, D.P.; Fineberg, J.; Swinney, H.L. Turbulent flow between concentric rotating cylinder at large Reynolds number. Phys. Rev. Lett. 1992, 68, 1515–1519. [Google Scholar] [CrossRef]
  34. Swinney, H.L. Flow regimes in a circular Couette system with independently rotating cylinders. J. Fluid Mech. 1986, 164, 155–183. [Google Scholar]
  35. Hall, T.; Joseph, D. Rotating cylinder drag balance with application to riblets. Exp. Fluids 2000, 29, 215–227. [Google Scholar] [CrossRef]
  36. Lim, T.T.; Tan, K.S. A note on power-law scaling in a Taylor-Couette flow. Phys. Fluids 2004, 16, 140–144. [Google Scholar] [CrossRef]
  37. Raayai-Ardakani, S.; McKinley, G.H. Geometry mediated friction reduction in Taylor-Couette flow. Phys. Rev. Fluids 2020, 5, 124102. [Google Scholar] [CrossRef]
  38. Wendt, V.F. Turbulente Stromungen zwischen zwei rotierenden Zylindern. Ingenieur-Archiv 1933, 4, 577–595. [Google Scholar] [CrossRef]
  39. Tong, P.; Goldburg, W.I.; Huaang, J.S.; Witten, A. Anisotropy in Turbulent Drag Reduction. Phys. Rev. Lett. 1990, 65, 1238. [Google Scholar] [CrossRef]
  40. Rosenberg, B.J.; Van Buren, T.; Fu, M.K.; Smits, A.J. Turbulent drag reduction over air- and liquid-impregnated surfaces. Phys. Fluids 2016, 28, 015103. [Google Scholar] [CrossRef]
  41. Greidanus, A.J.; Delfos, R.; Tokgoz, S.; Westerweel, J. Turbulent Taylor–Couette flow over riblets: Drag reduction and the effect of bulk fluid rotation. Exp. Fluids 2015, 56, 107. [Google Scholar] [CrossRef]
  42. Aydin, E.M.; Leutheusser, H.J. Plane-Couette flow between smooth and rough walls. Expermental Fluids 1991, 312, 302–312. [Google Scholar] [CrossRef]
  43. Panton, R.L. Panton 1992-Scaling laws for the angular momentum of a completely turbulent couette flow. C. R. Acad. Sci. Ser. II 1992, 315, 1467–1473. [Google Scholar]
  44. Lewis, G.S.; Swinney, H.L. Velocity structure functions, scaling, and transitions in high-Reynolds-number Couette-Taylor flow. Phys. Rev. E-Stat. Phys. Plasmas Fluids Relat. Interdiscip. Top. 1999, 59, 5457–5467. [Google Scholar] [CrossRef]
  45. Dong, S. Direct numerical simulation of turbulent Taylor—Couette flow. J. Fluid Mech. 2007, 587, 373–393. [Google Scholar] [CrossRef]
  46. Seo, J.; Mani, A. On the scaling of the slip velocity in turbulent flows over superhydrophobic surfaces. Phys. Fluids 2016, 28, 025110. [Google Scholar] [CrossRef]
  47. Fairhall, C.T.; Abderrahaman-Elena, N.; García-Mayoral, R. The effect of slip and surface texture on turbulence over superhy-drophobic surfaces. J. Fluid Mech. 2019, 861, 88–118. [Google Scholar] [CrossRef]
  48. Choi, C.H.; Ulmanella, U.; Kim, J.; Ho, C.M.; Kim, C.J. Effective slip and friction reduction in nanograted superhydrophobic mi-crochannels. Phys. Fluids 2006, 18, 087105. [Google Scholar] [CrossRef]
  49. Aziz, H.; Tafreshi, H.V. Role of particles spatial distribution in drag reduction performance of superhydrophobic granular coatings. Int. J. Multiph. Flow 2018, 98, 128–138. [Google Scholar] [CrossRef]
  50. Zhao, J.; Du, X.; Shim, X. Experimental research on friction-reduction with superhydrophobic surfaces. J. Mar. Sci. Appl. 2007, 6, 58–61. [Google Scholar] [CrossRef]
  51. Xue, Y.; Lv, P.; Lin, H.; Duan, H. Underwater superhydrophobicity: Stability, design and regulation, and applications. Appl. Mech. Rev. 2016, 68, 030803. [Google Scholar] [CrossRef]
  52. Vinogradova, O.I. Slippage of water over hydrophobic surfaces. Int. J. Miner. Process. 1999, 56, 31–60. [Google Scholar] [CrossRef]
Figure 1. The MRC 302 modular compact rheometer device is equipped with an integrated temperature sensor to maintain constant temperature using the peltier plate and lift motor (a), system setup of the CC27 model used as a Taylor–Couette cell with concentric disposal cups and its base for measuring (b), and its schematic diagram (c), where the inner radius ri = 13.329 mm, the outer radius ro = 14.464 mm, and the measuring bob length L = 40 mm.
Fluids 08 00133 g001
Figure 2. The SEM images magnified to 22,000 × of the original samples for (a) FPC-800M with its average SCA of 151, (b) UED with an average SCA of 160°, and (c) SHBC with an average SCA of 141° for a 15 µL of deionized water.
Fluids 08 00133 g002
Figure 3. Observed rich flow structures (in an internal rotational cylinder and fixed external cylinder) phase diagram for Taylor–Couette flow adopted from [34].
Fluids 08 00133 g003
Figure 4. (a) The dimensionless torque of the present TC flow with a smooth surface, the results compared with Couette’s work [38] and Wendt’s work [36]; (b) the corresponding local torque exponent α.
Fluids 08 00133 g004
Figure 5. Comparison of skin friction of the experimental data in laminar and turbulent regions using all smooth and coated surfaces. The computed data using Equation (8), theoretical laminar data using Equation (9), and turbulent theoretical data using Equation (10).
Fluids 08 00133 g005
Figure 6. The measured skin friction plotted in Prandtl–von Kármán coordinates for all tested surfaces. The black dashed line is the smooth baseline friction curve for the Taylor–Couette fixture, given by Equation (11) with M = 4.37 and N = −2.1. The coloured dashed lines are least-squares fits of Equation (12) to data of the last five points of each tested SHS. The red dashed curve (UED) with b = 41 µm, the blue dashed line (FPC-800M) with b = 37.2 µm, and the green dashed line (SHBC) with b = 35.4 µm.
Fluids 08 00133 g006
Figure 7. Scaling the dimensionless slip length b+, which is calculated based on the effective slip length of Equation (14) and normalized by the viscous length (δν).
Fluids 08 00133 g007
Figure 8. A semi-log plot for the variation of the dimensionless plastron thickness based on the viscous model of Equation (15) and normalized by the viscous length (δν) over the tested SHSs versus the Reynolds numbers in the present work with a maximum Reynolds number of 1227.
Fluids 08 00133 g008
Figure 9. The comparison of measured data of both the dimensionless plastron thickness and the dimensionless slip length by the predicted linear regression model data of dimensionless plastron thickness for the tested SHSs of (a) FPC-800M, (b) UED, and (c) SHBC.
Fluids 08 00133 g009aFluids 08 00133 g009b
Figure 10. The sensitive check of the linear regression model with RMSE for each parameter.
Fluids 08 00133 g010
Table 1. The average value of the measured static and dynamic contact angles for all tested surfaces; the uncertainties are STDEV errors of the measurements.
FPC-800MUEDSHBC
Static Contact Angle150 ± 5158 ± 5152 ± 5
Advancing Contact Angle155 ± 5156 ± 5154 ± 5
Receding Contact Angle148 ± 5155 ± 5153 ± 5
Table 2. Descriptive statistics of the regression model.
ParameterMeanSTD.DEV.N
δ+0.0080.013164
Re206.47306.46164
Cos Ɵ0.540.69164
µw/µa0.8650164
b+1.0012.36164
Table 3. Regression model summary of the dependent variable (δ+).
ModelRR2Adjusted R2STD ErrorChanges Statistics
R2 ChangeF ChangedF1dF2Sig. F Change
10.933 a0.8710.8680.00450.871269.3941590.0005
a Predictors: constant, b+, cos Ɵ, µw/µa, Re.
Disclaimer/Publisher’s Note: The statements, opinions and data contained in all publications are solely those of the individual author(s) and contributor(s) and not of MDPI and/or the editor(s). MDPI and/or the editor(s) disclaim responsibility for any injury to people or property resulting from any ideas, methods, instructions or products referred to in the content.