

Analysis of Flow Characteristics of Window-Combination-Type Ventilation System Using CFD
Abstract
:1. Introduction
2. Methodology
3. Introduction of Latest Technologies and Research
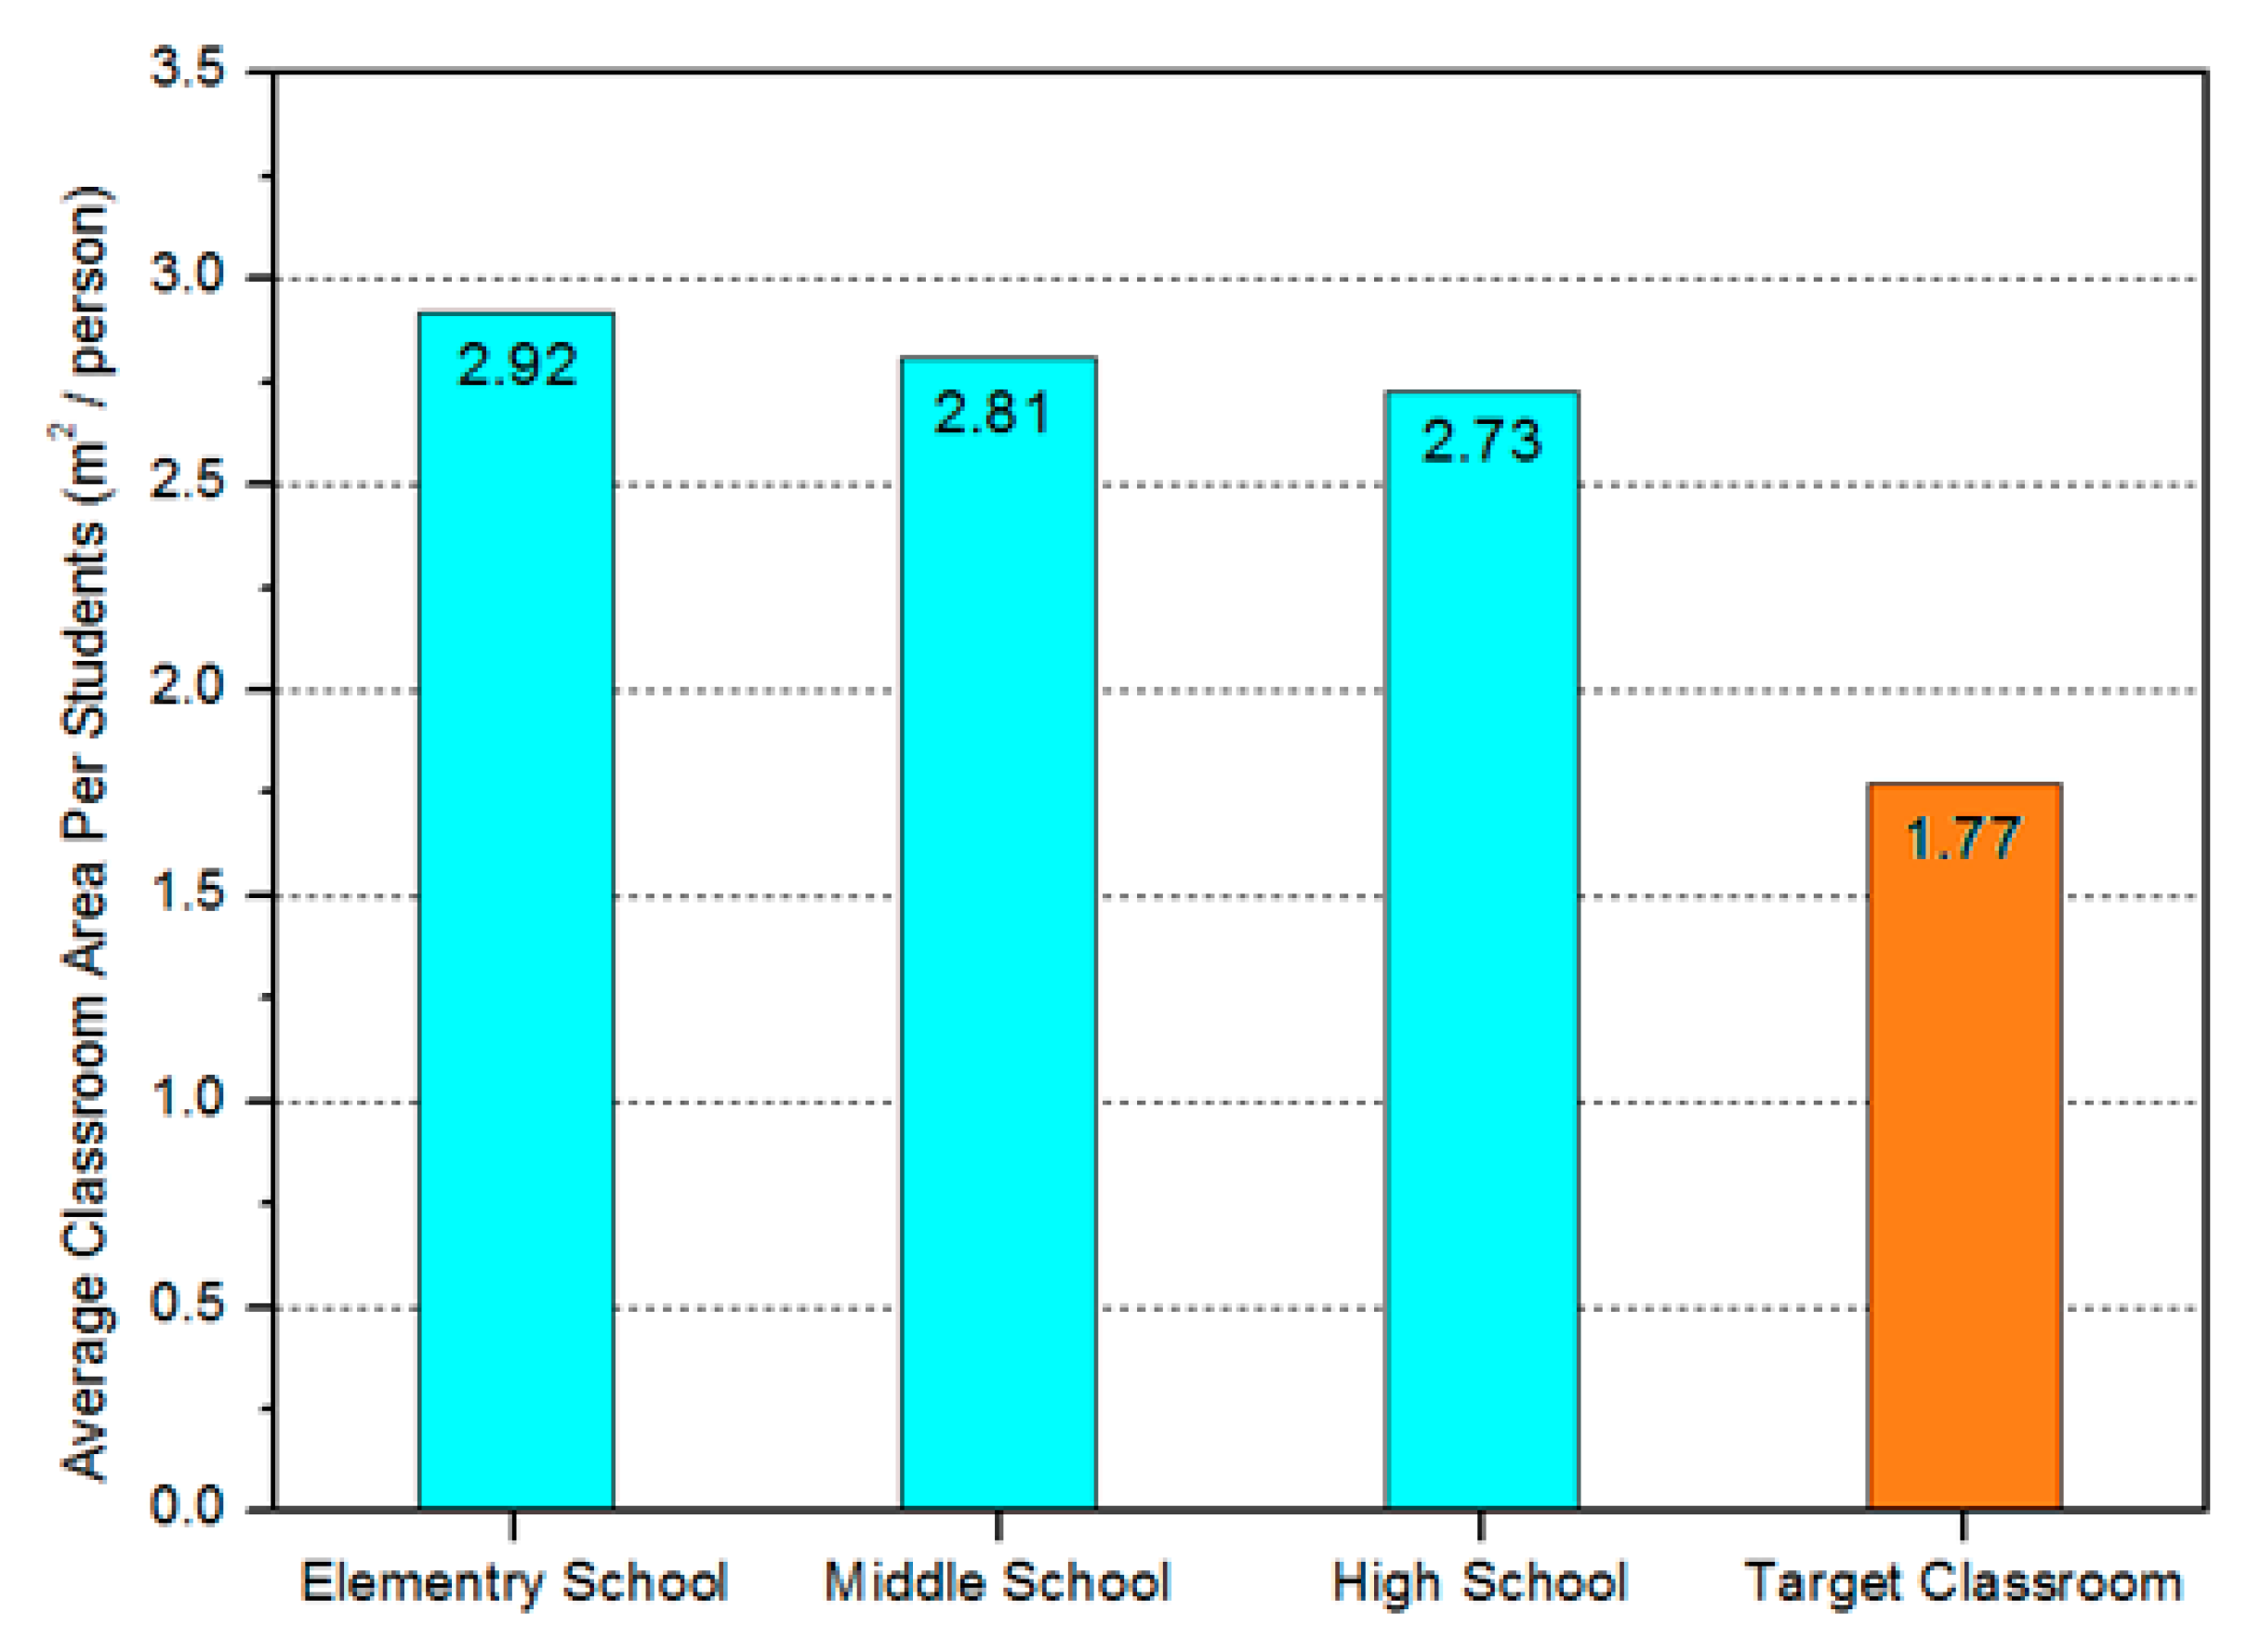
3.1. Target Classroom Selection
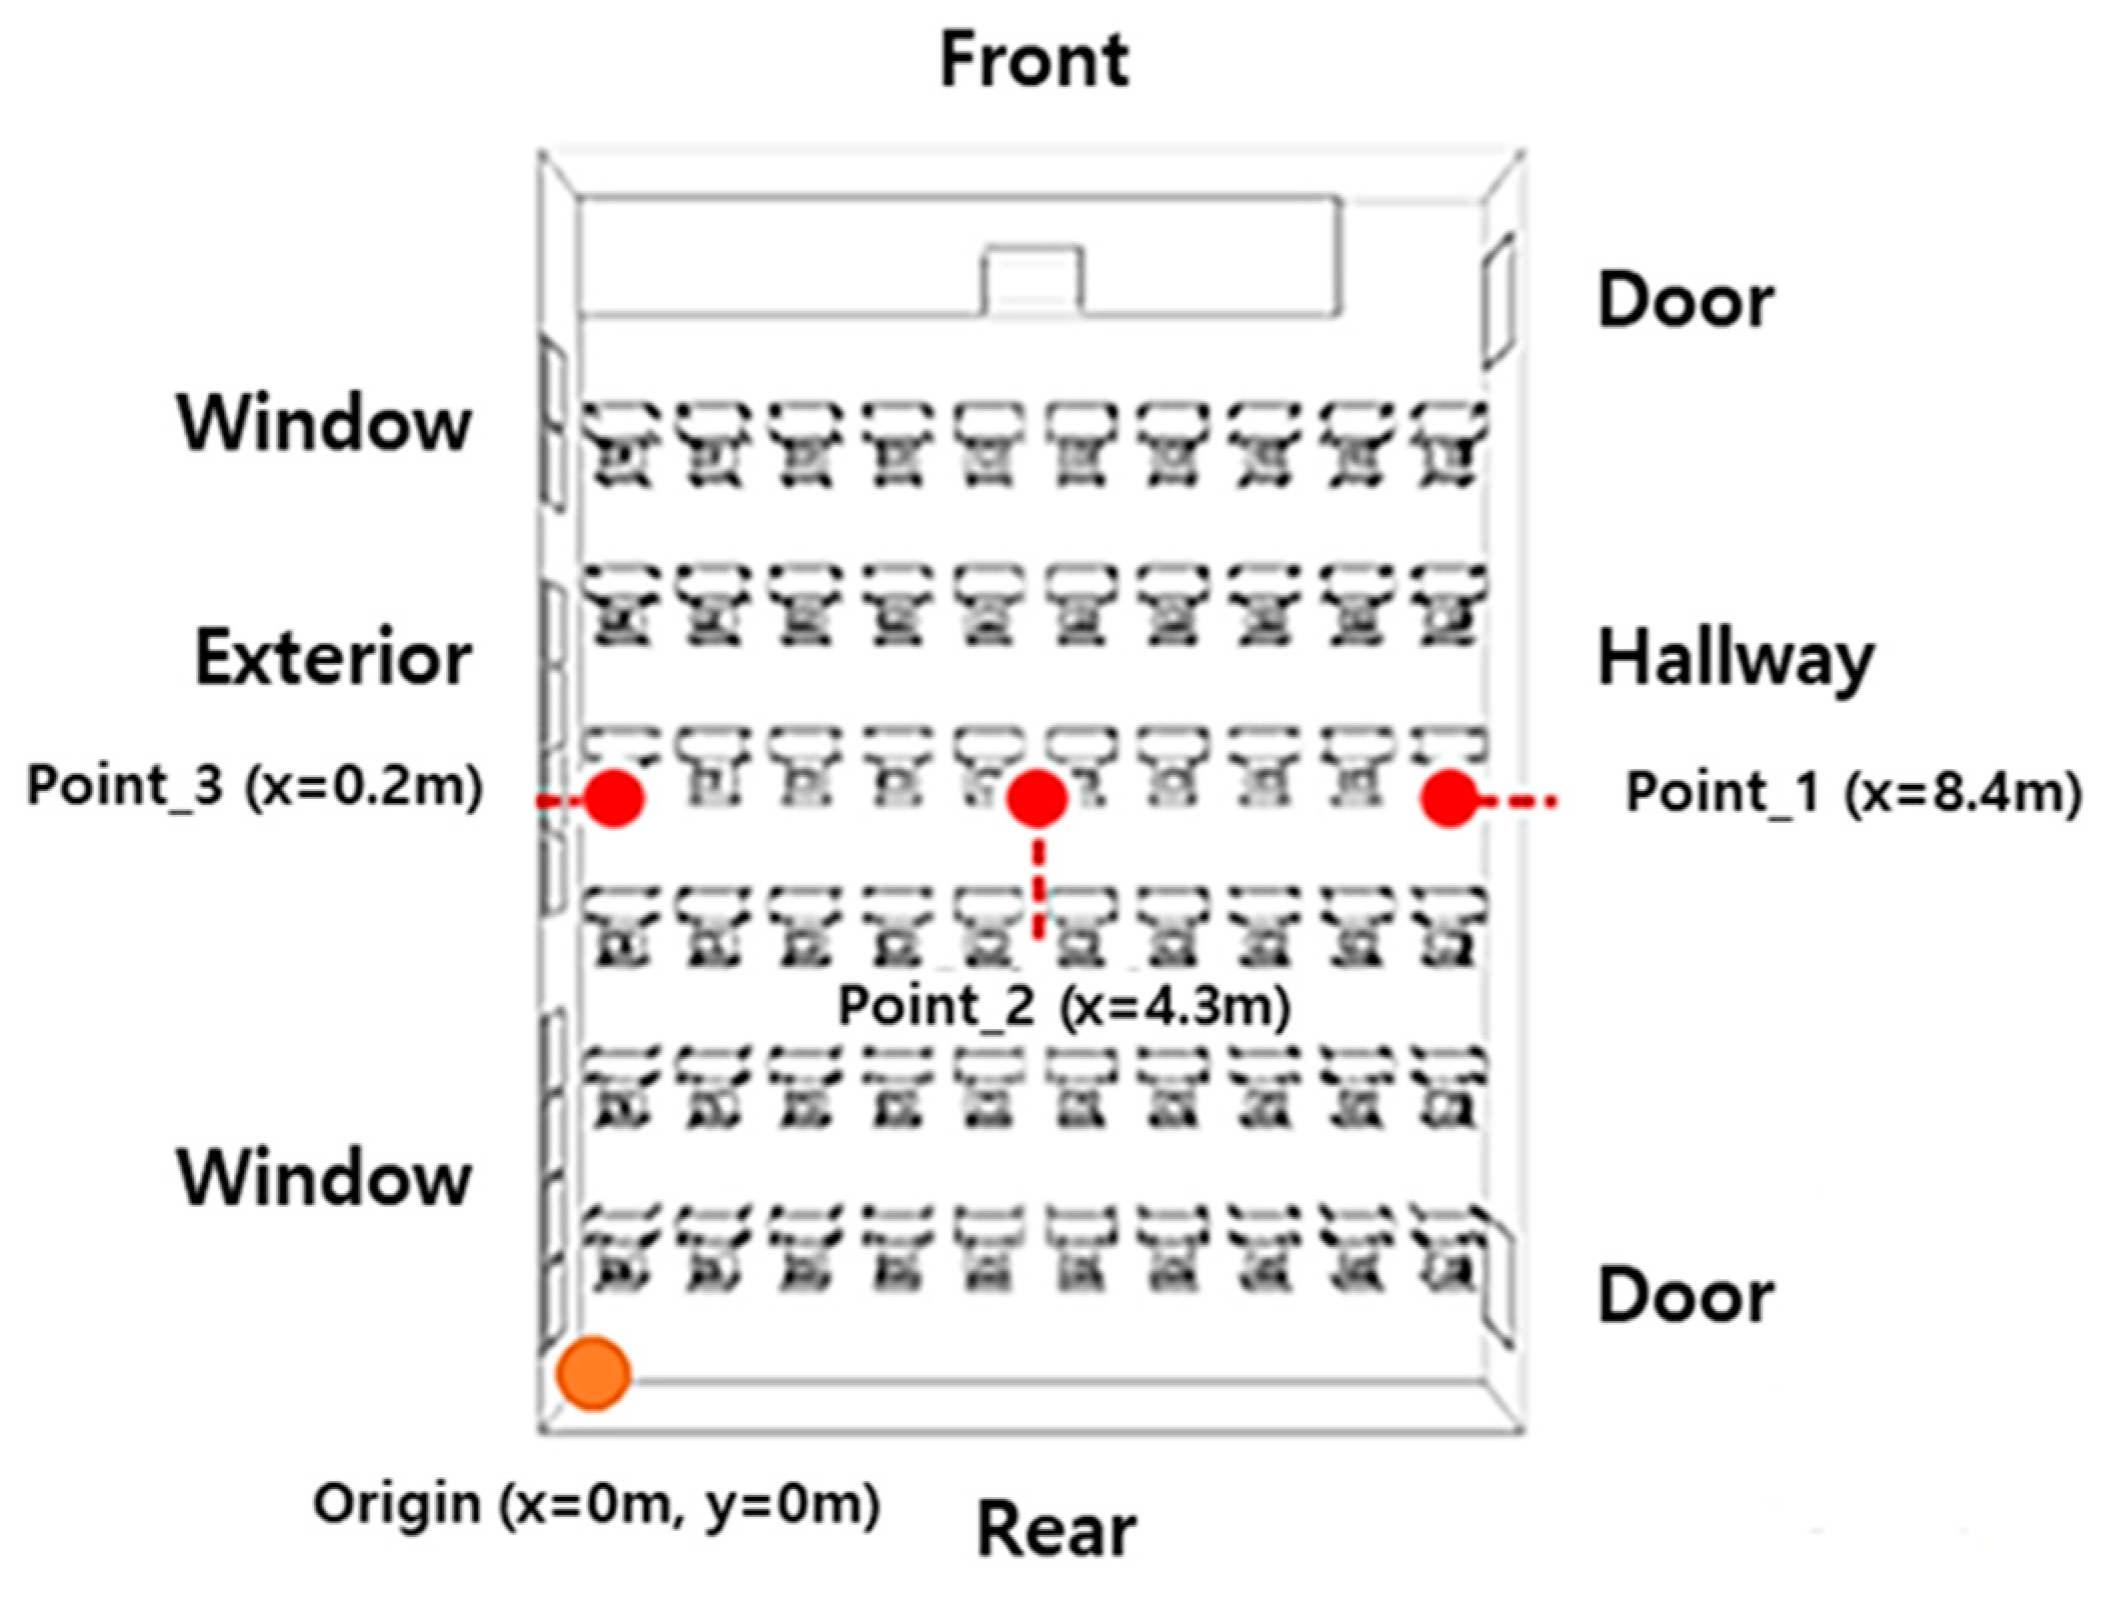
3.2. Measurement of Carbon Dioxide Concentration in the Classroom
4. Flow Design Analysis of Ventilation Module
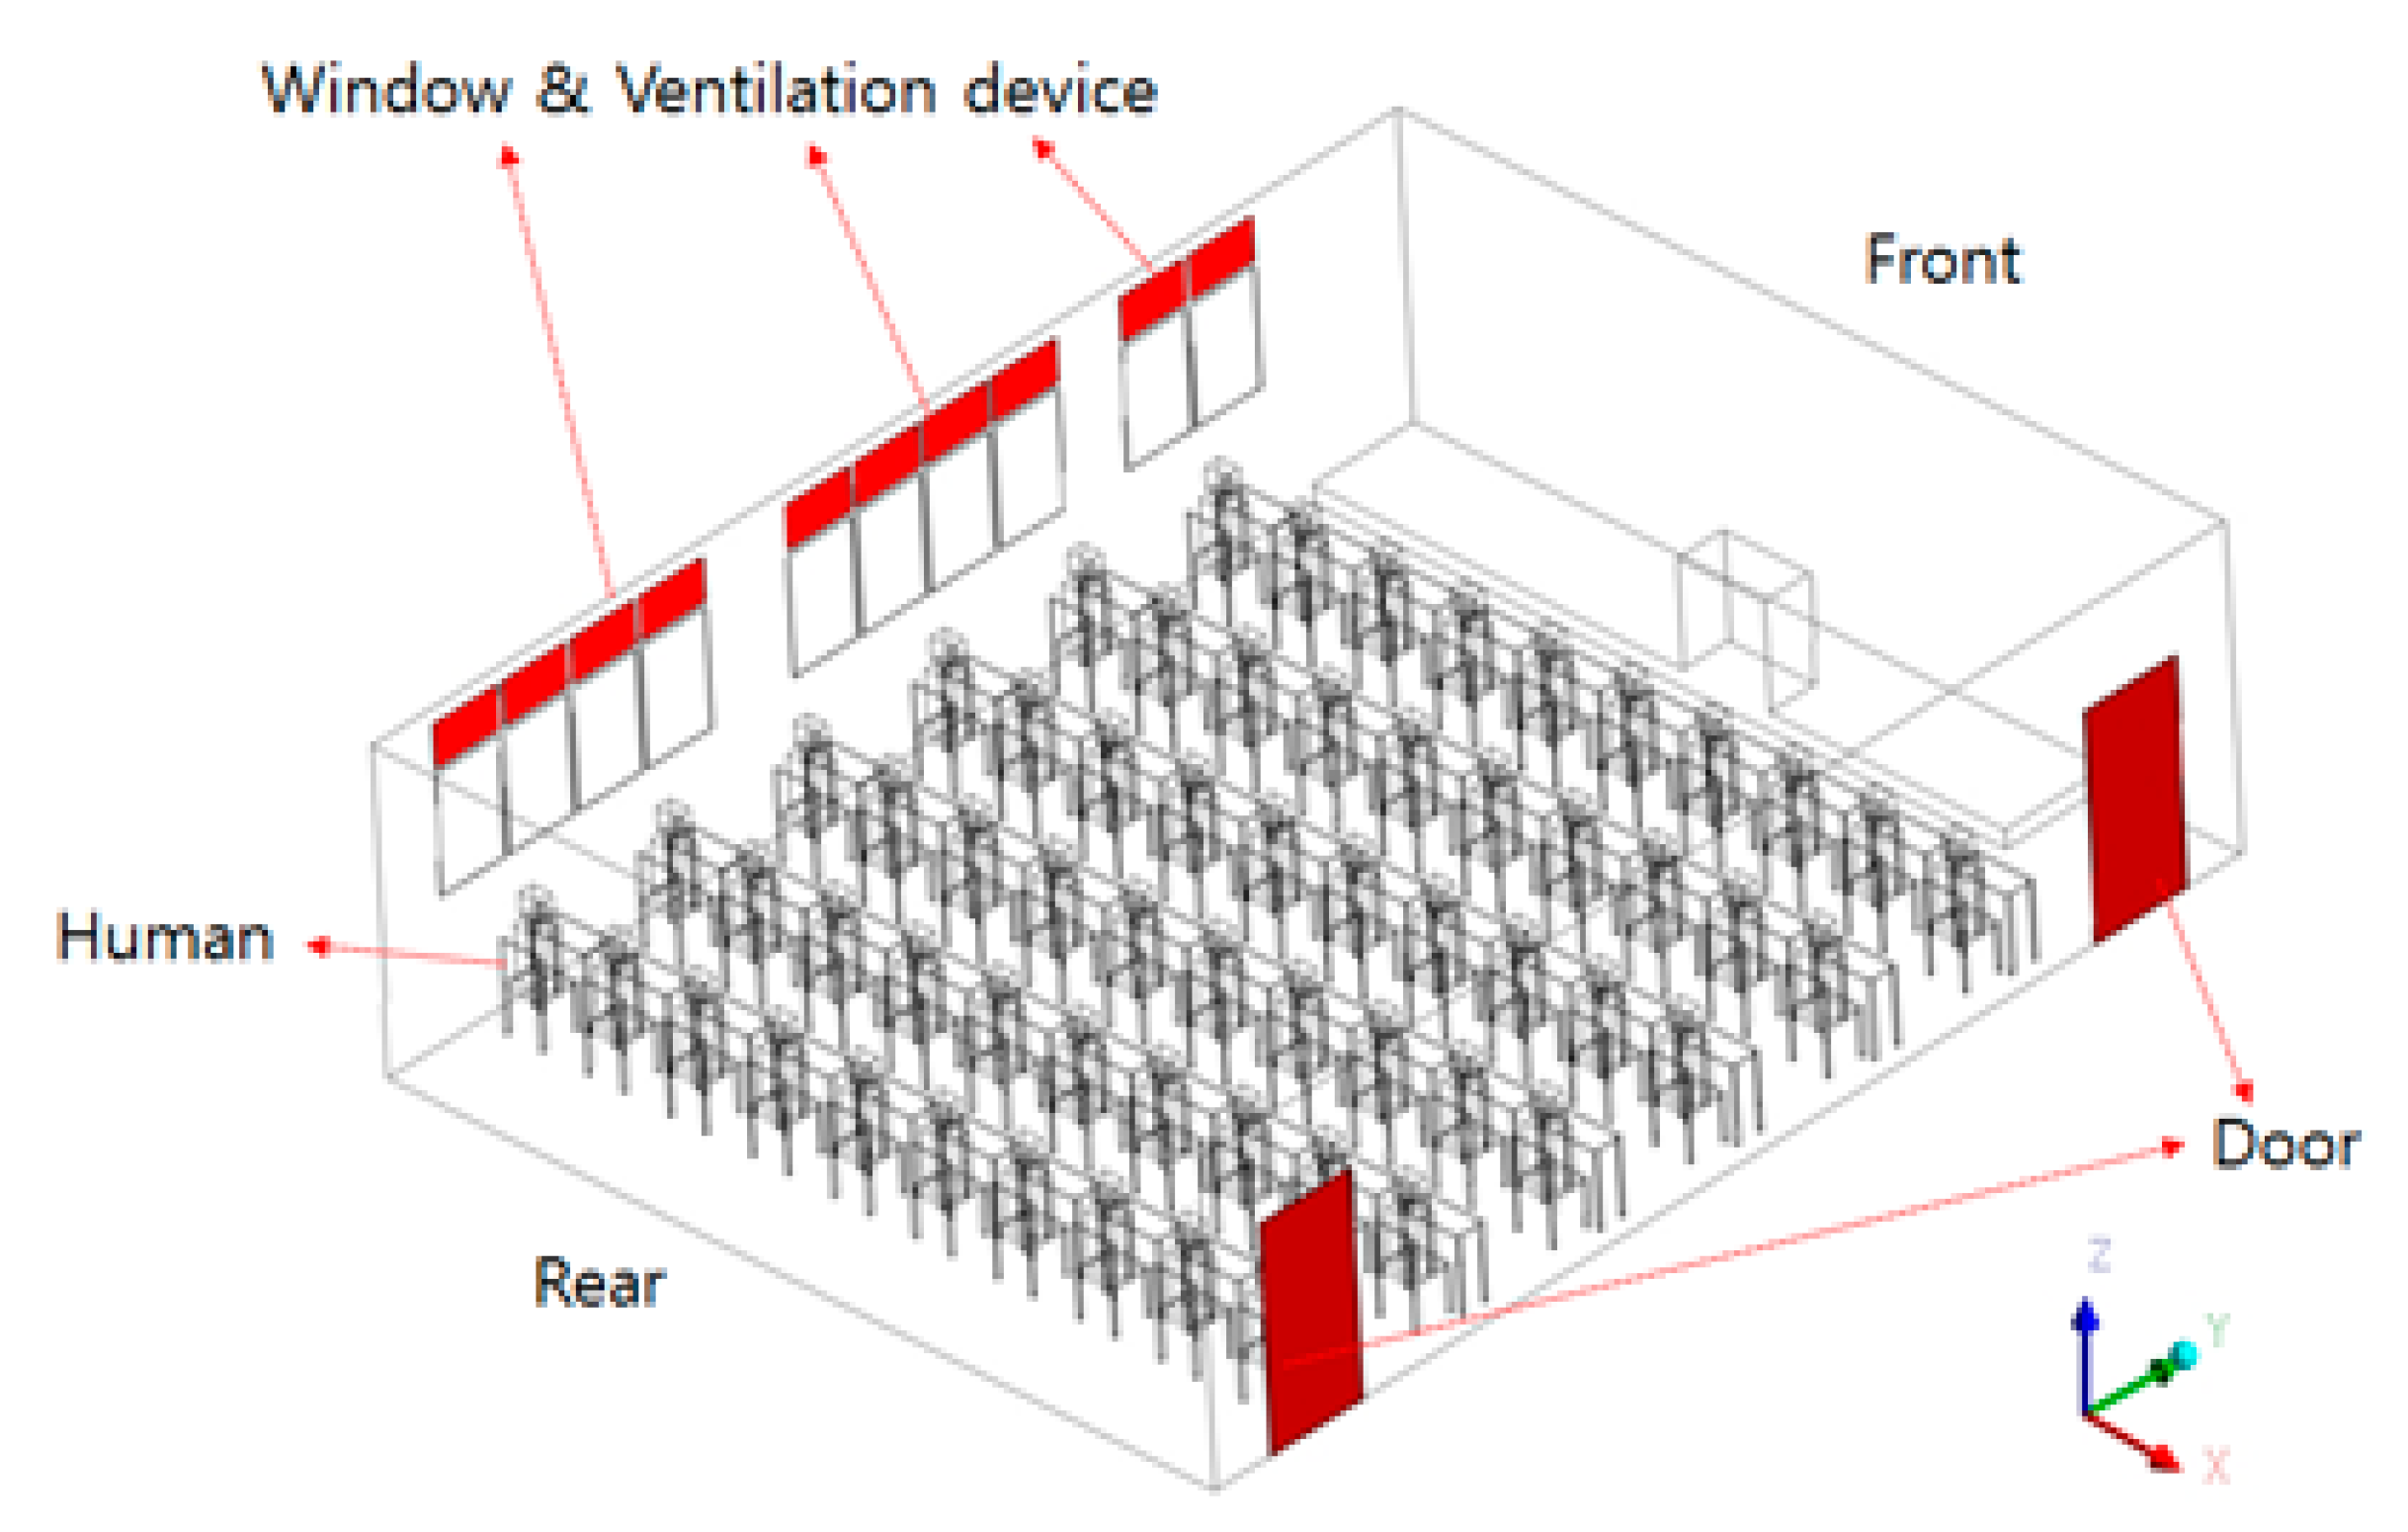
4.1. CFD Analysis Method and Modeling
4.2. Boundary Conditions and Case Configuration
5. Results and Discussion
5.1. Results of Flow Behavior and Ventilation Rate
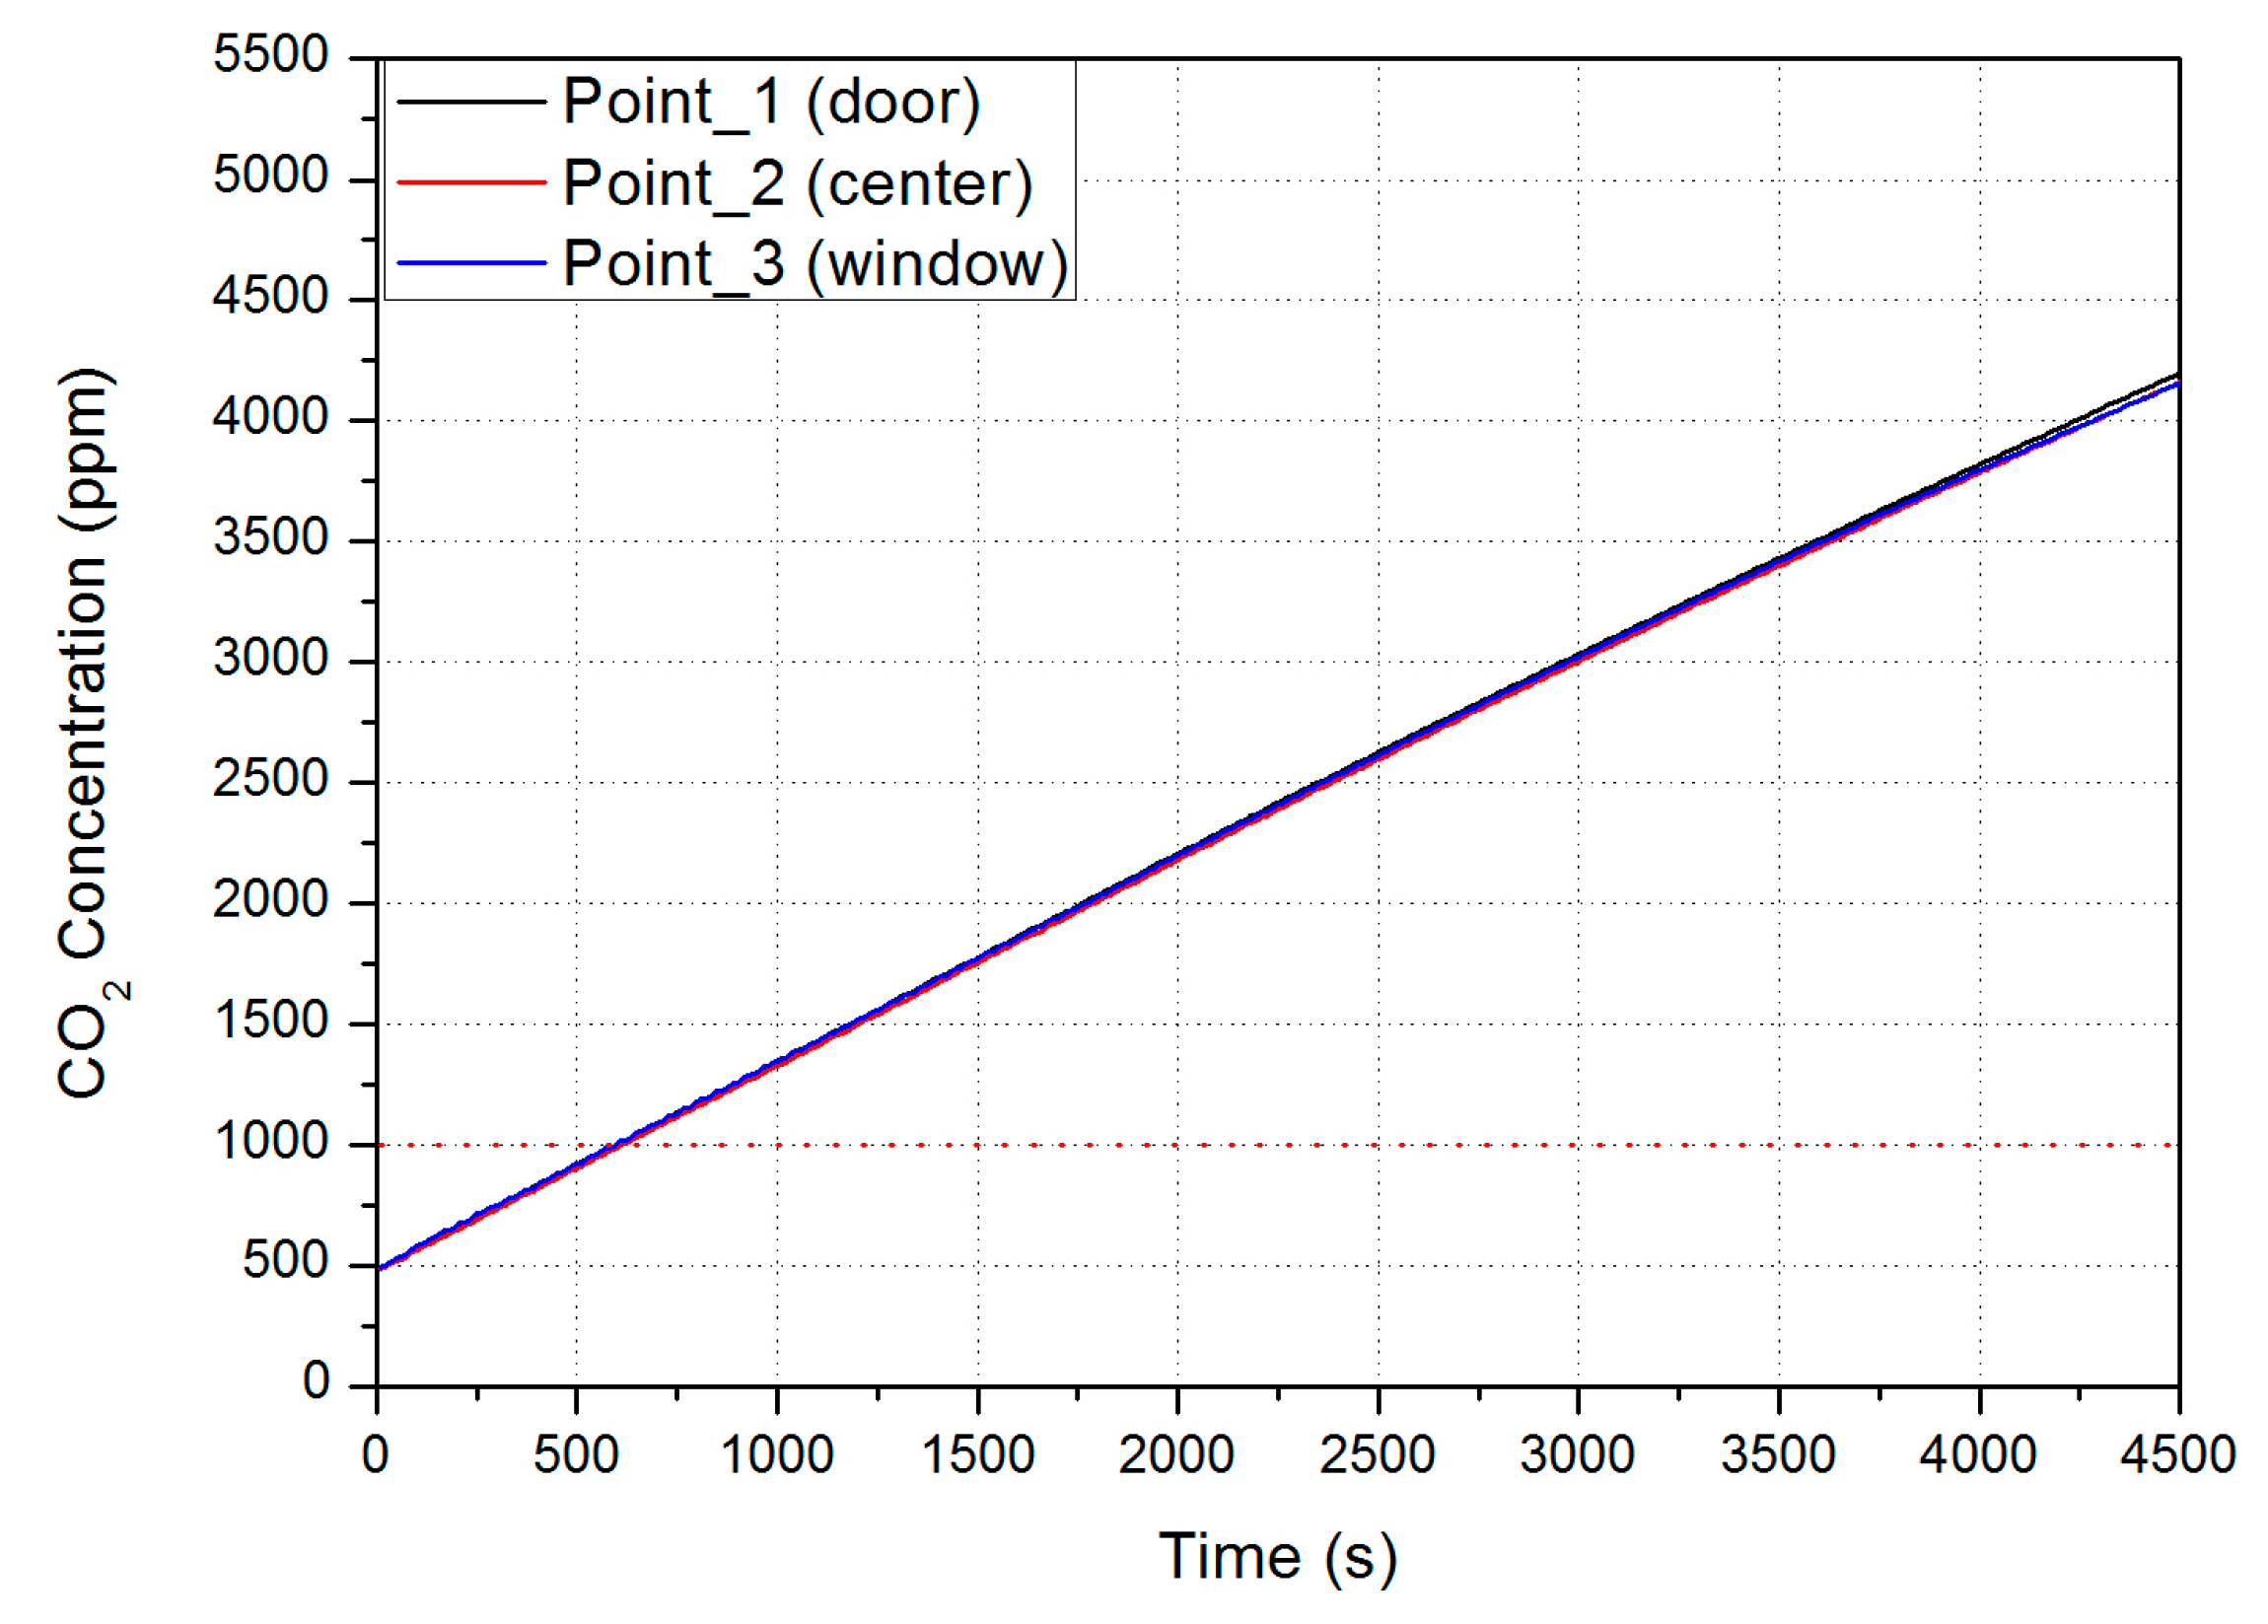
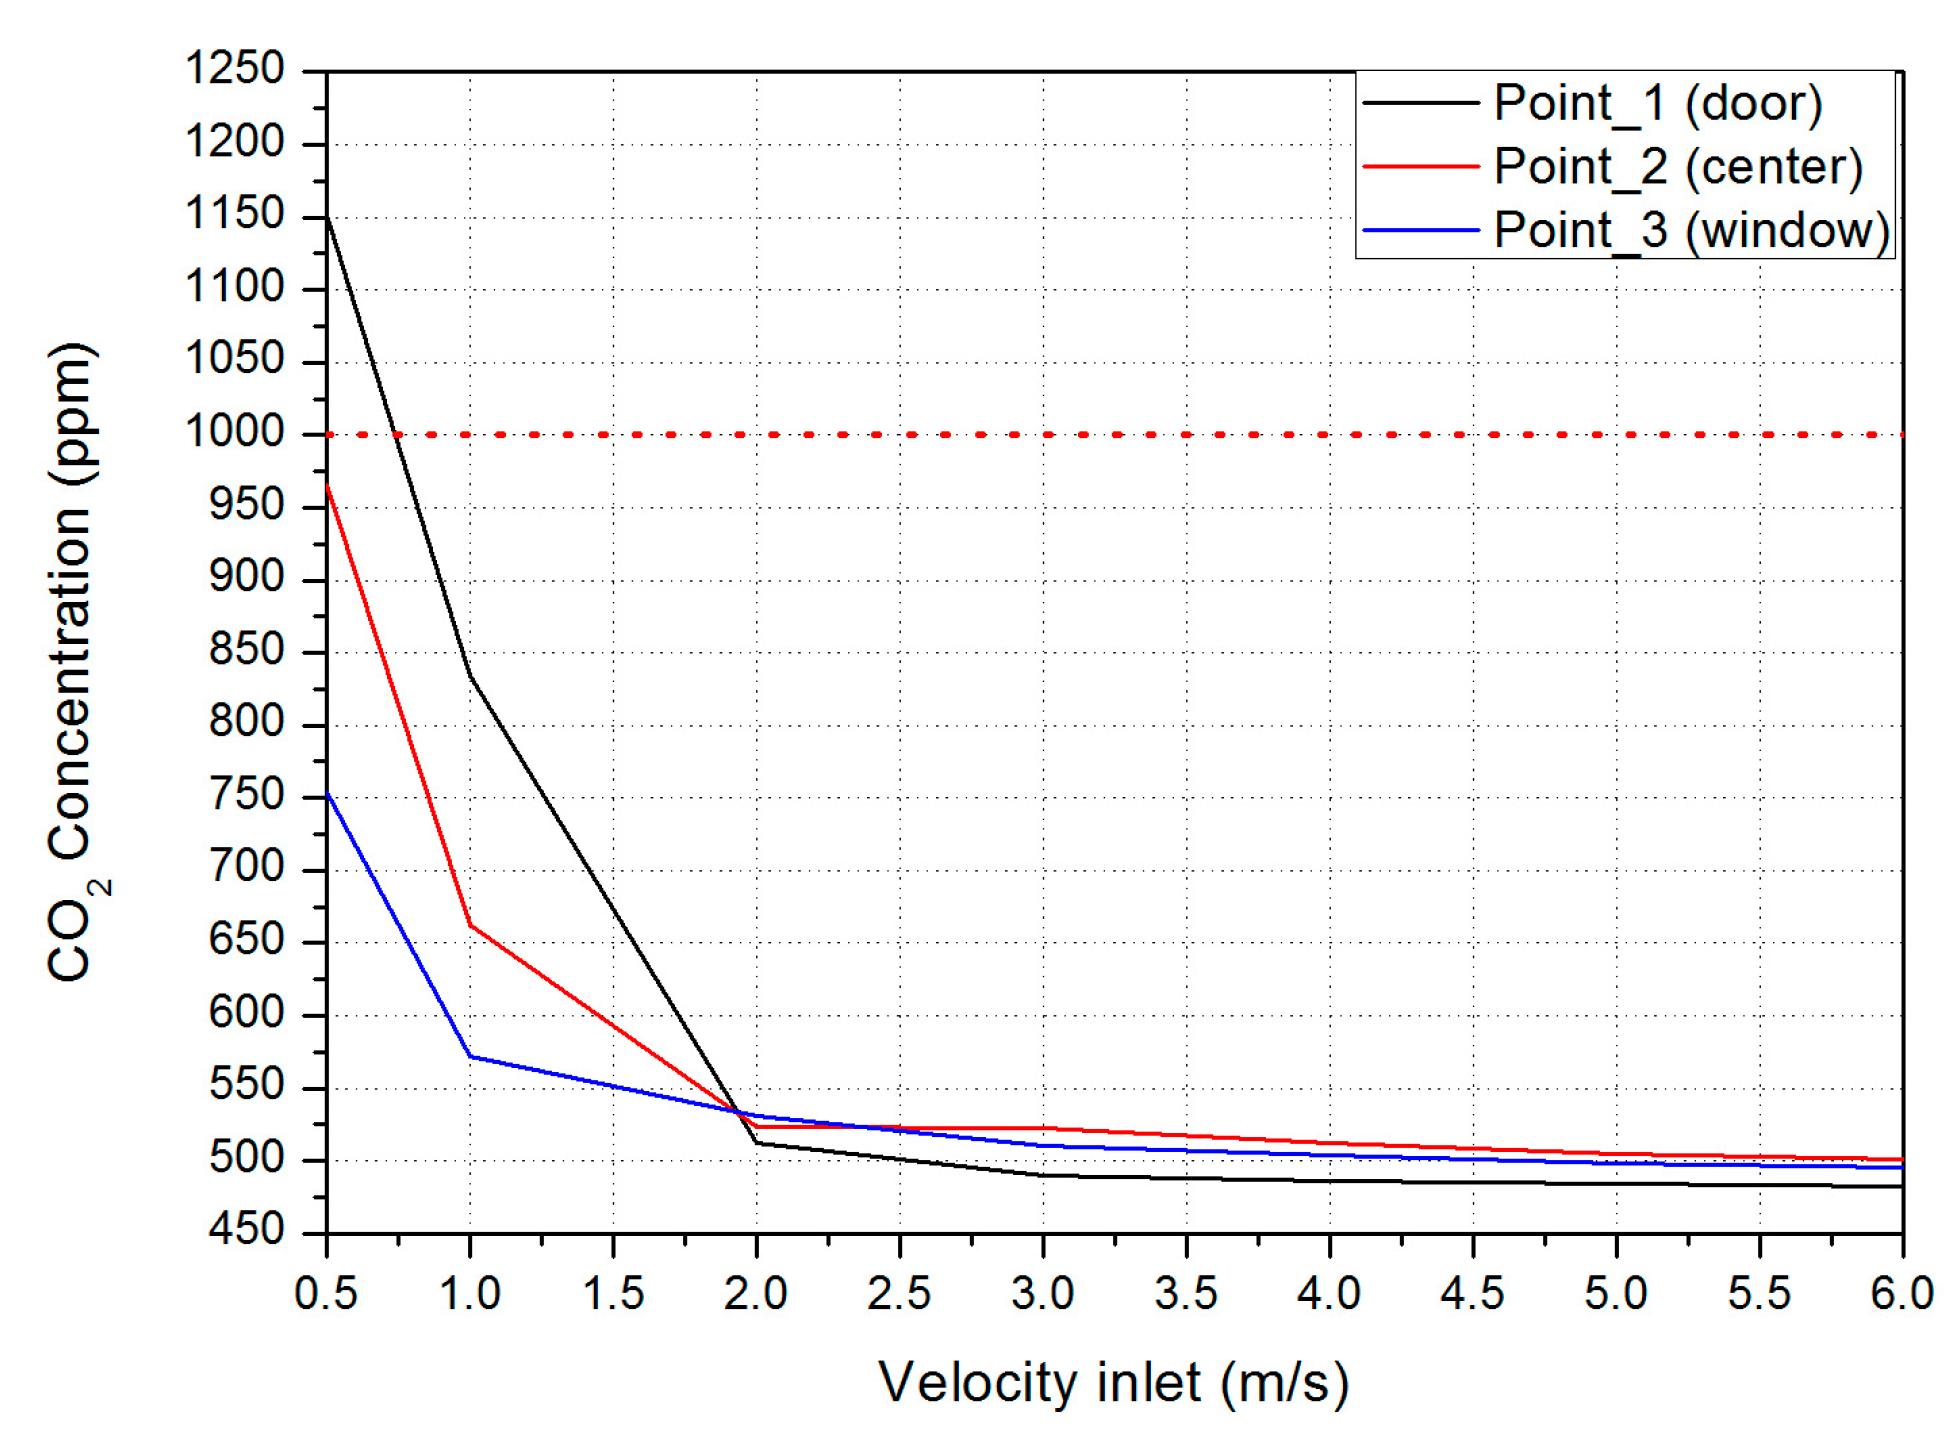
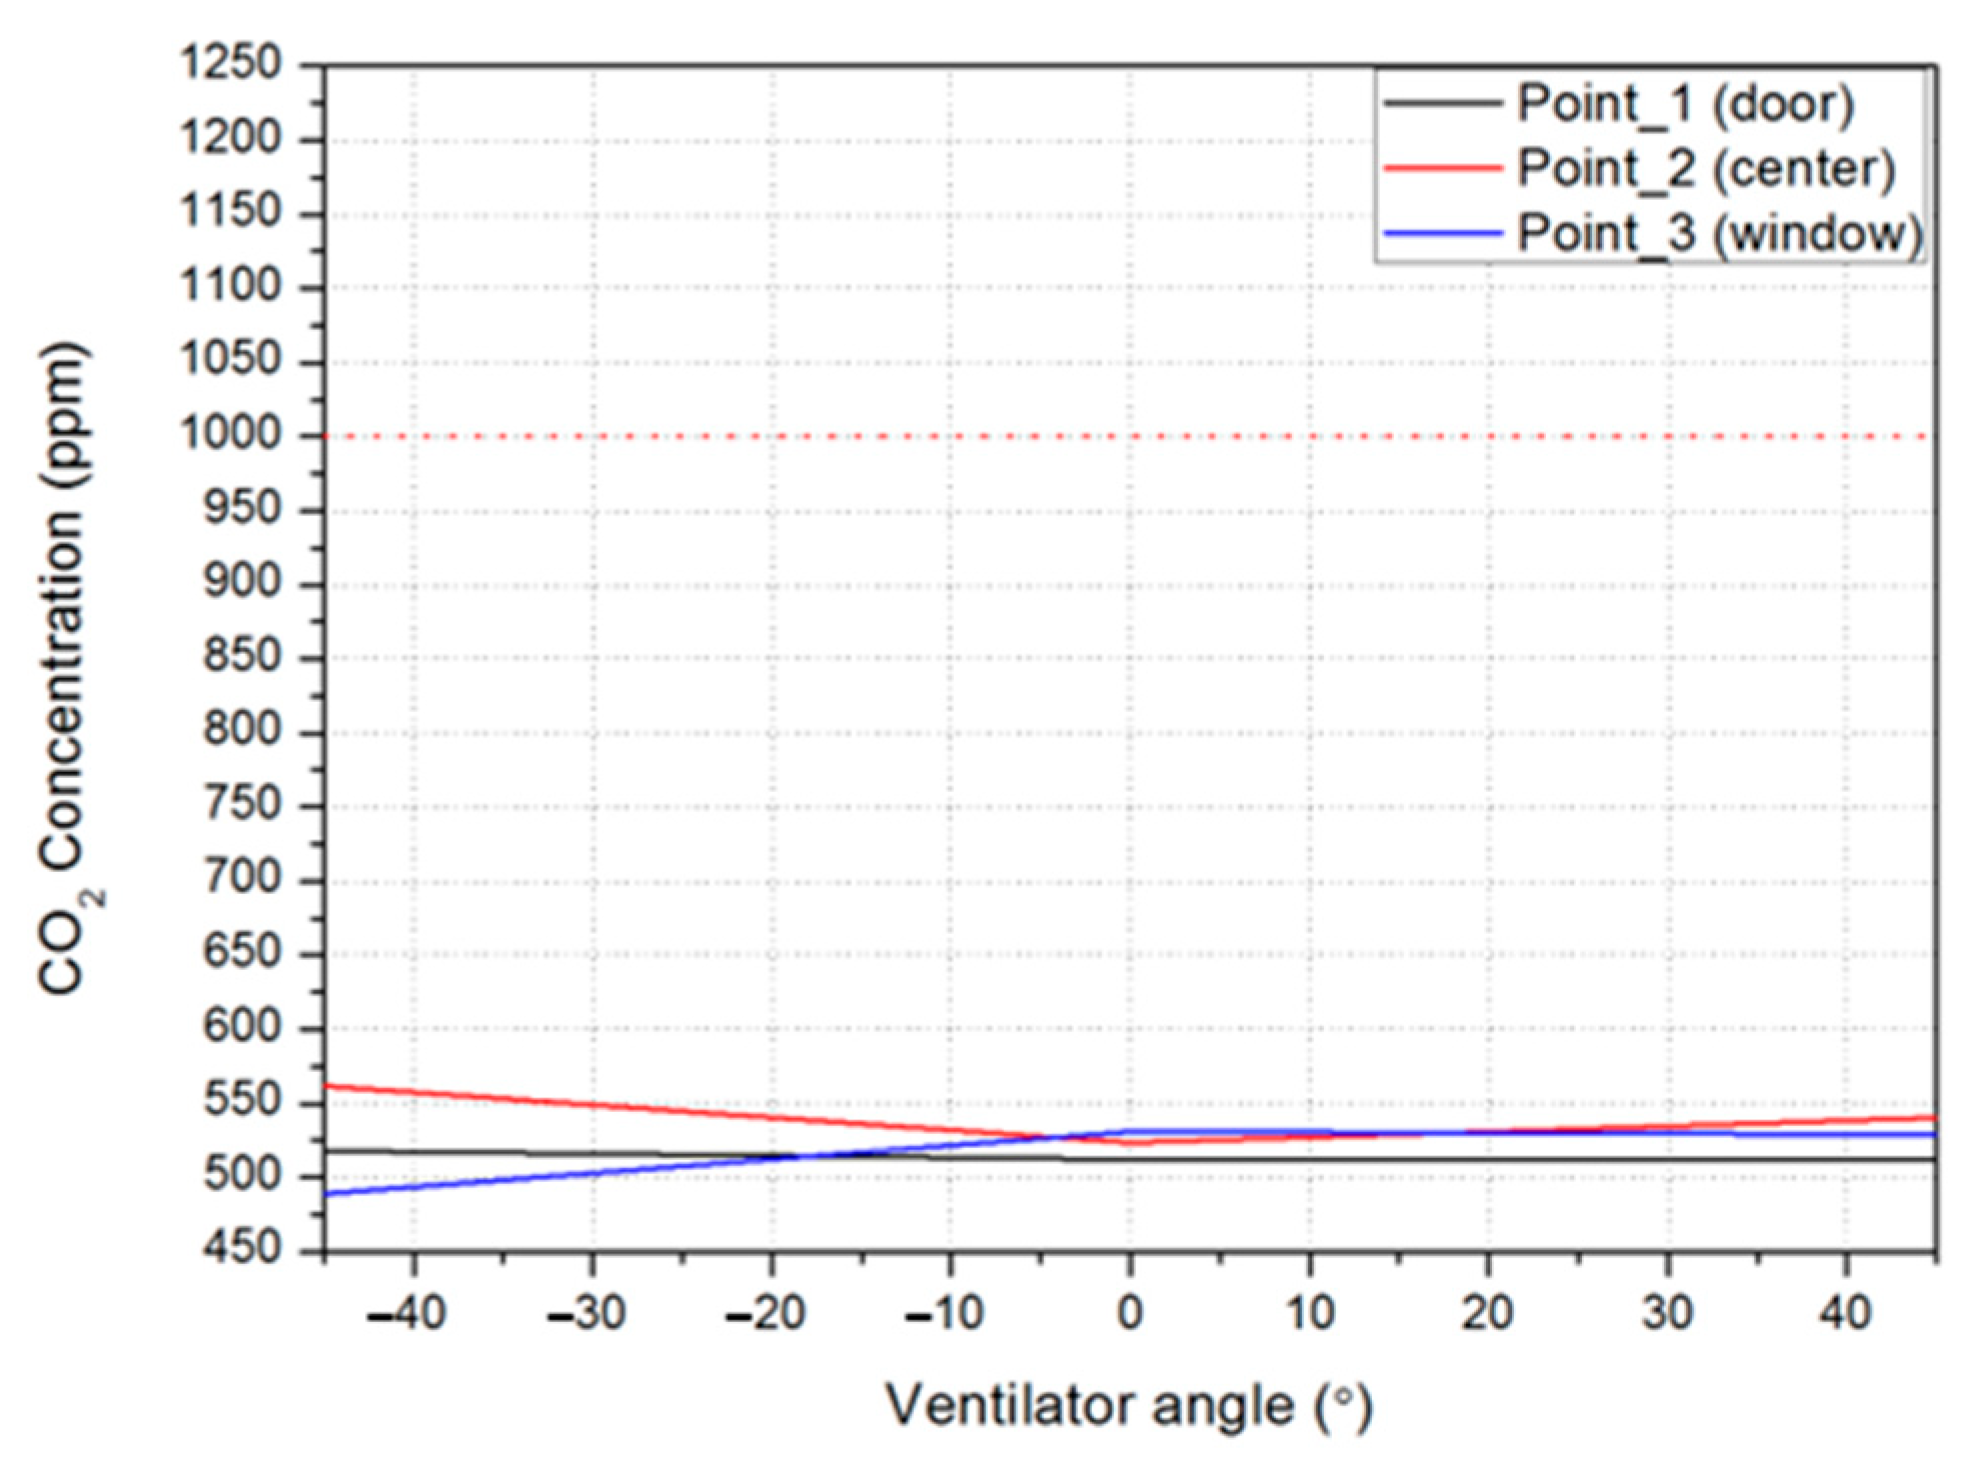
5.2. Results of the CO2 Concentration in the Classroom
5.3. Selection of the Ventilation Window Module Filter and Ventilation Performance Analysis
5.3.1. Air Pollution Level and European Certification Standards Air Filter
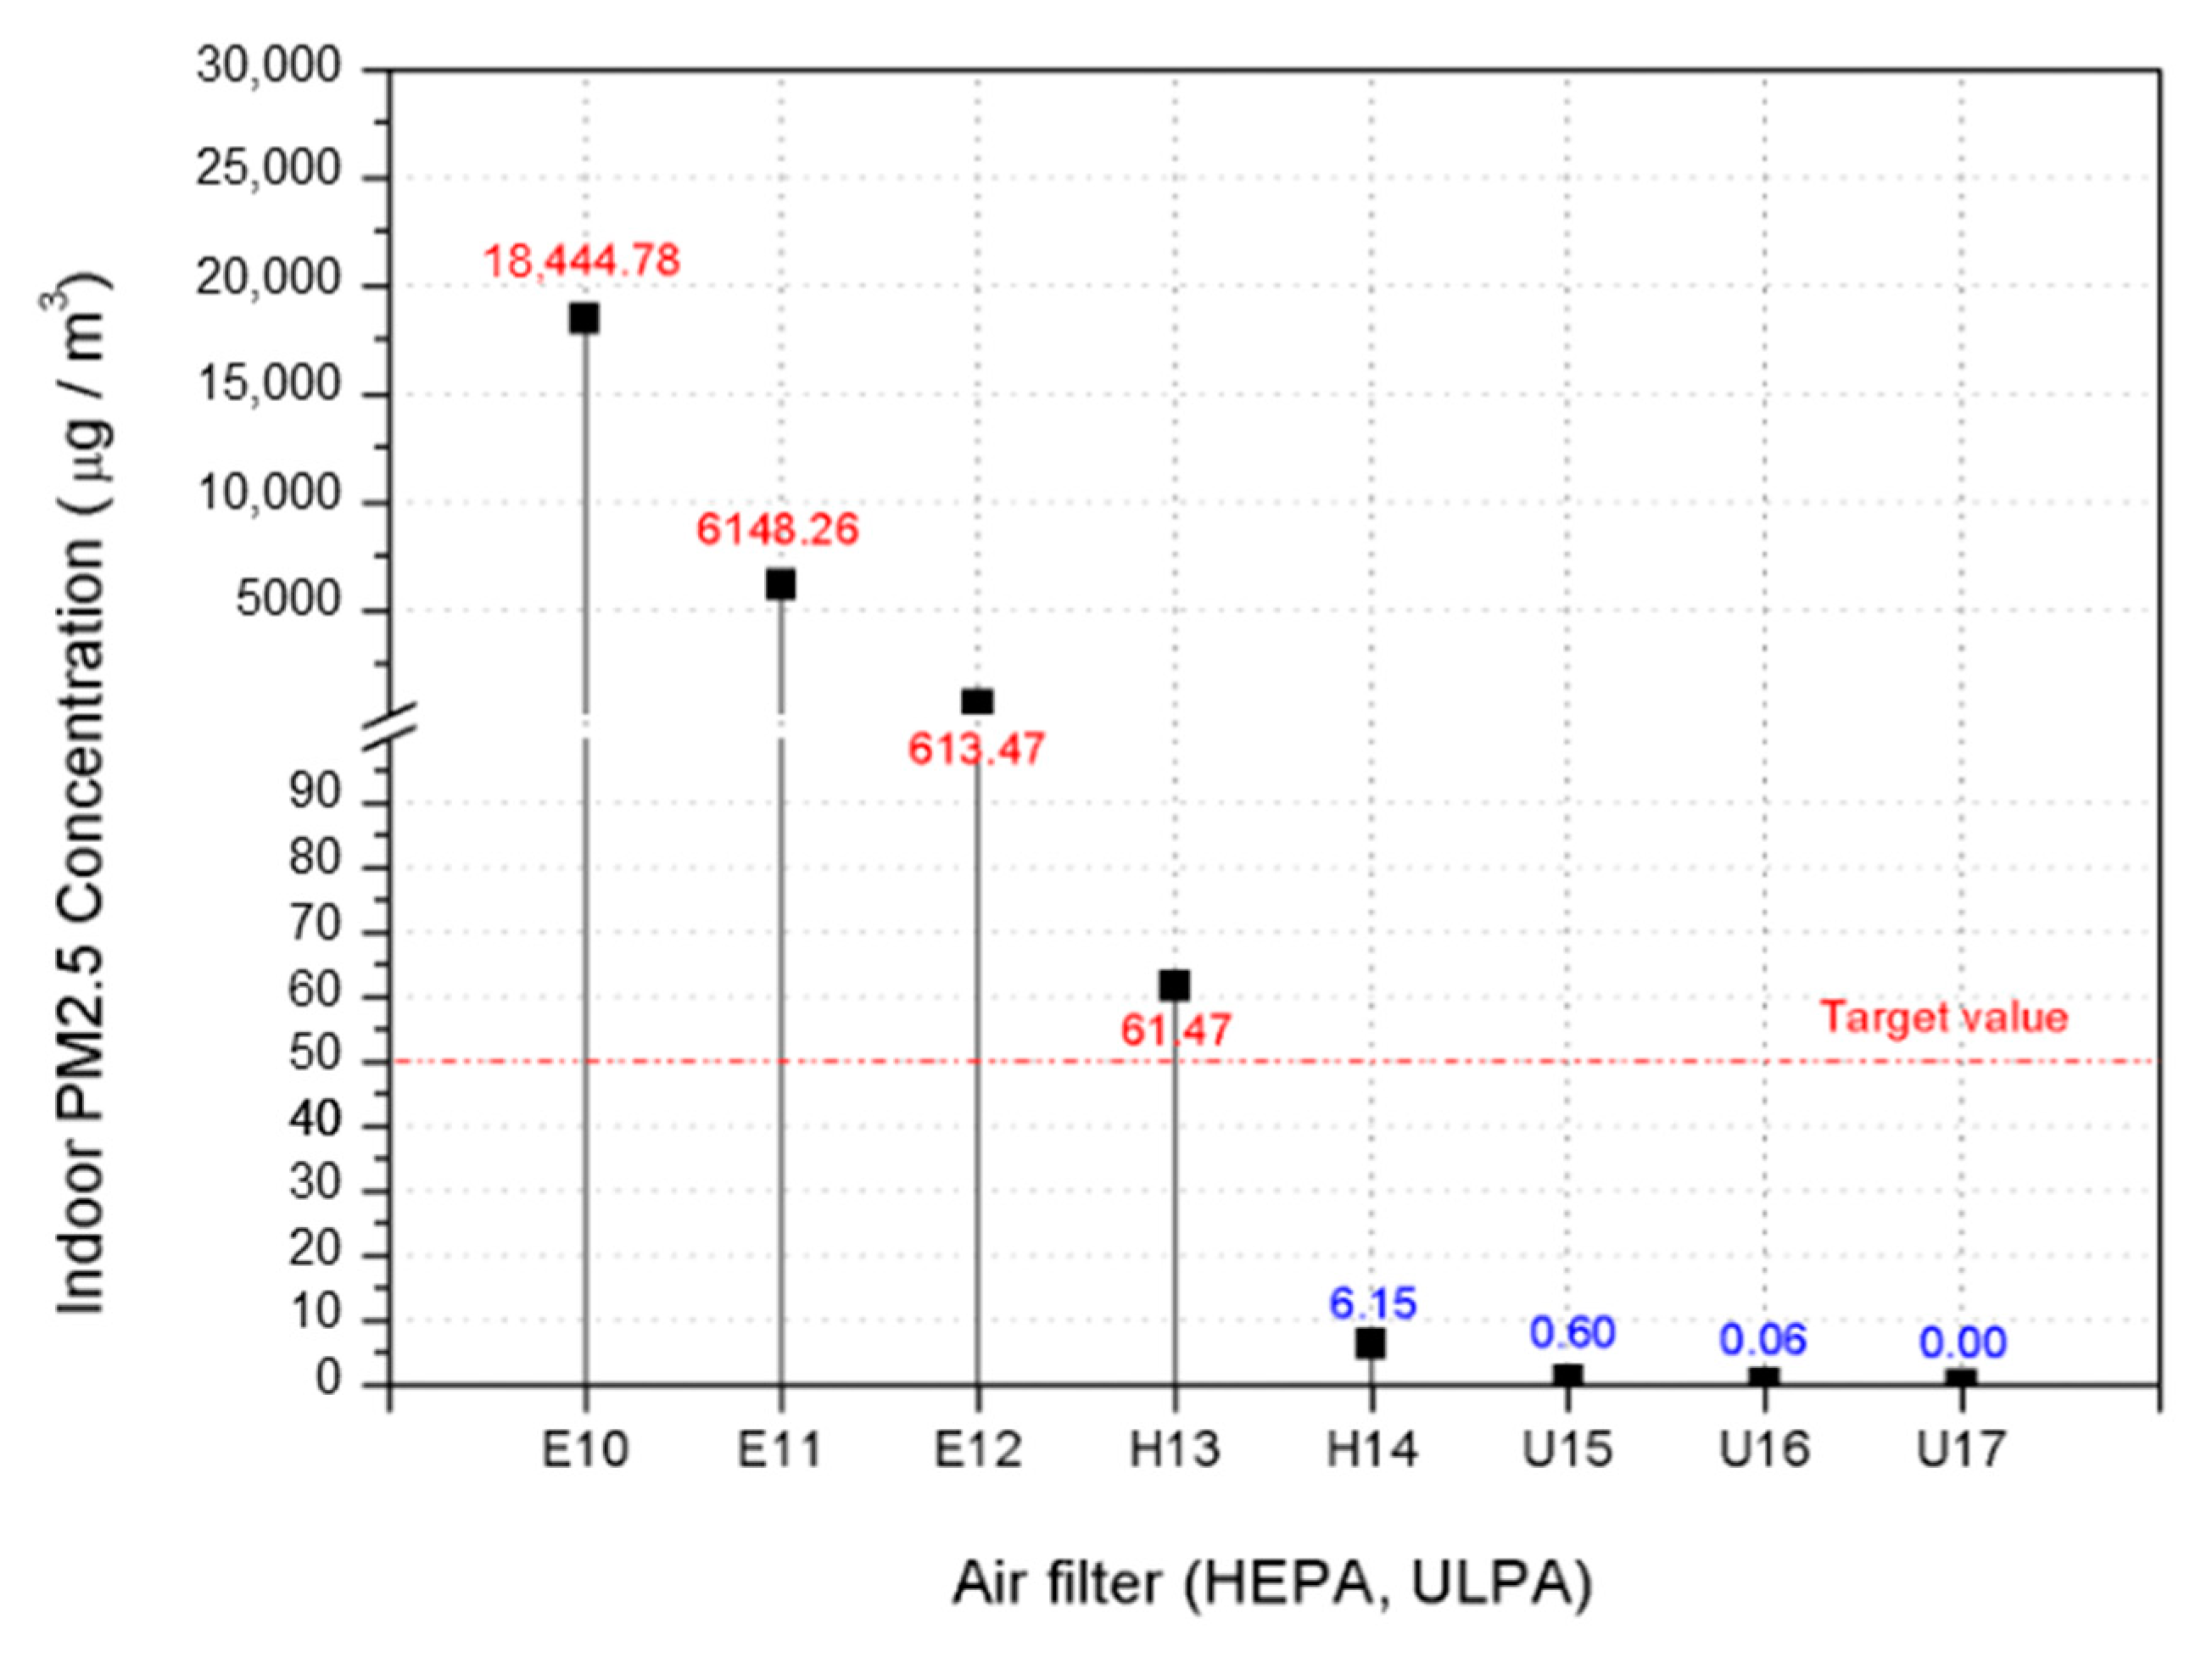
5.3.2. Selection of the Air Filter of the Ventilation Window Module
6. Conclusions
Author Contributions
Funding
Data Availability Statement
Conflicts of Interest
References
- Lim, W.C. Literature Review of the Effect of the Carbon Dioxide Concentration in Classroom Air on the Students’ Learning Performance. Korean J. Environ. Educ. 2015, 28, 2. [Google Scholar] [CrossRef]
- Makaveckas, T.; Bliūdžius, R.; Alavočienė, S.; Paukštys, V.; Brazionienė, I. Investigation of Microclimate Parameter Assurance in Schools with Natural Ventilation Systems. Buildings 2023, 13, 1807. [Google Scholar] [CrossRef]
- Madureira, J.; Paciência, I.; Rufo, J.; Ramos, E.; Barros, H.; Teixeira, J.P.; de Oliveira Fernandes, E. Indoor air quality in schools and its relationship with children’s respiratory symptoms. Atmos. Environ. 2015, 118, 145–156. [Google Scholar] [CrossRef]
- Muelas, Á.; Remacha, P.; Pina, A.; Tizné, E.; El-Kadmiri, S.; Ruiz, A.; Aranda, D.; Ballester, J. Analysis of Different Ventilation Strategies and CO2 Distribution in a Naturally Ventilated Classroom. Atmos. Environ. 2022, 283, 119176. [Google Scholar] [CrossRef]
- Holmberg, S.; Chen, Q. Air Flow and Particle Control with Different Ventilation Systems in a Classroom. Indoor Air 2003, 13, 200–204. [Google Scholar] [CrossRef]
- Toftum, J.; Kjeldsen, B.U.; Wargocki, P.; Menå, H.R.; Hansen, E.M.N.; Clausen, G. Association between Classroom Ventilation Mode and Learning Outcome in Danish Schools. Build. Environ. 2015, 92, 494–503. [Google Scholar] [CrossRef]
- Petersen, S.; Jensen, K.L.; Pedersen, A.L.S.; Rasmussen, H.S. The Effect of Increased Classroom Ventilation Rate Indicated by Reduced CO2 concentration on the Performance of Schoolwork by Children. Indoor Air 2015, 26, 366–379. [Google Scholar] [CrossRef]
- Fisk, W.J. The Ventilation Problem in Schools: Literature Review. Indoor Air 2017, 27, 1039–1051. [Google Scholar] [CrossRef]
- Toyinbo, O. Indoor Environmental Quality, Pupils’ Health, and Academic Performance—A Literature Review. Buildings 2023, 13, 2172. [Google Scholar] [CrossRef]
- Son, S.; Elkamhawy, A.; Jang, C.-M. Active Soil Filter System for Indoor Air Purification in School Classrooms. Int. J. Environ. Res. Public Health 2022, 19, 15666. [Google Scholar] [CrossRef]
- Mohd Isa, K.N.; Jalaludin, J.; Mohd Elias, S.; Mohamed, N.; Hashim, J.H.; Hashim, Z. Evaluation of the Relationship between Fractional Exhaled Nitric Oxide (FeNO) with Indoor PM10, PM2.5 and NO2 in Suburban and Urban Schools. Int. J. Environ. Res. Public Health 2022, 19, 4580. [Google Scholar] [CrossRef] [PubMed]
- Petropoulou, P.; Artopoulou, I.; Kalemikerakis, I.; Govina, O. Environment and Public Health: Air Pollution and Chronic Diseases. Environ. Sci. Proc. 2023, 26, 118. [Google Scholar] [CrossRef]
- Saffell, J.; Nehr, S. Improving Indoor Air Quality through Standardization. Standards 2023, 3, 240–267. [Google Scholar] [CrossRef]
- Park, H.C.; Lee, D.H.; Yee, J.J. A study on Development and Application of Sequential Control Algorithm of Ventilation and Air Cleaning System for Improving Indoor Air Quality in School Classroom. J. Archit. Inst. Korea 2022, 36, 187–194. [Google Scholar] [CrossRef]
- Choi, Y.J.; Park, B.R.; Song, Y.W.; Choi, E.J.; Moon, J.W. Analysis of Ventilation Systems and Control Methods for Optimal Indoor Air Quality in School Buildings. KIEAE J. 2020, 20, 2. [Google Scholar] [CrossRef]
- Kanama, N.; Ondarts, M.; Guyot, G.; Outin, J.; Gonze, E. Indoor Air Quality Campaign in an Occupied Low-Energy House with a High Level of Spatial and Temporal Discretization. Appl. Sci. 2021, 11, 11789. [Google Scholar] [CrossRef]
- Rodero, A.; Krawczyk, D.A. Carbon Dioxide Human Gains—A New Approach of the Estimation. Sustainability 2019, 11, 7128. [Google Scholar] [CrossRef]
- Mata, T.M.; Martins, A.A.; Calheiros, C.S.C.; Villanueva, F.; Alonso-Cuevilla, N.P.; Gabriel, M.F.; Silva, G.V. Indoor Air Quality: A Review of Cleaning Technologies. Environments 2022, 9, 118. [Google Scholar] [CrossRef]
- Lim, A.-Y.; Yoon, M.; Kim, E.-H.; Kim, H.-A.; Lee, M.-J.; Cheong, H.-K. Effects of Mechanical Ventilation on Indoor Air Quality and Occupant Health Status in Energy-Efficient Homes: A longitudinal field study. Sci. Total Environ. 2021, 785, 147324. [Google Scholar] [CrossRef]
- Yang, S.; Mahecha, S.D.; Moreno, S.A.; Licina, D. Integration of Indoor Air Quality Prediction into Healthy Building Design. Sustainability 2022, 14, 7890. [Google Scholar] [CrossRef]
- Mohamed, S.; Rodrigues, L.; Calautit, J. Overheating and Indoor Air Quality in Primary School in the UK. Energy Build. 2021, 250, 111291. [Google Scholar] [CrossRef]
- Mumtaz, R.; Zaidi, S.M.H.; Shakir, M.Z.; Shafi, U.; Malik, M.M.; Haque, A.; Mumtaz, S.; Zaidi, S.A.R. Internet of Things (IoT) Based Indoor Air Quality Sensing and Predictive Analytic—A COVID-19 Perspective. Electronics 2021, 10, 184. [Google Scholar] [CrossRef]
- Joo, J.S. The Field Measurements and CFD-Simulation of CO2 Concentration on the Elementary Schoolroom, Hoseo University 2008, pp. 1–59. Available online: http://www.dbpia.co.kr/journal/articleDetail?nodeled=NODE07518527 (accessed on 11 September 2023).
- Sadrizadeh, S.; Yao, R.; Yuan, F.; Awbi, H.; Bahnfleth, W.; Bi, Y.; Cao, G.; Croitoru, C.; de Dear, R.; Haghighat, F.; et al. Indoor air quality and health in schools: A critical review for developing the roadmap for the future school environment. J. Build. Eng. 2022, 57, 104908. [Google Scholar] [CrossRef]
- Fang, Y.; Luo, X.; Lu, J. A review of research on the impact of the classroom physical environment on schoolchildren’s health. J. Build. Eng. 2023, 65, 105430. [Google Scholar] [CrossRef]
- Clougherty, J.E.; Ocampo, P. Perception Matters: Perceived vs. Objective Air Quality Measures and Asthma Diagnosis among Urban Adults. Int. J. Environ. Res. Public Health 2023, 20, 6648. [Google Scholar]
- Sung, H.J.; Kim, S.H.; Kim, H. Analysis of Building Retrofit, Ventilation, and Filtration Measures for Indoor Air Quality in a Real School Context: A Case Study in Korea. Buildings 2023, 13, 1033. [Google Scholar] [CrossRef]
- Fluent Theory Guide; ANSYS Inc.: Cannon Sburg, PA, USA, 2019.
- Fluent User’s Guide; ANSYS Inc.: Cannon Sburg, PA, USA, 2019.
- Lee, S.-Y.; Choi, L.-Y.; Park, J.; Daniel, K.E.; Hong, S.-J.; Kwon, K.; Hwang, O. Evaluation of Actual Ventilation Rates and Efficiency in Research-Scale Pig Houses Based on Ventilation Configurations. Animals 2023, 13, 2451. [Google Scholar] [CrossRef]
- Comparison of Filter Classes According EN 779, EN 1822 and ASHRAE 52.2. Available online: https://www.emw.de/en/filter-campus/comparison-of-filter-classes.html (accessed on 11 September 2023).
- BS EN 1822-1:2019. High Efficiency Air Filters (EPA, HEPA and ULPA) Classification, Performance Testing, Marking. Available online: https://www.en-standard.eu/bs-en-1822-1-2019-high-efficiency-air-filters-epa-hepa-and-ulpa-classification-performance-testing-marking/ (accessed on 11 September 2023).


| Educational Facilities Classroom | Target Classroom | |
|---|---|---|
| Classroom area | 67.5 m2 | 92.3 m2 |
| The number of students | 24 | 52 |
| Classroom area per person | 2.81 m2/people | 1.77 m2/people |
| Photo | 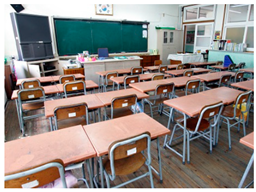 | 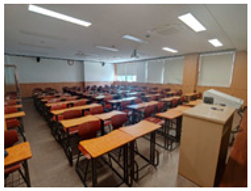 |
| Analysis Models | ||
|---|---|---|
| Viscous | Standard k-ε turbulent model | |
| Species | Species transport | |
| Energy | Energy equation | |
| Species rates and Mass flow inlet | ||
| Indoor (%) | N2 | 79.05 |
| O2 | 20.90 | |
| CO2 | 0.05 | |
| Out-breathing (%) | N2 | 79.70 |
| O2 | 16.30 | |
| CO2 | 4.00 | |
| Mass flow inlet Of out-breathing (kg/s) | 1.5625 × 10⁻⁴ | |
| Boundary conditions | ||
| Upper window | Velocity inlet, Mass flow inlet | |
| Door gap | Pressure outlet | |
| Out-breathing | Mass flow inlet | |
| Case | Inlet Velocity (m/s) | Remark |
|---|---|---|
| Case_V0 | None |
|
| Case_V1 | 0.5 | |
| Case_V2 | 1.0 | |
| Case_V3 | 2.0 | |
| Case_V4 | 3.0 | |
| Case | Inflow angle (°) | Remark |
| Case_A1 | 0 |
|
| Case_A2 | −45.0 | |
| Case_A3 | −22.5 | |
| Case_A4 | 22.5 | |
| Case_A5 | 45.0 | |
| Case | Temperature (°C) | Remark |
| Case_T1 | 5.0 |
|
| Case_T2 | 20.0 | |
| Case_T3 | 35.0 |
| Case | Ventilation Volume (m3/h) | ACH |
|---|---|---|
| Case_V1 | 4916.32 | 17 |
| Case_V2 | 9808.57 | 34 |
| Case_V3 | 20,219.58 | 41 |
| Case_V4 | 30,310.93 | 106 |
| Case_A1 | 20,219.80 | 71 |
| Case_A2 | 20,214.10 | 71 |
| Case_A3 | 20,213.33 | 71 |
| Case_A4 | 20,222.13 | 71 |
| Case_A5 | 20,223.10 | 71 |
| Time | 0 s | 2000 s | 4000 s | 4500 s | |
|---|---|---|---|---|---|
 | Case_V0 (None) | 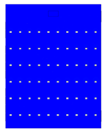 |  | 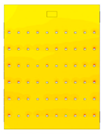 |  |
| Case_V1 (0.5 m/s) | 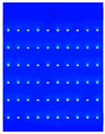 | 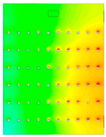 | 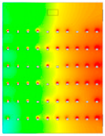 | 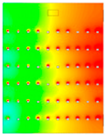 | |
| Case_V2 (1.0 m/s) | 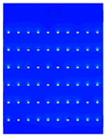 | 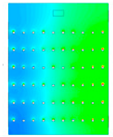 | 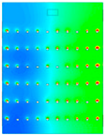 | 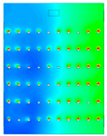 | |
| Case_V3 (2.0 m/s) | 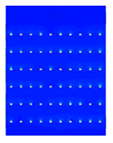 |  | 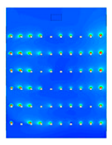 | 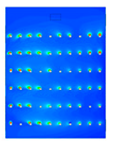 |
| Type | CEN EN779 Class | Efficiency (%) | Particulate Size | Test Standard |
|---|---|---|---|---|
| Coarse dust filter (Primary filter) | G1~G4 | >90 | >5.0 μm | BS EN779 |
| Coarse dust filter (Secondary filter) | M5 | 40 < 60 | ||
| M6~M7 | 40 < 90 | >2.0 μm | ||
| F8~F9 | 90 < 95 | >1.0 μm | ||
| High-efficiency particulate air filter (semi-HEPA, HEPA) | E10 | 85 | BS EN1822 [32] | |
| E11 | 95 | >0.5 μm | ||
| E12 | 99.5 | |||
| H13 | 99.95 | >0.3 μm | ||
| H14 | 99.995 | |||
| Ultra-low- penetration air filter (ULPA) | U15 | 99.9995 | ||
| U16 | 99.99995 | |||
| U17 | 99.999995 |
| Type | CNE EN 779 Class | Air Filter Efficiency (%) | PM10 Weight (μg) | Indoor PM10 Concentration (μg/m3) |
|---|---|---|---|---|
| High- efficiency particulate air filter (HEPA) | E10 | 85 | 536,760 | 27,863.37 |
| E11 | 95 | 9287.79 | ||
| E12 | 99.5 | 928.77 | ||
| E13 | 99.95 | 92.88 | ||
| Ultra-low-penetration air filter (ULPA) | H14 | 99.995 | 9.30 | |
| U15 | 99.9995 | 0.93 | ||
| U16 | 99.99995 | 0.09 | ||
| U17 | 99.999995 | 0.00 |
| Type | CNE EN 779 Class | Air Filter Efficiency (%) | PM2.5 Weight (μg) | Indoor PM2.5 Concentration (μg/m3) |
|---|---|---|---|---|
| High- efficiency particulate air filter (HEPA) | E10 | 85 | 335,320 | 18,444.78 |
| E11 | 95 | 6148.26 | ||
| E12 | 99.5 | 613.47 | ||
| E13 | 99.95 | 61.47 | ||
| Ultra-low-penetration air filter (ULPA) | H14 | 99.995 | 6.15 | |
| U15 | 99.9995 | 0.6 | ||
| U16 | 99.99995 | 0.06 | ||
| U17 | 99.999995 | 0.00 |
Disclaimer/Publisher’s Note: The statements, opinions and data contained in all publications are solely those of the individual author(s) and contributor(s) and not of MDPI and/or the editor(s). MDPI and/or the editor(s) disclaim responsibility for any injury to people or property resulting from any ideas, methods, instructions or products referred to in the content. |
© 2023 by the authors. Licensee MDPI, Basel, Switzerland. This article is an open access article distributed under the terms and conditions of the Creative Commons Attribution (CC BY) license (https://creativecommons.org/licenses/by/4.0/).
Share and Cite
Cho, M.-L.; Choi, H.-J.; Kim, S.-J.; Ha, J.-S. Analysis of Flow Characteristics of Window-Combination-Type Ventilation System Using CFD. Fluids 2023, 8, 294. https://doi.org/10.3390/fluids8110294
Cho M-L, Choi H-J, Kim S-J, Ha J-S. Analysis of Flow Characteristics of Window-Combination-Type Ventilation System Using CFD. Fluids. 2023; 8(11):294. https://doi.org/10.3390/fluids8110294
Chicago/Turabian StyleCho, Mok-Lyang, Hyeon-Ji Choi, Seo-Jin Kim, and Ji-Soo Ha. 2023. "Analysis of Flow Characteristics of Window-Combination-Type Ventilation System Using CFD" Fluids 8, no. 11: 294. https://doi.org/10.3390/fluids8110294
APA StyleCho, M.-L., Choi, H.-J., Kim, S.-J., & Ha, J.-S. (2023). Analysis of Flow Characteristics of Window-Combination-Type Ventilation System Using CFD. Fluids, 8(11), 294. https://doi.org/10.3390/fluids8110294