Abstract
The performance of cable flow-altering bed scour countermeasures was experimentally evaluated based on the scour reduction, bed morphology, and the effects on the flow field. An unprotected 40 mm diameter pier was compared to piers protected with spiral cables (2, 4, 6, 8 and 10 mm diameters) wrapped at a 15-degree angle for two-bed sediment sizes with median grain sizes of 0.86 and 1.83 mm, for a cylinder Reynolds number of 7120. The scour depth was reduced by the cables by up to 52 percent compared to the unprotected pier case, a reduction that increased with increasing cable diameter for both sediment beds. Scour depth and sediment deposition varied by sediment size, where the scour hole was up to 45 percent deeper for the finer sediment bed than that of the coarser bed. Velocity and turbulence statistics showed that cables attenuated the flow within the scour hole by diminishing the downflow and horseshoe vortex, whereas in the case of finer sediment, spatially averaged turbulent kinetic energy and Reynolds shear stresses were respectively up to 1.4 and 1.8 times higher for the unprotected pier than the protected pier, resulting in scour depth reduction. The presence of the cable also reduced the vortex shedding frequency in the pier wake as indicated by a Strouhal number of around 0.175. The results demonstrate the potential of cable threading as a flow-altering scour countermeasure to reduce bridge pier scour.
1. Introduction
Bridge pier scour remains problematic for the integrity and failure of bridge pier foundations and abutments, and several methods have been devised to attempt to mitigate it using a variety of scour countermeasures. As in classic cylinder flows, the flow around bridge piers creates a downflow that contributes to the formation of a horseshoe vortex at the bed boundary, the primary governing hydrodynamic mechanism in scour [1,2,3]. The downward flow results in a horseshoe vortex that spirals around the base of a bridge pier, and both mechanisms are generally accepted as responsible for the formation of the scour hole immediately upstream of the bridge pier due to enhanced shear stresses [1,4,5,6]. The sediment eroded in the formation of the scour hole is deposited in an exit dune in the pier wake. Several experimental investigations have examined the effectiveness of distinct scour countermeasure devices around bridge piers, including submerged vanes, bed sills, sacrificial piles, collars, pier slots and threaded cables, which are typically classified as flow altering or bed armouring measures [2,7,8,9]. However, studies that have examined the impact of a threaded cable wrapped around the pier, a form of the flow altering countermeasure to reduce downflow, show conflicting evidence on the effectiveness of their use in reducing local scour [10,11,12,13], while only one study has offered a physical understanding of how cables modify the flow field [10].
Under both live bed and clear water conditions, threaded piers have been shown to reduce scour depth by up to 48.1% for a cable diameter (bc) to pier diameter (b) ratio (bc/b) of 0.52 under wave conditions and 46.3% for a cable-pier ratio of 0.1 under steady current conditions, with pier diameter-based Reynolds number (Reb) of 52,400 [10]. A scour reduction of up to 15% was observed with octagonal piers for bc/b of 0.15 for Reb = 74,568, and 75,462 by Farooq and Ghumman [13]. However, notably smaller scour reduction of 8.7% for Reb = 10,480 [11] and 12.85% for Reb = 12,000 [12] were observed in investigations conducted with smaller physical models than those of Dey et al. [10].
These variations have been attributed to the different physical scales of the studies, e.g., Reynolds number. Even though the cable diameter to pier diameter ratio (bc/b) and the number of threads and threading angle were consistent between studies, it was postulated that the thinner cable used in the smaller flume study [11,12] was unable to dampen the downflow and weaken the induced horseshoe vortex to the same degree as in the larger flume study [11]. However, the sediment grain size, and more specifically the scaling of the pier width (b) to the median grain diameter (b/d50) is well known to be an influential parameter governing the scour depth [14,15,16] and this is highly likely to be a reason for variations among the study findings. The larger scale study which showed greater scour depth reduction [10], was conducted with a considerably smaller median grain diameter than in the other two studies, thus having lower submerged weight, settling velocity, and for the particle Reynolds number examined, a lower Shields’ number and threshold of motion. In addition, Dey et al. [10] used a pier width considerably greater, and hence the ratio of the pier width to the median grain diameter (b/d50) was at least an order of magnitude greater than in the smaller physical model studies.
With the exception of the study by Dey et al. [10], the physical mechanisms by which these cable wrapping countermeasures alter the flow field have not been investigated, and there is a general inference that the downflow and horseshoe vortex is reduced by the presence of the pier-cable. The former study showed that the downflow was reduced by the presence of a pier-cable which not only resulted in scour depth reduction but also a change in the scour hole bathymetry. The presence of a cable resulted in the formation of a flattened base scour hole rather than a deepened groove immediately upstream of the pier [10,17]. Increasing the cable diameter to pier diameter ratio (bc/b) has also been shown to consistently reduce the scour depth [10,12]. Furthermore, the use of a smaller cable threading angle to the horizontal and the employment of multiple cables wrapped around the pier, can both independently reduce the scour depth (10).
In this paper, clear-water scour experiments were conducted for two-bed particle sizes, two pier width (b) to the median grain diameter (b/d50), and for a wider range of cable-pier diameter ratios than in previous studies. The tests were carried out at a cylinder Reynolds number (Reb) of 7120, a comparable physical scale to previous studies [11,12] and using similar sediment particle sizes. Furthermore, the development of the bed morphological features over time was examined, including both the scour hole immediately upstream of the pier and the exit dune formed in the pier wake. The velocity fields upstream of the pier and in its wake were also examined to elucidate the cable impact on downflow, horseshoe vortex, von-Karman vortex shedding, and wake recovery, which drive the physical mechanisms governing the scour hole formation in the presence of a cable-wrapped pier and resulting downstream bed morphology.
2. Materials and Methods
2.1. Experimental Set-Up
Experiments were performed in a recirculating open channel flume of dimensions 4.1 m length, 0.6 m width and 0.2 m depth. The bed slope of the flume was set at a gradient of 1 in 1000. The flow was driven by a steady electric pump with a flow meter directly connected to the pump’s water output displaying the flow rate. At the upstream end of the flume, the pump discharges water to the upstream reservoir, which flows along the length of the flume to the downstream end where a tailgate weir controls the surface water profile along the flume, before the water enters the downstream reservoir to be recirculated by the pump. Experiments were conducted using two sediment particle sizes with median grain diameters (d50) of 1.83 mm and 0.86 mm (Test series A and B, respectively, Table 1), both corresponding to coarse sand. The grain size was graded uniformly corresponding to a geometric standard deviation of the grain size (σg = (d84/d16)0.5) of 1.22 and 1.21, respectively. A circular bridge pier of 40 mm diameter (b) was located 45 × b (1.8 m) downstream of the approach section. The center point of the bridge pier was positioned along the centerline of the flume, at a lateral distance of 300 mm from each sidewall. The flow depth was maintained at 70 mm and the discharge (Q) was fixed at 7.5 Ls−1 throughout the tests. The mean approach flow velocity U0 was 0.178 ms−1, and these flow conditions correspond to clear-water scour conditions and a pier diameter-based Reynolds number Reb of 7120. The boundary shear stress was 0.56 Nm−2, and the corresponding shear velocity () was 0.024 ms−1. The particle Reynolds numbers ) were 43.18 and 20.29 for sediment d50 of 1.83 mm and 0.86 mm with corresponding Shields numbers () of 0.02 and 0.04, respectively. The critical velocities according to the Hjulström curve were 0.30 and 0.14 ms−1, resulting in flow intensity U0/Uc of 0.4 and 0.58 for sediment d50 of 1.83 mm and 0.86 mm, respectively, which is below the peak threshold ratio for maximum scour of U0/Uc = 1 [14]. The flow conditions were maintained below the level of significant suspended transport and significant bed erosion, to avoid excessive bed scour. Tests were performed for a range of cable diameters (bc) from 2 mm to 10 mm increasing in intervals of 2 mm. The piers without cables were A1 and B1, and the piers with cables A2 to A6 and B2 to B6 (Table 1, Figure 1a). A single thread was wrapped around the pier at 15 degrees to the horizontal which is consistent with previous studies [10,12].

Table 1.
Summary of experimental conditions where bc/b is the cable diameter/pier diameter ratio, where the cylinder diameter b = 40 mm and cable diameters were 2, 4, 6, 8, and 10 mm. Tests were conducted with flow depth y = 70 mm, discharge Q = 7.5 Ls−1, and pier-based Reynolds number (Re= u.b/ν) of 7120. The type of test indicates the series for which bed levels and ADV velocity measurements were collected.
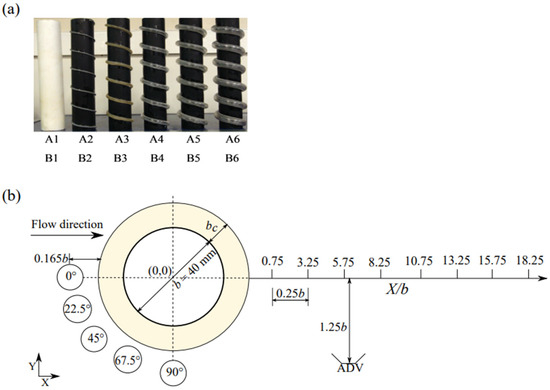
Figure 1.
(a) Model bridge piers with diameter b = 40 mm of varying cable diameter to cable ratio (left to right): no cable (A1 and B1); 2 mm (A2 and B2); 4 mm (A3 and B3); 6 mm (A4 and B4); 8 mm (A5 and B5); and 10 mm (A6 and B6). (b) Plan view of the side-looking ADV probe sampling volume locations around the pier.
2.2. Bed Level and Velocity Measurements
At the start of each experiment, the sediment bed was levelled using a board to form a uniform sediment bed thickness of 60 mm. The bed levels were measured with a Vernier pointer gauge to an accuracy of ±0.1 mm and the velocity statistics were measured using a side-ways looking, four-beam Acoustic Doppler Velocimeter (ADV) Nortek Vectrino Plus with a sampling frequency of 200 Hz. Both instruments were mounted on an instrument rack which was set perpendicular to the flume’s longitudinal axis.
Figure 1b illustrates the ADV sampling locations in the front and wake of the pier. The protected pier is shown with the cable area shaded, showing that the sampling locations remained the same irrespective of whether the cable was present and the cable diameter size. The ADV sampling volume, located 50 mm i.e., 1.25b from the probe, had a 6 mm diameter (0.165b) and 7 mm height. Upstream sampling points were located at 0°, 22.5°, 45°, 67.5° and 90° angles from the pier centerline. The wake sampling locations were spaced by 10 mm, and ranged from X/b = 0.75 to 18.25.
The first bed scour test for each setup had a total running time of 24 h. These tests were used to ascertain that at least 95% of the maximum scour depth was obtained within the first 10 and 12 h of the experiment for sediment d50 of 0.86 mm and 1.83 mm, respectively (Figure 2). Therefore, the remaining tests were performed over a total running time for each experiment of at least 12 h. The bed elevation was measured at the start of the test then every 15 min for the first 2 h, 30 min for the following 2 h, and then at 60 min intervals for the remainder of the test along the channel centerline and at a lateral distance of 40 mm offset from the centerline. To allow comparison with the results from former studies [10,11,12], percentage scour reduction efficiency is defined as the difference in scour depth at the deepest bed point between the protected cable-wrapped pier (Dsp) and the unprotected pier (Ds) divided by the bed level of the unprotected pier: 100·(Ds − Dsp)/Ds.
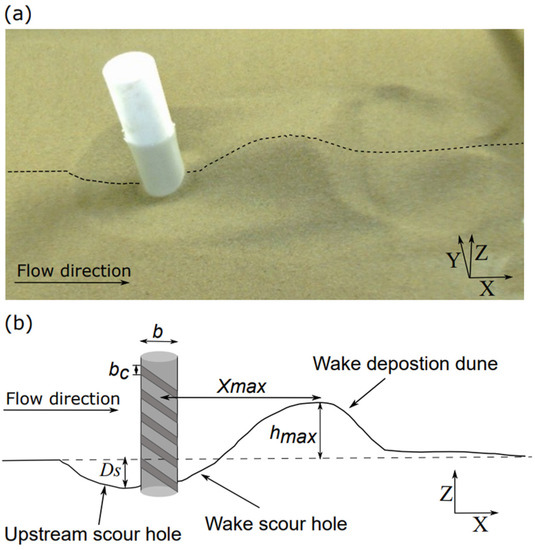
Figure 2.
(a) Photograph of the scour pattern for the control pier without cable with sediment size d50 = 0.86 mm. (b) outline of the centerline of the bedforms at 12 h with a protected pier of diameter b and cable diameter bc illustrated, and dimensions of the scour hole depth (Ds), the wake deposition dune peak height (hmax) and its longitudinal distance downstream of the pier (Xmax).
The sampling volume of the ADV velocimeter was located 50 mm away from the probe’s center and comprised a cylinder of 7 mm height and 6 mm diameter (Nortek AS, 2013). Measurements were collected at five locations around the front of the pier circumference, and at five elevations within the water column corresponding to the sampling volume centroid being located at 10 mm, 15 mm, 20 mm, 25 mm, and 30 mm from the bed (see Figure 1b). Velocity measurements were taken after 12 h into the test. A sampling period of 300 s was used, which was sufficient to gain an accurate representation of the time-averaged velocity and turbulence statistics based on convergence tests. The sound-to-noise ratio (SNR) and correlation (COR) values were maintained above 20 dB and 70% respectively, which was achieved by seeding the water with silicate powder of 10 μm mean diameter (density of 1.1 g/cm3). These SNR and COR thresholds were used for filtering the velocity time series, in addition to despiking using the Phase-Space Thresholding (PST) method of Goring and Nikora [18]. Power spectra analysis used MATLAB R2021a, where peak vortex shedding frequency was obtained by Fourier transform of wake data points sampled at the end of the 12-h experiments, at 40 mm (one cylinder diameter) above the initial bed level. The Fourier analysis was performed with the pwelch (Welch’s power spectral density estimate) function in MATLAB which enables to sub-divide the signal into smaller time series and average of the resulting Fourier transform.
3. Results and Discussion
3.1. Time Evolution of Bed Morphology and Scour Depth after 12 h
Figure 2 illustrates the observed bed formations including: the main scour hole immediately upstream of the pier, a smaller degree of scouring in the pier’s wake, an exit dune formed immediately downstream of the wake scour hole, and two localized regions of scouring located downstream of the dune which straddled each side of the dune (Figure 2a).
Figure 3 shows the temporal evolution of the bed levels along the flume centreline (a and b) and at 1 pier diameter offset from the centreline (c and d) for the unprotected pier (test series B1) and bc/b = 0.25 (test series B6), respectively for the small grain size sediment (d50 = 0.86 mm). Maximum scour depth Ds normalized by cylinder diameter b for both sediment sizes for series A1 to A5 and B1 to B6 are shown in Figure 4.
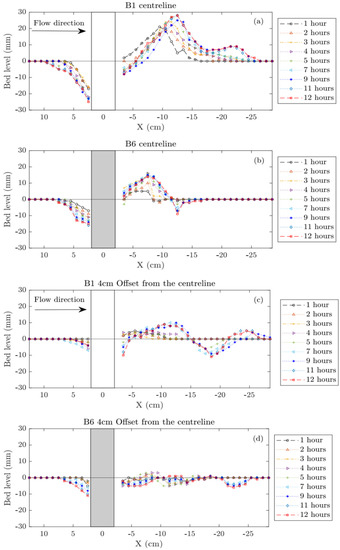
Figure 3.
Longitudinal section of the bed development over time from 1 h to 12 h where (a,b) is along the channel and cylinder centerline (Y = 0) and (c,d) are one-cylinder diameter lateral offset from the centerline (Y = 40 mm) for the experiment with sediment d50 = 0.86 mm, where B1 is the unprotected pier and B6 is the protected pier with cable-pier diameter ratio bc/b = 0.25. Flow is from left to right.
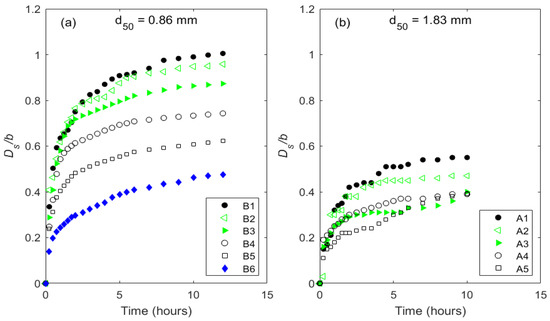
Figure 4.
Time evolution of maximum scour for (a) the fine sediment with d50 = 0.86 mm and (b) coarse sediment with d50 =1.83 mm, where A1 and B1 are the unprotected pier and A2 to A5, and B1 to B6 are the cable protected piers.
The time evolution of bed levels showed similarities in prominent bed features, which were present for both the protected and unprotected pier cases, however, the features’ extent and location varied between the two cases (Figure 3). The scour depth at 12 h depended on the ratio of d50 and cylinder diameter (d50/b) as the unprotected pier showed Ds = 40.2 and 21.9 mm for the small grain size sediment (d50 = 0.86 mm) and the larger grain size sediment (d50 = 1.83 mm) respectively (Figure 4). This difference was reflected in the scour depth and wake depositions for cable-protected piers, whose exit dune maximum height and peak location downstream of the pier are shown in Figure 5, where the unprotected pier resulted in higher dune peak (hmax/ho) (Figure 5a) that was located (Xmax/ho) further form the pier compared to the cable-protected piers (Figure 5b). Similar to the scour hole being longer, deeper and narrower for the unprotected pier than for the protected pier, the wake dune was taller, longer and wider than the dune formed for the protected pier and was located a further distance downstream from the pier, also presented in Figure 3, as sediment entrained from the upstream and in the near-wake is deposited downstream.
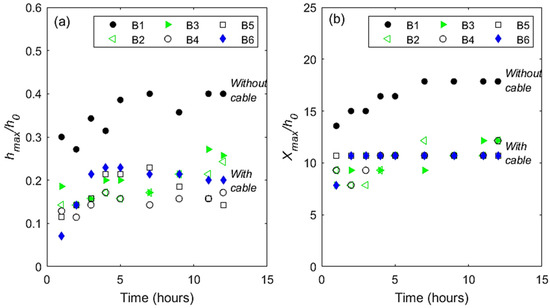
Figure 5.
Wake dune height hmax (a) and downstream position xmax, (b) normalized with the approach flow depth h0 for the B1 to B6 test series with sediment d50 = 0.86 mm.
For a bed composed of the small grain size sediment (d50 = 0.86 mm), the percentage scour depth reduction (100 · (Ds − Dsp)/Ds) increased with increasing cable-pier ratio for all cable-pier diameters examined. While for the coarser sediment bed (d50 = 1.83 mm) the scour depth reduction increased with increasing cable diameter up to a cable-pier diameter of 0.1 and remained nearly constant with further increases in cable-diameter ratio. For an intermediate cable-pier diameter ratio (bc/b = 0.15), the presence of the cable had a similar impact on scour reduction independent of the bed sediment size (Figure 6). However, as the cable-pier diameter ratio increases further, the impact of the cable is greater for the finer bed sediment compared to the larger bed sediment, whereby the scour hole depth is halved for the highest cable-diameter ratio compared to the condition without cable pier (scour depth reduction of 52%). This compares to a scour hole depth reduction of around a third (scour depth reduction of 32%) for the coarser sediment particle size.
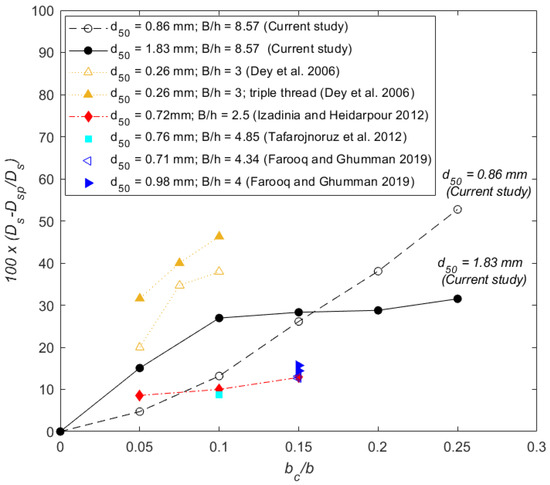
Figure 6.
Variation in percentage scour depth reduction of the protected pier compared to the unprotected pier for different cable diameter to pier diameter ratios (bc/b) and for different median sediment diameters (d50). Data from the current study are compared with previous studies. The channel width to flow depth ratio (B/h) is given in the legend [10,11,12,13].
The upstream scour hole for the unprotected pier was deeper, longer, narrower, and more localized compared to the protected pier, which was shallower and wider with the scour depth maintained over a greater lateral distance away from the pier centerline, as displayed in the centreline and 1 pier diameter offset bed profiles (Figure 3), 12-h scour depth (Figure 4) and in final bathymetry contours at 12 h for test series B1 and B6 (Figure 7). For the protected pier, negligible scouring was present along the channel centerline immediately downstream of the pier (≤50 mm), whilst scouring occurred along the shear layer region separating the pier wake and freestream region (Figure 3). This contrasts with the unprotected pier where a scour hole formed in the recirculation zone immediately downstream of the pier. The development of the exit dune properties for d50 = 0.86 mm, B1 through B6 test series is shown in Figure 3 and Figure 5, where for the unprotected pier, the downstream exit dune was approximately twice the height (Figure 5a), length and width of that from the protected pier and was formed further downstream from the pier than in the protected pier case (Figure 3).
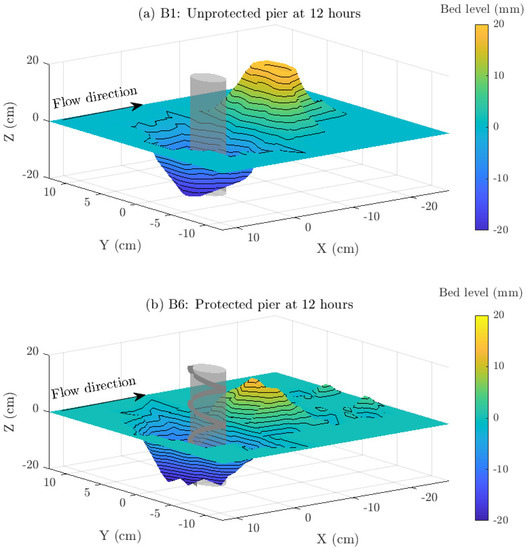
Figure 7.
Local scour and deposition patterns for the (a) pier without cable and (b) cable-wrapped pier for the fine sediment (d50 = 0.86 mm) at 12 h. Bed levels are shown as contour levels in millimetres, where the initial bed level is zero, negative values indicate scour, and positive values indicate deposition. The flow direction is from left to right.
For the unprotected pier, the scour hole moved further downstream with time and closer to the pier’s upstream face. Similarly, the exit dune formed in the pier wake moved progressively downstream with time (Figure 3 and Figure 5). At around five hours, the height of the dune peak above the initial bed nearly reached its final height and downstream location and this bed feature induced the formation of two shallower to scour holes on either side of the dune (Figure 3b) which persisted throughout the remainder of the test (Figure 7b). The wake scour holes are deeper and located closer to the dune for the unprotected pier (Figure 7a) compared to the protected pier (Figure 7b); while for the protected pier, more prominent additional secondary scour holes are present downstream of the dune (Figure 3c and Figure 7b).
3.2. Effect of Cable Wrapping on the Flow Field
The presence of the cable reduced the downflow on the upstream face of the pier, and this decrease was more pronounced at the sampling points closest to the bed, shown in Figure 8 for d50 = 0.86 mm, B1 unprotected and B6 protected piers. Indeed, the downflow is reduced on the upstream face of the pier, with the effective downflow vertical velocity being reduced in the presence of the wrapped cable. Furthermore, the turbulent kinetic energy (k= 0.5(u’2+ v’2+ w’2)) and the turbulent shear stress ((u’w’2+u’v’2)1/2) magnitudes were both reduced at the upstream face and over the pier’s circumference (Figure 8c,d) and (e,f), respectively). Offset from the centerline from the point at 0° angle to that at 90° angle, (see Figure 1b), the variation in both turbulence quantities over the lower half of the water column is much diminished and uniform for the condition with cable. The spatially averaged downflow velocity component for upstream locations above the scour hole after 12 h for the protected pier was 70% of the magnitude for the unprotected pier for the fine sediment tests (d50 = 0.86 mm).
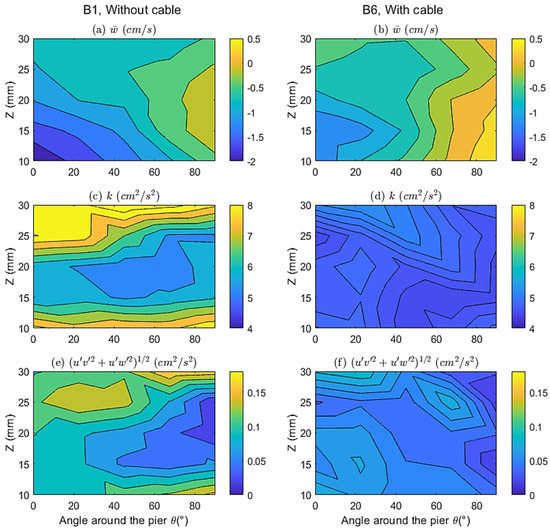
Figure 8.
Time-averaged (a,b) vertical velocity, (c,d) turbulent kinetic energy, and (e,f) modulus of vertical and horizontal Reynolds stress components at points 1 (0°), 2 (22.5°), 3 (45°), 4 (67.5°) and 5 (90°) around the pier (see Figure 1b) and through the water column (z is measured from the bed) for the fine sediment (d50 = 0.86 mm) for the unprotected pier (B1) (left) and the protected pier with a 10 mm diameter wrapped cable (B6) (right).
In the pier wake, flow reversal in the recirculation zone downstream of the pier was present over a longer spatial extent for the unprotected configuration than the protected one, as negative streamwise velocities were higher for the unprotected pier for both bed sediments, as shown in Figure 9a versus (c) and (b) versus (d) for sediment test series A1 compared to A6 and B1 versus B6, respectively. The wake flow patterns also varied depending on sediment grain size due to the different final bed morphologies. As such, the deeper scour holes formed in the smaller grain sediment size (B1 and B6) increased the available cross-sectional area in front of the pier, resulting in less flow blockage and lower values of mean longitudinal (u) velocities than for the larger sediment (A1 and A6). The distribution of the vertical velocity component (w) in the pier wake (Figure 9e–h) showed larger values for coarser sediment (A cases) than the finer sediment (B cases) due to the variation of flow blockage effect of the various scour depths and hole geometries (see Figure 3).
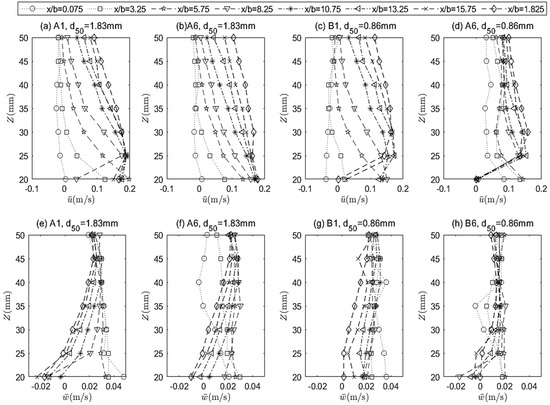
Figure 9.
Profiles of the longitudinal u (a–d) and vertical w (e–h) velocity components along various longitudinal X/b distances in the pier wake for both sediment d50 = 1.83 mm (A1 and A6) (left) and d50 = 0.86 mm (B1 and B6) (right) for the unprotected pier (A1 and B1) and the protected pier with bc/b = 0.25 (A6 and B6).
Strouhal numbers (St = f·b/U0, where f is the vortex shedding frequency) obtained from the time-series of three velocity components in the pier’s wake at an elevation of one pier diameter above the bed are shown in Figure 10. The nominal pier diameter b = 40 mm was used to calculate St for the unprotected pier (A1 and B1), while an effective diameter of 45 mm was used for the cable-protected piers with 10 mm diameter cable in tests A6 and B6, to account for the presence of the cable around the pier. For the unprotected cases with coarse sediment, St was around 0.2 which coincides with that observed for unbounded cylinder flows. For the protected piers A6 and B6, St was nearly constant at around 0.175, which indicates a reduction in the shedding frequency of the wake vortices associated with the cable presence. The velocity components with the peak vortex shedding frequency in the power spectral density varied between cases, with more prominent vertical component w in the unprotected pier cases A1 and B1, while peak frequencies alternated between u, v, and w components for the protected pier cases A6 and B6.
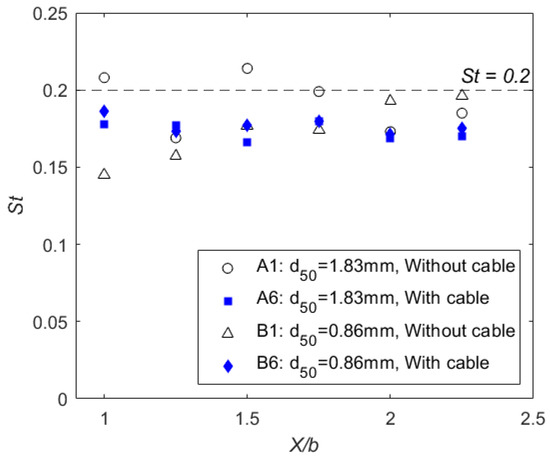
Figure 10.
Peak vortex shedding frequencies f for points in the wake, located at one cylinder diameter, 40 mm, above the initial bed with increasing downstream distance (X/b) of the protected (A1 and B1) and unprotected piers (A6 and B6) for both d50 = 0.86 mm (B) and 1.83 mm (A) sediment sizes.
The exit dune’s peak height and its location from the pier (Figure 5) corresponded to the longer recirculation zone before the dune, generated by the unprotected pier for the fine sediment with d50 = 0.86 mm, and thus the von-Kármán vortices likely remain coherent over a longer downstream distance for the unprotected pier than for the protected pier. The cable interrupts the flow path of the upstream downflow and breaks up its energy, which diminishes the horseshoe vortex and its scouring potential, leading to reduced scour upstream. The reduced scour depth also results in a diminished exit dune in the pier wake, as the flow paths rejoin the free steam flow in the pier wake.
The current study corroborated the scour reductions due to cable countermeasures, in addition to evaluating the hydrodynamic impact of the cables on the scour processes. As previous studies have shown, cables utilized in combination with other flow-altering or bed-armoring countermeasures are highly efficient at reducing scour depth [12,13].
Much of the upstream scour hole depth was formed within the first five hours of flow action (Figure 3 and Figure 4), which is typical for clear-water scour conditions [14]. The downstream dune progression was also similar to observations by Oliveto and Hager [19]. The scour reduction in terms of the scour efficiency 100 · (Ds − Dsp)/Ds, demonstrated an overall increase with increasing bc/b, although with varying extents with over 30% differences in scour reduction for bc/b ≤ 0.1 (Figure 6). b/d50 ratios were 46.5 and 21.85 in the current study for the finer and coarser sediments, respectively; while it was 769.23 [10]; 55.55 [12]; 63.15, 52.63 [11]; 70.4, 51.02, 102.04 and 140.84 [13] in previous studies shown in Figure 6. Therefore, differences in scour efficiencies are most likely due to differences in sediment grain size, particularly for the finer sediment used and the significantly greater pier to sediment grain ratio used in the study by Dey et al. [10] (Figure 6). Further differences in scour reduction might be attributed to the flow intensity being below the peak threshold condition of U0/Uc = 1 [14].
Scour depth reductions resulting from the presence of the cable occurred due to the reduced effective downflow vertical velocity, turbulent kinetic energy and turbulent shear stress upstream of the pier. In addition, the reduced Strouhal number in the protected pier case suggests that the combined cable and pier diameter governed the wake vortex shedding and the wake bed formations.
Evaluating instantaneous flow fields, particularly the horseshoe vortex would further elucidate the impact of cables on the flow field and scour reduction, and evaluating the feasibility of the cable wrapping method, particularly the pier-cable diameter ratio at various scales, would further refine this scour countermeasure method.
4. Conclusions
Experiments were conducted to evaluate the effects of cable countermeasures on scour depth, flow field, vortex shedding frequency and bathymetry over time for two sediment sizes. Increasing the cable-pier diameter ratio resulted in a reduction in the scour depth, with reductions of 32% and 52% for the coarse and fine sediment sizes, respectively. Scour reduction reached a threshold at the cable-to-pier diameter ratio of 0.1 for the coarse sediment, while it continually increased up to a ratio of 0.25 for the fine sediment, indicating that benefits of scour reduction from increased cable-to-pier diameter ratio improve for finer sediments. The cables reduced scour depth upstream of the pier and in its wake over time, as well as reducing the downflow scour action in the sediment bed around the pier. In the wake, the exit dune’s peak height increased with time and its maximum height was reached by 12 h of runtime. The exit dune had a smaller magnitude and was considerably closer to the downstream face of the pier for the protected pier than for the unprotected case. The vertical velocities, turbulent kinetic energy and Reynolds stress around and downstream of the pier reduced in magnitude for larger wrapping cables, indicating that the cables dampen the downflow and horseshoe vortex strength that govern pier scour formation, resulting in smaller changes in bed scour. The effect of the cable was also observed to reduce the vortex shedding frequency in the pier wake, where the Strouhal number decreased from 0.2 in the classic cylinder case to 0.175, indicating a reduction in wake vortices. Research into the instantaneous flow field is ongoing to further investigate the turbulent wake structure and the generated bed morphology.
Author Contributions
Conceptualization, V.M. and C.A.M.E.W.; methodology, V.M. and C.A.M.E.W.; Experimentation, V.M. and N.F.; validation, V.M., C.A.M.E.W., N.F. and P.O.; formal analysis, V.M., C.A.M.E.W., N.F. and P.O.; writing—original draft preparation, V.M. and C.A.M.E.W.; writing—review and editing, V.M., C.A.M.E.W., N.F. and P.O.; visualization, V.M.; supervision, C.A.M.E.W. and P.O.; funding acquisition, C.A.M.E.W. All authors have read and agreed to the published version of the manuscript.
Funding
The work was partly supported by Cardiff Undergraduate Research Opportunities Programme (CUROP) for N.F.
Data Availability Statement
All data are presented in the main text.
Acknowledgments
We thank Guglielmo Sonnino Sorisio, Ana Pinto Oliveira and Muhammad Hasanov for assistance with data collection during experiments.
Conflicts of Interest
The authors declare no conflict of interest.
References
- Unger, J.; Hager, W.H. Down-flow and horseshoe vortex characteristics of sediment embedded bridge piers. Exp. Fluids 2006, 42, 1–19. [Google Scholar] [CrossRef]
- Wang, C.; Yu, X.; Liang, F. A review of bridge scour: Mechanism, estimation, monitoring and countermeasures. Nat. Hazards 2017, 87, 1881–1906. [Google Scholar] [CrossRef]
- Guan, D.; Chiew, Y.-M.; Wei, M.; Hsieh, S.-C. Characterization of horseshoe vortex in a developing scour hole at a cylindrical bridge pier. Int. J. Sediment Res. 2019, 34, 118–124. [Google Scholar] [CrossRef]
- Hjorth, P. Studies on the Nature of Local Scour: Institutionen för Teknisk Vattenresurslära; Lunds Tekniska Högskola, Lunds Universitet: Lund, Sweden, 1975. [Google Scholar]
- Melville, B.W. Local Scour at Bridge Sites. Ph.D. Thesis, The University of Auckland, Auckland, New Zealand, 1975. [Google Scholar]
- Dey, S.; Bose, S.K.; Sastry, G.L.N. Clear Water Scour at Circular Piers: A Model. J. Hydraul. Eng. 1995, 121, 869–876. [Google Scholar] [CrossRef]
- Johnson, P.A.; Niezgoda, S.L. Risk-Based Method for Selecting Bridge Scour Countermeasures. J. Hydraul. Eng. 2004, 130, 121–128. [Google Scholar] [CrossRef]
- Pagliara, S.; Carnacina, I.; Cigni, F. Sills and gabions as countermeasures at bridge pier in presence of debris accumulations. J. Hydraul. Res. 2010, 48, 764–774. [Google Scholar] [CrossRef]
- Tafarojnoruz, A.; Gaudio, R.; Dey, S. Flow-altering countermeasures against scour at bridge piers: A review. J. Hydraul. Res. 2010, 48, 441–452. [Google Scholar] [CrossRef]
- Dey, S.; Sumer, B.M.; Fredsøe, J. Control of Scour at Vertical Circular Piles under Waves and Current. J. Hydraul. Eng. 2006, 132, 270–279. [Google Scholar] [CrossRef]
- Tafarojnoruz, A.; Gaudio, R.; Calomino, F. Evaluation of Flow-Altering Countermeasures against Bridge Pier Scour. J. Hydraul. Eng. 2012, 138, 297–305. [Google Scholar] [CrossRef]
- Izadinia, E.; Heidarpour, M. Simultaneous use of cable and collar to prevent local scouring around bridge pier. Int. J. Sediment Res. 2012, 27, 394–401. [Google Scholar] [CrossRef]
- Farooq, R.; Ghumman, A.R. Impact Assessment of Pier Shape and Modifications on Scouring around Bridge Pier. Water 2019, 11, 1761. [Google Scholar] [CrossRef]
- Melville, B.W.; Chiew, Y.-M. Time Scale for Local Scour at Bridge Piers. J. Hydraul. Eng. 1999, 125, 59–65. [Google Scholar] [CrossRef]
- Lee, S.O.; Sturm, T.W. Effect of Sediment Size Scaling on Physical Modeling of Bridge Pier Scour. J. Hydraul. Eng. 2009, 135, 793–802. [Google Scholar] [CrossRef]
- Sheppard, D.M.; Melville, B.; Demir, H. Evaluation of Existing Equations for Local Scour at Bridge Piers. J. Hydraul. Eng. 2014, 140, 14–23. [Google Scholar] [CrossRef]
- Dey, S.; Raikar, R. Characteristics of Loose Rough Boundary Streams at Near-Threshold. J. Hydraul. Eng. 2007, 133, 288–304. [Google Scholar] [CrossRef]
- Goring, D.G.; Nikora, V.I. Despiking Acoustic Doppler Velocimeter Data. J. Hydraul. Eng. 2002, 128, 117–126. [Google Scholar] [CrossRef]
- Oliveto, G.; Hager, W.H. Morphological Evolution of Dune-Like Bed Forms Generated by Bridge Scour. J. Hydraul. Eng. 2014, 140, 06014009. [Google Scholar] [CrossRef]


Disclaimer/Publisher’s Note: The statements, opinions and data contained in all publications are solely those of the individual author(s) and contributor(s) and not of MDPI and/or the editor(s). MDPI and/or the editor(s) disclaim responsibility for any injury to people or property resulting from any ideas, methods, instructions or products referred to in the content. |
© 2022 by the authors. Licensee MDPI, Basel, Switzerland. This article is an open access article distributed under the terms and conditions of the Creative Commons Attribution (CC BY) license (https://creativecommons.org/licenses/by/4.0/).