Abstract
The development, verification, and validation of Computational Fluid Dynamics (CFD) codes in reference to nuclear power plant (NPP) safety has been a focus of many research organizations over the last few decades. Therefore, a collection of Rossendorf Coolant Mixing Test Facility (ROCOM) CFD-grade experiments was made obtainable to line up a global International Atomic Energy Agency (IAEA) benchmark regarding Pressurized Thermal Shock (PTS) situations. The benchmark experiment describes the complicated flow structures in mixed convection zones of the RPV during PTS events. The experiments were utilized to validate CFD codes. Additionally, an experiment with no buoyancy forces was elite to point out the influence of density variations. Compared to earlier studies, the turbulence models of the CFD code improved a lot. The turbulence modeling approach shows a respectable agreement with the experimental data.
1. Introduction
Computer-based simulations are already well established in the analysis of nuclear safety, as mentioned at various international conferences (CFD4NRS, ICONE, NURETH, etc.). The development, verification, and validation of CFD codes relevant to NPP safety necessitates more work on the complicated physical modeling processes concerned, and in the event of numerical schemes being required to unravel the essential equations. The performance of coolant mixing for enhancing the safety of nuclear reactors remains an issue for investigation, both experimentally and numerically. As an example, for many years, intensive experimental work has been done using the ROCOM test facility [1], supplementing the available information concerning mixing phenomena in PWRs with necessary new knowledge [2,3]. Additionally, there is a variety of validation work on the applicability of CFD methods for simulating ROCOM coolant mixing experiments (Höhne [4], Cartland [5], Bucalossi [6], Farkas [7], Jayaraju [8], da Silva [9], Petrov [10], Rohde [11]). Therefore, at the International Atomic Energy Agency (IAEA) benchmarks were organized using two ROCOM CFD-grade experiments mentioned in Höhne [12]. The ROCOM facility is a 1:5 scaled model of the 4-loop Konvoi nuclear reactor. There were about 4000 measurement points by means of the Wire Mesh Sensor (WMS) technique [13] that have the potential to obtain data up to 10,000 times per second.
The experimental data had antecedently been opened, thus a solely associate degree ‘open’ benchmark exercise can be performed. A group of ROCOM test cases was made available, with reference to PTS and boron dilution situations [14]. It should be noted that every experiment had been conducted five times to confirm the validity of the experimental information. In each case, initial and boundary conditions were described. A CAD file of the geometry, which has recently been updated, is obtainable. All information is available in tabular form, for easy interpretation. The benchmark experiments analyzed in this paper are dedicated to PTS situations. Density variations between the fluid water and therefore the primary loop inventory will play a very important role throughout loss-of-coolant accidents in nuclear power plants because the injection of the comparatively cold code water will induce buoyancy-driven stratification. This stratification can cause thermal loads on the reactor pressure vessel. Such problems are of concern to the safety of the NPP. However, these have to be addressed at the design stage, since they need to immediately influence the projected lifetime of the plant. This paper shows the results of post-test numerical simulations of two PTS benchmark experiments. In Section 2 and Section 3 the ROCOM test facility and instrumentation are explained; Section 4 contains a description of the Pressurized Thermal Shock (PTS) experiments; Section 5 deals with the Numerical Modeling with ANSYS CFX, followed by the initial and boundary conditions; and finally we look at the results of a numerical simulations comparison and the two PTS benchmark experiments.
2. ROCOM Test Facility
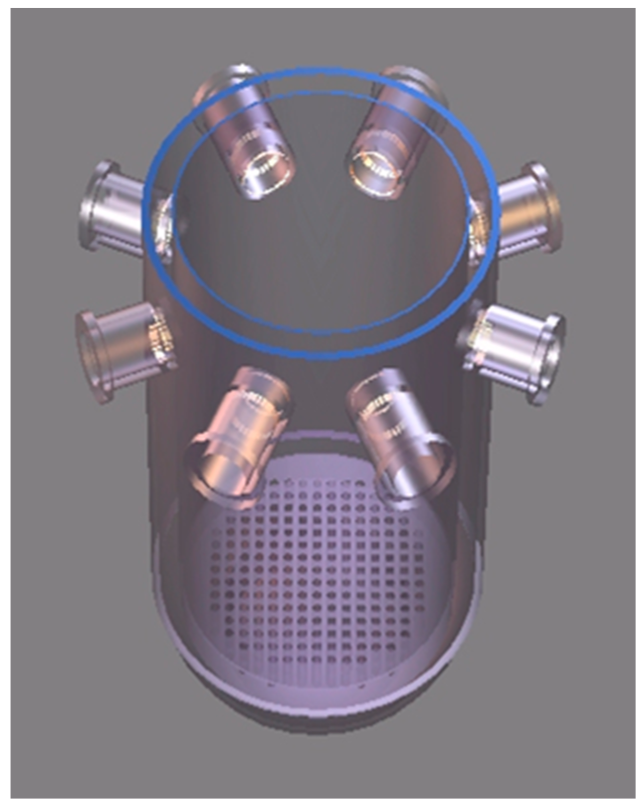
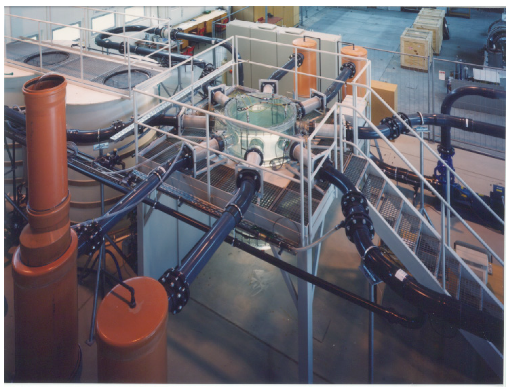
The Mixing Test Facility ROCOM [1,2] comprises an RPV with four inlet and four outlet nozzles. The facility is supplied with four operative loops, i.e., four frequency-controlled circulation pumps. The reactor model is factory-made from Plexiglas© (Figure 1). A bird’s-eye view of the facility is shown in Figure 2.
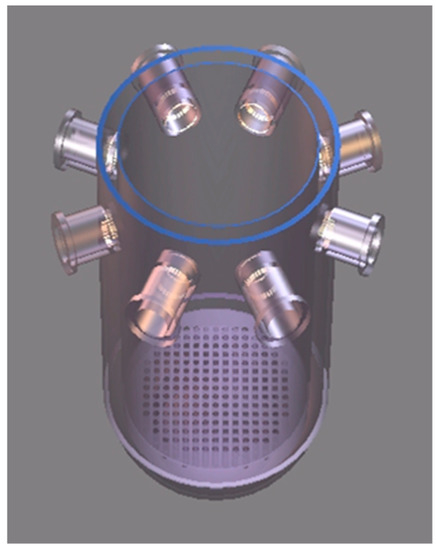
Figure 1.
The reactor model (acrylic material).
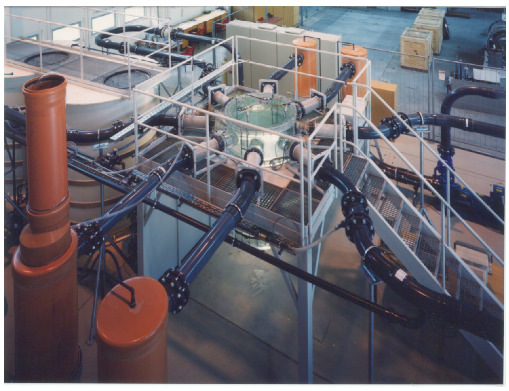
Figure 2.
Bird’s-eye view of the test facility.
3. Instrumentation
Conductivity sensors [13] were utilized to measure the tracer distribution within the reactor model. Measured local conductivities are afterwards associated with reference values. The mixing scalar Θ is defined in Equation (1):
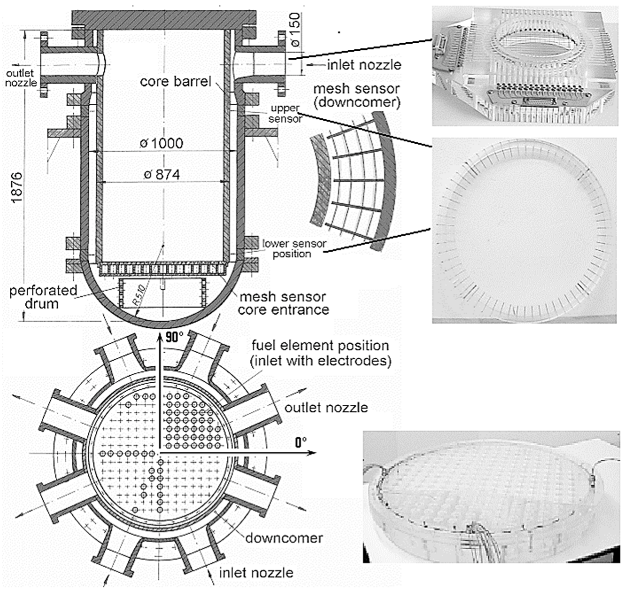
σ is the electrical conductivity, T the temperature, and CB the boron concentration. Wire Mesh Sensors [13] were placed at four positions on the flow path. The reference values correspond to the unaffected coolant (index 0) and the coolant at the disturbed reactor inlet nozzle (index 1). The difference between the two reference values is the magnitude of the perturbation. The upper sensor in Figure 3 is flanged to the reactor inlet nozzle (Figure 1) in loop 1. It is geared towards the observation of the distribution at the reactor inlet. The second and third instruments are situated within the downcomer. These downcomer sensors encompass radial fixing rods with orifices for four circular conductor wires. The fourth device is integrated into the core support plate. Two x fifteen conductor wires are arranged in such a way that the wires of the two planes cross within the centers of the fluid recess orifices of every fuel element. Through this method, the tracer concentration is measured at every fuel element. In total, approximately 1000 measuring points are recorded, with a scanning frequency of 200 Hertz. In most of the cases, five consecutive measurements were averaged and the result was kept with a frequency of 20 times per second, which is about the characteristic frequency of the discovered phenomena. The measurement uncertainty is about 4%.
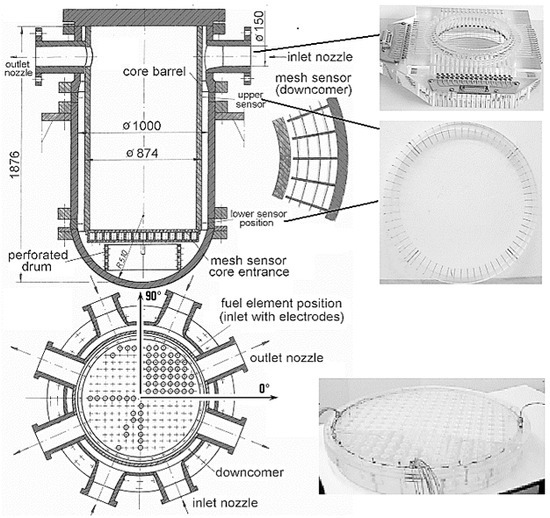
Figure 3.
Wire Mesh Sensors [13] for measuring tracer distributions.
4. Pressurized Thermal Shock (PTS) Experiments
PTS refers to a condition that challenges the integrity of the RPV. The integrity of this primary component in a nuclear power plant is vital, which explains why the PTS events receive attention in nuclear safety analyses. Three conditions are typically considered prerequisites that lead to a PTS safety concern. These include neutron embrittlement of the RPV, some type of existing flaw, and finally a rapid temperature drop in the system (overcooling event). Density variations between the comparatively cold ECC water injected during loss-of-coolant accidents in NPPs and the hot water within the primary loop inventory will play a crucial role in the safety of aging NPPs by causing probably dangerous buoyancy-driven temperature stratifications.
One case, with a density difference 10% above that of the loop water, was chosen as the reference for this numerical benchmarking exercise. As the ROCOM facility cannot be heated up, the higher density of the cold ECC water is simulated by adding sugar (glucose). A sugar resolution with a density of 1100 kg/m3 incorporates a viscosity three times above that of pure water. The sugar tracer is thus assumed to be a fluid with low viscosity. Additionally, for comparison, another case was chosen with no density difference between ECC water and existing coolant.
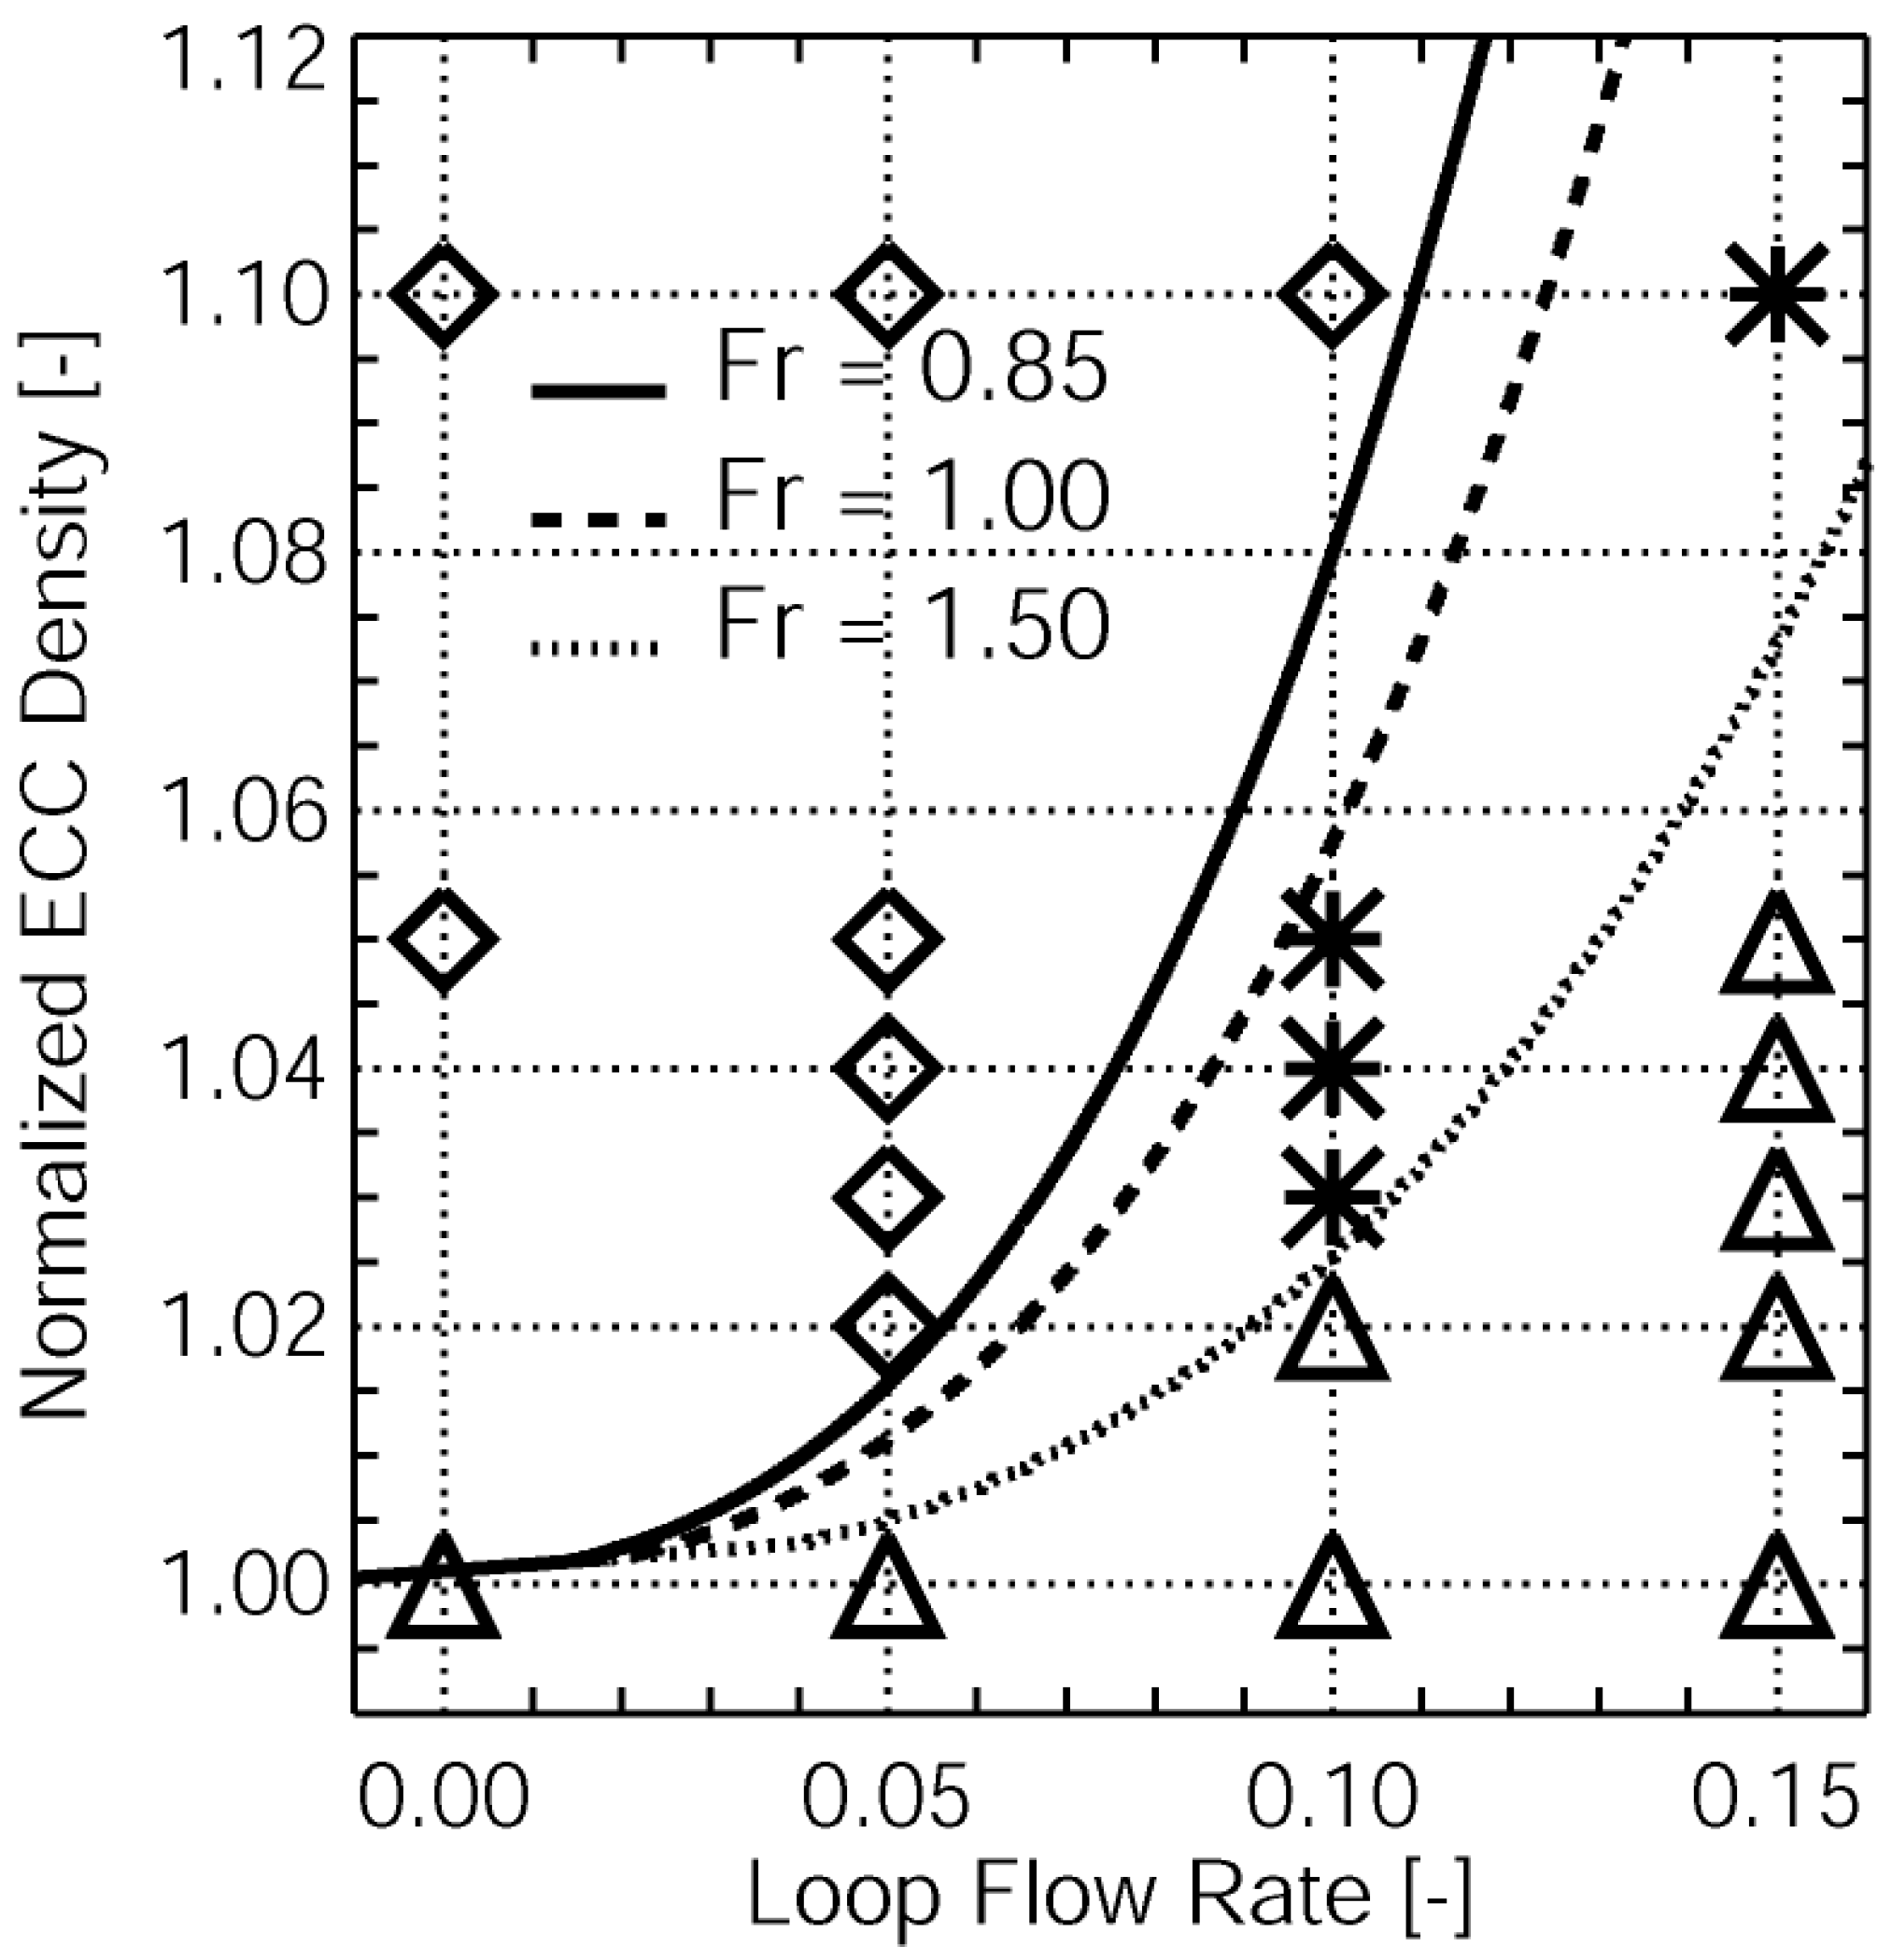
Figure 4 displays the boundary conditions utilized in the experiments. In total, 21 experiments were dispensed to form a test matrix [14].
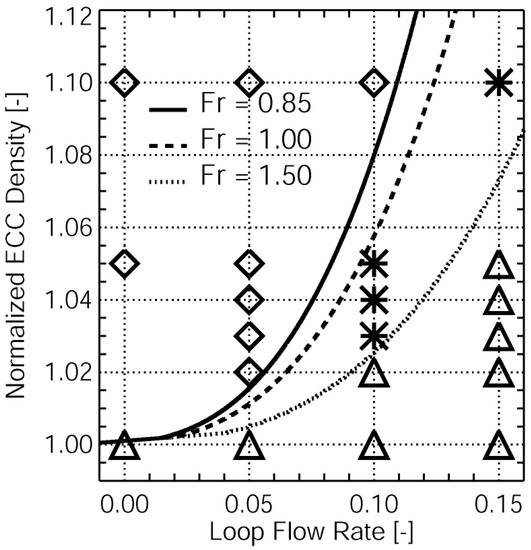
Figure 4.
Experimental matrix of PTS experiments, isolines of Froude numbers.
In their papers [4,11] authors analyzed all experiments of the test matrix. They determined the densimetric Froude number Fr, outlined in Equation (2):
where v is a characteristic flow velocity in the downcomer, g is the acceleration due to gravity, and l is a characteristic length of the downcomer. The experiments are shown in Table 1. The Froude number for the selected PTS2 case is Fr = 0.85 and should be assumed density-affected, provided in Figure 4. This test represents the transition region between momentum-driven and density-driven flow. The second experiment in Table 1 has 15% (constant) flow rate in one loop and 0% density difference between ECC and loop water (PTS1).

Table 1.
Experiments.
The flow rate of the ECC injection line was constant at 3.6 m3/h. The normalized density ratio is outlined as the magnitude relation between the water density of the ECC injection line and the fluid density of the existing water within the circuit.
5. Numerical Modeling with ANSYS CFX
5.1. Input Deck
The CFD code for simulating the studies was ANSYS CFX [15]. The separation of error elements for complicated three-dimensional calculation is troublesome. Discretization errors are reduced by using finer grids, higher-order discretization strategies, and smaller time step sizes. However, in several sensible three-dimensional applications, grid- and time step-independent solutions cannot be obtained owing to hardware limitations. In these cases, the remaining errors and uncertainties ought to be quantified as delineated within the Best Practice Guidelines (BPG) by Mahaffy [16]. Sensitivity analysis for the numerical modeling of ROCOM experiments was done in Rohde [11]. As a result of these studies, recommendations for a production mesh and code settings were elaborated. These recommendations were used in this study. The sugar water with a higher density was simulated with the ANSYS CFX multi-component model. In a multi-component flow, the components share the same velocity, pressure, and temperature fields. The properties of multi-component fluids are calculated on the idea that the constituent elements are a kind of perfect mixture. The sugar water is modeled as a part with very different density and consistency to water. The mass fraction of the glucose water is often directly associated with the mixing scalar delineated in Equation (1). The reference fluid is demineralized water at atmospheric conditions (1 bar and 20 °C). The density variations simulate larger temperature differences when made with adding sugar to the water. On the other hand, the quantity of the NaCl tracer has no influence on the mixture density. A sugar solution with a density of 1100 kg/m3 has a viscosity a factor 3 higher than that of pure water. The sugar tracer can therefore still be regarded as a fluid with low viscosity.
To model the effects of turbulence on the mean flow, the Reynolds stress model (RSM) [17] was utilized in combination with a ω-based length scale equation (BSL model). In the Reynolds stress model and length-scale equation, buoyancy production terms were used. The Reynolds stress models are higher-level turbulence closures compared to eddy-viscosity models and are based on dynamic equations for the Reynolds stress tensor itself. The directional effects of the Reynolds stresses and the complex interactions in turbulent flows are accounted for by solving a transport equation for each of the six Reynolds stress components of . In the Baseline (BSL) Reynolds stress model, which was used in this work, the transport equations for the Reynolds stresses are as follows:
where is the production tensor of Reynolds stresses and is the pressure-strain correlation, which redistributes turbulent kinetic energy among the components of the Reynolds stress tensor without changing the total kinetic energy.
In the Reynolds stress model, the buoyancy source terms are included in the transport equations and can be expressed as follows:
where the second term with the buoyancy constant Cbuo = 0.6 represents the buoyancy contribution from the pressure-strain term. is given by
The buoyancy source terms or could be modeled by solving the transport equations for components of Reynolds-averaged turbulent density fluxes in an analogous manner to the turbulence model of thermal buoyancy-driven flow in Hanjalič [18] and Carteciano [19].
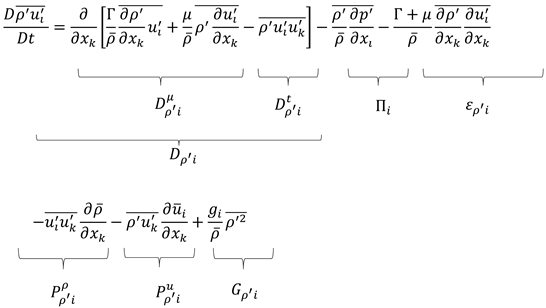
Here stands for the total diffusion of including the molecular diffusion and the turbulent diffusion , is the pressure scrambling effect, and is the molecular destruction. In addition to the production due to mean density and velocity gradients, and , respectively, the equation contains a buoyancy production term , where the transport equation for the mean density variance needs to be considered [20].
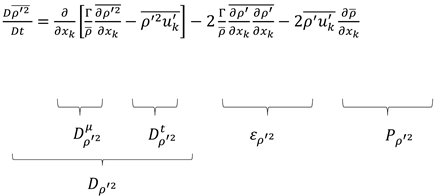
Here is the total diffusion of the density variance, including the molecular diffusion and the turbulent diffusion . is the molecular destruction term and is the production term due to mean density gradients.
The turbulent shear stresses , which appear in the transport equations for the turbulent density fluxes, are modeled by the isotropic eddy-viscosity hypothesis:
The isotropic source term is obtained if the sum over all turbulent density fluxes is taken:
In the PTS2 test case buoyancy production terms were included. Equation (9) was used for modeling the buoyancy influence to the turbulence model.
Numerical simulations were run in a parallel mode using 64 CPUs on the HZDR Linux-Cluster hemera with the setup in Table 2. Currently hemera contains 88 CPU nodes, each with 40 Intel Xeon Gold cores, and 24 GPU nodes, each with 28 cores and 4 Nvidia GPUs of type Tesla P100 or V100. The computational time of one calculation using 40 CPUs was 45 h.

Table 2.
Settings for the flow solver.
5.2. Geometry
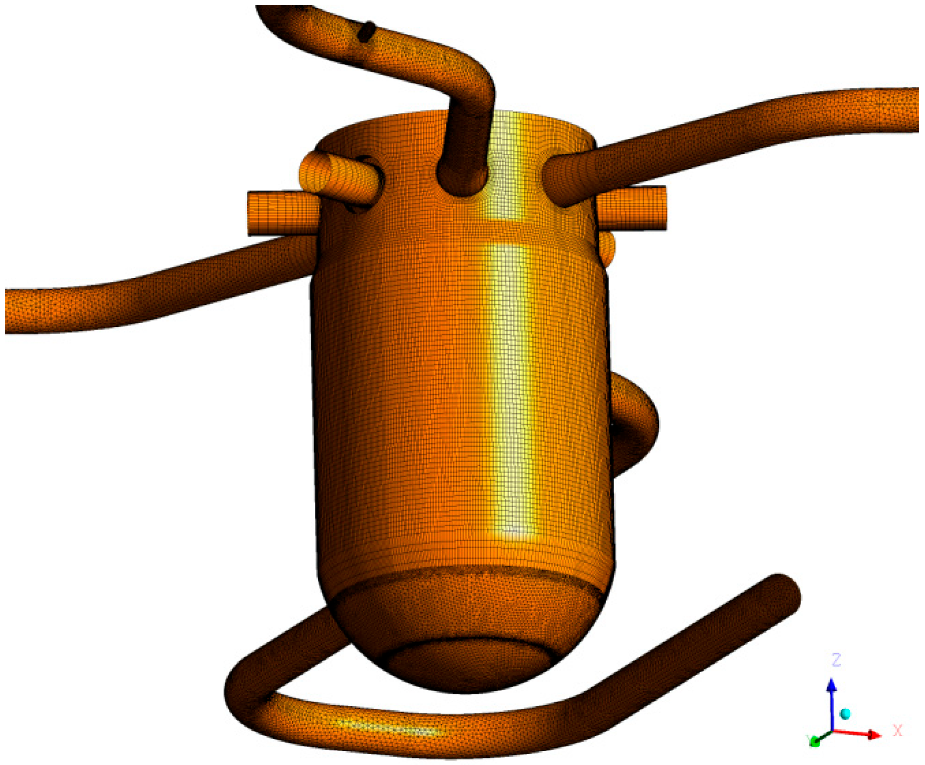
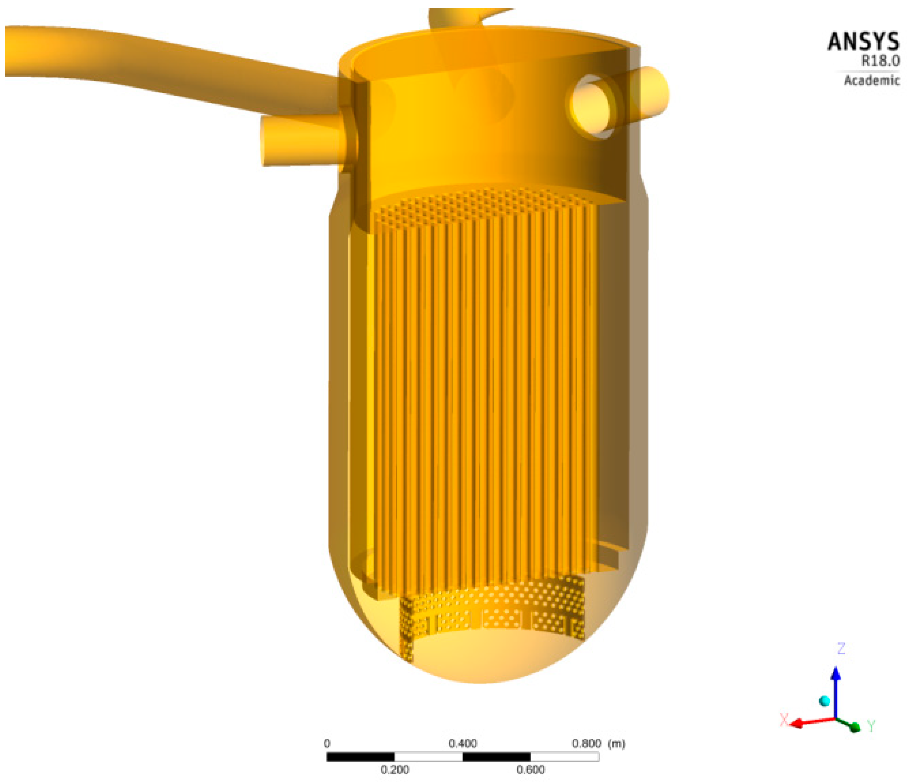
The geometric details of the ROCOM internals have a tremendous influence on the flow field and the mixing. Therefore, particular attention during modeling was given to the inlet region, the downcomer below the inlet region, and the obstruction of the flow by the outlet nozzles within the downcomer extension (see Figure 5 and Figure 6). Within the current study, these geometric details were modeled using the ICEM CFD software system [15]. The grid model enclosed the inlet nozzles with the diffuser part, the orifices of the outlet nozzles, the downcomer extension, the lower plenum, the core support plate, the perforated drum, the core, the upper plenum, and the outlet nozzles. The core support plate contains 193 orifices with a diameter of 20 mm. The fluid then flows through the hydraulic core simulator within the tubes. The perforated drum, shown in Figure 6, contains 410 orifices of 15 mm diameter.
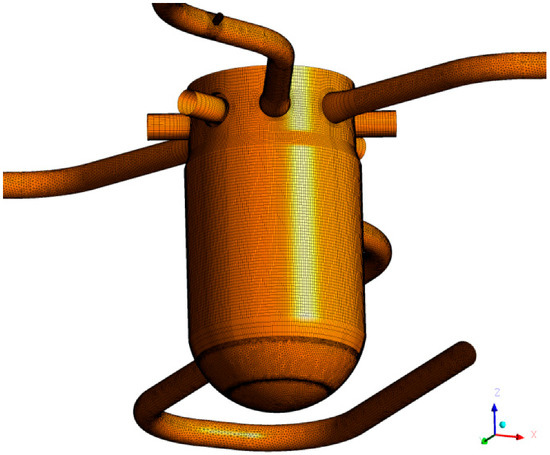
Figure 5.
Domain (perspective view).
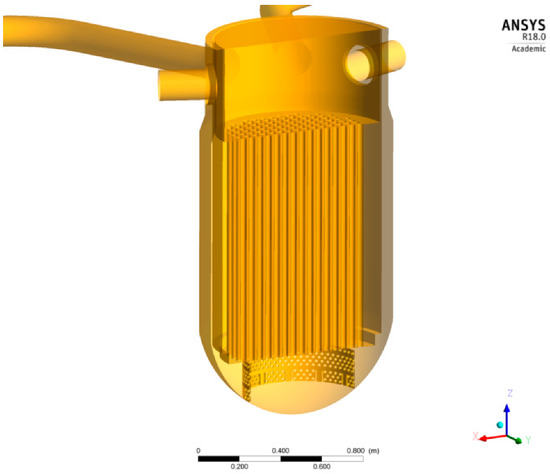
Figure 6.
Internal structures (vertical cut).
5.3. Grid Generation
As mentioned above, the mesh was generated with ICEM CFD [15]. It consisted of 6.5 million nodes and ca. 4 million hybrid components (Figure 5). The mesh was refined at the perforated drum, within the lower support plate and at the ECC injection line. The downcomer and nozzle region was discretized with hexahedral cells; tetrahedral components were used for the lower plenum (Figure 6). The y+ values ranged from 25 to 75 depending on the region of interest. Automatic wall functions were used in the simulation. CFX automatically switches from the wall function approach and the low Re approach, depending on the grid spacing near the wall.
6. Initial and Boundary Conditions
Table 1 shows the analyzed experiments. For the PTS1 experiment, the main coolant pump 1 was set to a flow velocity of 15% of the nominal rate. There was no density difference between the injected ECC water and the primary loop inventory. The opposite pumps were not operating. For the PTS2 experiment, the main coolant pump 1 delivered 10% of the nominal mass flow rate and the density difference was 10%. Conjointly the remaining pumps were not operating. At the ECC injection line and at the bend of cold leg 1, Dirichlet inlet boundary conditions were imposed. One-loop operation was simulated using a constant, uniform velocity. Throughout an amount of 10 s, a consistent velocity profile was conjointly outlined at the ECC injection line. Later, this velocity was set to zero. The mass fraction of sugar water was set to one (PTS2) and set to zero (PTS1) at the ECC injection line and to zero at cold leg 1. At the outlet nozzles, a static pressure boundary was defined. The solid walls were imposed with a no-slip boundary condition and automatic wall functions. Associate in an initial guess of the turbulent energy and the dissipation rate was defined.
To initialize the velocity field within the vessel, the flow within cold leg 1 was stabilized with a constant flow velocity before the onset of the ECC injection for 10 s.
7. Results of the PTS1 Experiment
7.1. Qualitative Results
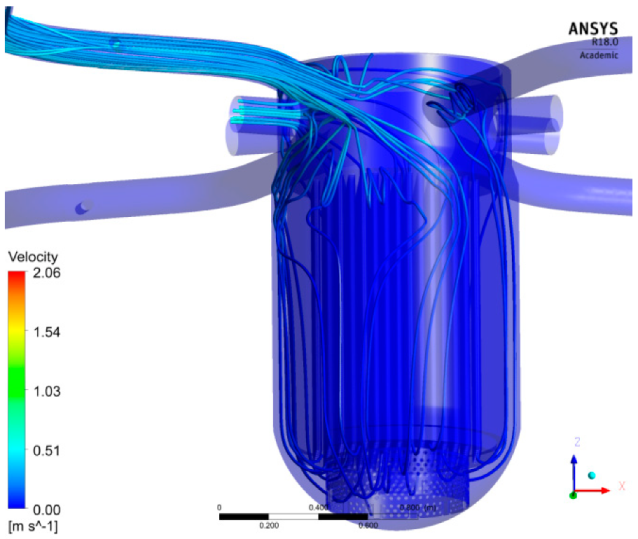
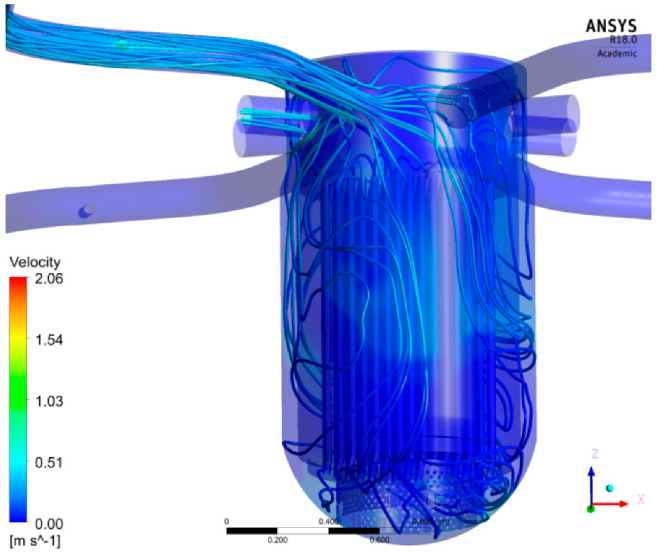
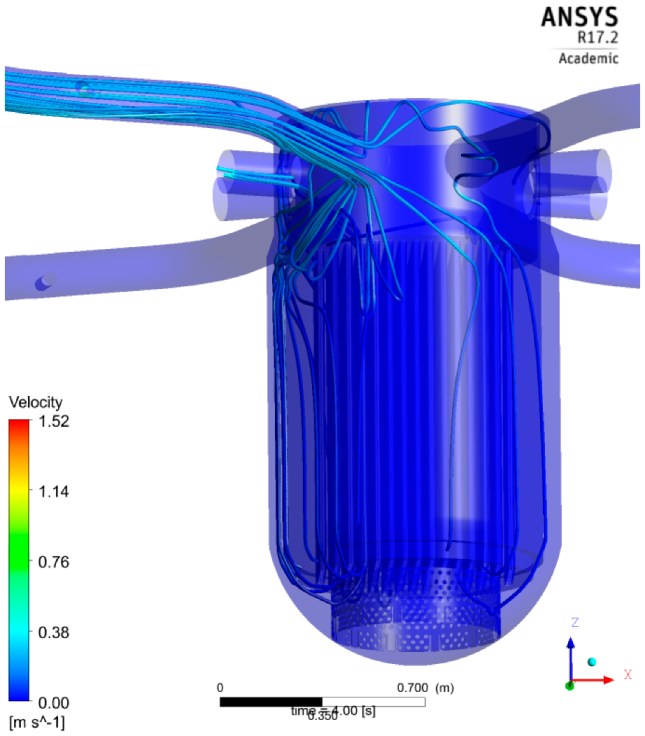
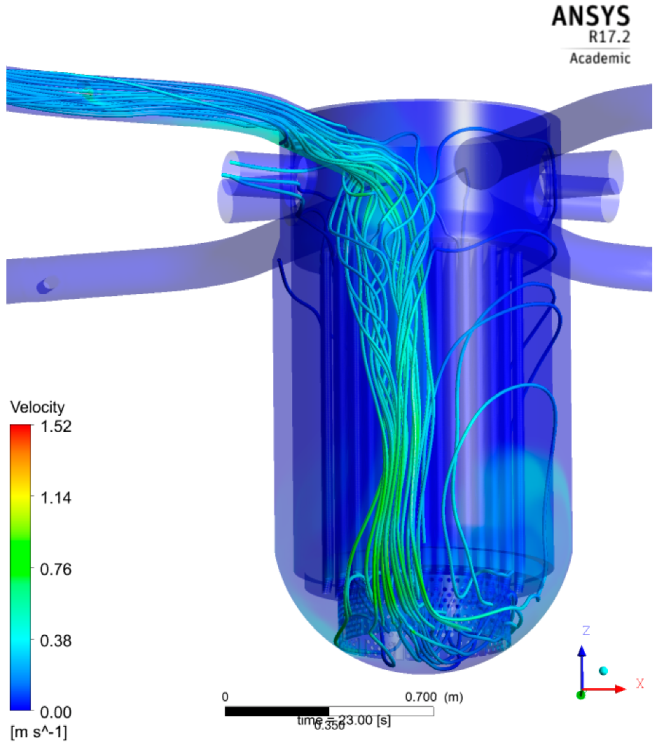
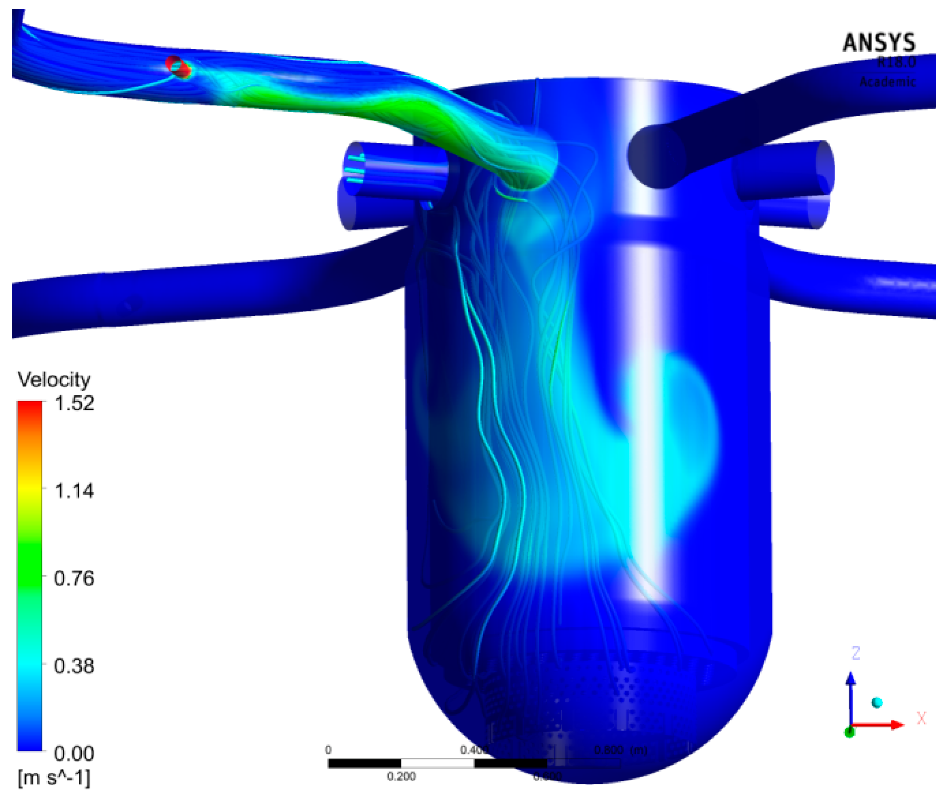
For the PTS1 case (see Figure 4) the density difference is zero, which leads to Fr = ∞. This Fr number range describes pure momentum-driven flow; the buoyancy force (global gravity forces and turbulence buoyancy force) plays no role. The flow rate (15% of the nominal mass flow of the cold leg) was the highest flow rate employed in the experimental matrix. To establish a flow field within the cold leg and downcomer of ROCOM (Figure 7) an initial calculation was carried out with a closed ECC injection line. The flow in cold leg 1 creates a momentum-controlled flow into the downcomer. It is divided into two flow branches flowing during a downwards-directed helix around the core barrel (Figure 8). Identical behavior was also discovered during nominal flow conditions with one pump [7].
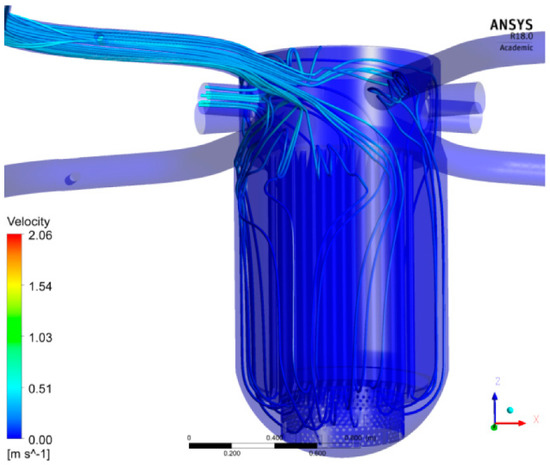
Figure 7.
Calculated streamlines before the injection takes place (at 4 s).
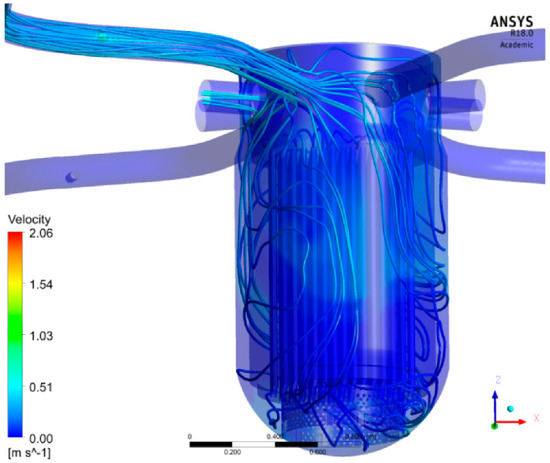
Figure 8.
Calculated streamlines after the injection took place (at 23 s).
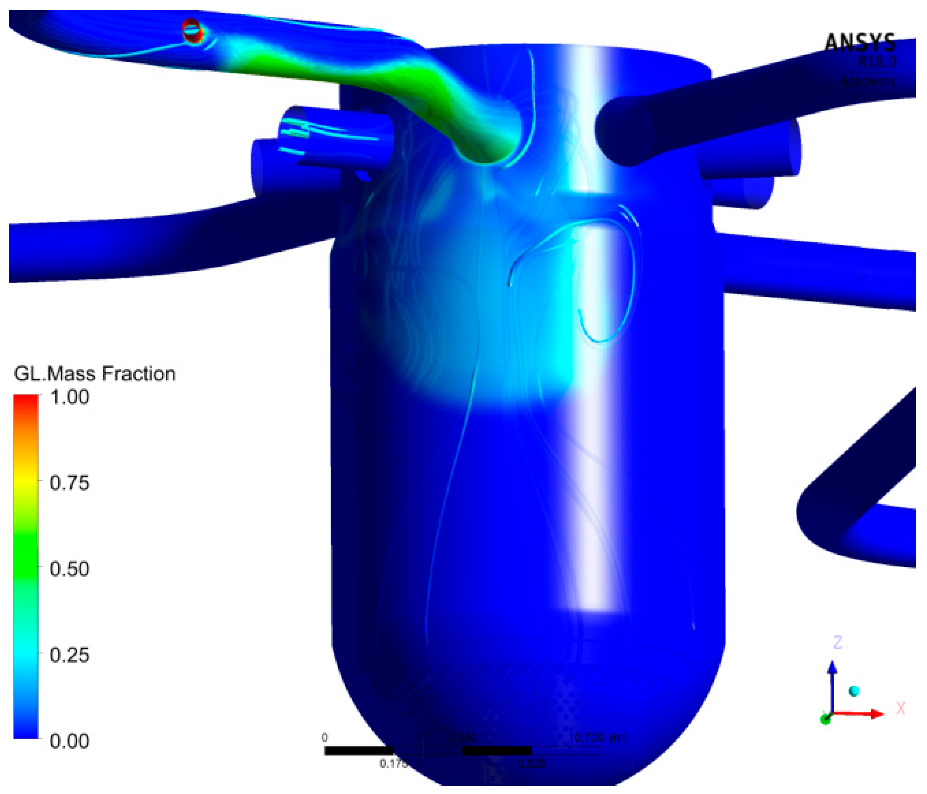
After the onset of ECC injection, the flow pattern within the cold leg does not change considerably because of the absence of buoyancy. The liquid from the injection line first hits the cold leg at the opposite wall; the momentum of the injected jet (Figure 9 and Figure 10) causes this phenomenon. Throughout the duration of injection and once completed, the cold leg flow transports the ECC water towards the reactor inlet. As within the experiment, the area covered by the ECC water is larger below the inlet nozzle. Since a momentum-driven flow exists, the ECC water is then transported laterally right along the downcomer to the other facet of cold leg 1. This transport is visible in Figure 9 and Figure 10 at 18 s and at 20 s, respectively. The time-based progress of the mixing scalar within the higher and lower downcomer (unwrapped view) is shown in Figure 11. The utmost experimental value of the mixing scalar within the upper downcomer sensor is Θ = 0.12 (CFX Θ = 0.15) and within the lower downcomer Θ = 0.083 (CFX Θ = 0.14). In the CFX calculation the mixing and stratification within the cold leg causes the slug to be less diffuse, an impact which results in the over prediction of the concentration in all positions of the Wire Mesh Sensors compared to the experiment. The maximum concentration of ECC water remains the same between the upper and lower downcomer, while the concentration of the experimental slug decreases, because it is weakly distributed. However, it is vital to notice that the timescales of the slug’s transportation through the inlet nozzle and the upper downcomer plane are quite comparable with a small delay on the lower downcomer.
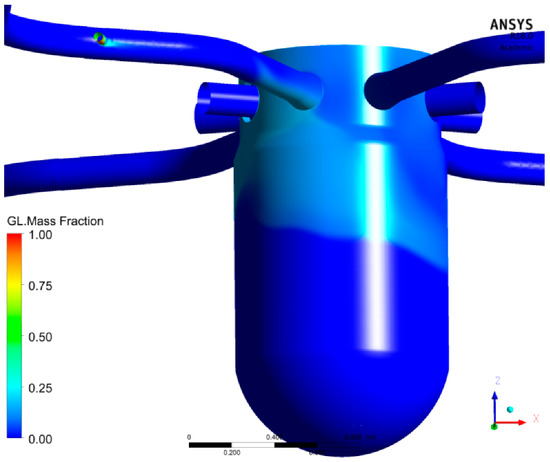
Figure 9.
Calculated sugar mass fraction (at 18 s).
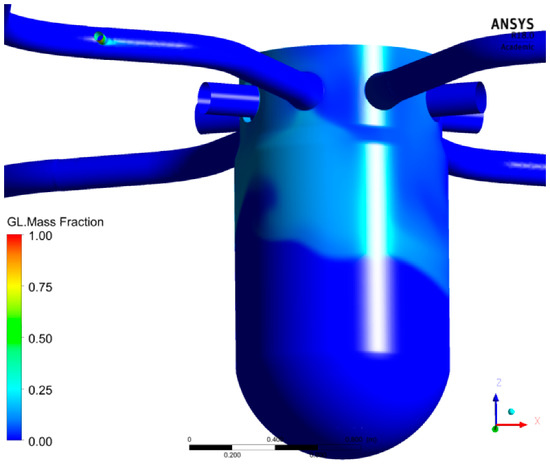
Figure 10.
Calculated sugar mass fraction (at 20 s).
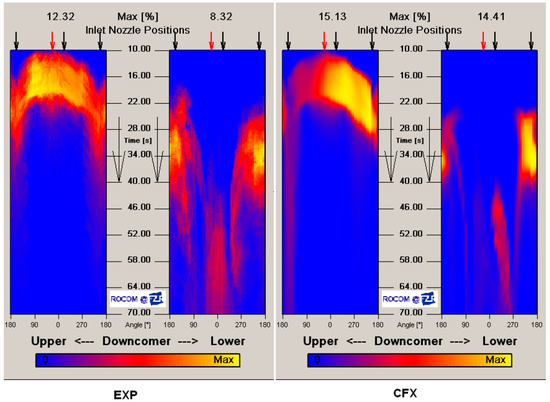
Figure 11.
ECC water distributions at the downcomer, left experiment, right CFX.
Throughout the downward flow, the ECC water mixes well with the existing fluid. At the core inlet, the ECC water arrives opposite the injection loop. Later, the ECC water seems conjointly below the injection loop (Figure 11). Finally, the tracer homogeneously coats the core inlet.
7.2. Quantitative Computational Results
Hydraulically unstable conditions exist when turbulent, forced convection flows have only small driving forces. Local differences in the transient courses are inevitably present in such comparisons due to statistical turbulent mixing effects.
- (a)
- Cold leg 1 sensor analysis
The time history of the mixing scalar maximum is compared to the measured one. The maximum value of the mixing scalar Θ is determined from the whole sensor plane at a certain time. This comparison is shown in Figure 12. Additionally, the average mixing scalar is calculated for both the simulation and the measurement according to Equation (10):
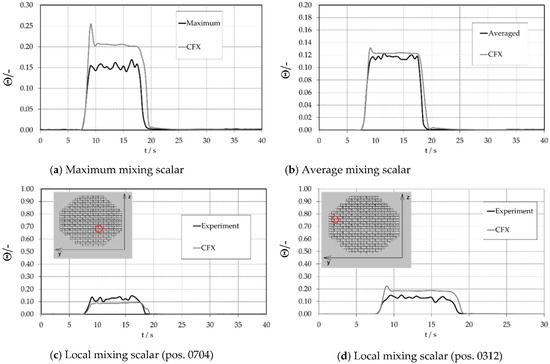
Figure 12.
Cold leg inlet nozzle sensor plane (red circle displays the position).
Np is the number of calculated points in the plane, measuring points respectively; is the mixing scalar. Figure 12 shows these averaged values. The time histories of calculated maximum (Figure 12a) and average value (Figure 12b) are in agreement with the experiment. The percentage differences of experimental and numerical values are around 4% for the averaged values and around 32% of the maximum values of the mixing scalar. Two local measurement points at the cold leg sensor were selected. Locations of the sensors are shown in Figure 12c,d. At these positions, the anticipated mixing scalar agrees well with the experimental values, particularly at the point of inbound ECC water at the detector plane. The percentage differences of experimental and numerical values are around 15% for the local position 0704 and around 30% for the local position 0312.
- (b)
- Upper downcomer sensor plane analysis
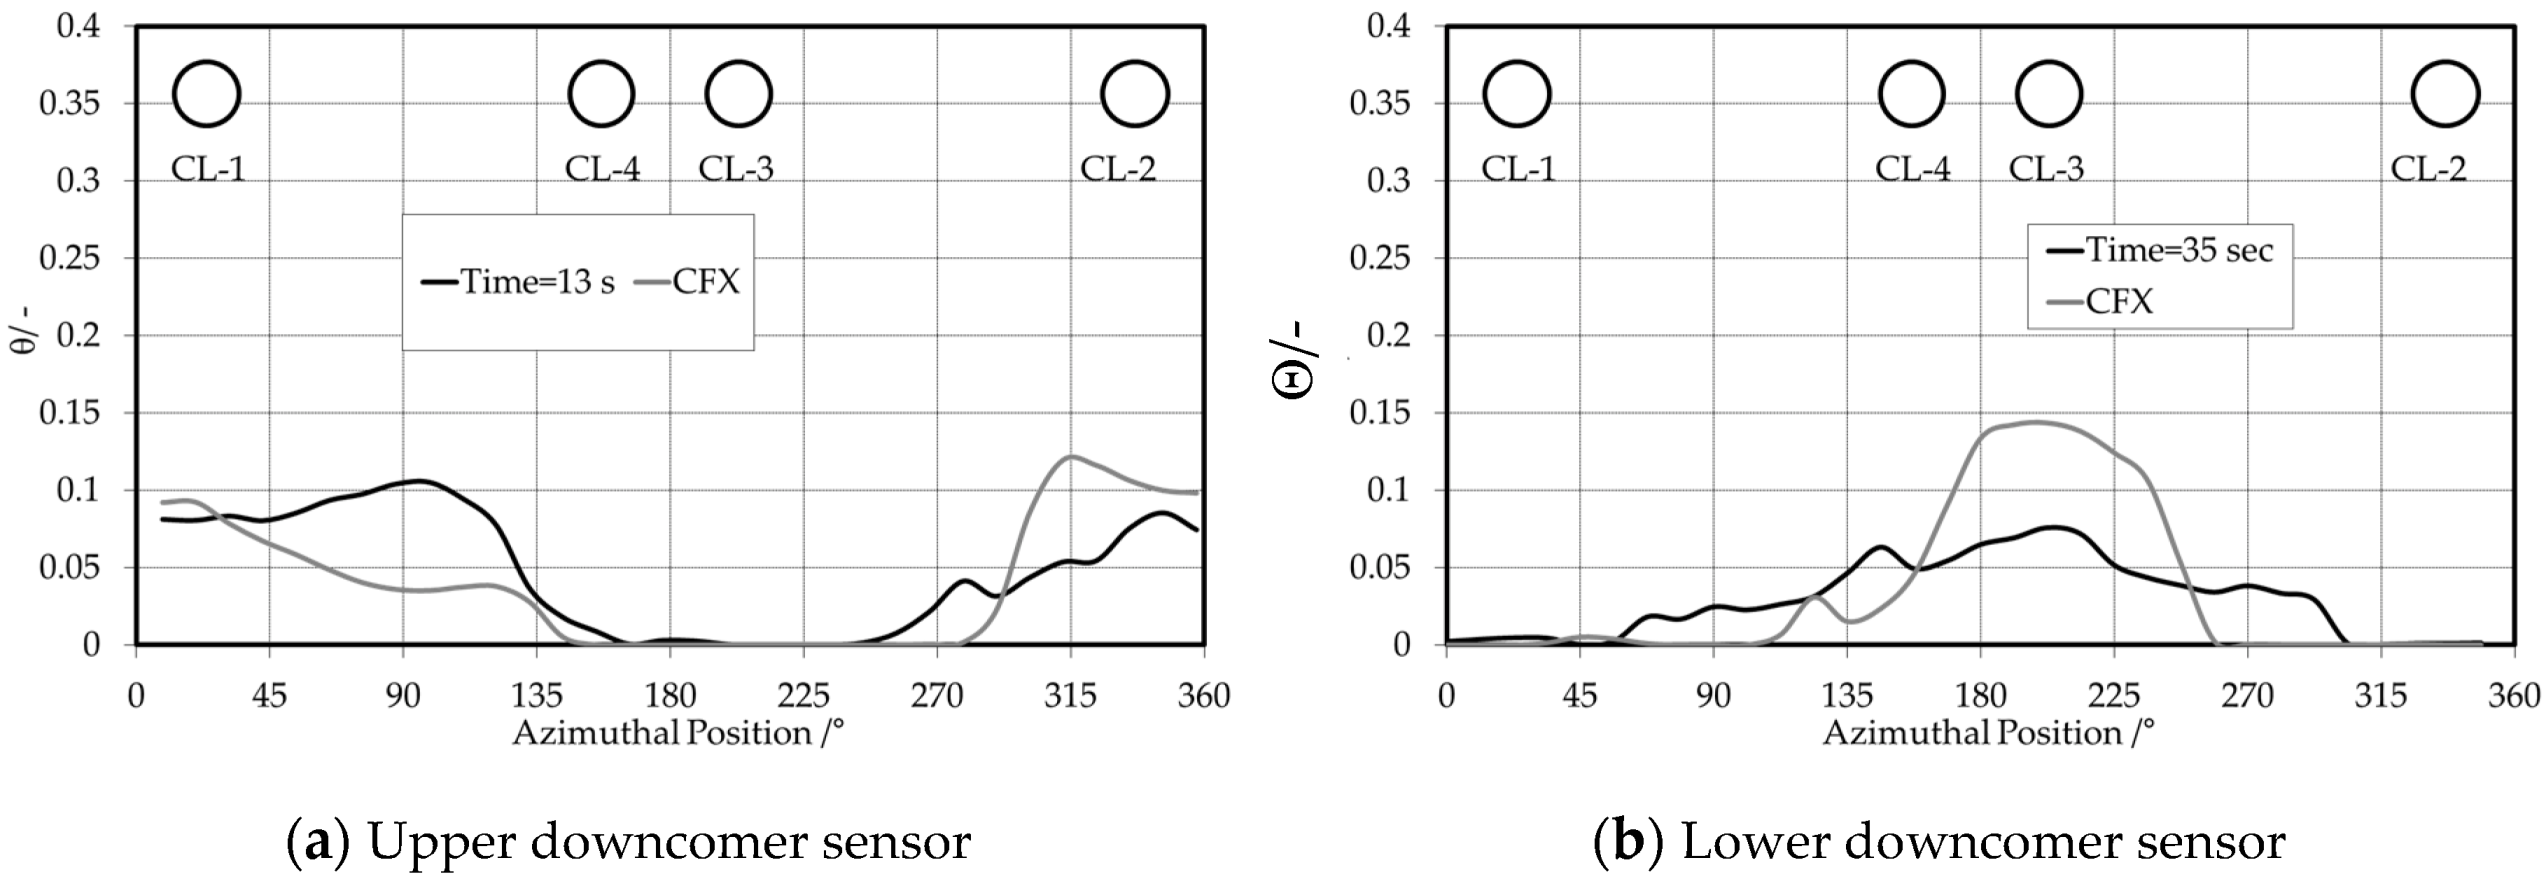
The instant angle of the mixing scalar of the upper and lower downcomer sensor plane is shown in Figure 13. Here, 32 circumferential detector positions within the middle of the detector plane were selected for comparison. The distribution is given at 13 s for the higher downcomer detector (Figure 13a) and at 35 s for the lower downcomer detector (Figure 13b). The arrangement of cold leg nozzles 1 and 4 is additionally specified in the figures. In general, the code appropriately represents the instant angle distribution of the mixing scalar within the downcomer. Discrepancies cannot be addressed solely to code and modeling variations but also to the unsteady and random character of flow.
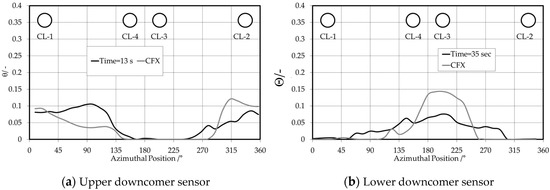
Figure 13.
Circumferential tracer distributions for 32 positions, upper and lower downcomer sensor.
Figure 14 shows the temporal variation of the maximum (Figure 14a) and averaged value (Figure 14b) of the mixing scalar, calculated for all positions within the middle of the upper downcomer detector plane. The averaged values are calculated consistent with Equation (1). The agreement to the experiment is fine. Specifically, the temporal arrangement of the concentration history is correct, once the slug reaches the measurement plane for the first time. The code captures the mean values; minor deviations occur at the maximum values.

Figure 14.
Time-dependent tracer distributions at the upper downcomer sensor.
The slug dynamic behavior may also be seen within the time course of the local mixing scalar at the higher downcomer sensor plane (Figure 15). An angle position within the region below inlet nozzle 1 was designated, placed radially within the center of every downcomer sensor plane. The angle of 22.5° (center of cold leg 1) is shown in Figure 15. The agreement between experiment and calculation is, in this case, very good.

Figure 15.
Local transient mixing scalar at the upper downcomer sensor plane.
- (c)
- Lower downcomer sensor analysis
In Figure 16 the maximum (Figure 16a) and average (Figure 16b) values of the mixing scalar at the lower downcomer detector are given (analogous to those of the higher downcomer sensor). At the lower downcomer detector, the maximum values of the mixing scalar are considerably smaller than within the upper downcomer (Figure 14) because of turbulent mixing within the downcomer. As a consequence, this mixing ends up in a bigger space that is affected by the slug. The agreement of the numerical and experimental averaged values of the mixing scalar is good. Discrepancies within the maximum values should not be overvalued because of the unsteady character of turbulent mixture.

Figure 16.
Time-dependent mixing scalar at the lower downcomer plane.
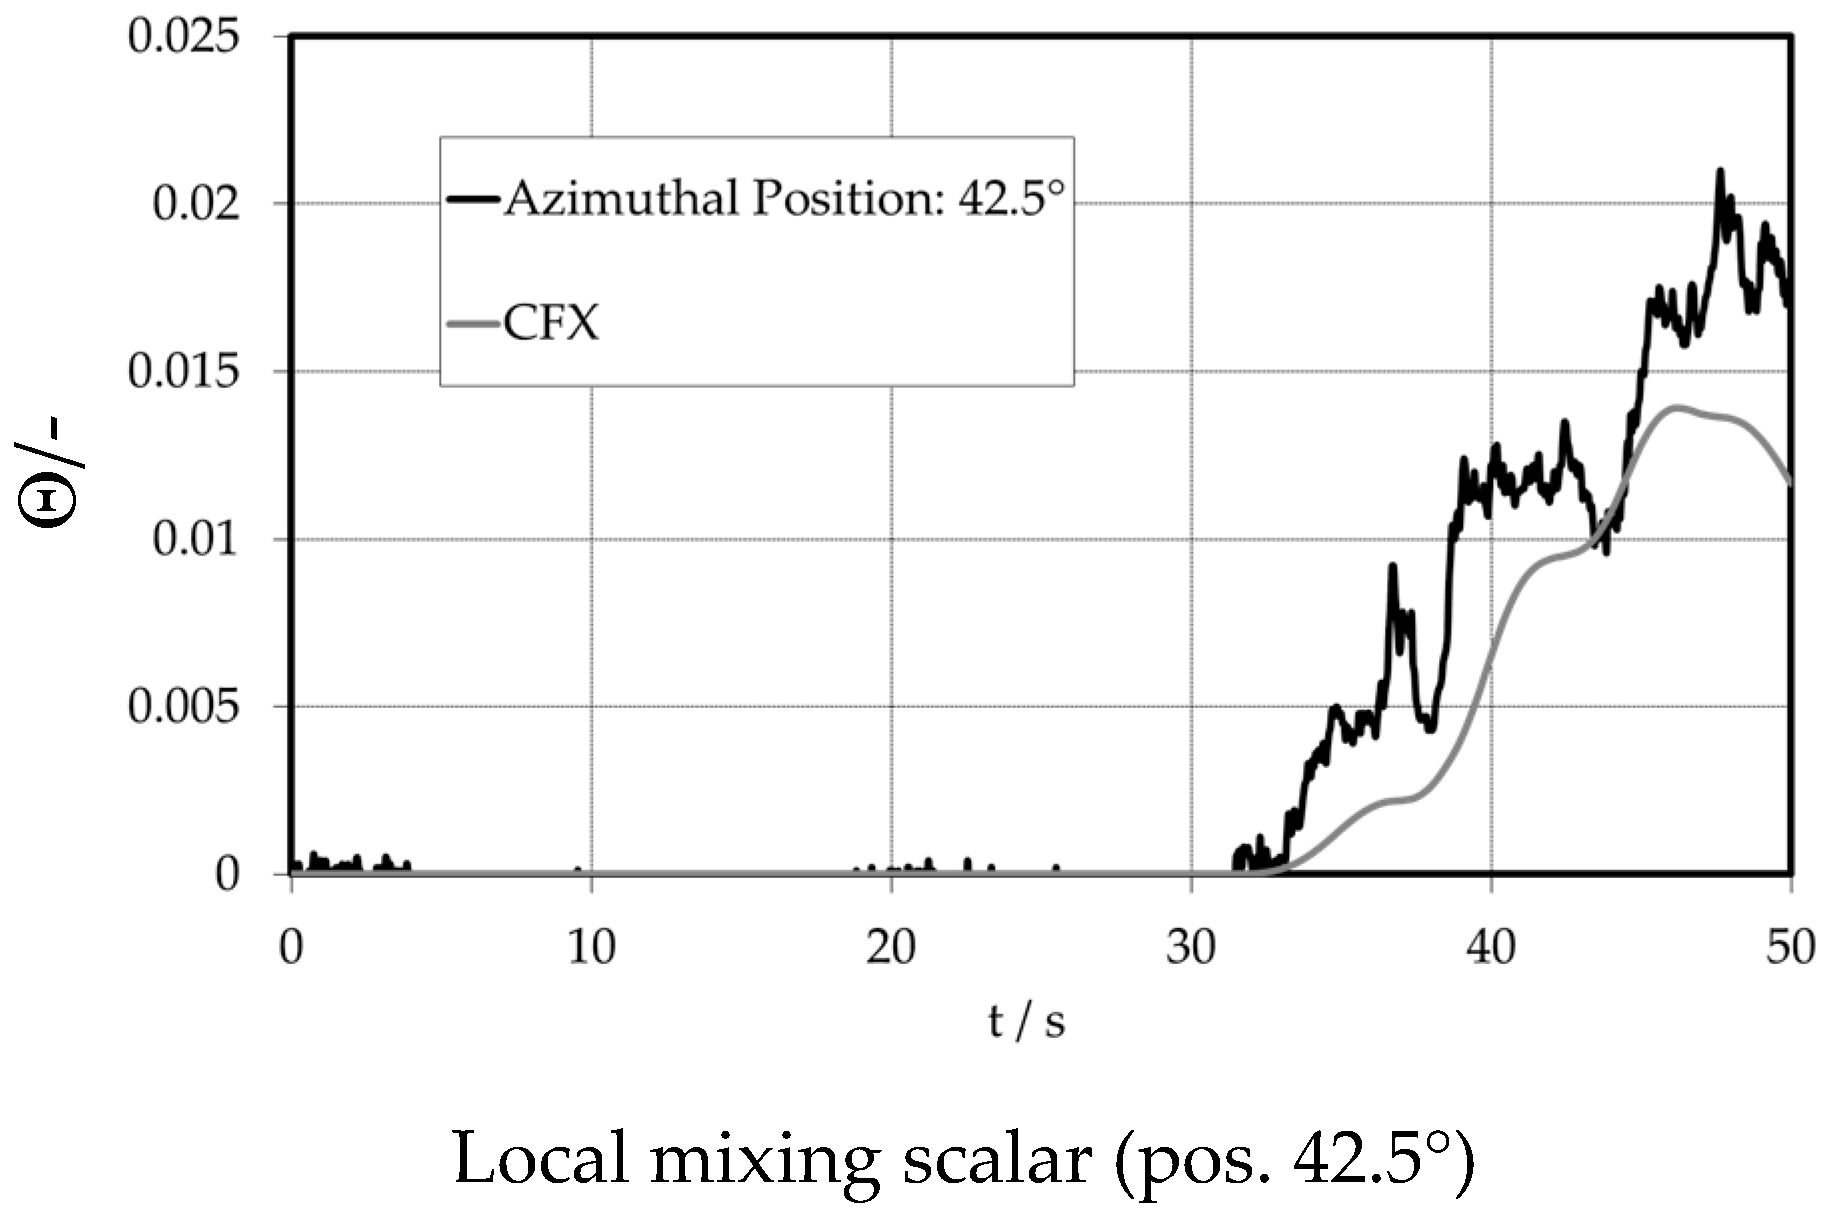
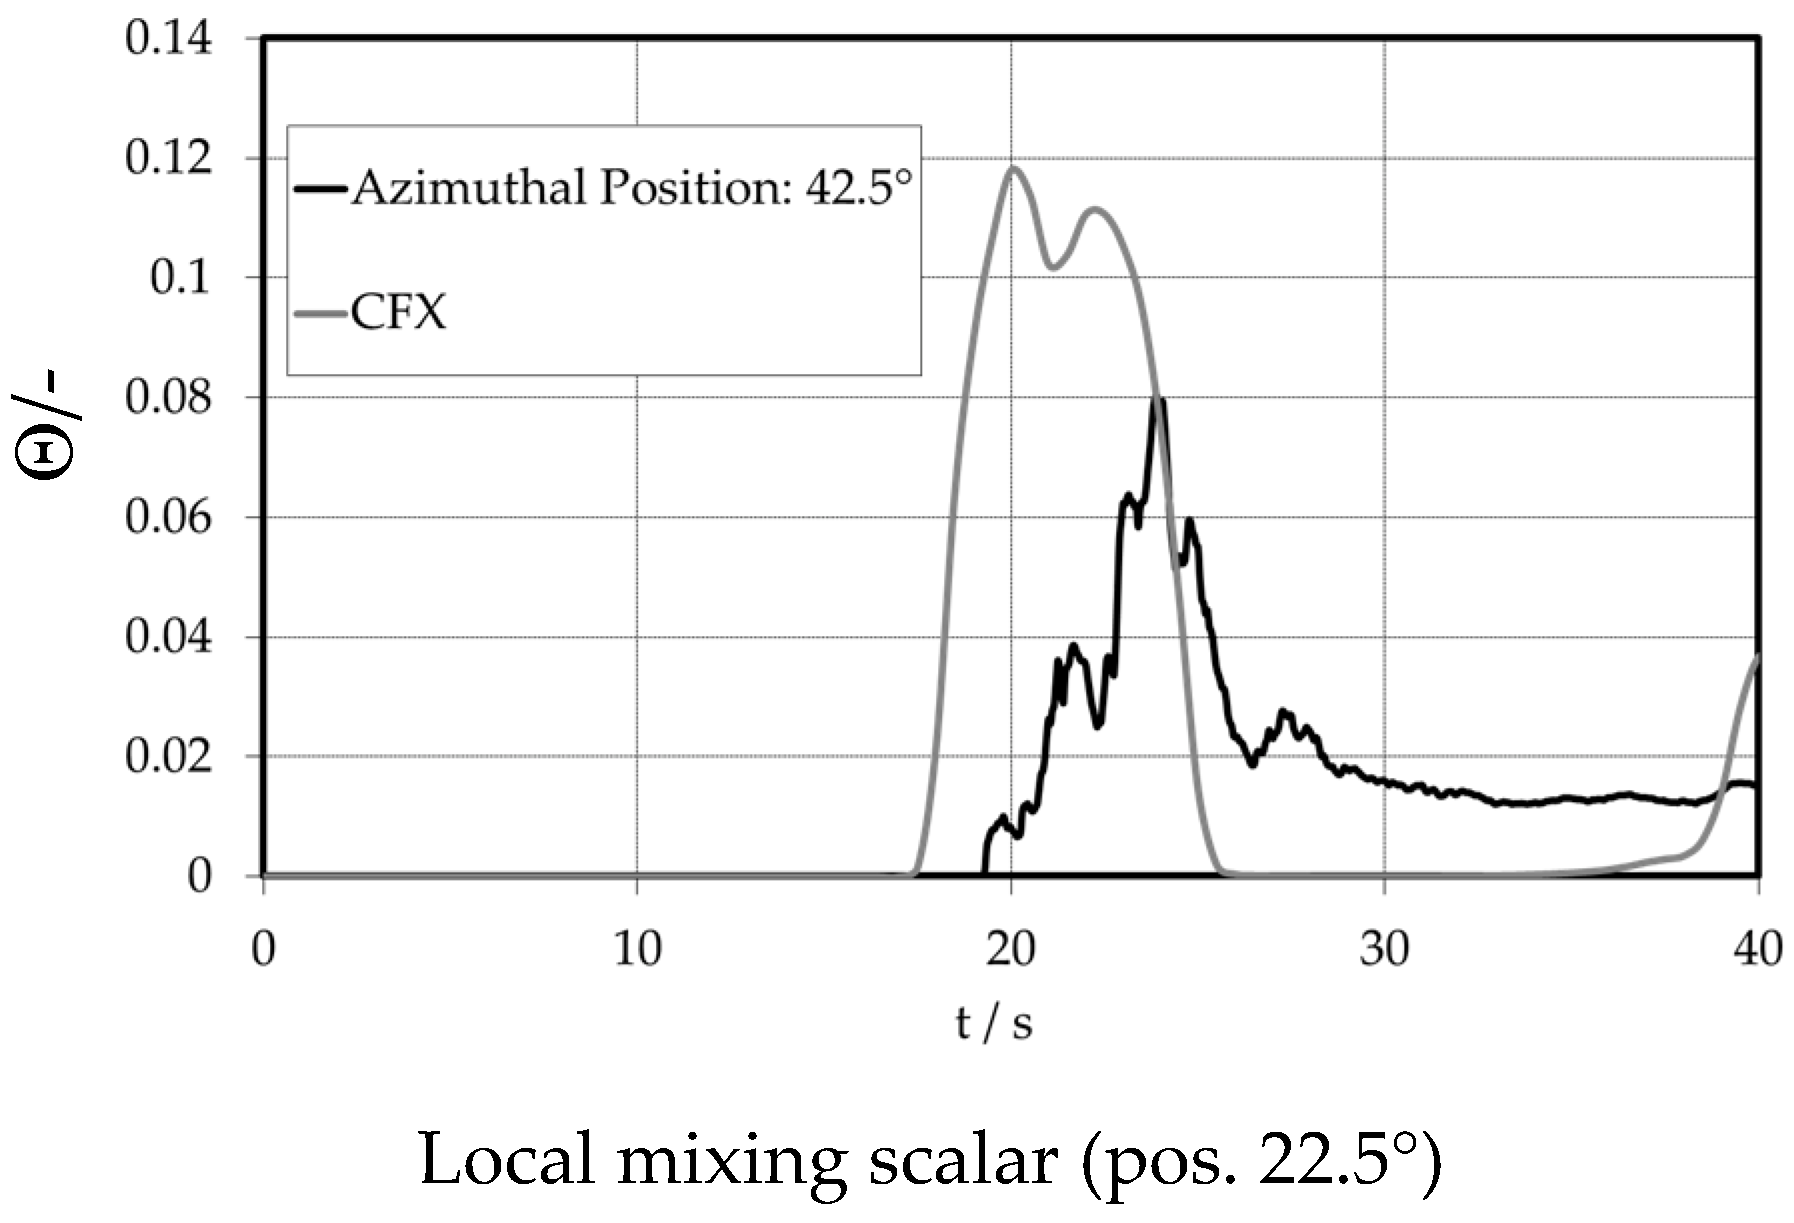
This is confirmed by the local mixing scalar at the 42.5° circumferential position (Figure 17). The simulation has difficulties in correctly reproducing these local values.
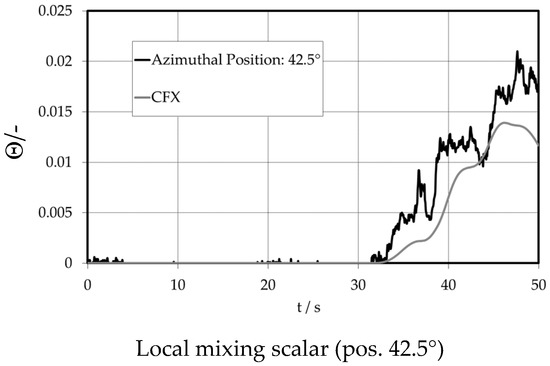
Figure 17.
Lower downcomer sensor.
8. Results of the PTS2 Experiment
8.1. Qualitative Numerical Analysis
The density difference between ECC injection and RPV inventory is 10%, which leads to Fr = 0.8208, and the flow rate is set to 10% of the nominal flow rate. This Froude range characterizes mixed convection (see Figure 4) and represents the transition region between momentum-driven and density-driven flow. Firstly, the transient calculation was accustomed to a steady state flow field within the cold leg and downcomer of ROCOM. Throughout this period, the ECC injection line was closed. The flow in cold leg 1 first creates a momentum-controlled flow coming into the downcomer as within the PTS1 case (Figure 7). The flow is split into two branches flowing in an exceedingly downwards-directed helix round the core barrel, as shown in Figure 18.
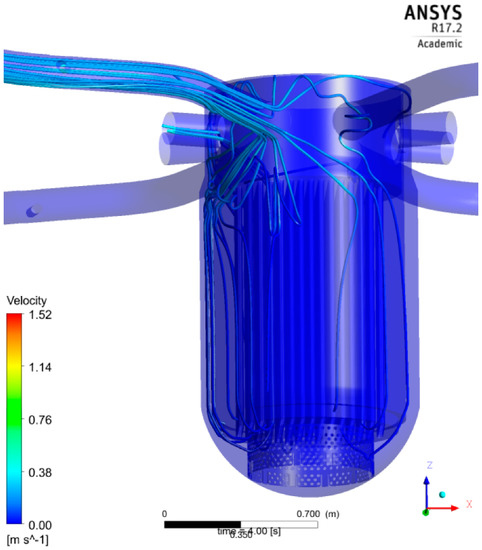
Figure 18.
Streamlines before the injection (4 s), CFX-calculation.
After the onset of ECC injection, the flow pattern within the cold leg changes, attributable to buoyancy momentum-driven flow. The cold water from the ECC injection line first hits the core barrel at the opposite wall of cold leg 1. Later, the ECC water is partly combined with the ambient coolant; however, it principally propagates downward towards the downcomer bottom, forming a visible streak below the cold leg nozzle (Figure 19).
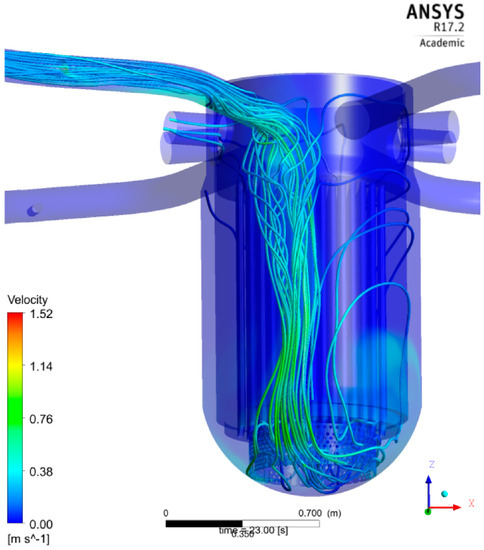
Figure 19.
Streamlines after the injection (23 s), CFX-calculation.
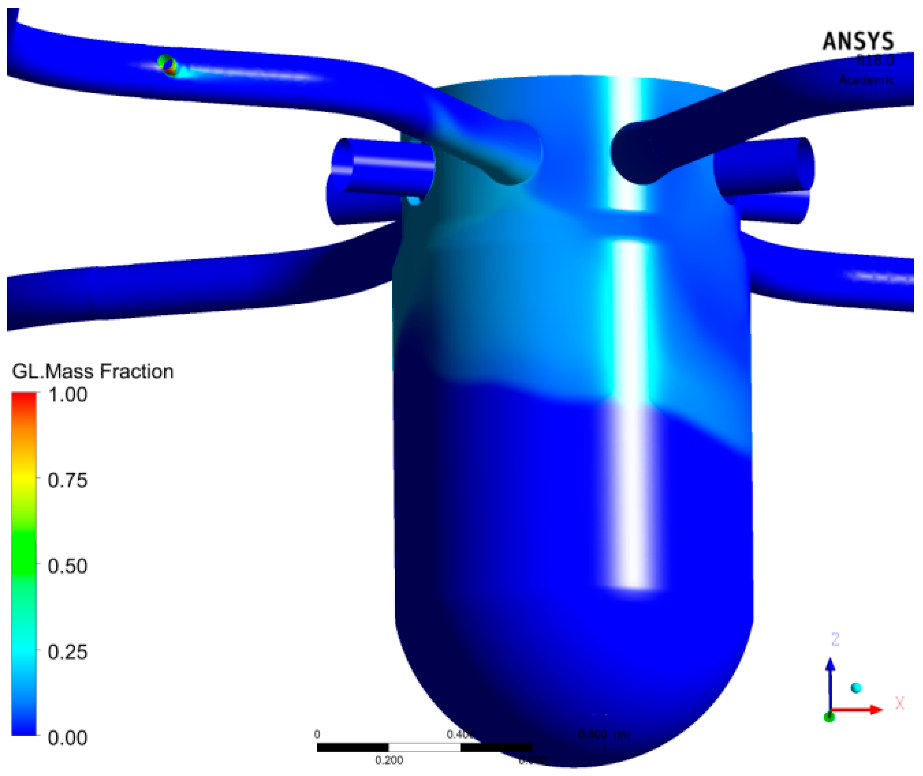
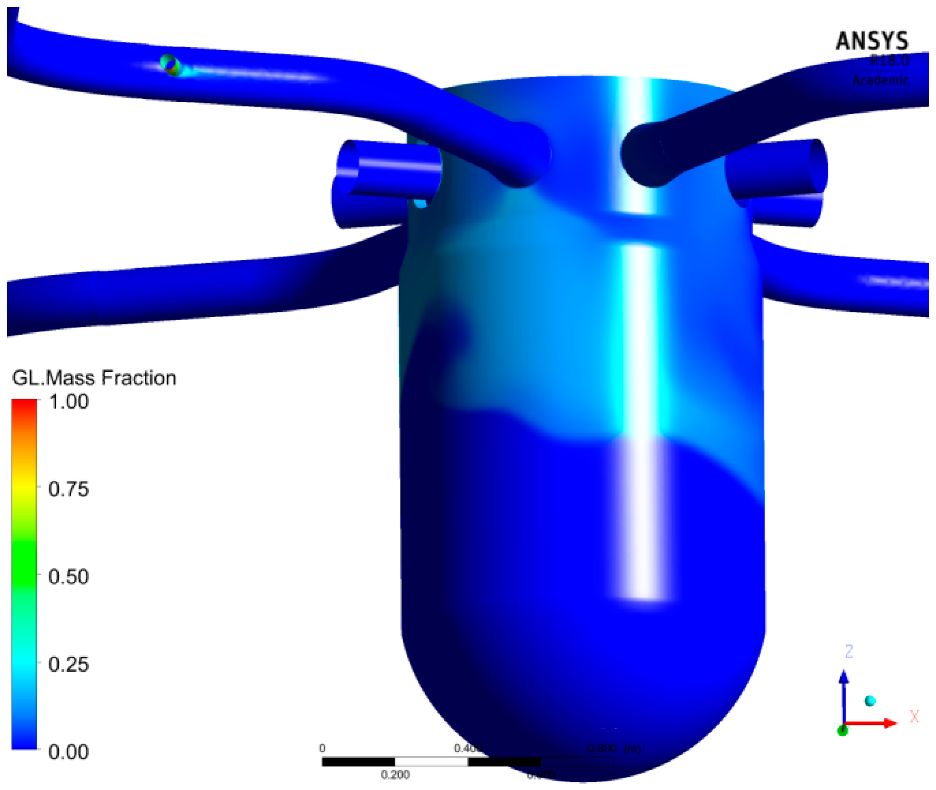
As within the experiment, the area covered by the ECC water is greater below the inlet nozzle, because of the momentum-driven flow field (Figure 20). However, attributable to the density variations between the ECC water and the existing fluid, the momentum-controlled flow within the downcomer starts to become dynamical. Later a density-dominated flow is established (Figure 21). The heavier ECC water creates a downward streak within the downcomer.
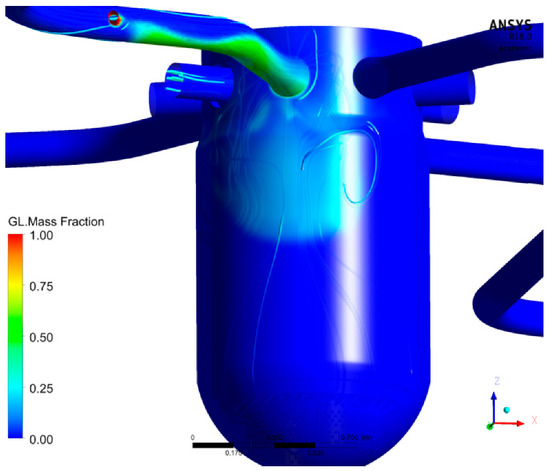
Figure 20.
Calculated ECC water distribution (18 s).
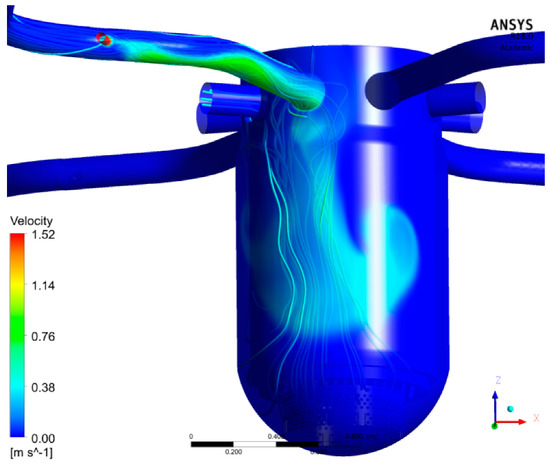
Figure 21.
Calculated ECC water distribution (20 s).
The calculation shows an unstable streak. It starts to fluctuate at half the downcomer height. Once the streak reaches the lower plenum, it swaps to the other side of the injection loop. Later the lower plenum is filled with well-mixed ECC water.
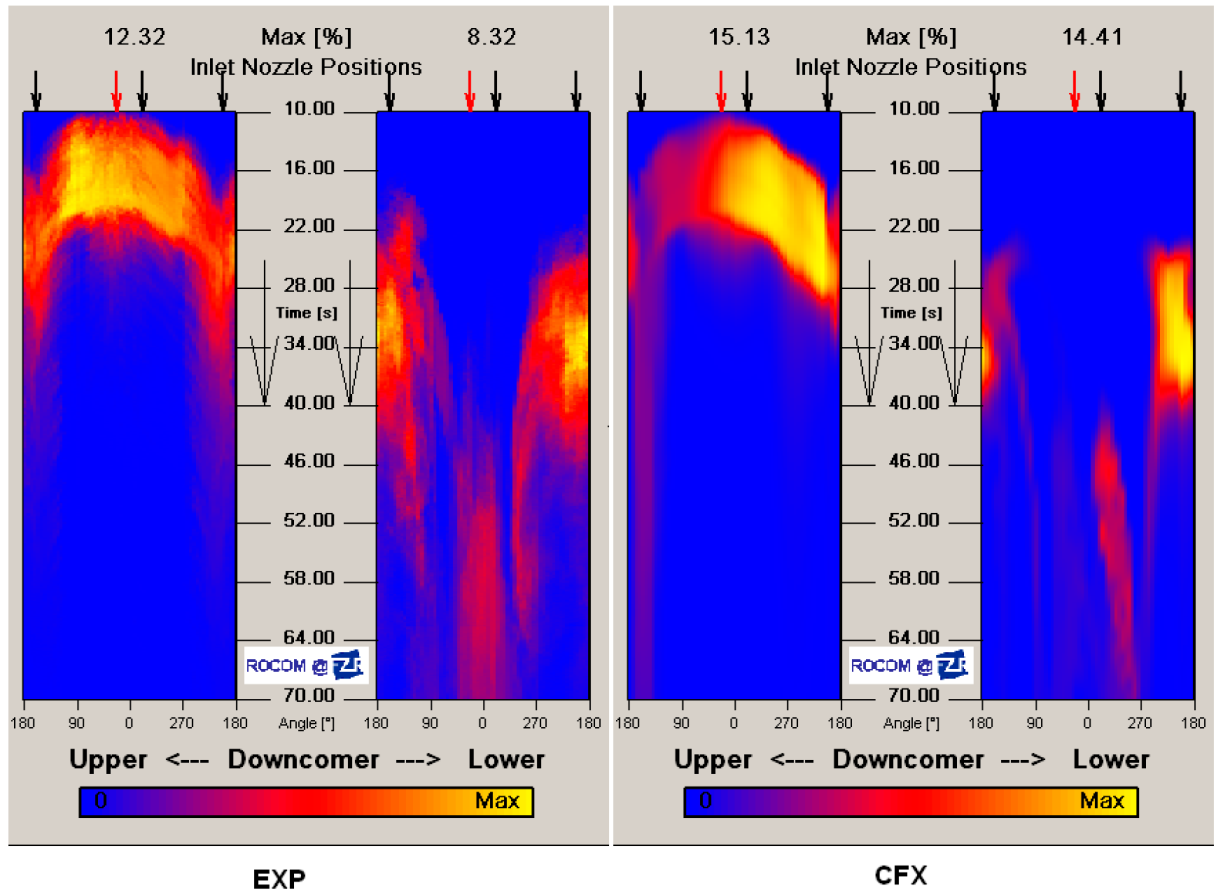
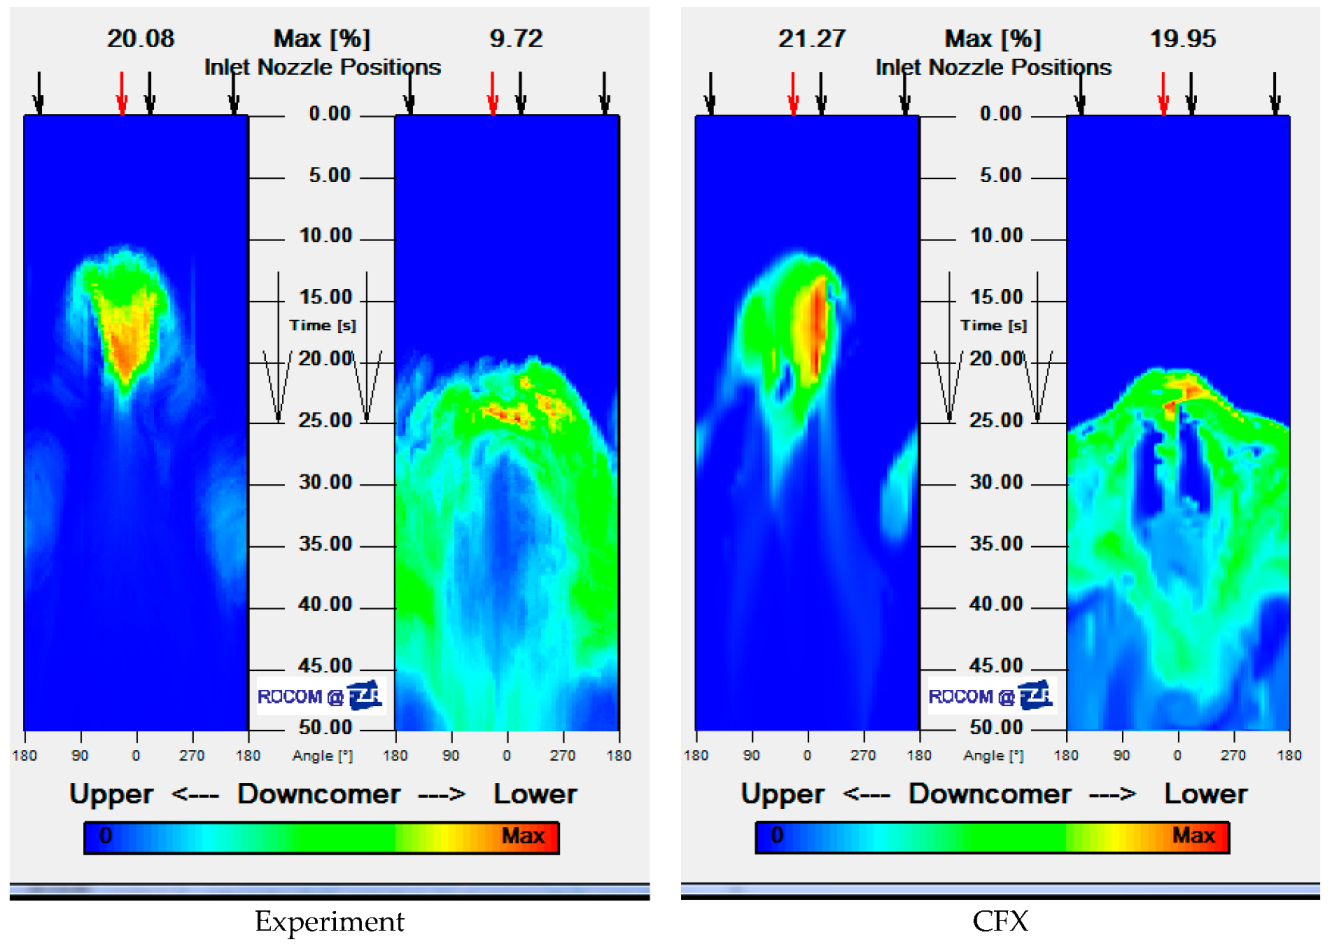
Figure 22 shows the temporal tracer development within the upper and lower downcomer detector. Here the figure shows the experiment (left) and the calculation (right). The maximum mixing scalar within the higher downcomer is EXP Θ = 0.20 (CFX Θ = 0.21) and within the lower downcomer EXP Θ = 0.097 (CFX Θ = 0.19). Within the CFX calculation the mixing and stratification cause the slug to be less diffuse. Compared to the experimental values, there is an overprediction of the concentration. This can be since, within the simulation, the slug maintains an identical maximum value between the upper downcomer sensor, while the concentration of the experimental slug decreases because it is weakly spread. However, it is necessary to notice the comparable time shift between upper and lower downcomer regions in the experiment and the calculation. There is only a small delay in the lower downcomer in the calculation compared to the experiment.
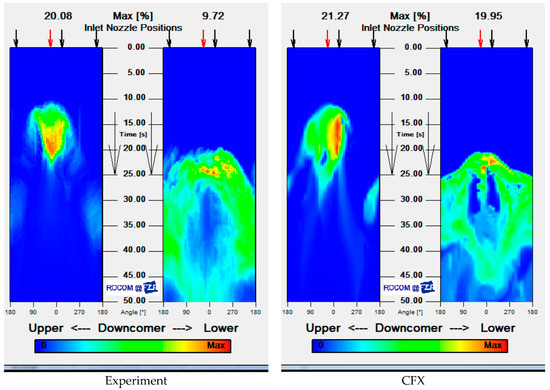
Figure 22.
ECC water distributions at the upper and lower downcomer, left experiment, right CFX.
8.2. Quantitative Computational Results
- a.
- Analysis of the flow at the sensor within cold leg 1
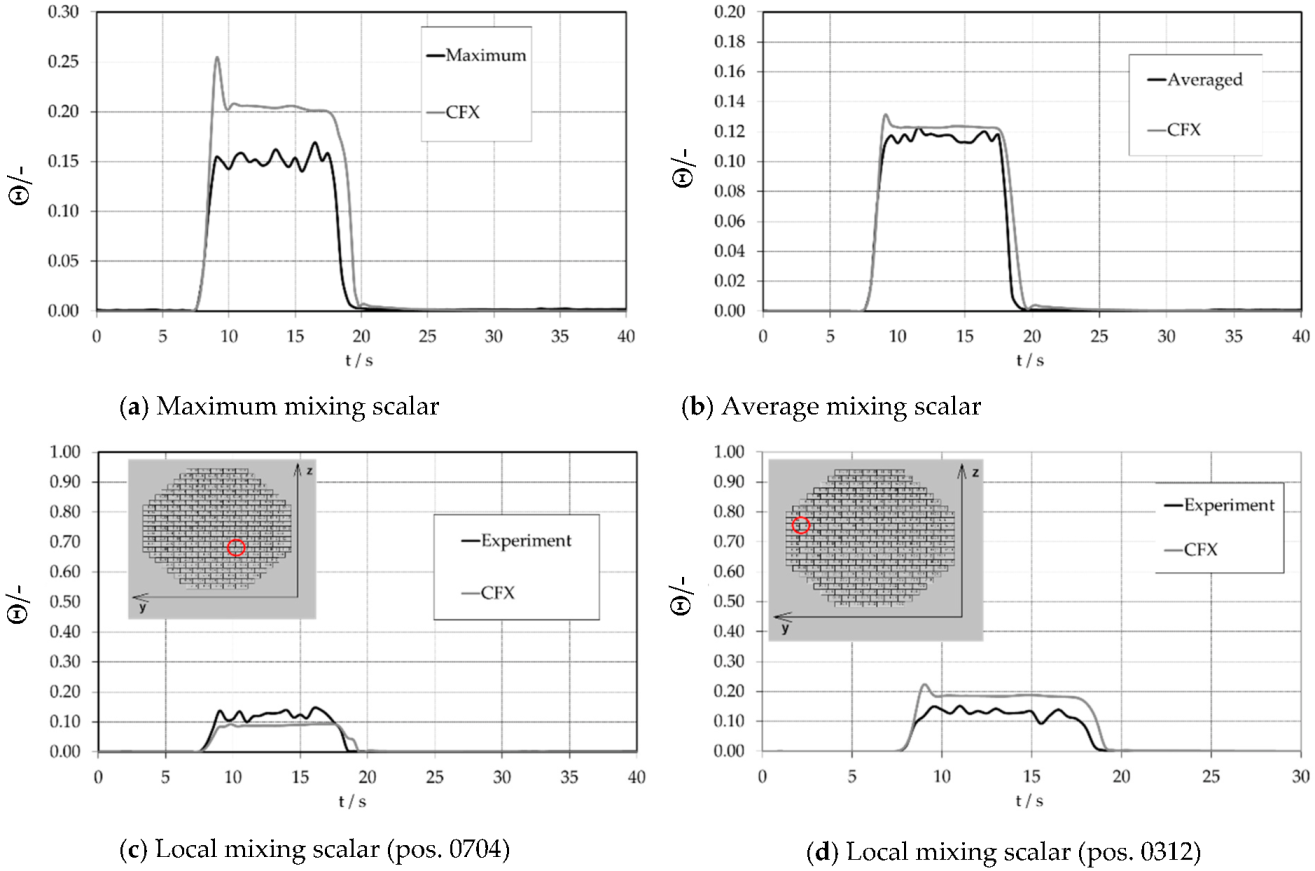
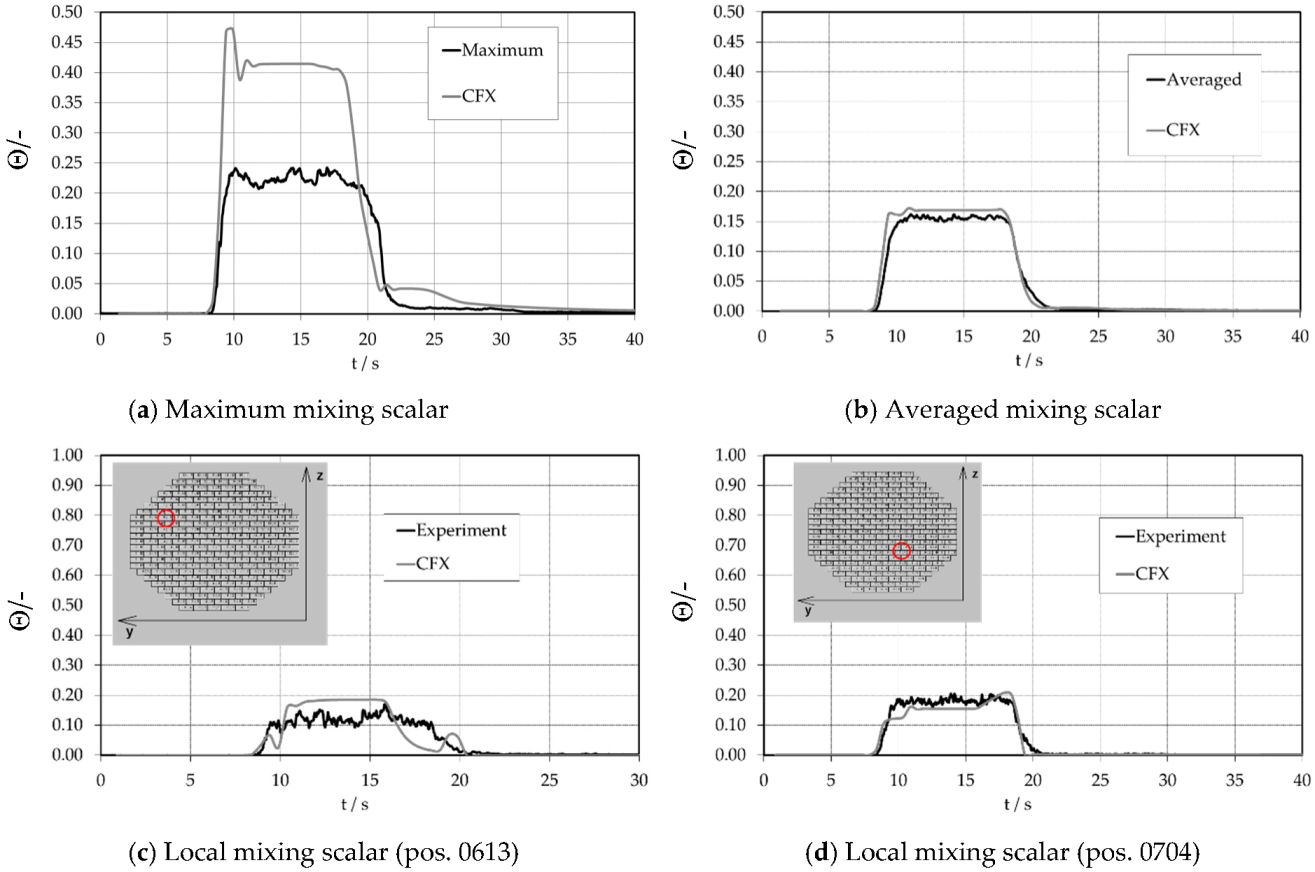
In Figure 23a,b the maximum and averaged value of the mixing scalar is shown at the sensor plane of cold leg 1. Two measuring points (Figure 23c: 0613, Figure 23d: 0704) at the cold leg sensor are designated for the comparison of the experiment to the CFX calculation. The locations of the sensor positions are shown in Figure 23c,d. These figures describe a quantitative comparison of measured and calculated values at the inlet sensor plane. At position 0704 shown in Figure 23d the calculated mixing scalar agrees well with the experimental values, particularly at the moment of the already diluted ECC water incoming at the sensor plane.
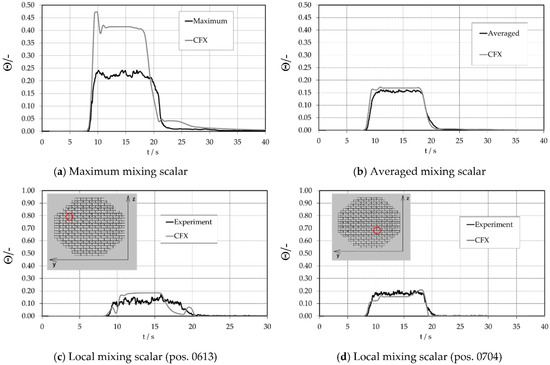
Figure 23.
Time-dependent tracer distributions at the cold leg, inlet nozzle sensor (red circle displays the position).
- b.
- Upper downcomer sensor analysis
Figure 24 shows the maximum (Figure 24a) and averaged (Figure 24b) mixing scalar of the upper downcomer sensor plane. The agreement to the experiment is acceptable. Deviations occur at the maximum values. As already declared for the PTS1 case, this discrepancy should not be overvalued. The instant angle distribution of the mixing scalar in the downcomer is shown in Figure 25.

Figure 24.
Transient tracer course at the upper downcomer.

Figure 25.
Upper and lower downcomer sensor plane.
Here, 32 circumferential sensor element positions within the middle of the higher and lower downcomer sensor plane were designated for the comparison of information. The distribution is given at 13 s for the upper downcomer sensor (Figure 25a) and at 35 s for the lower downcomer sensor (Figure 25b). In general, the code properly represents the instant angle distribution of the mixing scalar within the downcomer. Discrepancies cannot be addressed solely to code and modeling variations but also to the unsteady and random character of flow. The downward-sloping slug can be seen within the time course of the local mixing scalar at the upper downcomer sensor plane (Figure 26). An angle position below the inlet nozzle 1 was selected (Figure 26).

Figure 26.
Local tracer distribution at the upper downcomer sensor.
- c.
- Analysis of the flow at the lower downcomer sensor
The maximum and average values of the mixing scalar at the lower downcomer detector that is conferred in Figure 27a,b are calculated for the 32 positions within the middle of the lower downcomer detector plane (analogous to those of the upper downcomer sensor). At the lower downcomer detector, the maximum value of the mixing scalar is considerably smaller than within the higher downcomer (Figure 24a,b) because of turbulent mixture within the downcomer. Consequently, this commixture results in a bigger space that is covered by the slug. The expectation of the slug arriving at the detector plane is two seconds too early in each calculation. While the calculation determines the averaged value very well (please note the zoomed mixing scalar in Figure 27a,b), it overpredicts the maximum value.

Figure 27.
Time-dependent tracer course at the lower downcomer sensor.
The numerical result is confirmed by the experiment at the 42.5° circumferential position (Figure 28), with larger differences in the slug dynamic behavior.
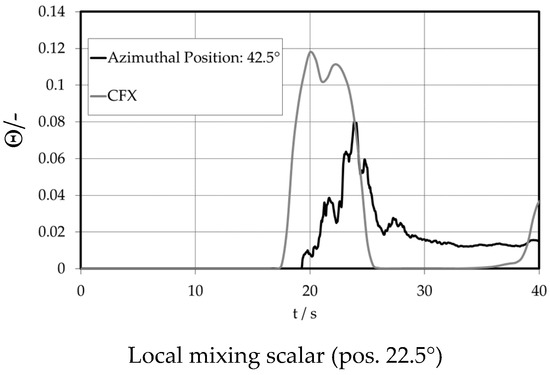
Figure 28.
Local transient tracer distributions at the lower downcomer sensor.
9. Discussion and Conclusions
Two experiments, PTS1 and PTS2, were compared to numerical predictions from the CFD computer code ANSYS CFX. The primary comparison of the code on ROCOM mixing experiments was performed earlier for pure buoyancy-driven flow (d10m05). Compared to the earlier study, important progress has been made with the development of CFD codes regarding numerical aspects as well as physical modeling, particularly on the treatment of turbulence. Thus, the more difficult cases of mixed convection and momentum-driven flow are analyzed by the Reynolds stress turbulence model of CFX. Regarding the prediction of a PTS event, the code shows good predictions of the ECC injection with the mixing of ECC water with the cold leg inventory. The mixing scalar at the upper downcomer sensor shows the capability of CFD to analyze single phase PTS events, even for the ranges between momentum- and density-driven flow. It has been discovered by experiment and CFD calculation that, for the Froude number Fr = 0.85, cold ECC water mixes only partly with the water inventory within the cold leg. A stratified flow develops and a momentum-driven flow field is present in the downcomer during the injection phase. Later, the flow becomes density dominated. The heavier ECC water propagates downwardly in the downcomer. The variations between experiment and calculation increase with distance from the ECC injection, i.e., at the placement of the lower downcomer. The angular distribution of the ECC water at this location is extremely sensitive to the initial density magnitude relation between ECC water and cold leg inventory. For the momentum-driven flow the Froude number is Fr = ∞, meaning there is no influence of buoyancy forces. The flow travels into the downcomer and splits into two flow branches, flowing in an exceedingly downwards-directed helix around the core barrel. This flow field is identical before, throughout, and after the ECC injection. The momentum-driven regime has caused unforeseen issues for CFD in properly predicting the mixing scalar within the downcomer. Subsequent general conclusions are drawn: The CFD code (and the turbulence modeling approach) shows an authentic qualitative agreement with the experimental information. The dominant mixing phenomena are treated properly. However, it appears that buoyancy forces should be calculated additionally and exactly within the mixed convection regime. Further, the analysis discovered that experimental and numerical analyses are essential to a deeper understanding of the flow behavior in an RPV. In future, numerical studies of more complex experiments of the ROCOM test facility are planned.
Author Contributions
Conceptualization, T.H. and S.K.; Methodology, S.K.; Validation, T.H.; Formal analysis, T.H.; Investigation, S.K.; Writing—original draft, T.H.; Writing—review & editing, T.H.; Visualization, T.H. and S.K. All authors have read and agreed to the published version of the manuscript.
Funding
This research received no external funding.
Conflicts of Interest
The authors declare no conflict of interest.
Nomenclature
| Latin Letters | ||
| Unit | Description | |
| a | - | constant |
| A | m2 | surface area |
| c | m/s | fluid velocity |
| C | - | constant |
| D | m2/s | diffusion coefficient |
| d | m | diameter |
| Fr | Froude number | |
| g | m/s2 | acceleration due to gravity |
| G | buoyancy production term | |
| j | - | run variable |
| kgm/s | turbulent kinetic energy | |
| l | m | length |
| m | kg | mass |
| kg/s | mass flow | |
| n | - | maximum value of the running variable |
| N | - | number of realizations |
| p | N/m2 | pressure |
| - | turbulence production | |
| Sij | - | principal stress tensor |
| t | s | time |
| K | temperature | |
| u, U | m/s | fluid velocity |
| m/s | average fluid velocity | |
| m3/s | flow rate | |
| x | m | coordinate in main flow direction |
| m | location coordinate | |
| y | m | wall distance |
| Greek Letters | ||
| Unit | Description | |
| N/m2 | shear stresses | |
| m2/s3 | dissipation rate | |
| Θ | - | dimensionless mixing scalar |
| μ | kg/ms | dynamic fluid viscosity |
| eddy viscosity | ||
| kinematic viscosity | ||
| pressure scrambling effect | ||
| density of the fluid | ||
| σ | µS/cm | conductivity |
| τ | N/m2 | shear stress |
| N/m2 | Reynolds stress tensor | |
| ϕ | N/m2 | pressure strain |
| s−1 | dissipation rate of k | |
| Indices | ||
| 0 | index for the unaffected coolant | |
| 1 | index for the disturbed loop | |
| t | index for time | |
| x | index for the x coordinate | |
| y | index for the y coordinate | |
| z | index for the z coordinate | |
| Abbreviations | ||
| BPG | Best Practise Guidelines | |
| BSL | Baseline | |
| CAD | Computer Aided Design | |
| CFD | Computational Fluid Dynamics | |
| CFX | Commercial Computational Fluid Dynamics Code | |
| CPU | Central Processing Unit | |
| ECC | Emergency Core Cooling (System) | |
| EXP | Experiment | |
| GPU | Graphical Processor Unit | |
| HZDR | Helmholtz-Zentrum Dresden-Rossendorf | |
| IAEA | International Atomic Energy Agency | |
| NPP | Nuclear Power Plant | |
| PTS | Pressurized Thermal Shock | |
| ROCOM | Rossendorf Coolant Mixing Test Facility | |
| RPV | Reactor Pressure Vessel | |
| RSM | Reynolds Stress Model, Root Mean Square | |
| WMS | Wire Mesh Sensor | |
References
- Prasser, H.-M.; Grunwald, G.; Höhne, T.; Kliem, S.; Rohde, U.; Weiss, F.-P. Coolant mixing in a PWR-deboration transients, steam line breaks and emergency core cooling injection—Experiments and analyses. Nucl. Technol. 2003, 143, 37–56. [Google Scholar] [CrossRef]
- Kliem, S.; Sühnel, T.; Rohde, U.; Höhne, T.; Prasser, H.-M.; Weiss, F.-P. Experiments at the mixing test facility ROCOM for benchmarking of CFD-codes. Nucl. Eng. Design 2008, 238, 566–576. [Google Scholar] [CrossRef]
- Kliem, S.; Prasser, H.-M.; Sühnel, T.; Weiss, F.-P.; Hansen, A. Experimental determination of the boron concentration distribution in the primary circuit of a PWR after a postulated cold leg small break loss-of-coolant:accident with cold leg safety injection. Nucl. Eng. Des. 2008, 238, 1788–1801. [Google Scholar] [CrossRef]
- Höhne, T.; Kliem, S. Modeling of a buoyancy-driven flow experiment in pressurized water reactors using CFD-methods. Nucl. Eng. Technol. 2007, 39, 327–336. [Google Scholar] [CrossRef]
- Cartland Glover, G.; Höhne, T.; Kliem, S.; Rohde, U.; Weiss, F.-P.; Prasser, H.-M. Hydrodynamic phenomena in the downcomer during flow rate transients in the primary circuit of a PWR. Nucl. Eng. Des. 2007, 237, 732–748. [Google Scholar] [CrossRef]
- Bucalossi, A.; Moretti, F.; Melideo, D.; Del Nevo, A.; D’Auria, F.; Höhne, T.; Lisenkov, E.; Gallori, D. Experimental investigation of in-vessel mixing phenomena in a VVER-1000 scaled test facility during unsteady asymmetric transients. Nucl. Eng. Des. 2011, 241, 3068–3075. [Google Scholar] [CrossRef]
- Farkas, I.; Hutli, E.; Farkas, T.; Takács, A.; Guba, A.; Tóth, I. Validation of Computational Fluid Dynamics Calculation Using Rossendorf Coolant Mixing Model Flow Measurements in Primary Loop of Coolant in a Pressurized Water Reactor Model. Nucl. Eng. Technol. 2016, 48, 941–951. [Google Scholar] [CrossRef]
- Jayaraju, S.T.; Sathiah, P.; Komen, E.; Baglietto, E. Large Eddy simulation for an inherent boron dilution transient. Nucl. Eng. Des. 2013, 262, 484–498. [Google Scholar] [CrossRef]
- Da Silva, M.J.; Thiele, S.; Höhne, T.; Vaibar, R.; Hampel, U. Experimental studies and CFD calculations for buoyancy driven mixing phenomena. Nucl. Eng. Des. 2010, 240, 2185–2193. [Google Scholar] [CrossRef]
- Petrov, V.; Manera, A. Effect of pump-induced cold-leg swirls on the flow field in the RPV of the EPRTM: CFD investigations and comparison with experimental results. Nucl. Eng. Des. 2011, 241, 1478–1485. [Google Scholar] [CrossRef]
- Rohde, U.; Kliem, S.; Höhne, T.; Karlsson, R.; Hemström, B.; Lillington, J.; Toppila, T.; Elter, J.; Bezrukov, Y. Fluid mixing and flow distribution in the reactor circuit: Measurement data base. Nucl. Eng. Des. 2005, 235, 421–443. [Google Scholar] [CrossRef]
- Höhne, T.; Kliem, S. IAEA CRP benchmark of ROCOM boron dilution and PTS test cases for the use of CFD in reactor design, Computational Fluid Dynamics for Nuclear Reactor Safety Applications–CFD4NRS-6. Nucl. Eng. Des. 2016, 333, 161–180. [Google Scholar] [CrossRef]
- Prasser, H.-M.; Böttger, A.; Zschau, J. A new Electrode-Mesh Tomograph for Gas-Liquid Flows. In Flow Measurement and Instrumentation; Elsevier: Amsterdam, The Netherlands, 1998; Volume 9, pp. 111–119. [Google Scholar]
- Höhne, T.; Kliem, S.; Vaibar, R. Experimental and numerical modeling of transition matrix from momentum to buoyancy-driven flow in a pressurized water reactor. J. Eng. Gas Turbines Power Trans. ASME 2009, 131, 012906. [Google Scholar] [CrossRef]
- ANSYS CFX 19.0 Documentation. In ANSYS CFX-Theory Guide; Ansys, Inc.: Canonsburg, PA, USA, 2019.
- Mahaffy, J.; Chung, B.; Song, C.; Dubois, F.; Graffard, E.; Ducros, F.; Heitsch, M.; Scheuerer, M.; Henriksson, M.; Komen, E.; et al. Best Practice Guidelines for the Use of CFD in Nuclear Reactor Safety Applications-Revision; Organization for Economic Co-Operation and Development: Paris, France, 2015. [Google Scholar]
- Launder, B.; Reece, G.; Rodi, W. Progress in the Development of a Reynolds Stress Turbulence Closure. J. Fluid Mech. 1975, 68, 537–566. [Google Scholar] [CrossRef]
- Hanjalič, K. One-point closure models for buoyancy driven turbulent flows. Fluid Mech. 2002, 34, 321–347. [Google Scholar] [CrossRef]
- Carteciano, L.N.; Weinberg, D.; Müller, U. Development and analysis of a turbulence model for buoyant flows. In Proceedings of the 4th World Conference on Experimental Heat Transfer, Fluid Mechanics and Thermodynamics, Brussels, Belgium, 2–6 June 1997. [Google Scholar]
- Huang, M.; Höhne, T. Numerical simulation of multicomponent flows with the presence of density gradients for the upgrading of advanced turbulence models. Nucl. Eng. Des. 2019, 344, 28–37. [Google Scholar] [CrossRef]
Disclaimer/Publisher’s Note: The statements, opinions and data contained in all publications are solely those of the individual author(s) and contributor(s) and not of MDPI and/or the editor(s). MDPI and/or the editor(s) disclaim responsibility for any injury to people or property resulting from any ideas, methods, instructions or products referred to in the content. |
© 2022 by the authors. Licensee MDPI, Basel, Switzerland. This article is an open access article distributed under the terms and conditions of the Creative Commons Attribution (CC BY) license (https://creativecommons.org/licenses/by/4.0/).

