Article

Ground-Penetrating Radar Method for Studying Water Drainage in Sand Layers

Rostov State Transport University, 2 Narodnogo Opolcheniya Sqr., 344038 Rostov-on-Don, Russia
*
Author to whom correspondence should be addressed.
Fluids 2022, 7(12), 379; https://doi.org/10.3390/fluids7120379
Submission received: 20 October 2022 / Revised: 28 November 2022 / Accepted: 6 December 2022 / Published: 9 December 2022
(This article belongs to the Special Issue Fluid Flows in Geotechnical Engineering)

Abstract

:
A ground-penetrating radar (GPR) technology was developed to study the process of water drainage in sand layers with an insignificant concentration of dusty and clayey particles when moistened from above. The technology includes a method of calibration of the GPR equipment, algorithms for processing the GPR information, and their software implementation. The technology was used to process the results of laboratory GPR measurements obtained during draining of water through sand layers from different quarries for 100 h. The absolute values and the changes in the refractive index and specific conductivity near the sand layer upper boundary and on average over the layer depth were calculated. The results show that the developed technology makes it possible to determine electrophysical properties with an accuracy of up to 10%. The developed method for calculating relative reflectivity and its derivative with respect to the depth of the layer made it possible to visualize the information contained in the radargrams on the distribution of water near the surface and deep in the sand layers. The application of the method makes it possible to quantitatively estimate the moisture content near the upper boundary of the layer and the depth of the location of the most moistened areas of the layer depending on the duration of water drainage.

1. Introduction

The study of water drainage and the determination of moisture content of soil layers and soils of various genesis are important problems solved both by direct measurement methods and by modern geophysical methods. The moisture content of the soil, determined by the processes of water drainage during irrigation is the main factor in the efficient cultivation of crops [1]. The study of the regularities of water drainage is also carried out when solving hydrogeological problems associated with the determination of fracture zones in rocks [2]. Soil moisture is a factor that determines the quality of construction of engineering soil structures, as well as the stability of structures on flooded foundations [3]. Obviously, the list of tasks that justify the relevance of studying the patterns of water drainage in soils and soil structures can be significantly expanded.
GPR is among the methods for studying the mechanisms of stationary and nonstationary drainage of water in porous soils, and for examining spatial and temporal changes in moisture. For example, Pan et al. [4] used multichannel antenna systems to develop a method for identifying waterlogged zones of a soil massif. The GPR method proved to be effective in the study of the process of infiltration [5,6,7].
In addition, the GPR method makes it possible to track the capillary fringe, which was demonstrated in [8], where a change in reflection was detected, caused by a change in water content in the transition zone between the residual saturated layer and water-saturated capillary zone. It is shown in [9] that a 400 MHz ground-based GPR system can provide valuable information about the basic shape of a capillary fringe without any additional complex postprocessing. The simulation performed in the work showed that the water permeability is adequately described by the van Genuchten and Brooks–Corey models.
By now, the GPR method has become an effective tool for determining moisture content and studying subsurface hydrological processes [10,11].
The progress of the GPR method in solving hydrological problems is based on the development of methods for calculating moisture based on GPR data. Among the approaches to solving this problem, one can single out a method for estimating the refractive index by analyzing the characteristics of reflected waves [12]. A study by Grote [13] used GPR techniques to determine the moisture content of the roadbed layers during an infiltration experiment. In that study, moisture was determined from relative permittivity using petrophysical relationships refined by time-domain reflectometer (TDR) methods or Topp’s equations [14]. In the work by Cui et al. [15], the relative permittivity of the soil determined by the GPR method was refined using the drilling method.
Analysis of the results of GPR studies allows noting that the characteristics of the reflected radiation depend on a sufficiently large number of parameters characterizing surface, soil, and layering. However, solving the problem of studying water drainage in soil layers can be simplified if one is limited to specific applications. In particular, this study is aimed at elucidating the patterns of water drainage from the surface of homogeneous sandy layers simulating the subgrade of roads, which is often made of sands with quasi-homogeneous properties and horizontal layering.
Widespread introduction of georadars in the practice of transport is associated with the use of aerial antennas, which made it possible to survey long sections of roads [16,17]. In road subgrade surveys, GPR is commonly used to determine soil type, measure layers’ thicknesses, detect subsurface defects, and evaluate subgrade properties [18]. The study of the patterns of water drainage through sand under moistening from above undertaken in this work is aimed at creating a technology for determining the moisture content of sands, which is necessary for in situ preparation of layers for construction work. The relevance of this kind of research is indicated in the work of Jonard et al. [19], in which the water content profiles were reconstructed and, accordingly, the sand water retention curve described using the van Genuchten model was estimated.
Two approaches are considered in this work. The first approach is based on the traditional study of the values and nature of changes in the electrophysical properties (refractive index and specific conductivity) of sand layers during water drainage. This approach requires the development of equipment calibration technology that will allow determining the electrophysical properties and dimensional parameters of sand layers from the amplitudes of the reflected signals.
The second approach developed in this study is based on obtaining information about the moisture content and the position of the maximal moisture areas in the absence of contrasting boundaries between wet and dry sand layers. It is based on the development of algorithms for mathematical processing of GPR traces; the results thus obtained are then verified by direct measurements of moisture.
The considered approaches determine the structure of this work, which is organized as follows: in Section 2, the conditions for the applicability of the used approximations are considered, a method of calibrating a bistatic air antenna unit with a central pulse frequency of 1700 MHz for GPR measurements is described, and physical and mathematical relations for the algorithms for calculating electrophysical parameters and their correlation with sand moisture content are presented. In Section 3, the description of the experimental setup is given, calibration of the antenna unit is described, the properties of the sands used are listed, and the experiments performed are described. Section 4 presents calculated physical quantities and the ratios implemented in the algorithms. Section 5 is devoted to the study of changes in physical quantities during water drainage according to GPR data, and the study of the dynamics of water drainage through layers of sand. The research results are summarized in Section 6.

2. Theory and Methods

2.1. Approximations

According to [20], the complex relative permittivity of a soil ( ε ^ ) can be determined by the following relation:
ε = ε + j ε = ε + j σ ε 0 ω ,
where ε and ε are real and imaginary parts of relative permittivity ε ^ determined by the physical properties of the medium, j is the imaginary unit, ω is the circular frequency of radiation (in the case of GPR, the central frequency of the transmitting antenna radiation by a factor 2π), σ is the conductivity reflecting the polarization and electrical conductivity losses, and ε 0 is the vacuum permittivity.
In general, including cases of clayey soils or soils with high electrolyte concentrations, when determining the modulus of relative permittivity, it is necessary to take into account the contribution of the imaginary part. In such a manner, it is possible to establish the relationship between moisture and the modulus of relative permittivity more accurately [21]. In the case of the sands considered in this paper and their moisture content range of 7–17% (Appendix A), commonly used in subgrade construction, Equation (1) allows for significant simplification.
The data given in [22] allow, for the sands with a moisture content of about 10%, to obtain the ratio of the imaginary ( ε ) and real ( ε ) parts of relative permittivity ε″/ε′ ≈ 0.03. Thus, ε ε ; according to [23], this is a reasonable approximation under condition of effective propagation of electromagnetic waves.
The smallness of ε″ in the case under consideration makes it possible to calculate the modulus of the complex relative permittivity with
ε = ε 2 + ε 2 = ε ( 1 + 1 2 ( ε ε ) 2 ) .
We calculate the refractive index (n) with
n = ε .
Taking into account Equation (3), upon the condition ε ε , the amplitude of the GPR radiation reflected by the upper boundary of the sand layer is determined by
E = E 0 n 1 n + 1 ,
where E0 is the amplitude of the incident wave.
The use of Equation (4) implies normal incidence of waves on the surface, and it needs independent determination of the amplitude of the incident wave E0. To fulfill the first requirement, we further use aerial transmitting and receiving antennas located above the upper surface of the layer at a height h0 satisfying the geometrical condition h 0 l/2, where l is the distance between the centers of the transmitting and receiving antennas. To fulfill the second requirement, we measure the dependence of E0 on h0 to calibrate the antenna unit.

2.2. Calibration of the Antenna Unit

The angular divergence of electromagnetic radiation from a horn transmitting antenna in air, according to [24], leads to an almost exponential dependence of the wave amplitude on the distance traveled from the source. Then, the expression for the amplitude of the wave reflected by the upper boundary of the layer and recorded by the receiving antenna ( E ¯ ) can be calculated using Equation (4) taking into account the attenuation of the amplitude due to angular divergence of the waves incident on and reflected by the upper boundary of the sand layer:
E ¯ = E ¯ 0 e p 0 h 0 n 1 n + 1 e p 0 h 0 = E ¯ 0 e 2 p 0 h 0 n 1 n + 1 ,
where E ¯ 0 is the amplitude characteristic of the transmitting antenna, p0 is the attenuation coefficient of the wave due to angular divergence in the air along the path h0, and n is the refractive index of the sand layer; the second exponential factor takes into account the angular divergence of electromagnetic radiation after reflection from the upper surface of the sand.
Taking into account the decrease in the amplitude of the incident and reflected waves due to angular divergence, we redefine E0 in Equation (5) as follows:
E 0 = E ¯ 0 e 2 p 0 h 0 .
The antenna unit was calibrated by fitting the calculated amplitude of an electromagnetic wave reflected by a large-area metal sheet at different heights of the antenna unit above its boundary, to the results of respective measurements. The choice of metal reflecting surface for calibrating the antenna unit is due to the fact that, according to [20], the depth of penetration of the microwave radiation into metal can be estimated to be 0.6–3 mm, which means almost complete reflection of incident electromagnetic waves ( n 1 , in Equation (5)). In further calculations, the use of Equation (6) allows interpreting E 0 and E in Equation (4) as the amplitudes of waves emitted and recorded by the GPR antenna unit.
The unknown values E ¯ 0 and p 0 are determined by minimizing the following functional:
Δ = 1 N i = 1 N | E ¯ 1 ( i , t h e o r ) E ¯ 1 ( i , e x p e r ) | ,
where the index i numbers the heights of the placement of the antenna unit (h0i in Equation (6)), used for calculations and measurements, N is the total number of heights used during calibration, E ¯ 1 ( i , t h e o r )   and   E ¯ 1 ( i , e x p ) are the amplitudes of the wave calculated using Equation (6) and measured after reflection from the metal sheet.

2.3. Calculation of the Electrophysical Parameters of Wet Sands

The use of Equation (4) after calibration of the antenna unit makes it possible to determine the refractive index of the soil layer near the upper surface. To determine the average value of the refractive index n of the soil layer with thickness h, we use the following formula that is valid for the normal incidence of radiation:
n = c Δ t 2 h ,
where Δt is the time of wave propagation from the upper boundary of the layer and back, and c is the speed of light in vacuum.
To determine the coefficient of attenuation of electromagnetic radiation (p) in a soil layer, we consider the GPR trace s from the layer. We can subject the trace to the Hilbert transform s ^ = H ( s ) and calculate the trace envelope using the following formula:
G ( h i ) = s i ( h i ) 2 + s i ( h i ) 2 ,
where hi is the depth, and s i is the orthogonal complement of the trace. We can approximate Equation (9) with an exponential decay function. Fitting the approximating function to the trace envelope is performed by minimizing the following functional:
Δ = i = k 1 k 2 | G ( h i ) A e p h i | ,
where k 1 = m 1 + m d , k 2 = m 2 m d , the subscript i numbers the points of the trace, m 1 is the point number at the top of the layer, m 2 is the point number at the bottom of the layer, and m d is the width at half maximum of the GPR signal reflected by upper boundary expressed in points of the trace. By minimizing the functional given by Equation (10), it is possible to determine the attenuation coefficient of electromagnetic radiation p in the soil layer. In the case when an electromagnetic wave propagates in a medium with a refractive index n and an attenuation coefficient p determined as in [20], it is possible to express the conductivity of the soil layer with
σ = 2 p n μ 0 c ,
where μ 0 is vacuum magnetic permeability, and c is the speed of light in vacuum.

2.4. Amplitude of Reflected Signals in Sands with Different Moistures

A change in the water content of the soil layer due to the drainage of water will lead to a change in the amplitudes of the reflected signals. Dossi et al. [25] compared the amplitudes of the GPR signals, which made it possible to estimate the change in the attenuation coefficient of electromagnetic waves at different stages of irrigation.
In this work, in addition to using Equation (10) to calculate the attenuation coefficient (p), to assess the change in the amplitudes, we use the reflectivity of the soil layer ( F ( h 1 , h 2 ) ) , the boundaries of which are located at depths h 1 and h 2 . We can denote with k1 and k2 the point numbers of the trace corresponding to the boundaries of the layer. We define the reflectivity of the layer as follows:
F ( h 1 , h 2 ) = i = k 1 k 2 G ( h i )
We can denote the integral value of the reflectivity of the layer as
F m a x = i = k 1 M G ( h i ) ,
where M is the total number of trace points, and k1 is the trace point number corresponding to the upper boundary of the soil layer.
To estimate the distribution of moisture content over depth, we normalize the reflectivity at the trace point number k to the amplitude of the incident wave:
f ( h k ) = 1 F m a x i = 1 k 1 G ( h i ) G ( h k ) .
The depth derivative of normalized reflectivity,
δ ( h k ) = f ( h k ) k ,
allows determining the depth in the layer with maximum gradient of the refractive index associated in this study with the change in moisture.

2.5. Dependence of the Refractive Index of Sand on Moisture

Taking into account the dielectric properties of soil components and geometrical features of the medium implies the use of reliable formulas connecting the moisture content and the properties of the studied samples. Such studies were carried out by Anbazhagan et al. [26], who analyzed the accuracy of various published petrophysical relationships used to make estimates of soil moisture. They showed that Roth’s electromagnetic mixing formulas are the most accurate model for all soils except sandy loam. To analyze the obtained results on the dependence of the refractive index on moisture, we use the Roth formula for the refractive index of a wet sand:
n = ( 1 ϕ f ) n s + θ n l + ( ϕ f θ ) n g ,
where n s , n l , and n g = 1 are the refractive indices of the solid, liquid, and gas fractions, ϕ f is the porosity, and θ is the volume fraction of the liquid fraction.

3. Materials and Measurements

3.1. Experimental Installation

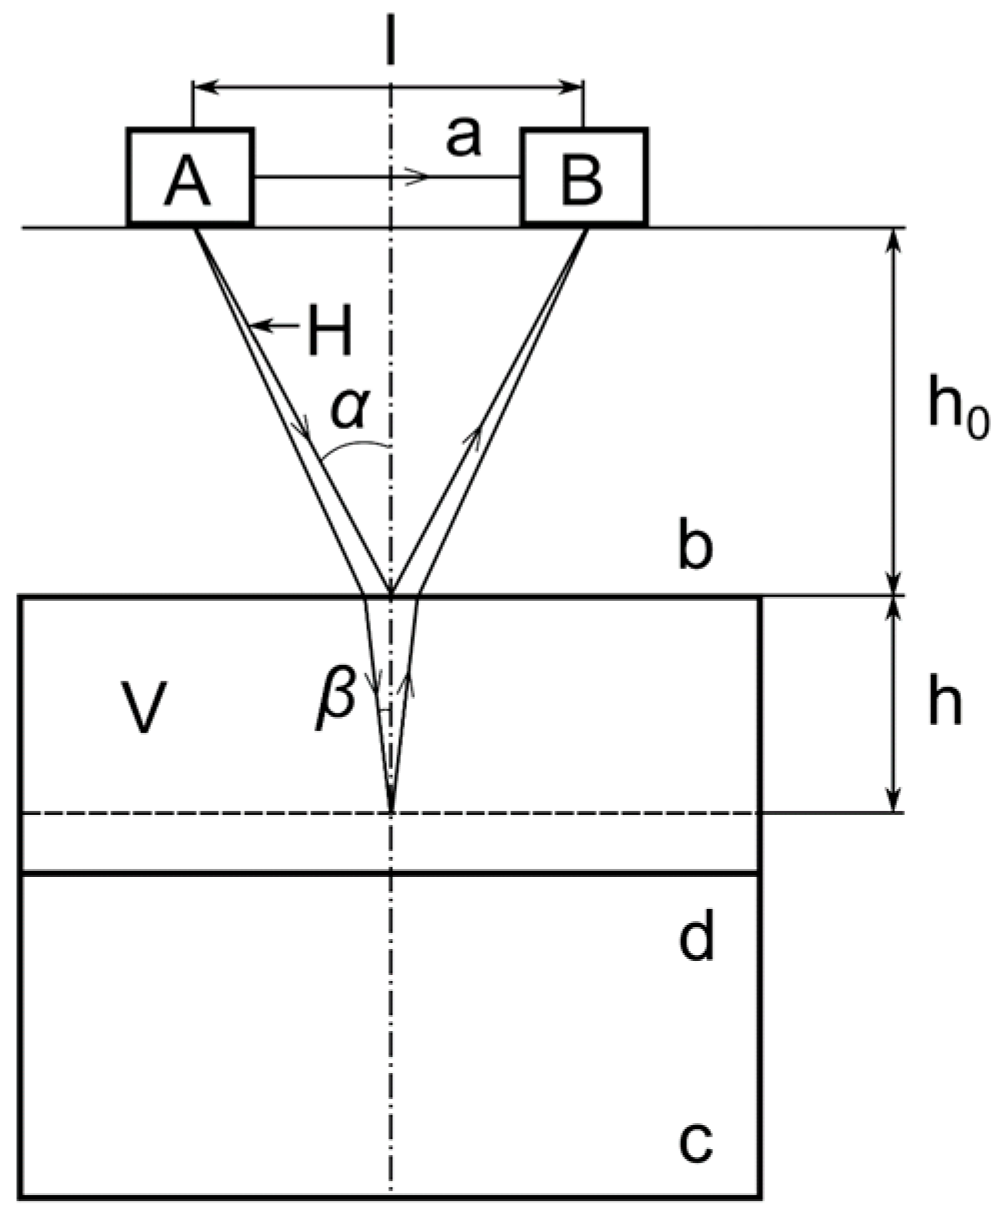
To measure the amplitude of the reflected wave, we used the Oko series GPR (www.logsys.ru, access date: 7 December 2022) with horn antenna units working at a generation frequency of 1700 MHz (antenna unit No. 278), at fixed polarization. The scheme of the experimental setup for the GPR research of sands is shown in Figure 1. The following notations are used: V—waterproof volume 0.6 m × 0.6 m × 0.6 m in size filled with sand, b and c—upper and lower surfaces of sand, d—waterproof partition, l—distance between the centers of the transmitting (A) and receiving (B) GPR antennas, a—trajectory of the direct signal, h0—height of the antenna unit above the upper sand layer, h—depth of an arbitrary surface within the sand, H—half the path traveled by the electromagnetic wave from the transmitting to the receiving antenna upon reflection from the surface b, and α and β—the angles of incidence and refraction of electromagnetic radiation on the upper surface of the layer, respectively.

3.2. Calibration of the Antenna Unit

When performing calibration, the metal sheet was placed on the surface (b) of the experimental setup, the scheme of which is shown in Figure 1. The experiment performed for calibration included the registration of radargrams in the range of heights of the antenna unit (h0) above the metal surface from 0.20 to 0.55 m with a step of 0.05 m. At each height, eight radargrams were recorded, each formed from 20 traces; each trace was averaged over 32 independent measurements with a 24 ns sweep. Registration of radargrams and subsequent processing, including removal from the spectrum of signals with frequencies lower than 100 MHz and higher than 3 GHz, as well as averaging of all the traces, was performed in the same manner using the Geoscan32 software (Version 2021.09.30.688, OOO Logic Systems, Ramenskoye, Moscow Region, 2021) package developed by Logis LLC (www.logsys.ru, access date: 7 December 2022). The values of optimal parameters were E ¯ 0 = 40 , 000 and p 0 = 1.76 m−1. Units of measurement of E ¯ 0 coincide with the units of measurements of traces; they are individual for each GPR design and are abbreviated when using expressions such as Equations (4) and (5). Thus, we do not indicate them here or below.
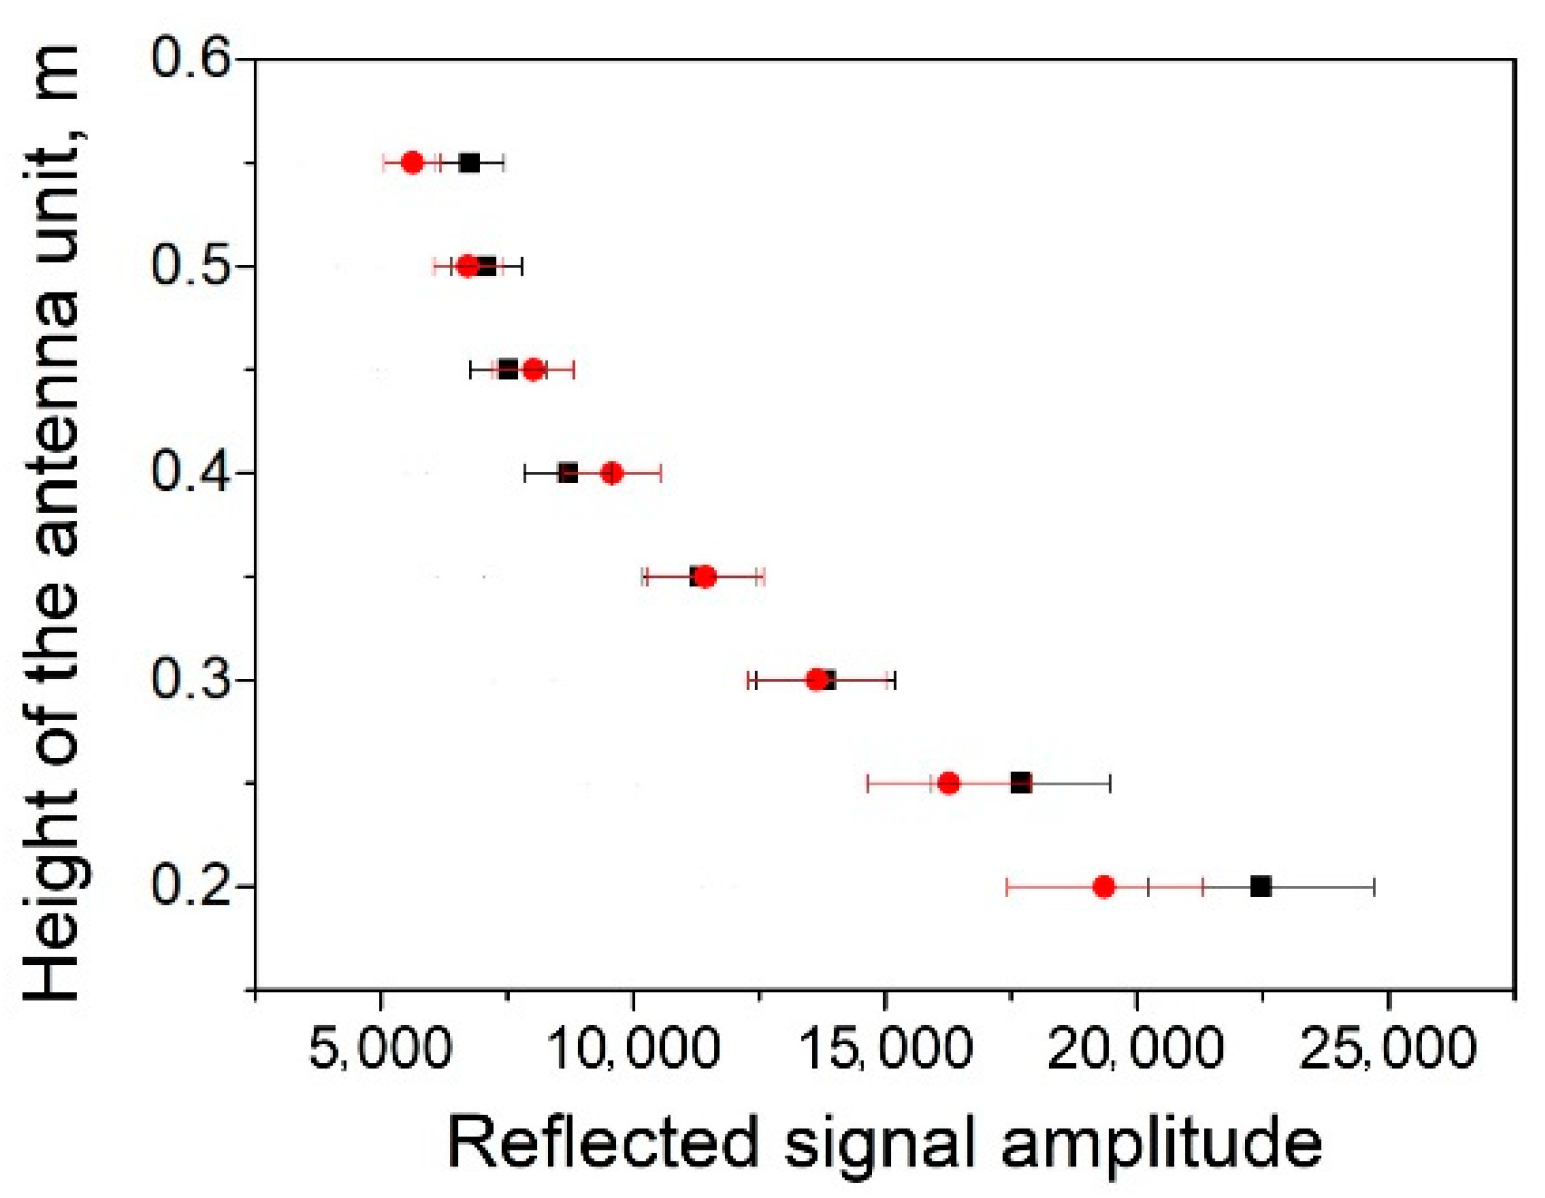
The obtained optimal parameters are used in Equation (5) to calculate the amplitudes of the reflected signals for different heights of antenna unit above the reflecting metal surface. The calculation results are compared with the experiment in Figure 2 for eight height values. A rigorous calculation of Pearson correlation coefficient between theoretical and experimental results gives 0.916. In accordance with the Chaddock scale, such a value characterizes the correlation as ‘very high (strong)’. In this case, the average value of the relative error was 8% with a standard deviation of 1329 used units. Figure 2 shows that, in the range of significant heights of the antenna unit placement above the reflecting surface, the calibration performed allows achieving agreement between theory and experiment with an accuracy better than 8%.
In further studies, the values of the parameters h0 = 0.3 m and l = 0.06 m were used. In this case, the angle of incidence turns out to be α = 5.70°, and H exceeds h0 (Figure 1) by less than 1%, which justifies the use of the condition h0l/2. For the selected height of the antenna unit, the relative error was 1% with a standard deviation (in this case, the difference between theoretical and experimental values) of 169 units.
The angle of incidence α = 5.70° of electromagnetic radiation on the surface of naturally dry sand (n = 1.7) gives the angle of refraction equal to β = 3.30°. In this case, the error of Equation (8) associated with the deviation of the angle of incidence of electromagnetic radiation from normal will be less than 1%. When the sand is moistened, the refractive index will increase, and the error of Equation (8) will decrease.

3.3. Sands Used in Measurements

For the studies carried out in this work, two types of sand were used; some of their characteristics obtained during the tests are shown in Table 1. The granulometric composition of sands is presented in Table 2. The sand was placed in a box (Figure 1) with dimensions of 0.60 × 0.60 × 0.60 m, made of nonconductive water-repellent material. In the periods between GPR measurements, a plastic film was placed on the upper surface of the sand, preventing the evaporation of water introduced into the sand. The box was filled with sand in two stages, in layers of 0.3 m without additional compaction. During the measurements, the radargrams formed by 20 traces were recorded; each trace was averaged over 32 independent measurements with a 16 ns sweep.
In this study, four experiments were performed. When performing experiment 1, sample 1 was used, the upper layer of which (0.3 m high) was separated from the rest of the sand in the container by a thin waterproof partition preventing water drainage. After performing GPR measurements on sand in a naturally dry state, the sand was moistened from above with 15.1 L of technical water. Moistening was carried out through a watering can with a base area of 0.60 × 0.60 m, placed on top of the box, with 100 round holes 2 mm in diameter evenly spaced over the base area.
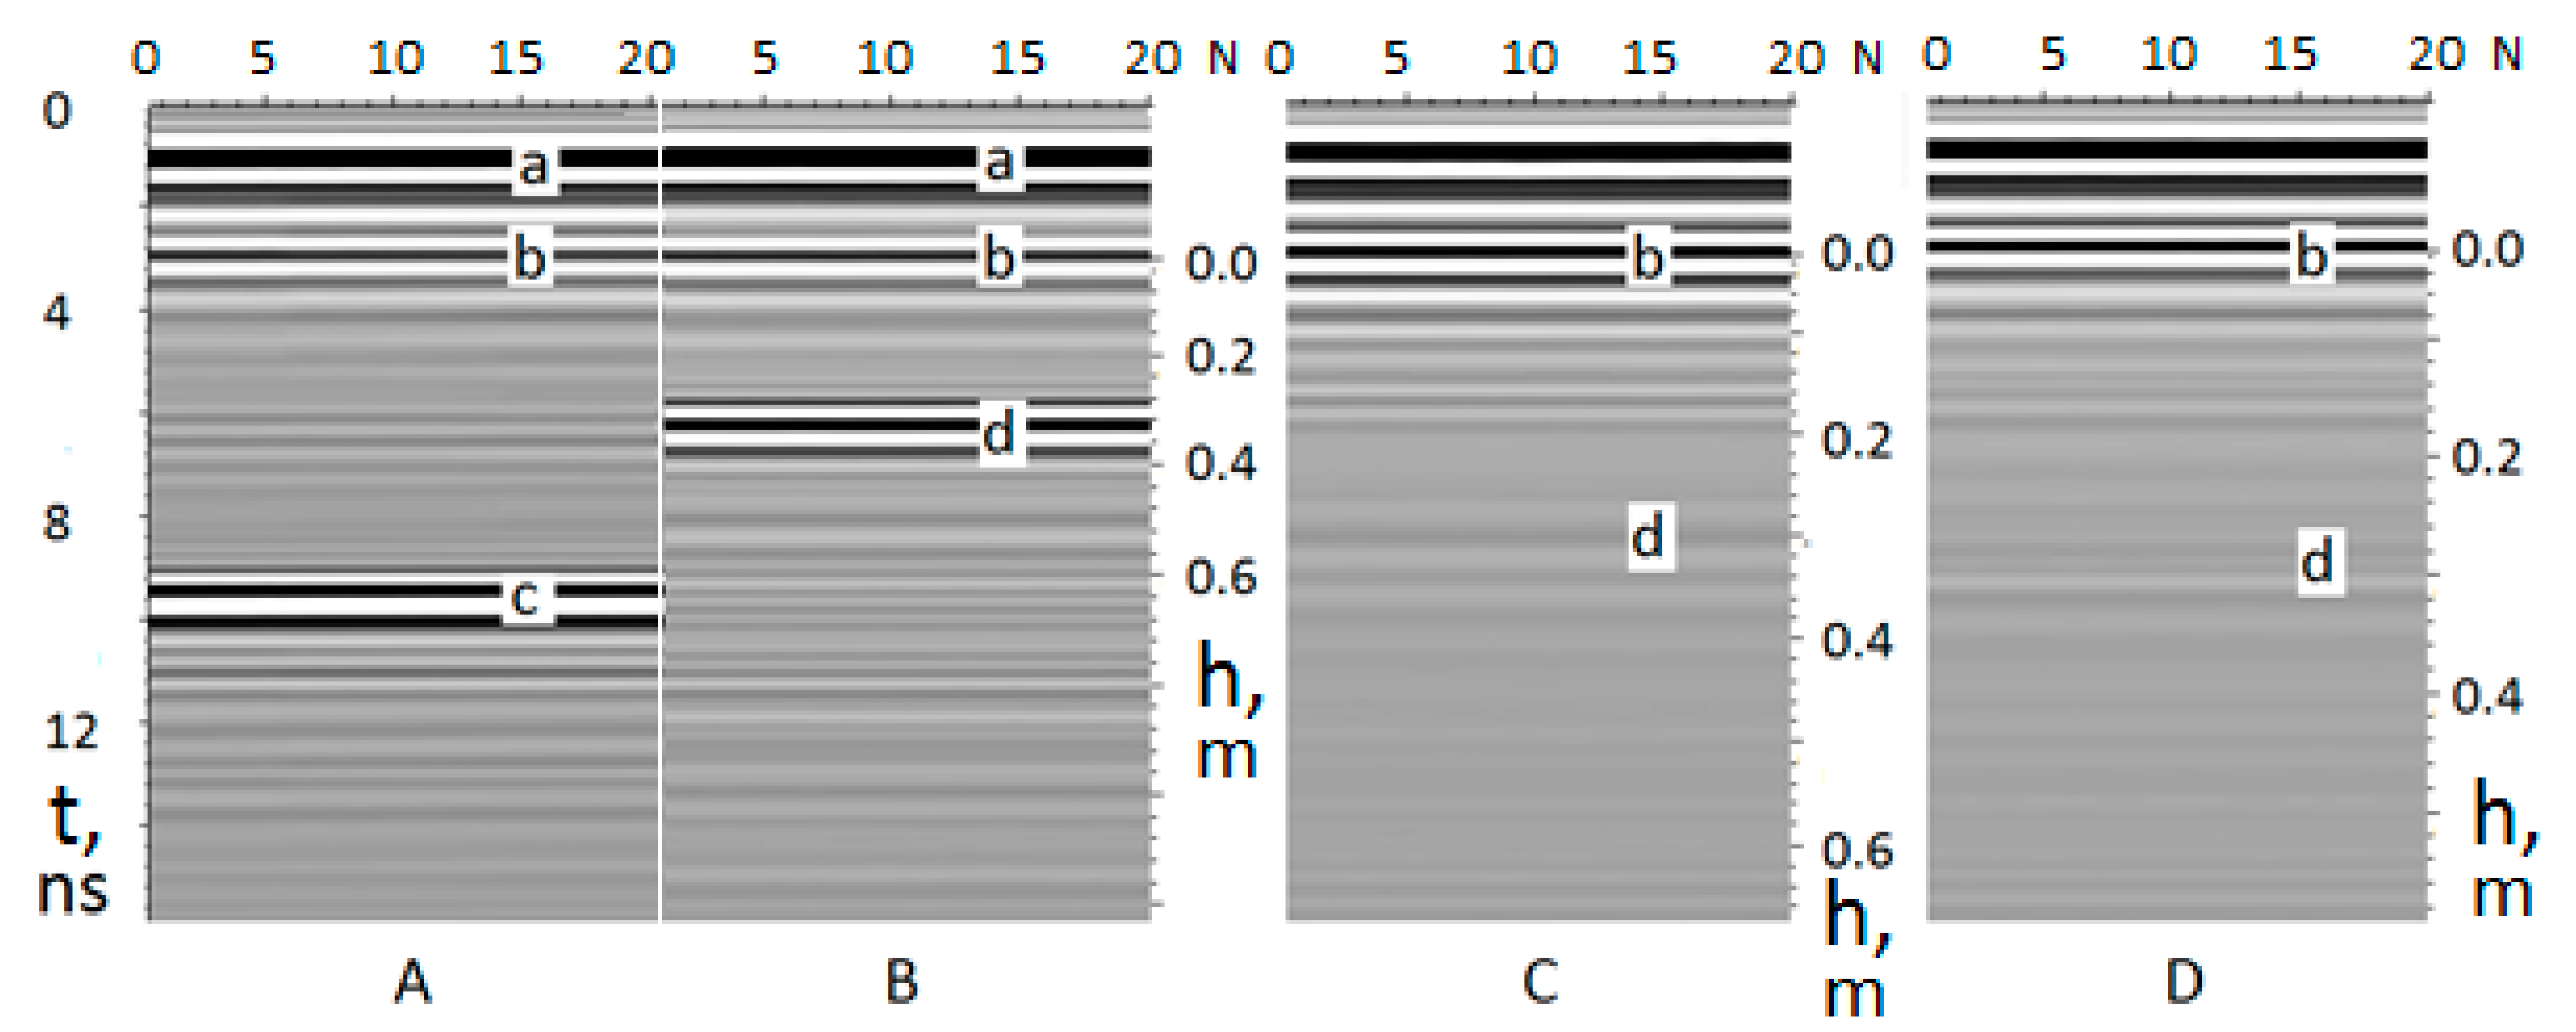
The resulting radargrams were processed as described in Section 3.2. Some radargrams are shown in Figure 3. They are formed by electromagnetic waves emitted by the transmitting antenna and recorded by the receiving antenna. The waves propagating only in the air form feature (a) on the radargrams. Reflection from the upper surface of sand leads to the formation of feature (b), which is shifted in comparison with (a) to larger times. Penetrating into dry sand (Figure 3A,B) with a low attenuation coefficient, the electromagnetic waves are reflected from the bottom surface of the sand layer (c) or from the waterproof partition placed in the volume of sand (d). Moistening the sand with 15.1 L of water (Figure 3C) leads to a decrease in the propagation speed of electromagnetic waves; as a result of this, the image of the waterproof partition (d) is shifted to larger times. In the course of 50 h of water drainage (Figure 3D), an increase in the average value of the relative permittivity of the wet sand layer occurs, which leads to a slight displacement of the image (d) to larger times. The increase in the attenuation of electromagnetic waves when the sand is moistened leads to a decrease in the contrast of the image of the waterproof partition (d) in Figure 3C,D as compared to Figure 3B. The depth scales in Figure 3 show the known positions of the bottom of the box and the waterproof partition.
When performing experiment 2, in contrast to experiment 1, a sample of sand 2 was used. Experiment 3 was also performed with sample 2, but 22.8 L of water was used to moisten the sand. Experiment 4 was performed similarly to experiment 1, but there was no partition at a depth of 0.3 m. The experimental conditions are summarized in Table 3.
The results of processing of the GPR data obtained during experiments 1 and 2 allowed us to compare the process of water drainage in sands with different filtration coefficients. Comparison of the results obtained during the experiments 2 and 3 allowed comparing the consequences of drainage of different volumes of water in the same conditions. Experiments 2 and 3 simulate water drainage under conditions of sand placement on a non-draining base, which can be clay or compacted loam in the conditions of construction work. These studies simulate the first stage of work on the construction of a subgrade using drainage soils on a clay base.
The results of processing the GPR data obtained during experiments 1 and 4 made it possible to compare drainage under conditions of placing a sand layer on non-drainage and drainage bases. Unlike the first three experiments, experiment 4 simulates the process of preparing a layer for compaction during the construction of a subgrade from drainage soils.

4. Features of Algorithms and Software Implementation

The processing of the information obtained during GPR monitoring of the water drainage process during the four experiments implies the execution of a large volume of calculations. For their implementation, in this work, a computer program is developed for calculating the physical parameters of moistened soils [27]. Pairing the software and the hardware parts of GPR is carried out by specifying the parameters E ¯ 0 , p 0 ,   and   h 0 in the edited file before starting the calculations. The program makes it possible to determine, from the radargrams obtained at different stages of drainage, the thickness of the sand layer and the time dependences of the following values:
-
Refractive index (Equations (5) and (8));
-
Coefficient of attenuation of electromagnetic radiation in sand (Equations (9) and (10));
-
Specific conductivity of the soil layer (Equation (11));
-
Relative reflectivity of soil layers (Equation (14)) and its depth derivative (Equation (15)).
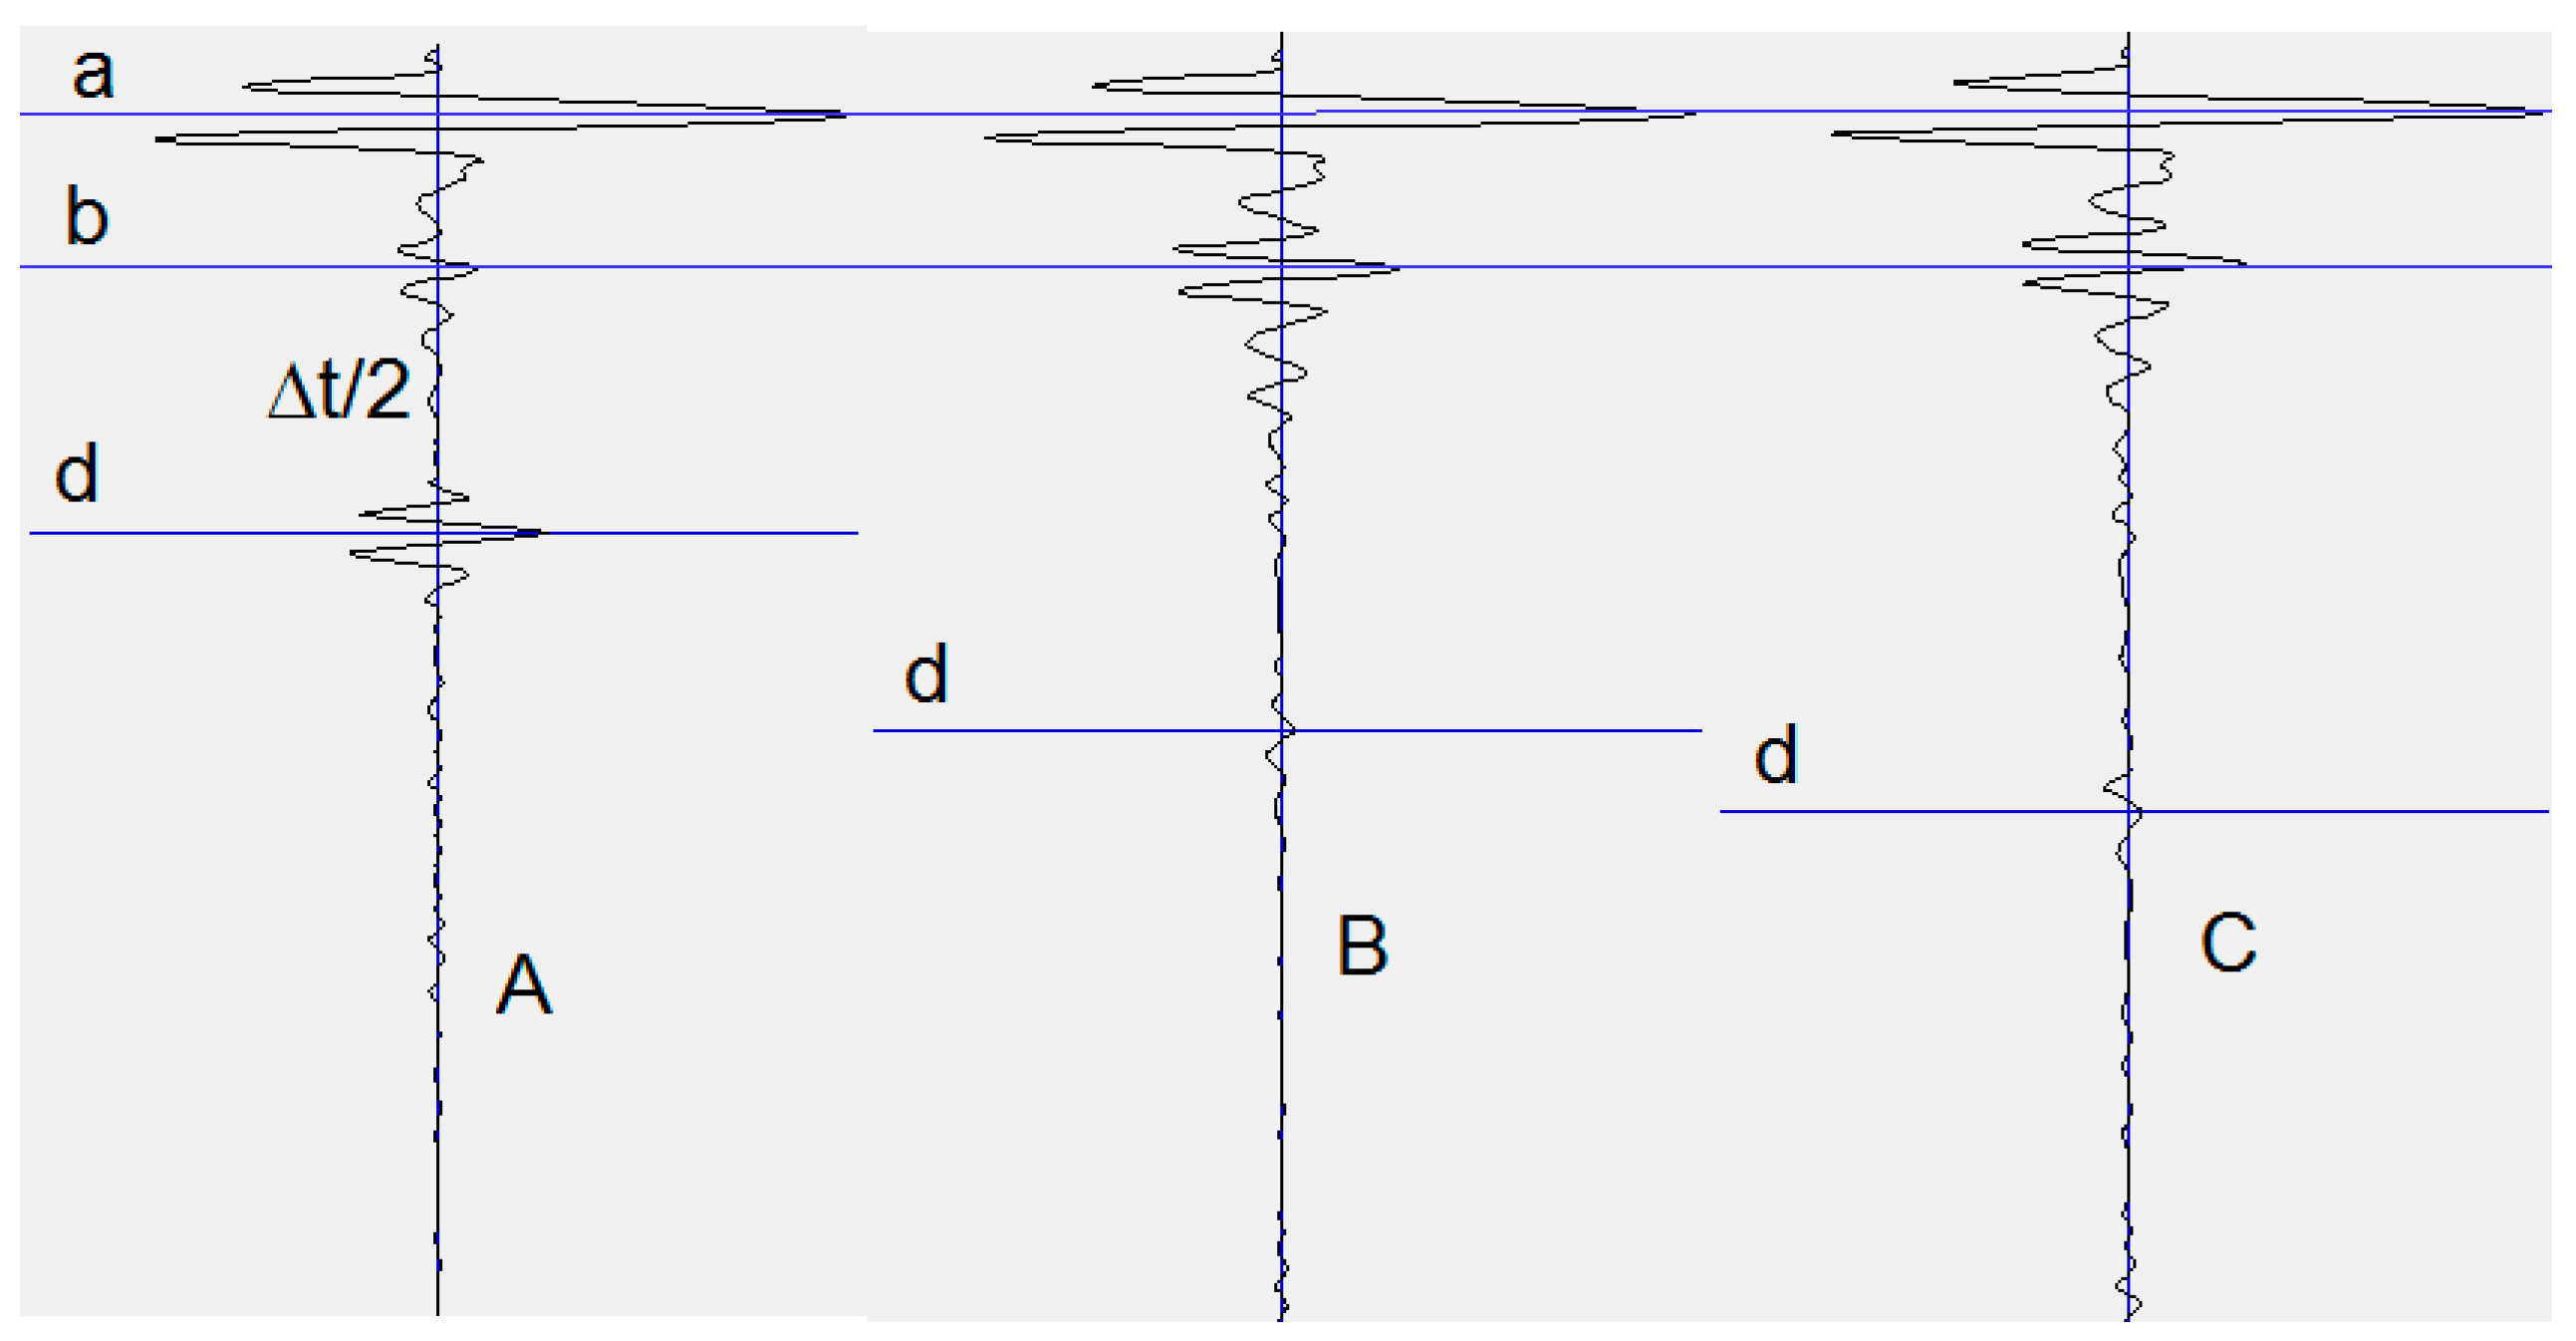
The algorithm for determining the layer thickness is based on the assumption of the uniformity of the sand layer prepared for moistening in a naturally dry state. It includes the calculation of the refractive index according to Equation (5), determining the propagation time of the wave from the upper boundary of the layer and back ( Δ t = 2 ( t d t b ) , Figure 4A), and applying Equation (8). To do this routine working, the lower boundary of the layer must be reliably identified in the experiment. In the experiments carried out in this study, this condition is met at the sand–bottom of the box interface (Figure 3c) and sand–waterproof partition interface (Figure 3d). During construction work, this condition is met if the underlying layer of sand is sufficiently compacted or special markers are laid at the interface of the layers. For sample No. 1, the calculated value of the layer thickness turned out to be 0.31 m; it is in good agreement with the direct measurement result of 0.30 ± 0.01 m. In further consideration of moistened sands, the layer thickness was assumed to be constant and equal to this value.
The use of Equations (5) and (8) makes it possible to determine the difference between the refractive index, attenuation coefficient, and conductivity near the upper surface and on average over the layer depth. A comparison of these values makes it possible to qualitatively judge the redistribution of moisture along the depth of the sand layer.
The use of Equations (14) and (15) to calculate the relative reflectivity and its derivative is carried out at the points of the traces (k) relating to the sand layer ( b k d , Figure 4A–C). For the cases shown in Figure 4A–C, the total number of calculation points was 103, 191, and 207, respectively.
Calculated derivatives of the reflectance are approximated by a polynomial, the degree of which is set in the edited input file before starting the program execution. In this work, it is chosen as equal to 5. The maximum of the approximating polynomial indicates the area with the maximum gradient of the refractive index and is interpreted as the area with the maximum moisture gradient.

5. Results and Discussion

5.1. Change in Refractive Index When Draining Water

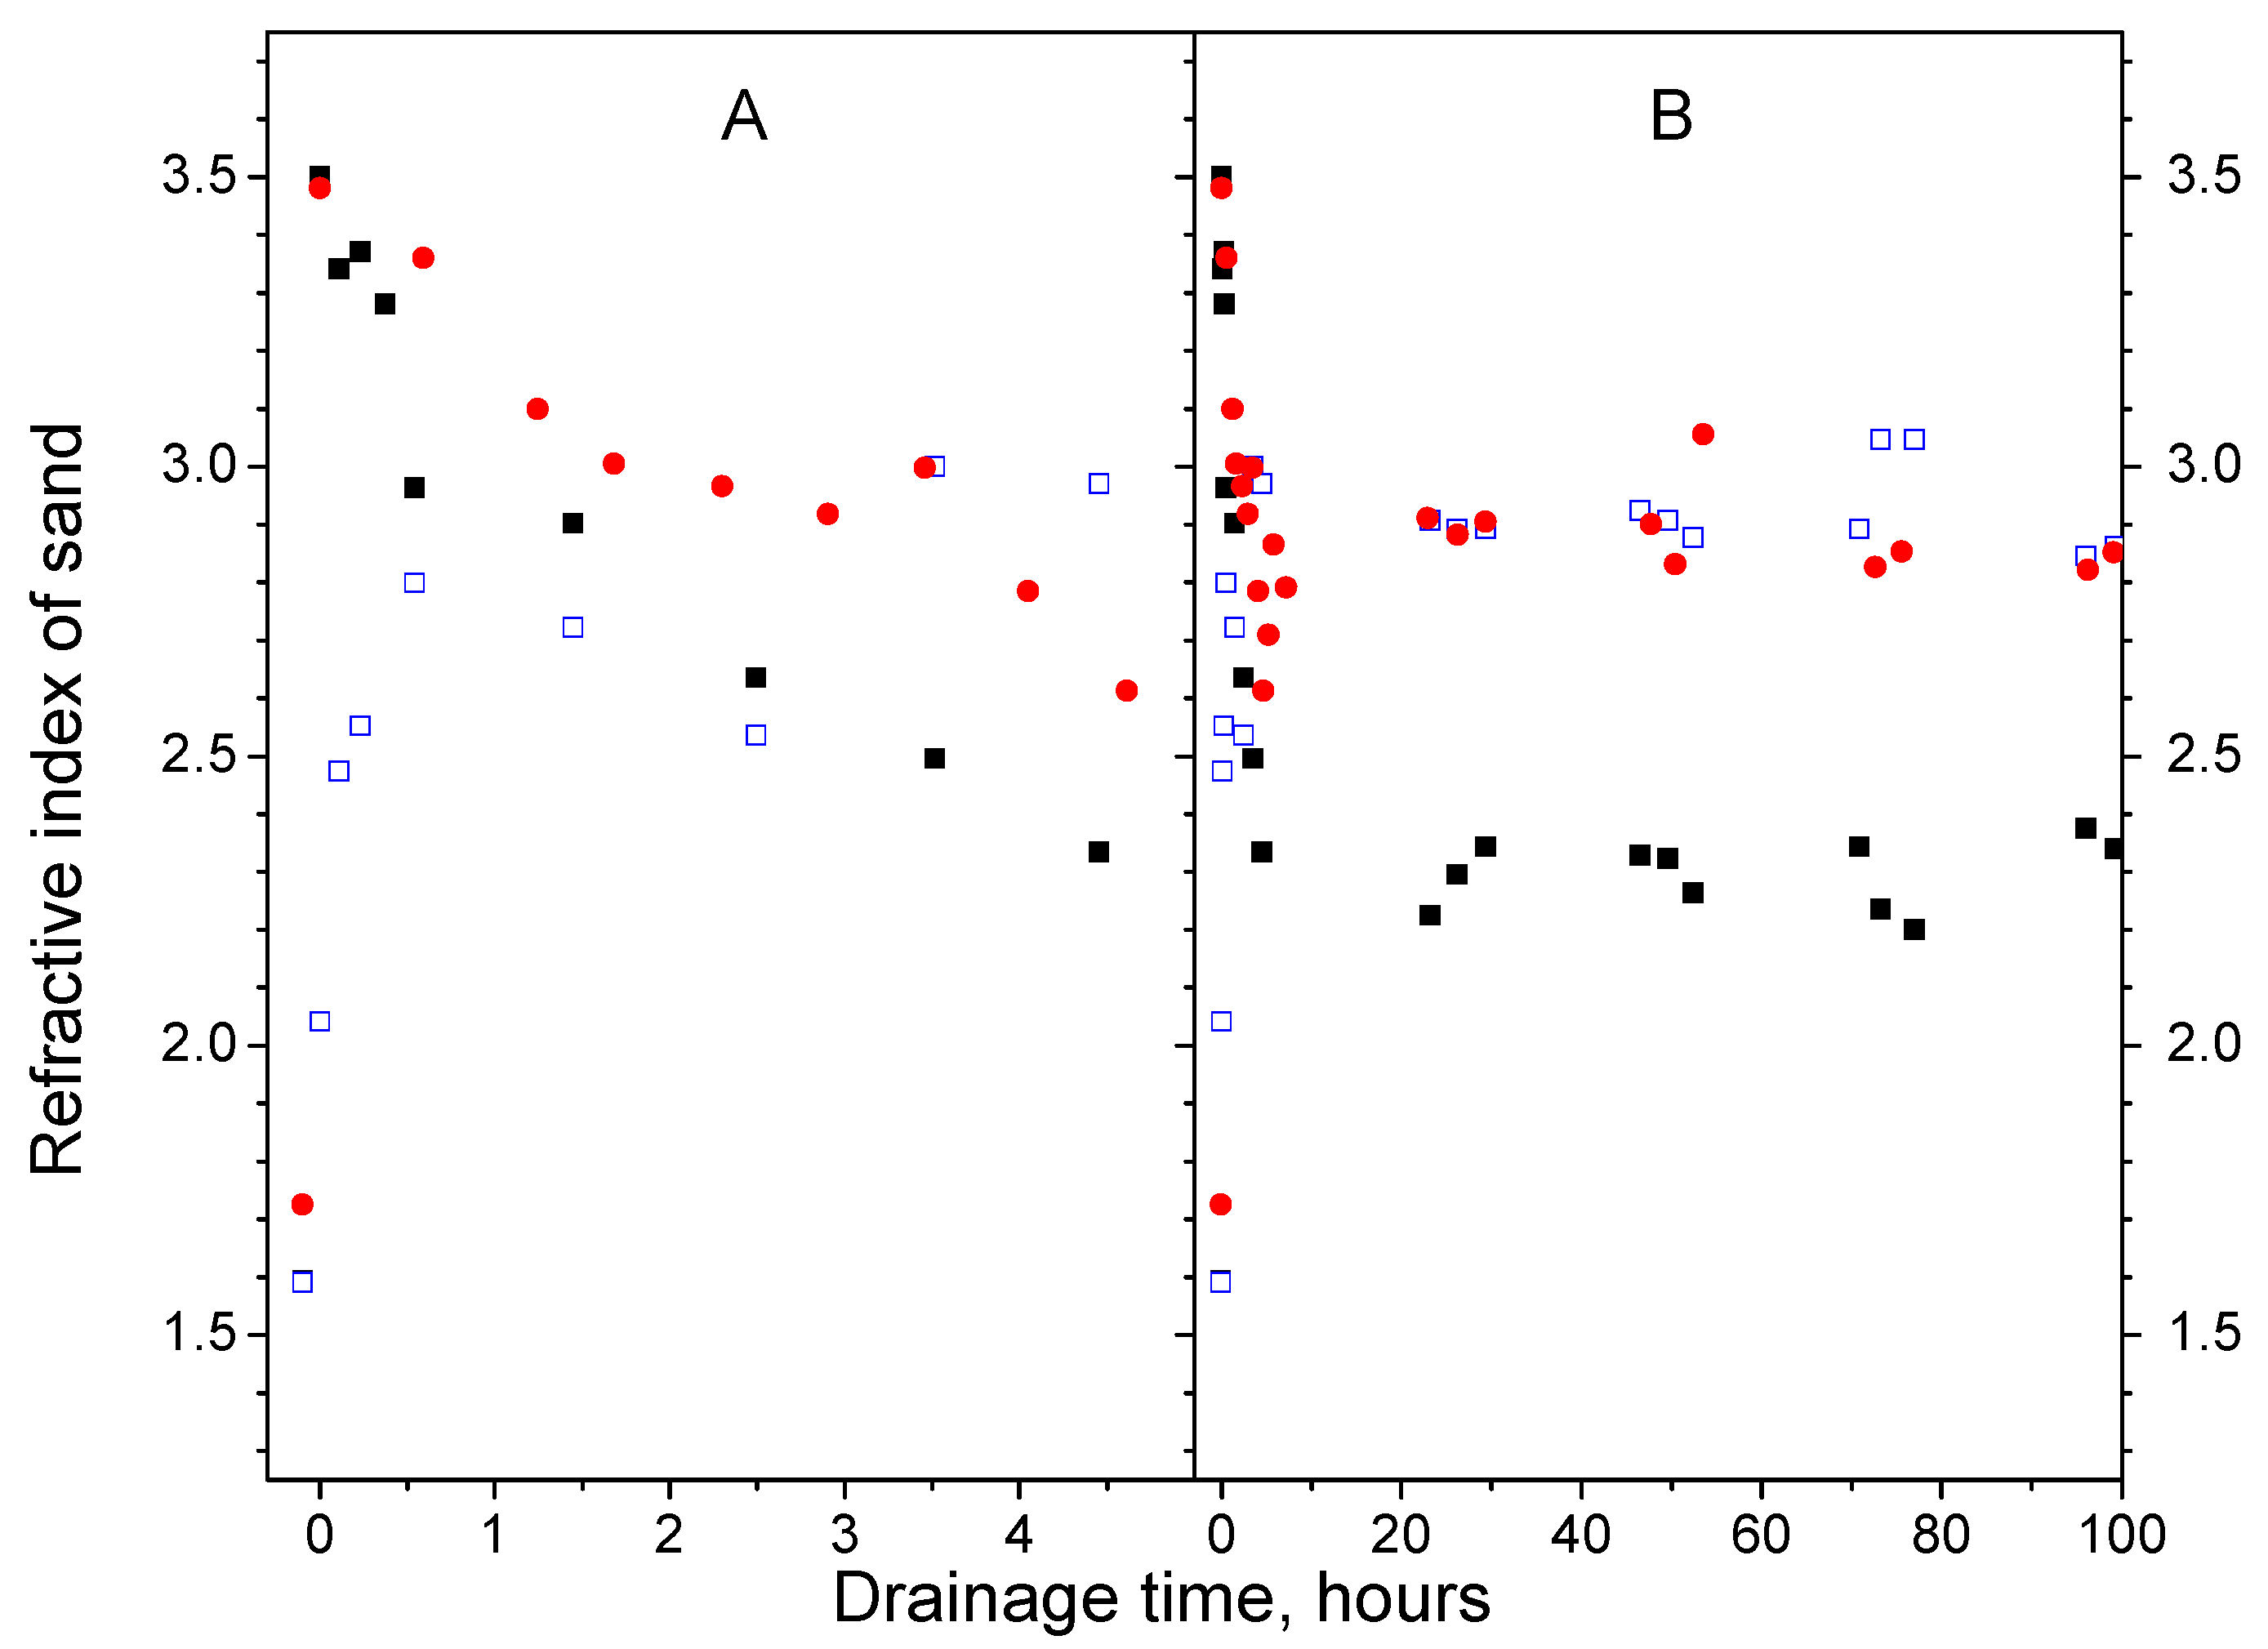
Figure 5 shows the calculated dependence of the refractive index on the time of water drainage in experiments 1 and 2 determined by Equations (5) and (8).
In Equation (5), the amplitude of the signal reflected from the upper layer of sand is used. The reflected signal is formed in the upper layer of the sample [28], the thickness of which in the selected frequency range and the observed range of refractive indices is several centimeters. Thus, Equation (5) gives the average value of the refractive index in the upper layer about 5 cm thick.
In Equation (8), the wave propagation to the lower boundary of the entire layer 0.3 m thick bounded by a waterproof partition and back is considered. Consequently, Equation (8) gives the average value of the refractive index of the sand in the entire layer.
Figure 5A shows that, immediately after moistening with the same amount of water, the refractive indices of samples No. 1 and 2 at the surface of the sand boundary calculated using Equation (5) are close and practically do not depend on the properties of the sand samples. As noted above, the reflected signal is formed in the upper layer of the sample several centimeters thick. In this layer, at the initial moments of drainage, the value of the refractive index is determined mainly by the refractive index of water, which in the used frequency range is noticeably higher than the refractive index of any dry sand. In this study, we used the value of the refractive index of water n l = 8.1 ± 0.2 determined by GPR measurements and Equation (5).
Let us interpret the results shown in Figure 5. Consider the case of sand in a naturally dry state. We use Equation (16) and the experimental values of the refractive indices of samples No. 1 and 2, 1.59 and 1.73 (the first left points in Figure 5, as well as the values of the porosity of the samples listed in Table 1). As a result, we obtain the values ( 1 ϕ f ) n s equal to 1.15 and 1.39.
The GPR measurements were accompanied by taking samples of moist sand with a hand soil sampler at a depth of 0.05–0.1 m and measuring their moisture content ( W ) using an MA100 moisture analyzer (https://sartoros.ru/laboratory/, access date: 7 December 2022) equipped with an infrared heater which implements the formula
W = m l m s + m l = ρ l θ ρ n + ρ l θ ,
where m l and ρ l are the mass and density of the liquid phase, and m s and ρ s are the mass and density of the solid phase. For the volume portion of the liquid fraction, from Equation (17), one can get
θ = ρ n W ρ l ( 1 W ) .
The use of a hand sampler could cause additional sand compaction and lead to additional errors when determining the moisture. This mechanism for the emergence of errors was not analyzed in this work.
Direct measurement of moisture according to Equation (17) for samples No. 1 and 2 immediately after moistening and GPR measurements gave the values of 15% and 13%. Respective values of the volume proportions of the liquid fraction calculated by Equation (18) taking into account the data in Table 1 turned out to be 0.27 and 0.21. These values, together with the results of measuring the porosity of the samples (Table 1), made it possible to determine the volumetric content of the gas fraction ( ϕ f θ ) which turned out to be equal to 0.17 and 0.26, respectively. The performed measurements and numerical estimates made it possible to apply Equation (16) to the calculation of the refractive indices of the first and second samples immediately after moistening. The refractive indices were found to be 3.51 and 3.35. These values differ from the experimental ones by 3–5%.
During the drainage time of 30 h, the differences in the experimental refractive indices increase and stabilize for sand samples 1 and 2 at the values of 2.3 and 2.9. In this case, corresponding values of moisture content were 6% and 8%, and the values of volume fractions of the liquid fraction calculated by Equation (18), taking into account the data in Table 1, turned out to be 0.10 and 0.12. The difference in these values can be explained by the manifestation of differences in the drainage properties of sands with the same amount of water used in the experiments 1 and 2. In this case, the values of the volume fractions of the gas fraction were determined to be 0.34 and 0.35, and the refractive indices for the first and second samples calculated by the Equation (16) turned out to be 2.30 and 2.71. In this case, the average difference between the calculated and experimental values of the refractive indices is about 5%.
Now, we can apply Equation (8) to determine the average value of the refractive index of the wetted layer after the completion of the drainage process. After 30 h of the moistening process, the experimental value of the refractive index of the sand is 2.89 (Figure 5B). To estimate the average moisture content of a 0.3 m thick sand layer after the completion of the drainage process, in the first experiment, we take into account that the volume of water added to the sand is 15.1 L. This water creates, according to Equation (17), a moisture content of 8.5%. The volume fractions of the liquid (Equation (18)) and gas fractions of the first sample are 0.14 and 0.30, and the refractive index is 2.58. Comparison of the experimental and theoretical values shows their 10% difference.
Thus, the algorithms for processing GPR data make it possible to study the changes in the refractive indices of sands during water drainage with an error not exceeding 10%.
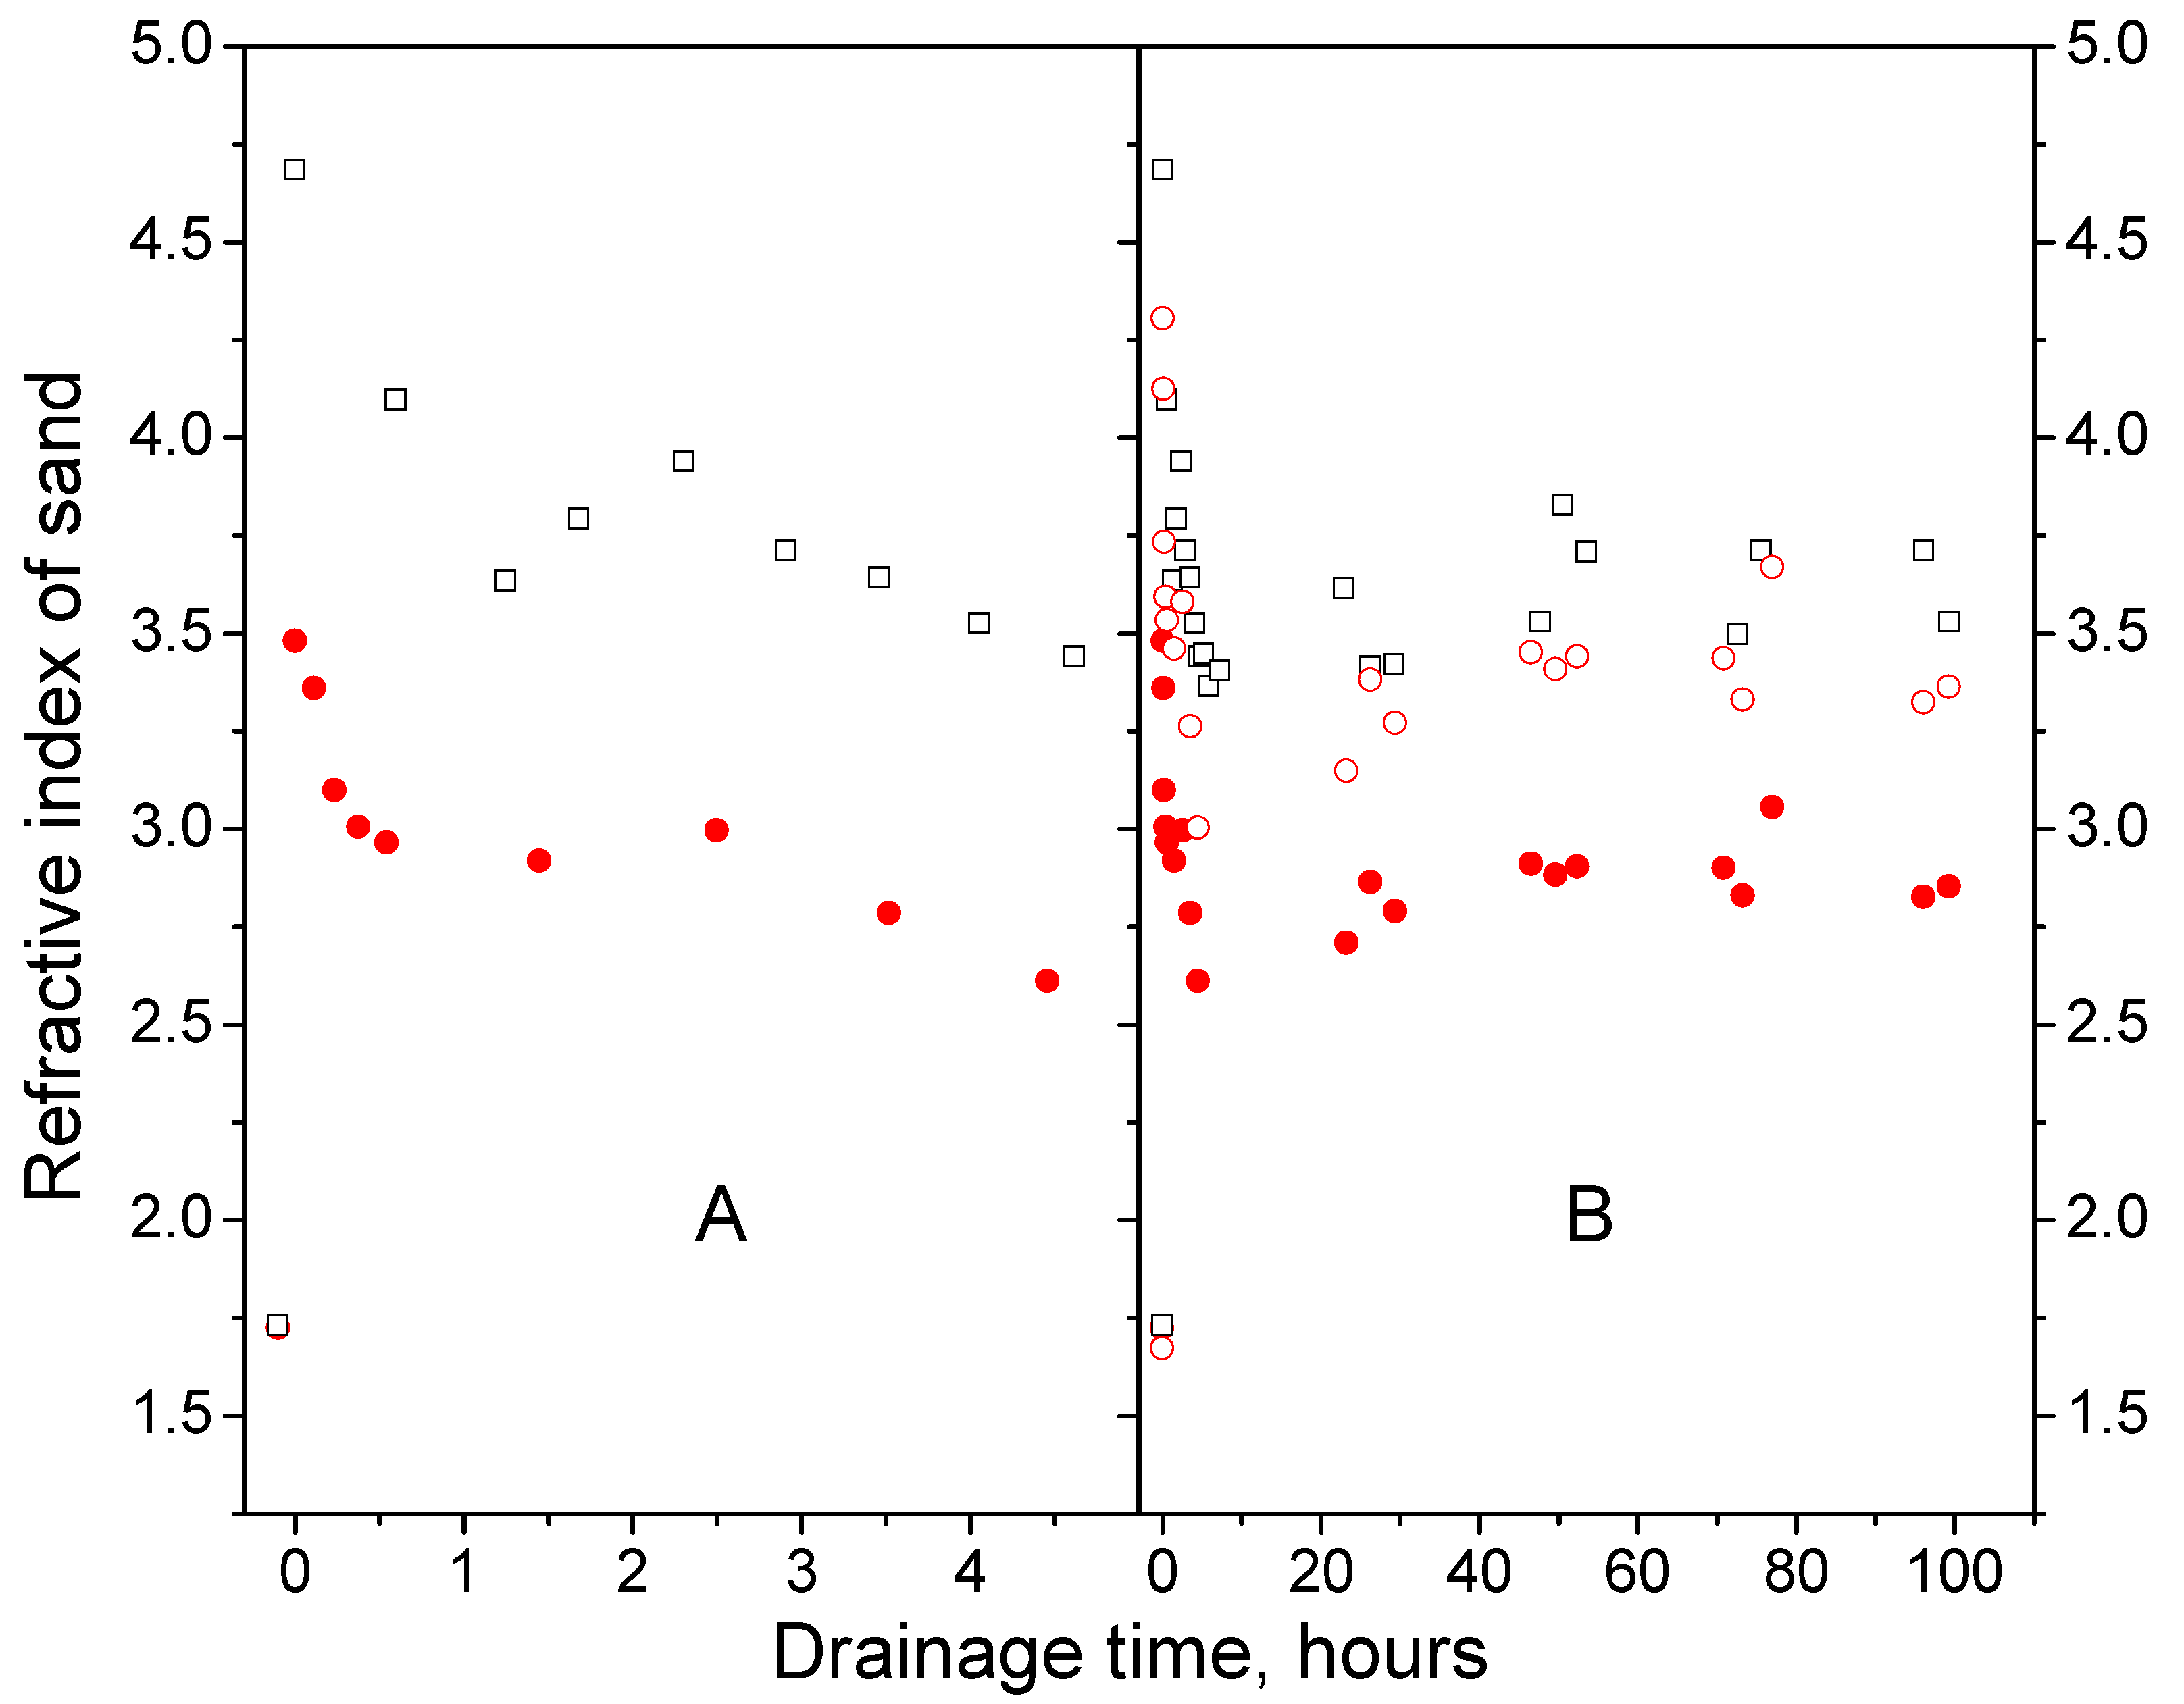
The effect of the volume of drainage water on the refractive index determined by Equation (5) is illustrated in Figure 6, where the results of experiments 2 and 3 are compared.
It can be seen that an increase in the volume of drainage water from 15.1 L to 22.8 L leads to an increase in the refractive index. The average ratio of refractive indices determined from the data in Figure 6 for experiments 3 and 2 is 1.21.
We can determine the theoretical value of the refractive index ( n t ) in the third experiment using Equation (18). We assume that the volumetric water content in experiments 2 and 3 is proportional to the volume of water used for moistening. Then the volumetric water content in the third experiment can be determined from the relation θ 3 = 1.5 θ 2   , where the indices number the experiments. In this case, the theoretical value of the refractive index in the third experiment is determined in the form
n t = n + 0.5 θ ( n l n g ) .
The results of calculation using Equation (19) are shown in Figure 6B. Numerical estimates show that the theoretical values of the refractive indices in the third experiment exceed the values obtained in the second experiment by a factor of 1.19; this compares with the ratio of the experimental values with an accuracy of 2%.
Thus, the developed approach makes it possible to study the effect of the volume of drainage water on the value of the refractive index of sands.
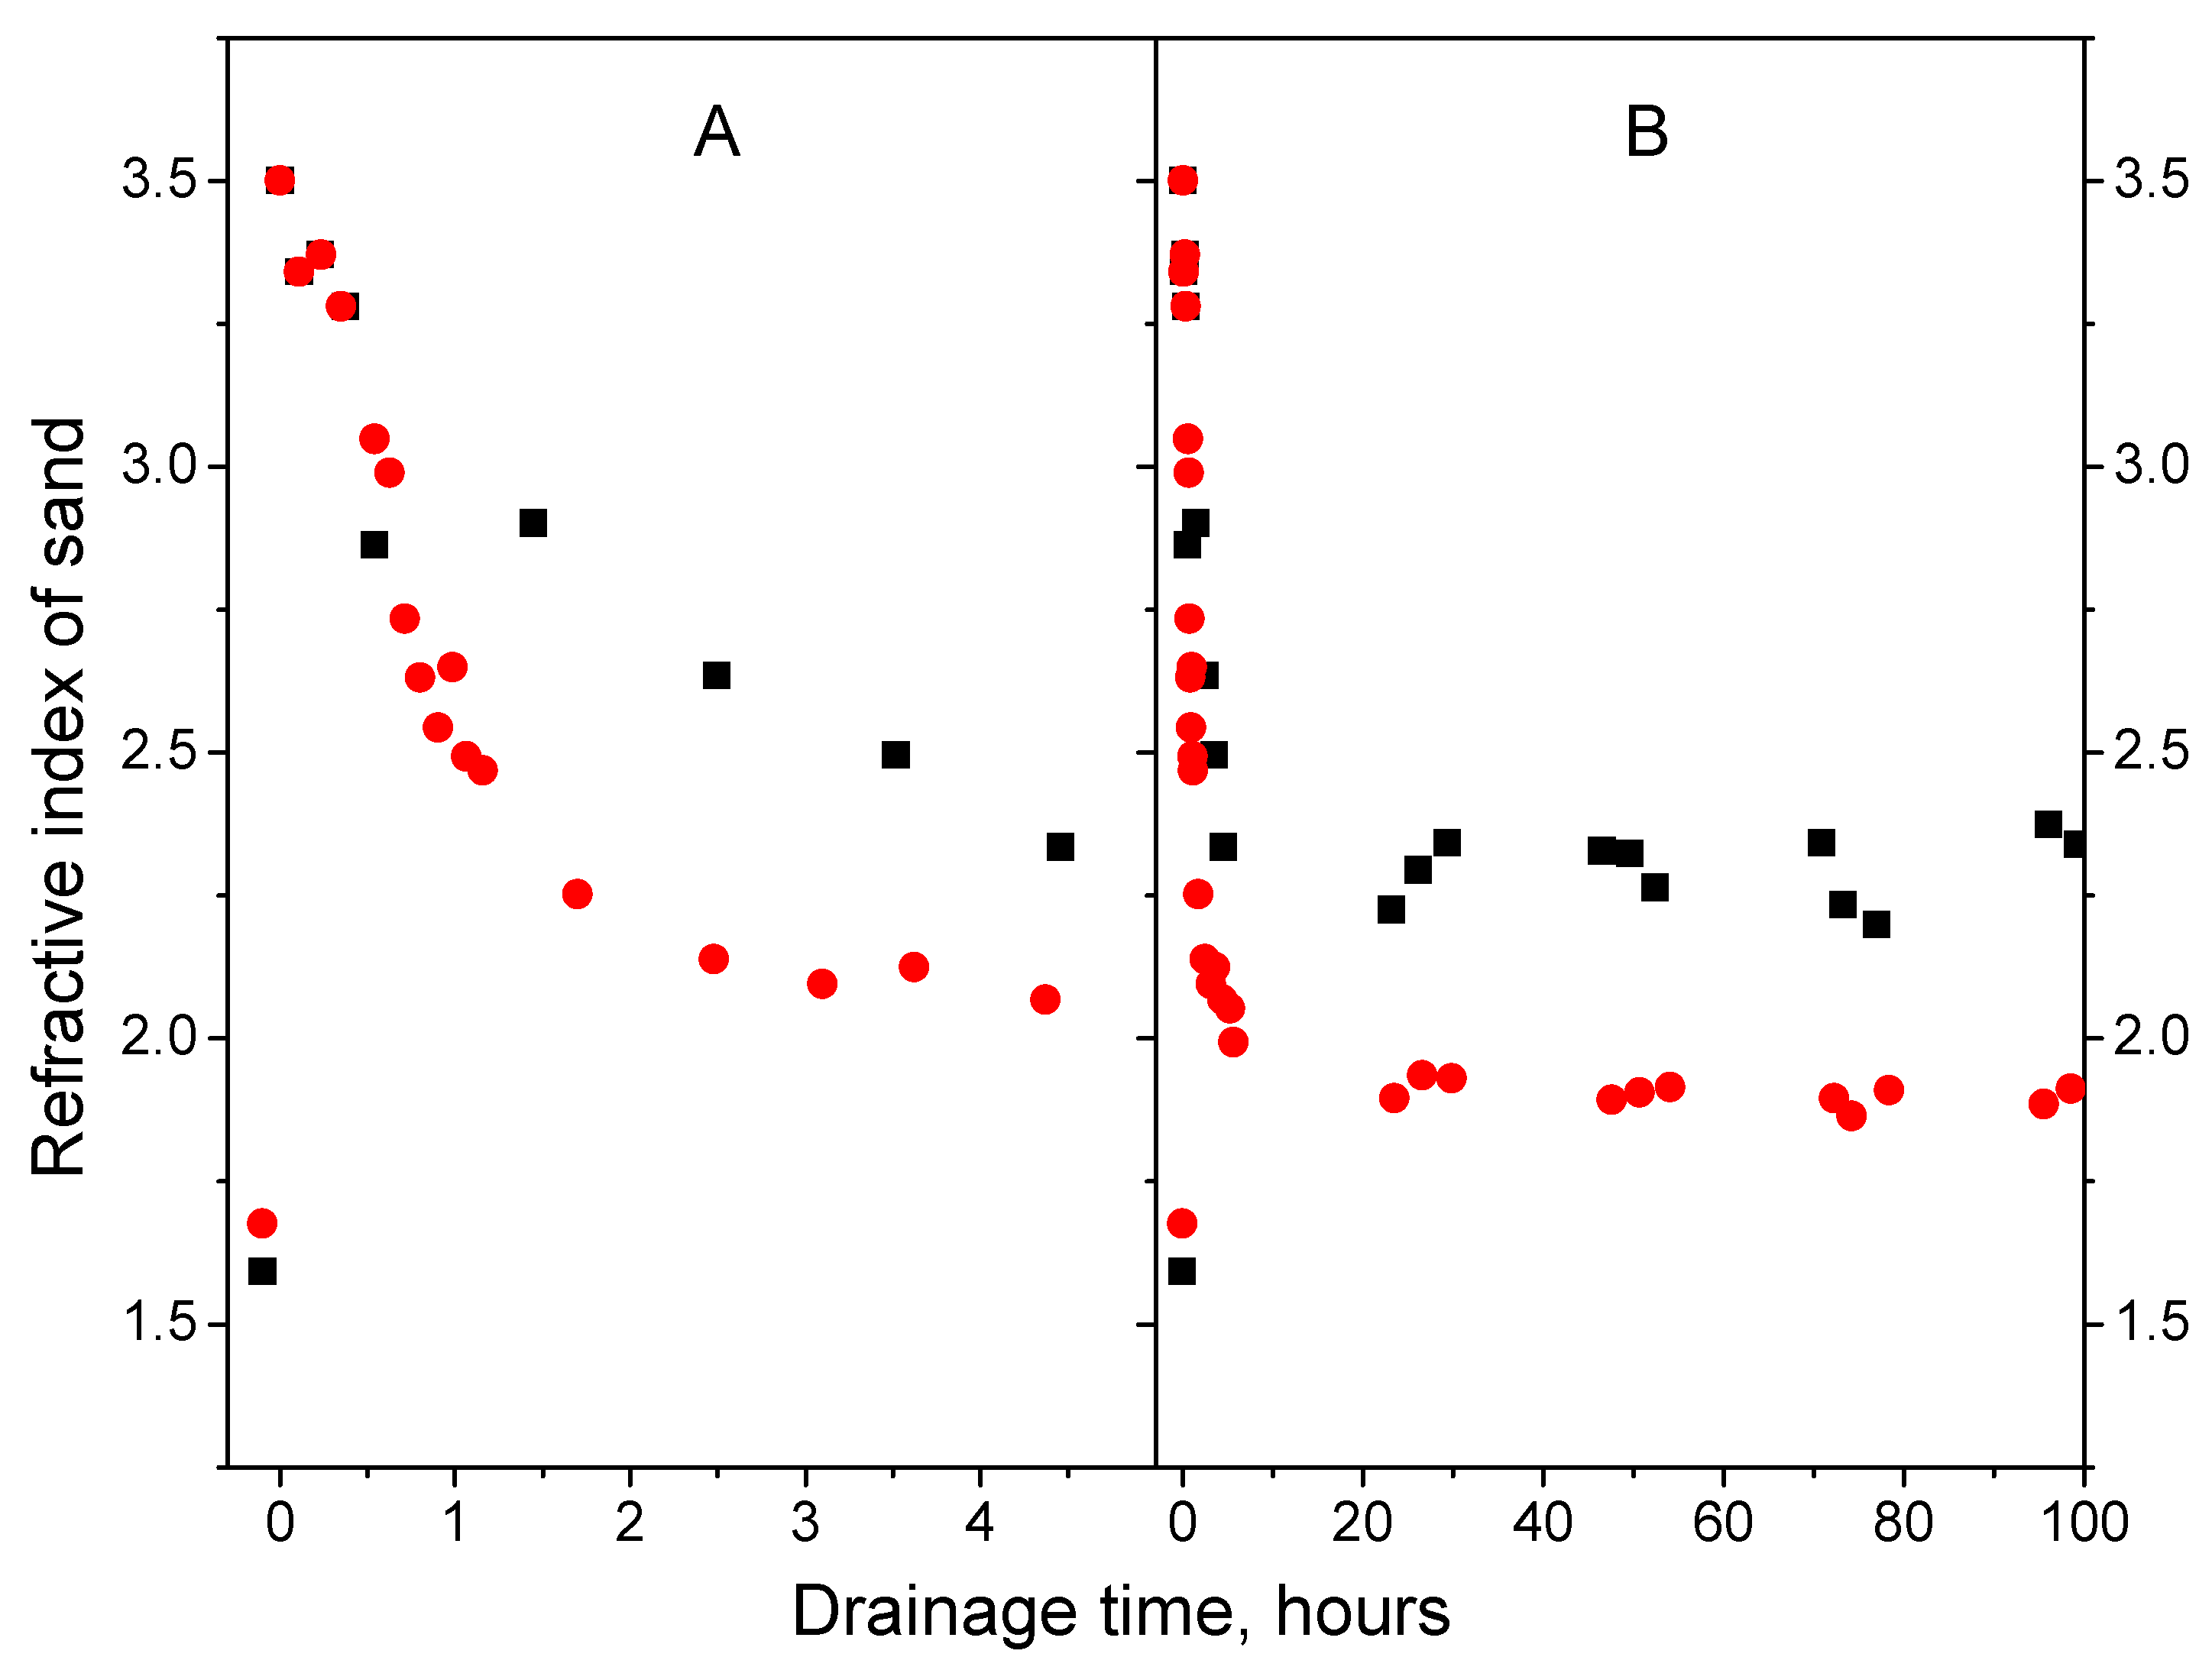
The results of processing the GPR data obtained in experiments 1 and 4 are shown in Figure 7.
Figure 7 shows that, at the initial moments of drainage, the refractive indices in experiments 1 and 4 coincide. As the water is drained in the absence of a waterproof partition in experiment 4, there is a general decrease in the refractive index in the near-surface layer ~0.05 m thick as compared to experiment 1.

5.2. Specific Conductivity

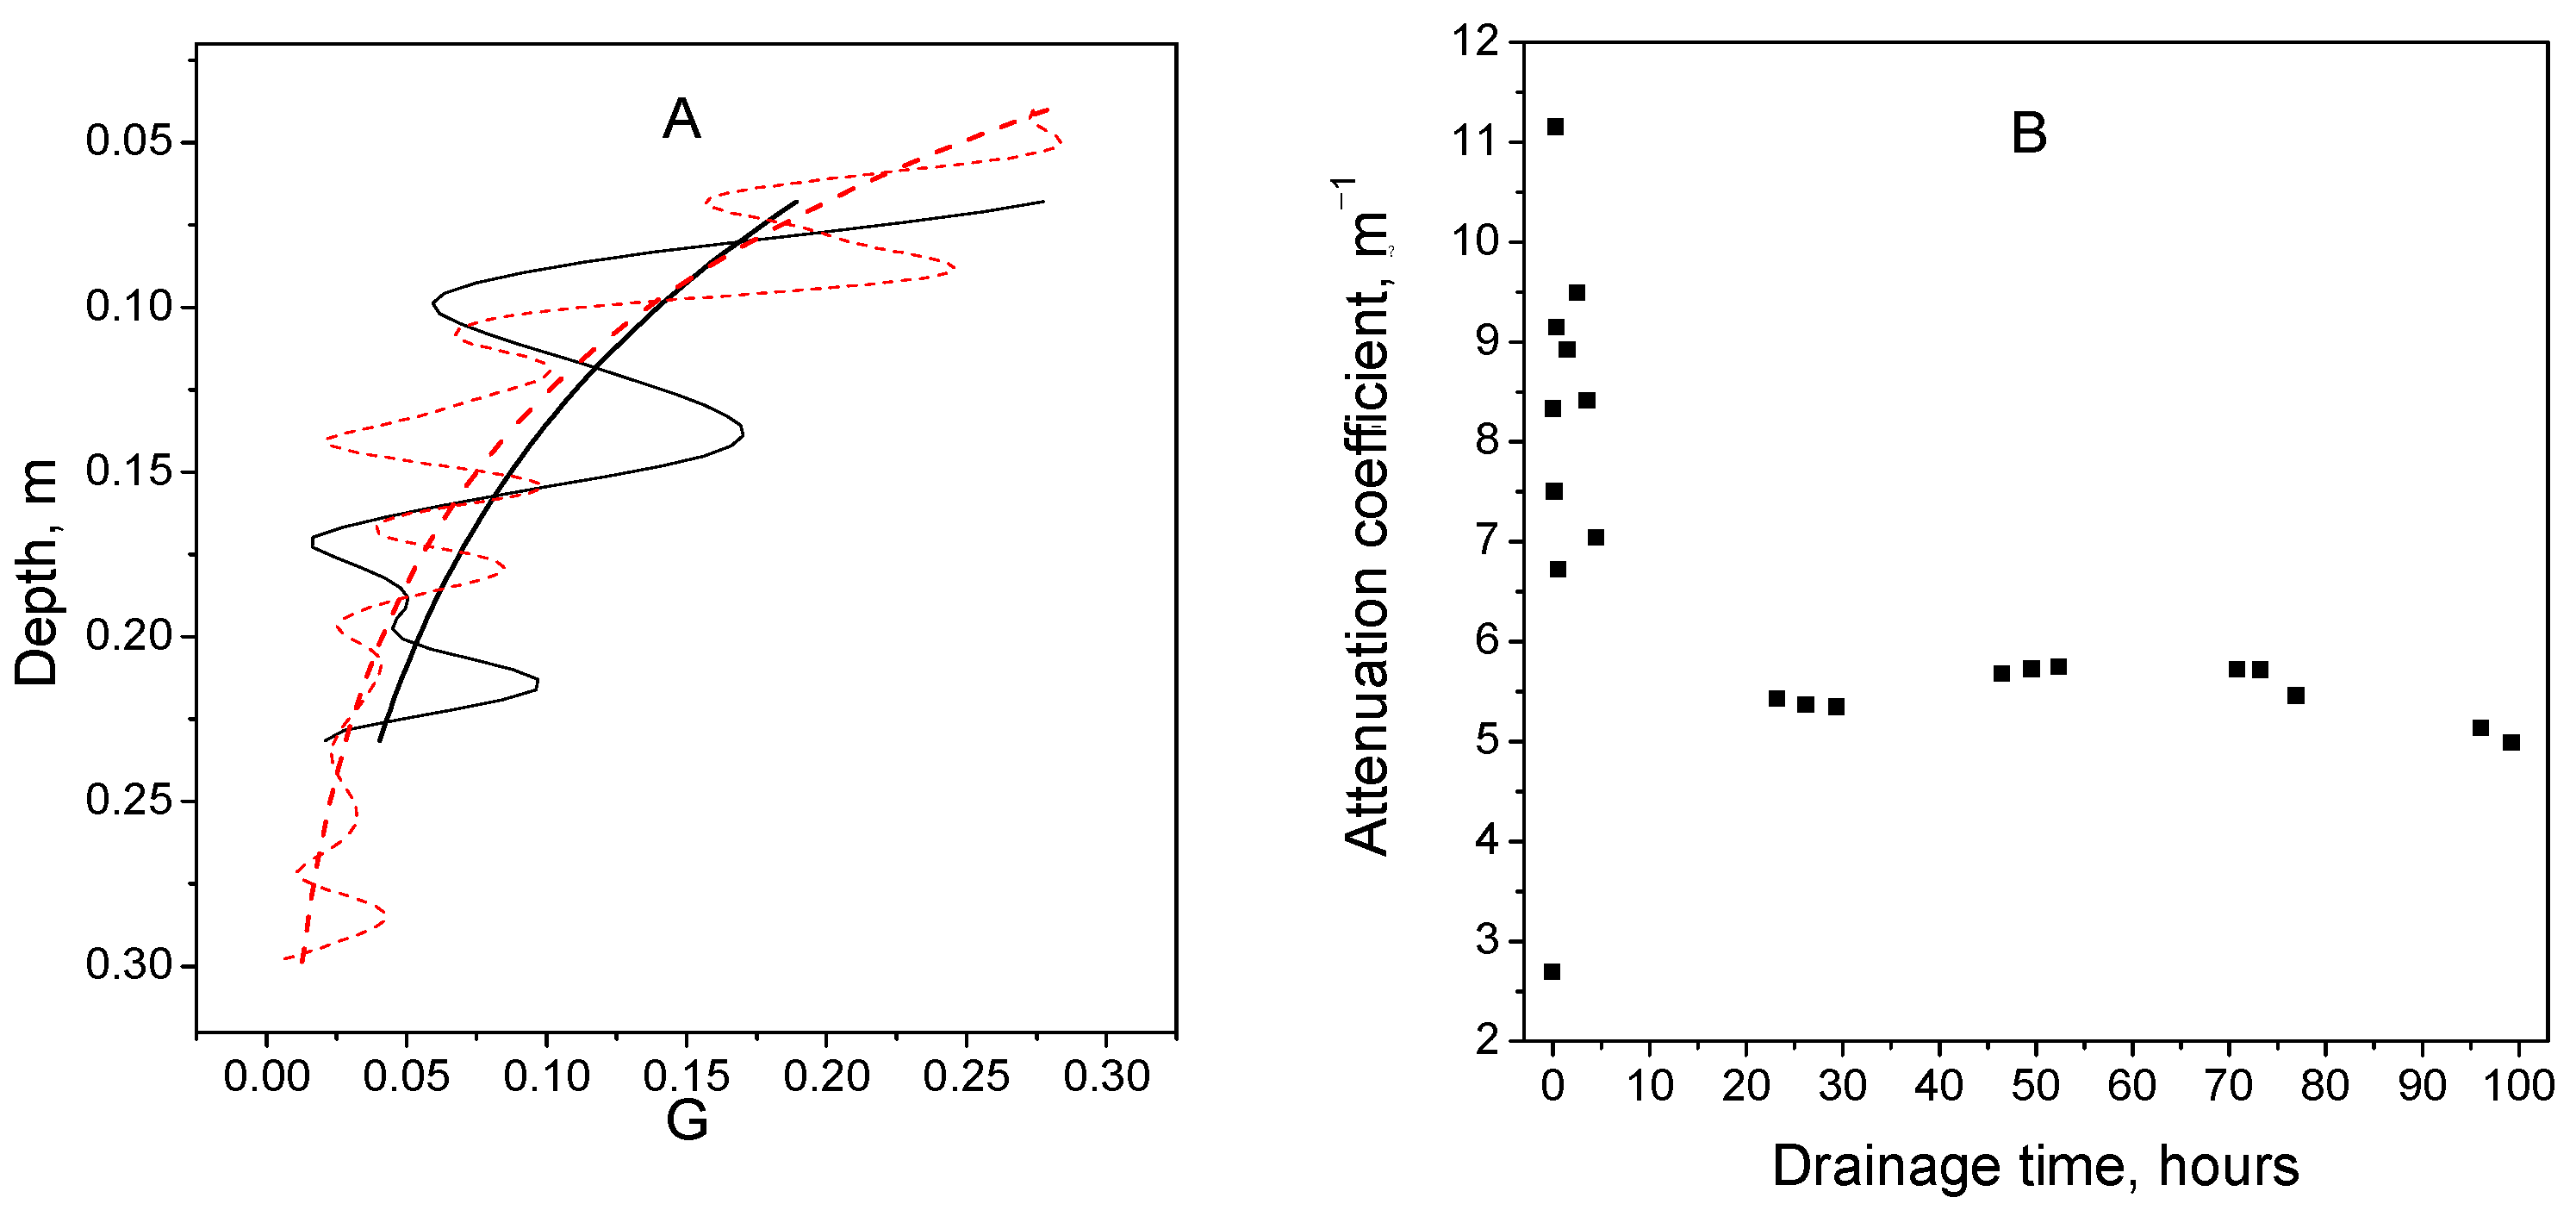
The use of Equation (11) for calculating specific conductivity implies, in addition to determining the refractive index, an independent determination of the attenuation coefficient of electromagnetic radiation in the soil layer. In this work, respective calculations are based on the use of Equations (9) and (10) for calculating the trace envelope and its approximation by an exponential dependence. Figure 8A shows, as an example, the fragments of the GPR trace envelopes related to the soil layer before moistening and immediately after moistening with 15.1 L of technical water (experiment 1). The figure also shows the results of the approximation of these lines by exponential dependences obtained by minimizing the functional Equation (10).
In this work, similar calculations of the attenuation coefficients are performed for all GPR measurements using the developed computer program. The calculation results for experiment 1 are shown in Figure 8B. It can be seen that the attenuation coefficient of wet sand at the initial moment of time exceeds the attenuation coefficient of dry sand by about four times. As the water is drained, the difference decreases to by about two times.
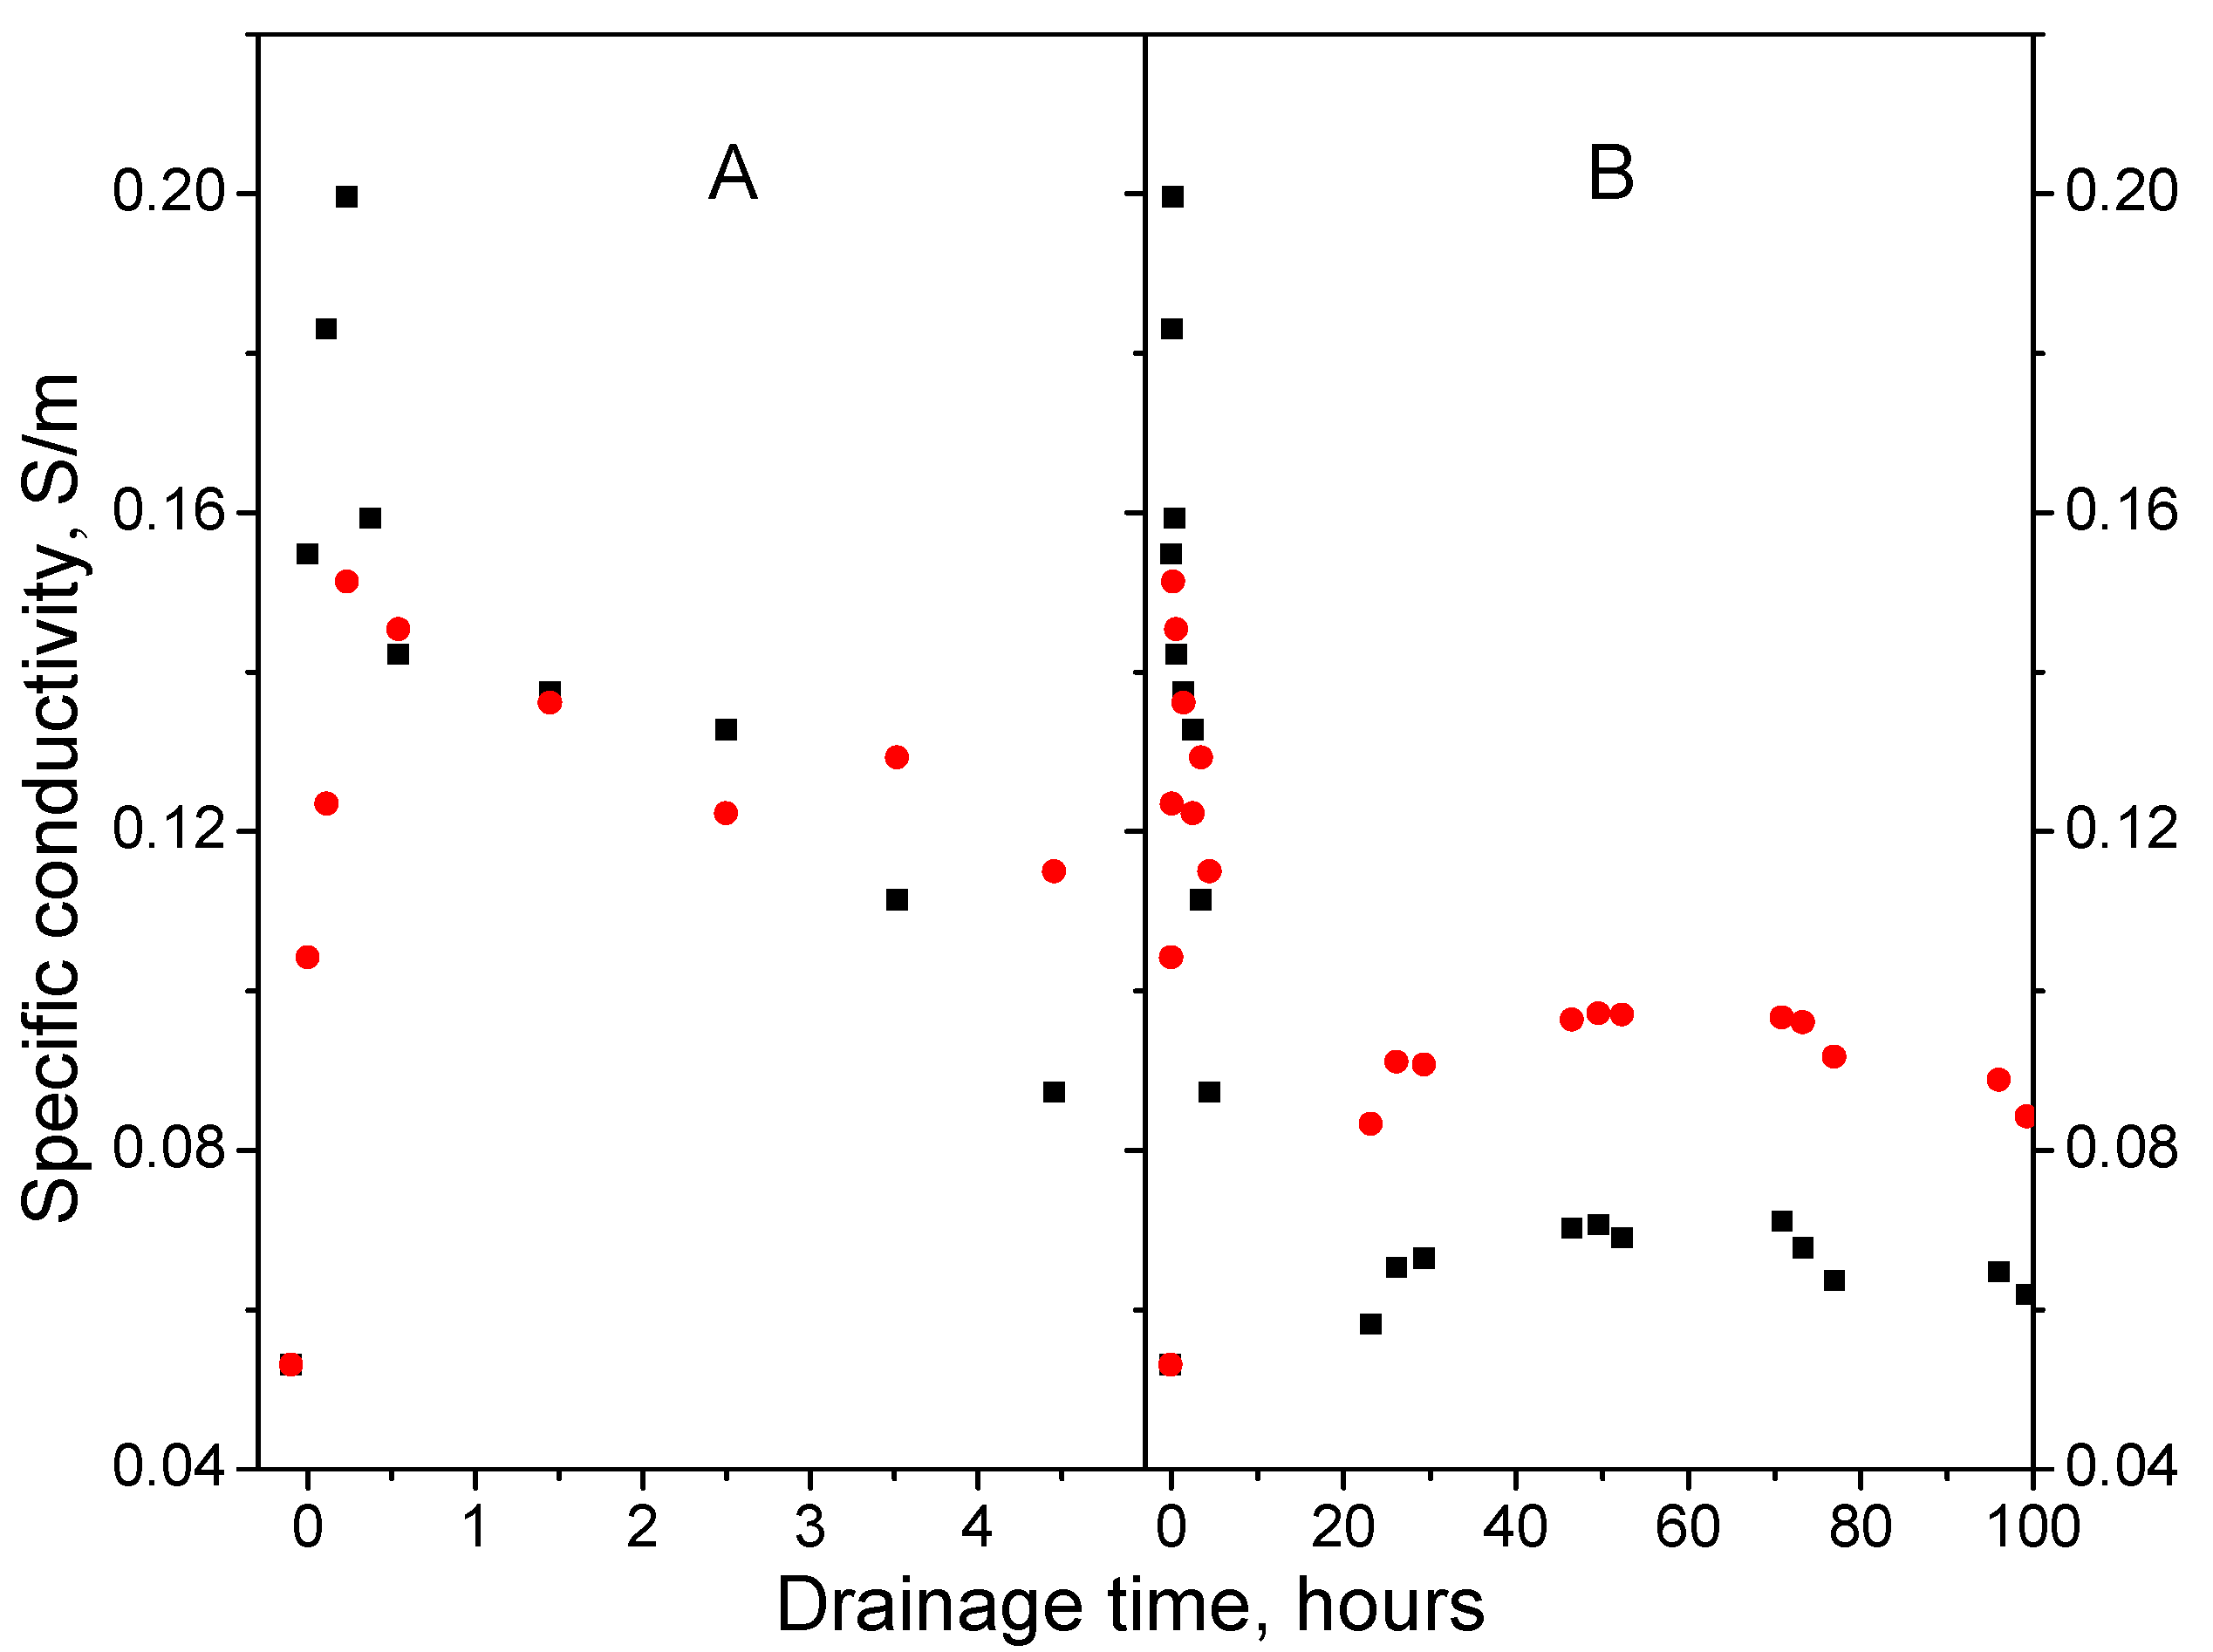
The dependences of specific conductivity on water drainage time in experiment 1 calculated by Equation (11) are shown in Figure 9. When analyzing the calculation results, it should be taken into account that the refractive index of the moistened sand can be calculated for the upper part of the layer (Equation (5)), and on average over the whole layer volume (Equation (8)). In this regard, according to the data in Figure 9, it is possible to estimate the difference in the average conductivity of the layer and the conductivity in the layer’s upper part in the process of water drainage.
One should keep in mind that these results are of a qualitative nature since, despite the difference in the refractive indices calculated by Equation (5) (thin upper layer of sand) and Equation (8) (entire layer of sand), the attenuation coefficient of electromagnetic radiation used in Equation (11) was determined by the fragments of traces related to the entire layer and, therefore, is the average for the entire layer in both cases. The use of the data of experiment 1 averaged over the depth after 50 h after the start of drainage and Equation (1) allow us to estimate the ratio ε ε 0.07 .

5.3. Relative Reflectivity

To assess the sensitivity of the relative reflectivity to the moisture content of the layer, in this study, the reflectivity f ( h k ) was calculated using Equation (14) for all the experiments performed. When executing the numerical procedure, the summation in Equations (12) and (13) was started from the trace point k1 shifted from the upper boundary of the layer inward by the width at half maximum of the signal reflected by the upper boundary. The relative reflectivity f(h) is obtained by summing f ( h k ) under the condition h k h .
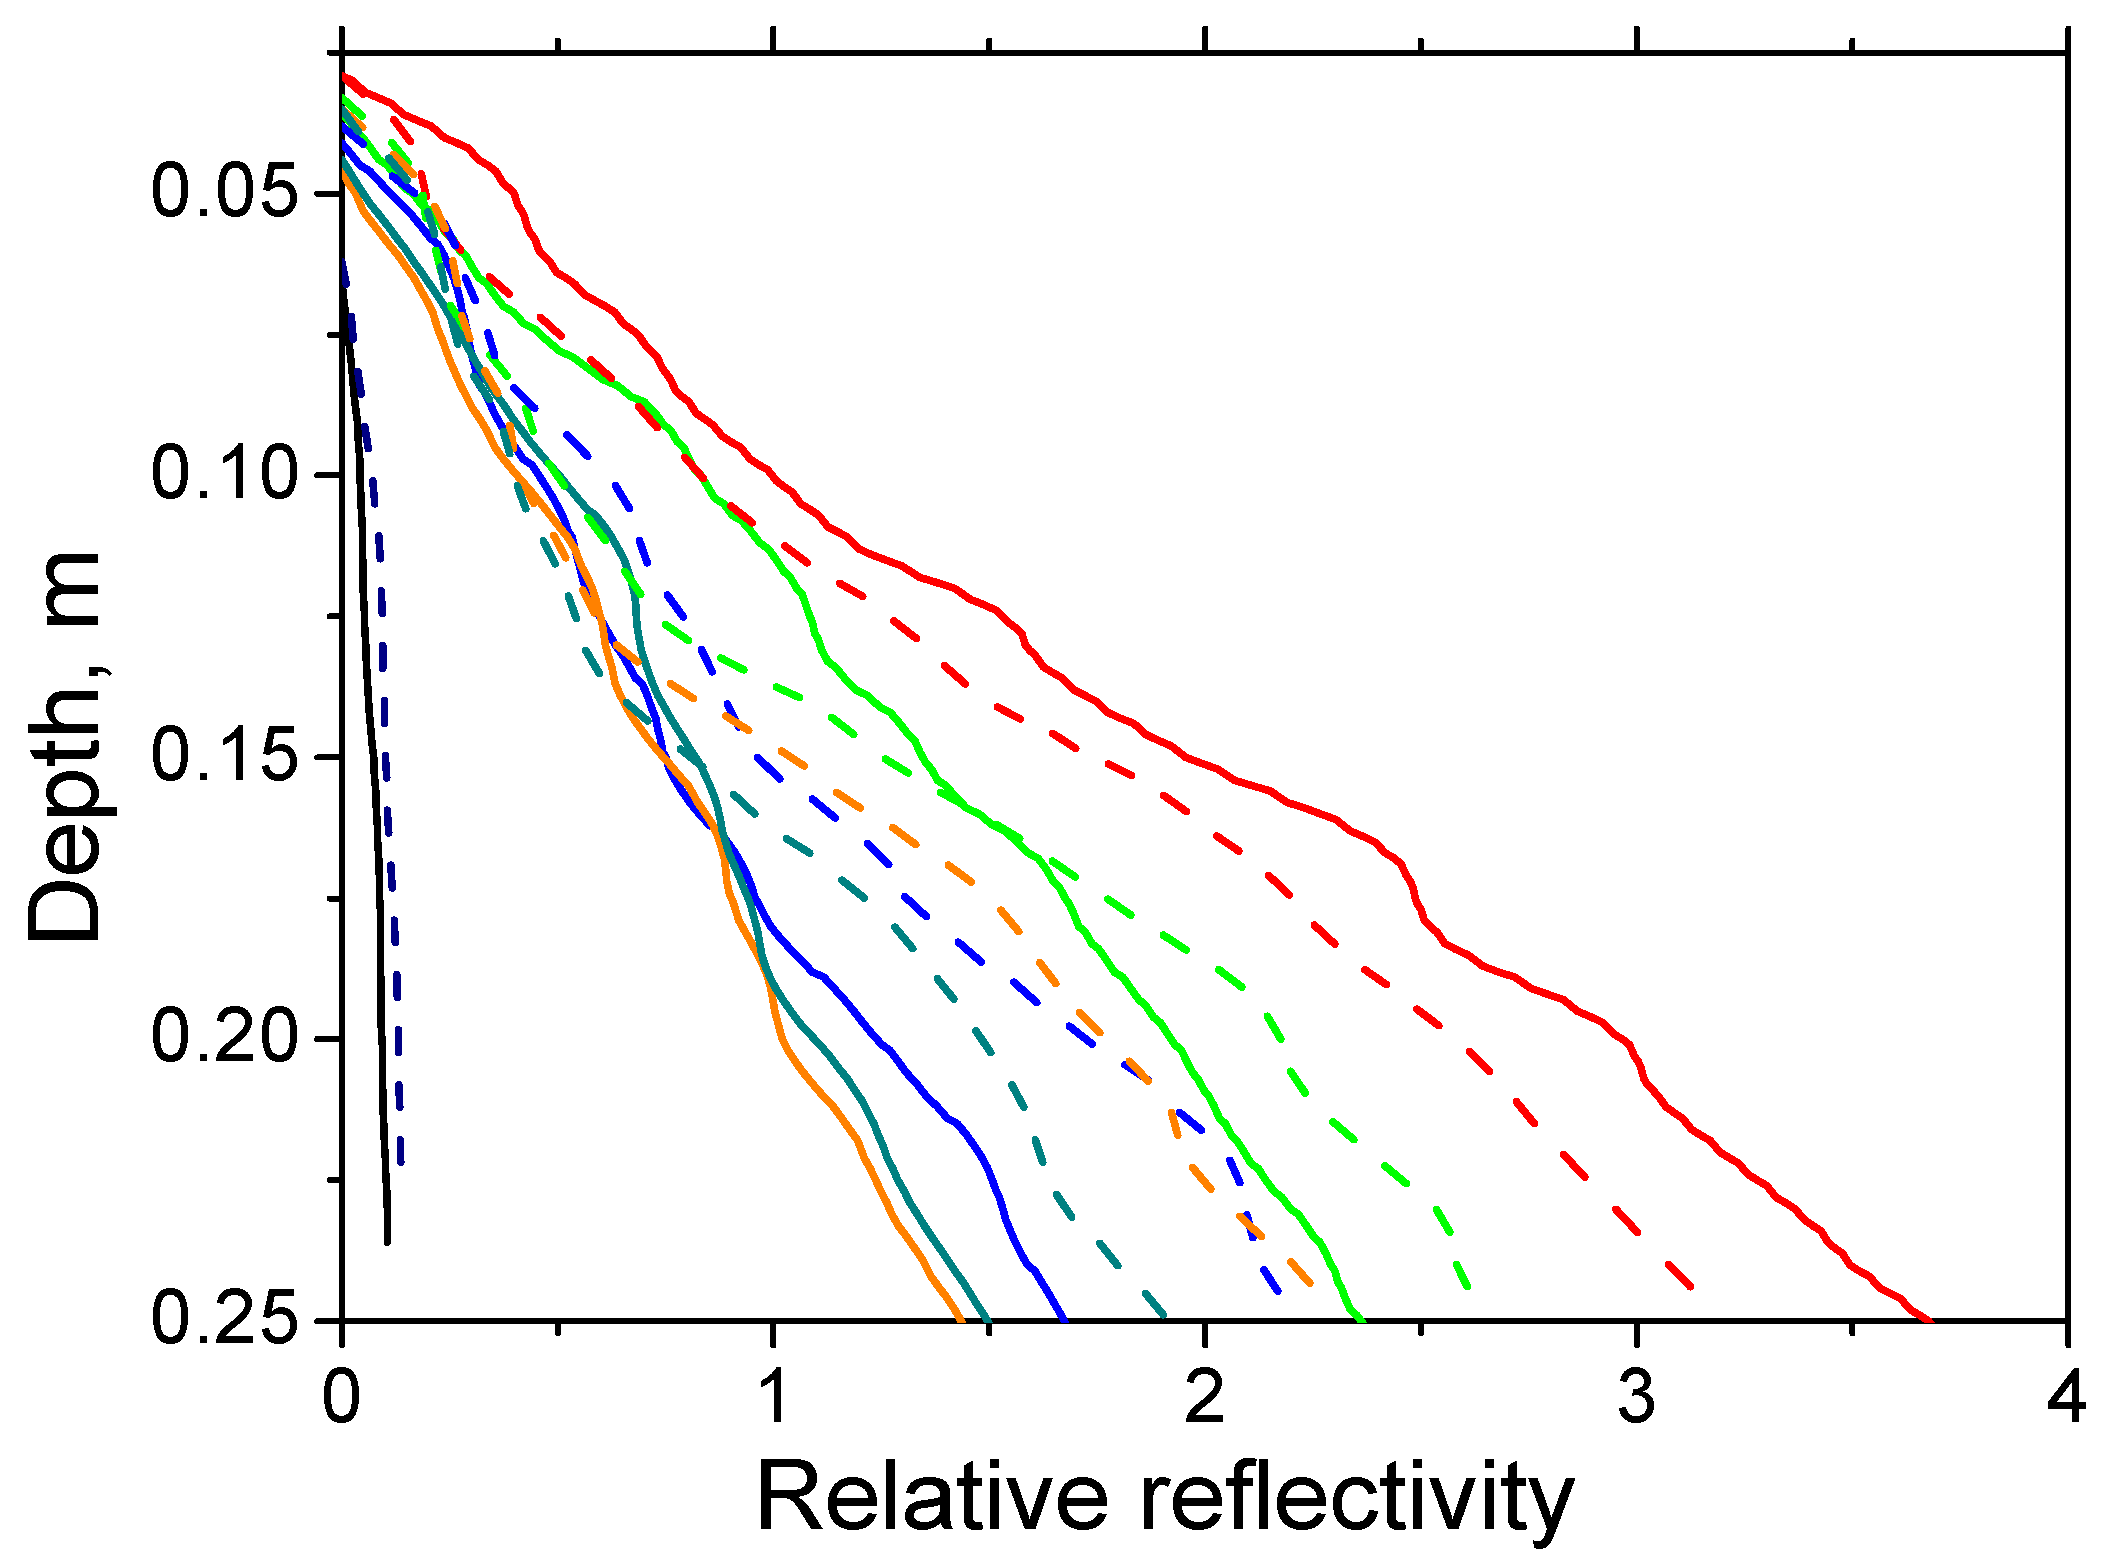
Figure 10 shows the calculated relative reflectivities f for experiments 1 and 2 differing in the samples of sand. Figure 10 shows that, for dry and wet sands, the relative reflectivity is a function of depth close to linear. For dry sands, the plot of this dependence has a very small slope; this means that relative reflectivity of dry sand is practically constant over depth and rather small. This behavior is explained by the fact that, according to Equation (14), the calculated value of f ( h k ) does not depend on the trace amplitude and changes slowly with h k , which reflects the slow attenuation of electromagnetic waves in dry sands. The closeness of the results for samples No. 1 and 2 is explained by the closeness of their electrophysical parameters in the naturally dry state.
Moistening the samples No. 1 and 2 with water in a volume of 15.1 L leads to an increase in the amplitude of the reflected wave in areas with a nonzero gradient of the refractive index (Equation (4)) and related growth of f ( h k ) . This leads to an increase in the slope of the dependences f(h) reaching maximum immediately after the sand layer is moistened (red lines in Figure 10). As the drainage proceeds, the moisture content of the upper layers decreases. This causes a decrease in f(h) and the tangent of the angle to the depth axis. As follows from Table 1, the filtration coefficient for sample No. 1 is greater than that for sample No. 2; this explains the faster decrease in the slope of the graphs of relative reflectivity of sample 1.
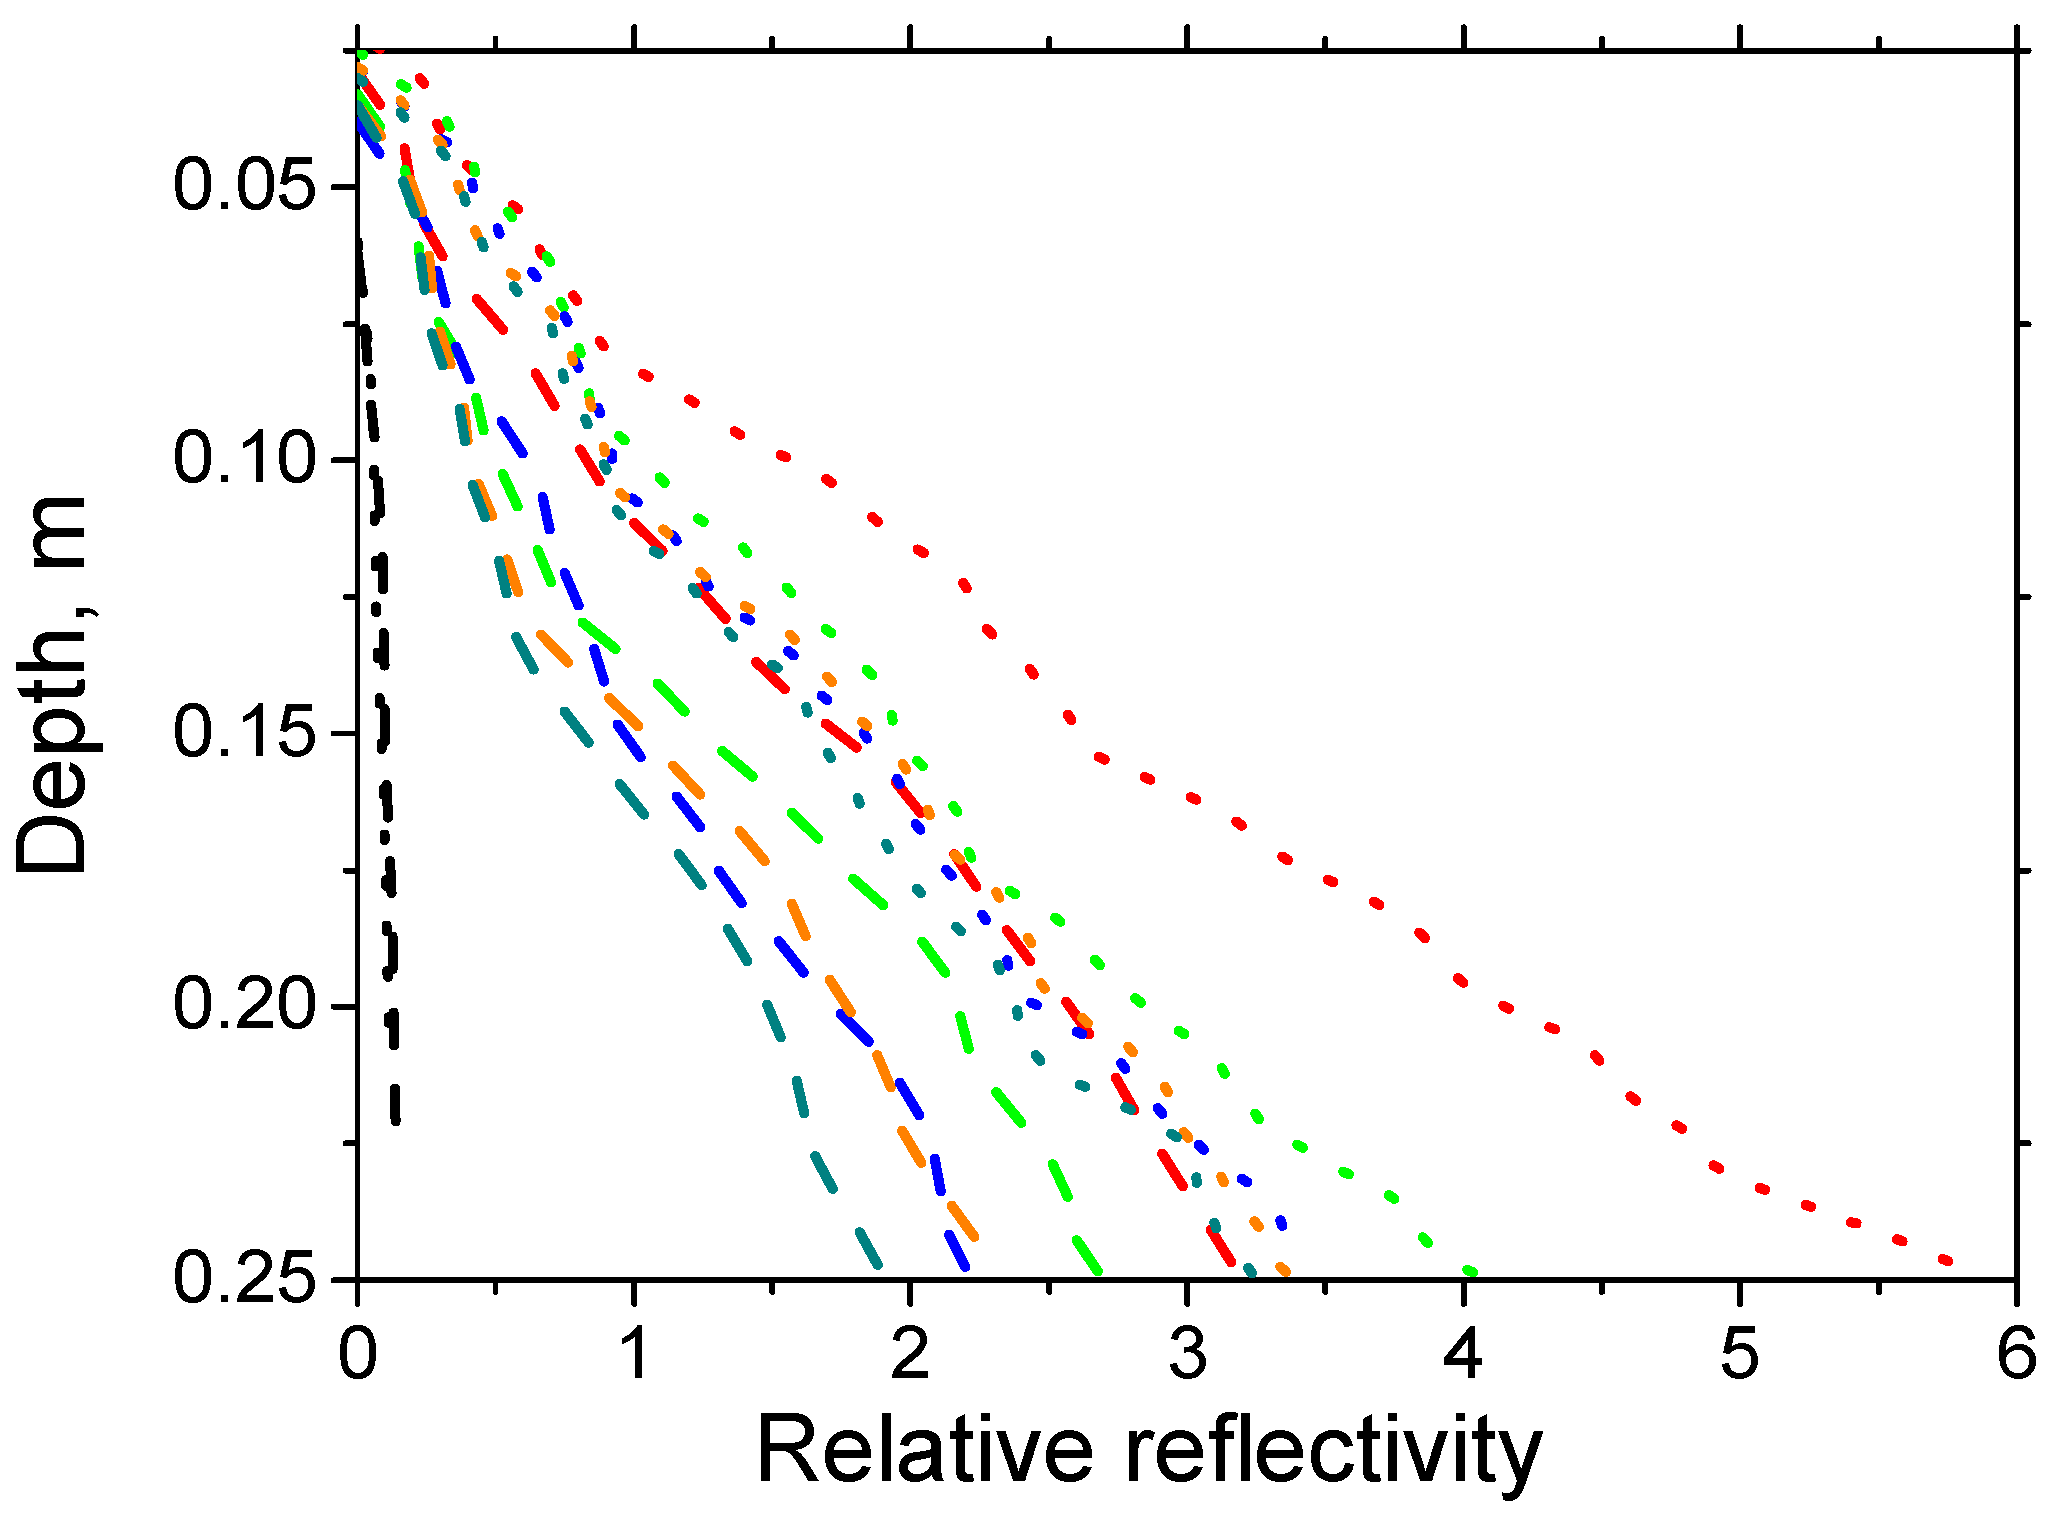
Figure 11 compares relative reflectivities f(h) calculated for experiments 2 and 3, in which the sample of sand No. 2 was moistened with 15.1 and 23.8 L of water, respectively. Figure 11 shows that, for dry and wet sands, the relative reflectivity is a function of depth close to linear, and it has a very small slope, as in the previous case (Figure 10).
An increase in the volume of water used for moistening leads to a noticeable increase in the slope of the graphs of relative reflectivity relatively to the depth axis (red lines). This can be explained by the fact that, with an increase in the volume of moistening water, the gradients of the refractive index and the amplitude of the reflected wave increase (Equation (4)), which causes an increase in f ( h k ) and an increase in the tangent of the slope of the dependences f ( h k ) to the depth axis.
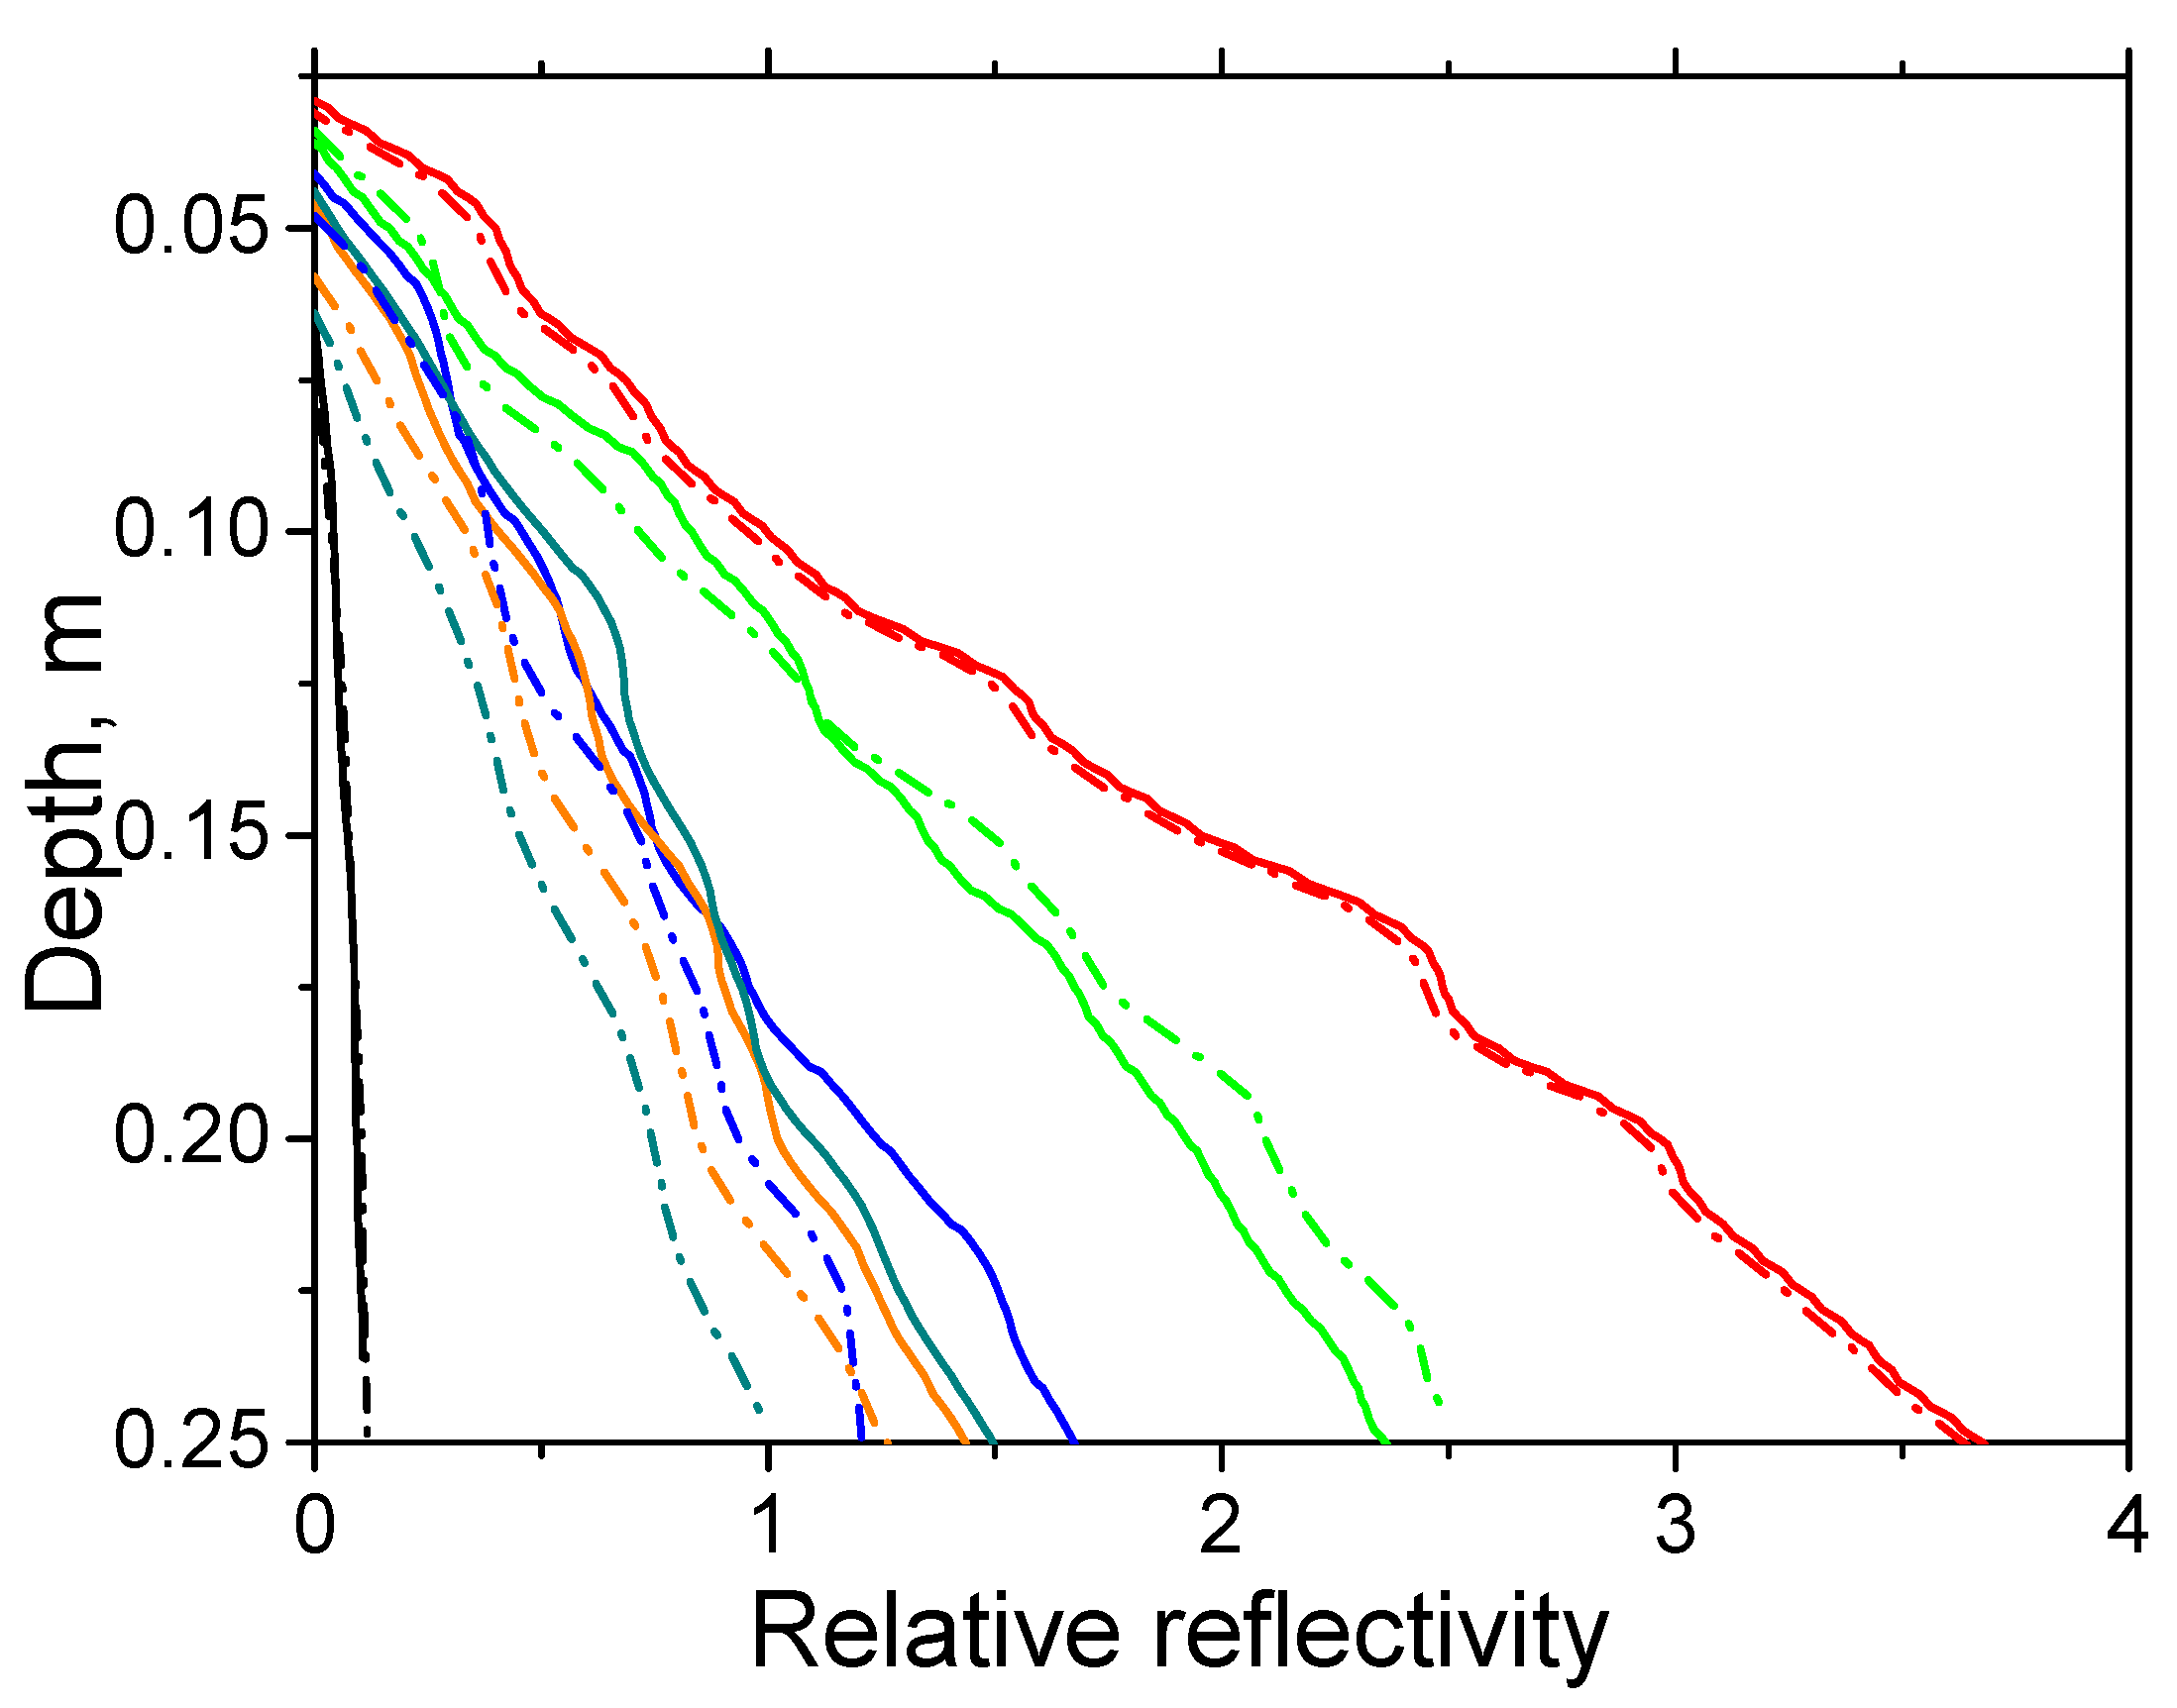
Since the water does not leave the 0.30 m thick layer during drainage, the termination of the drainage process in experiment 3 is characterized by higher values of the slopes of the graphs of relative reflectivity than in experiment 2. The validity of this conclusion is confirmed by the data shown in Figure 12, which compares relative reflectivities determined in experiments 1 and 4 with moistening the layers of sand sample No. 1 0.30 and 0.60 m thick with water in a volume of 15.1 L. It can be seen that, at the beginning of the drainage process, the values of relative reflectivity in these experiments are close. However, as water drainage continues in experiment 4, smaller values of f ( h k ) are achieved, resulting in a smaller tangent of the slope of the graphs f(h) to the depth axis, since the moisture value in this case is less due to partial water drainage below the mark of 0.30 m.
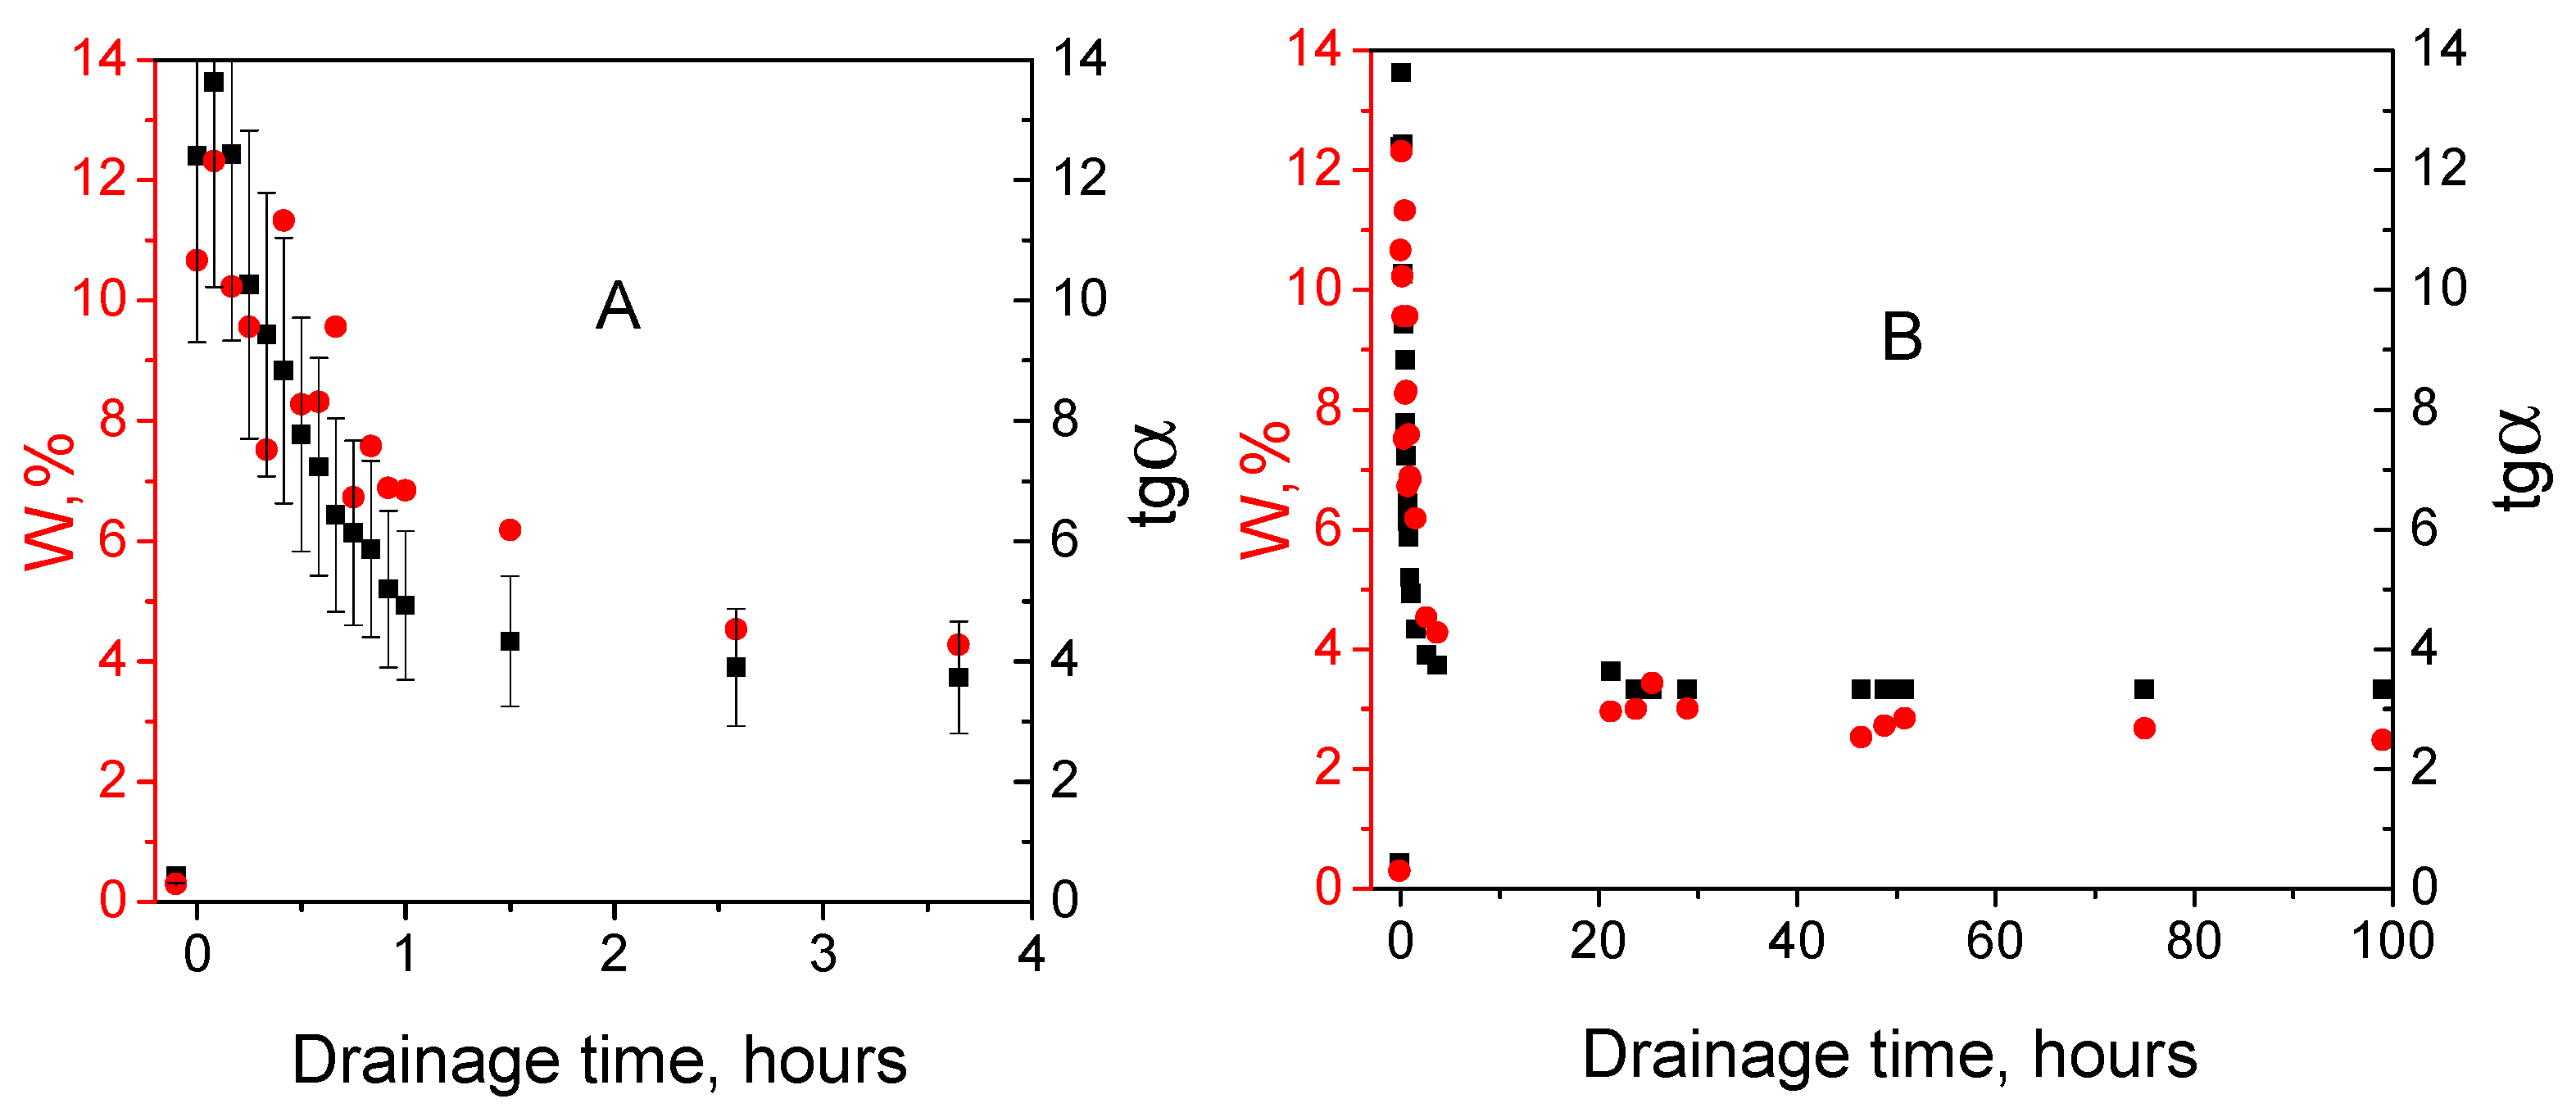
Figure 13 directly compares the measured moisture content of the thin near-surface sand layer with a thickness of 0.05 m (W) and calculated tangent of the slope of the graph f(h) (tanα = Δ f Δ h ) determined in experiment 4. Figure 13 shows that tanα first decreases rapidly; however, as the drainage time increases, it stabilizes. To analyze the results obtained, we assume that the dependence of relative reflectivity f on depth h is approximated with sufficient accuracy by a linear law during the first hour of drainage:
f ( h ) = f 0 + tan α · h ,
where f 0 is the value of the relative reflectivity at the upper boundary of the layer, and α is the angle of slope of the reflectivity graph to the depth axis.
Note that relative reflectivity is proportional to the amplitude of the reflected wave. From Equations (4) and (16), it is possible to obtain the dependence of the change in amplitude in time on the volumetric moisture content of the sample:
E t = 2 E 0 ( n + 1 ) 2 n t = 2 E 0 ( n + 1 ) 2 ( n l n g ) θ t .
Then, the change in tanα in time is determined by the relation
tan α t = 1 h f ( h ) t ~ 2 E 0 h ( n + 1 ) 2 ( n l n g ) θ t ,
or, taking into account Equation (18),
tan α t ~ 1 ( 1 w ) 2 w t .
Since in the case under consideration, during the first hour of water drainage, the moisture content of the sand changed by 10% and its average value was 9%, the change in the slope tangent with time can be estimated, according to Equation (23), as 11%. A rigorous calculation of the Pearson correlation coefficient leads to a value of 0.916. According to the Chaddock scale, such a value characterizes the correlation as ‘very high (strong)’. In this case, the average value of the relative error in the values of moisture and the tangent of the angle of inclination is 20%.
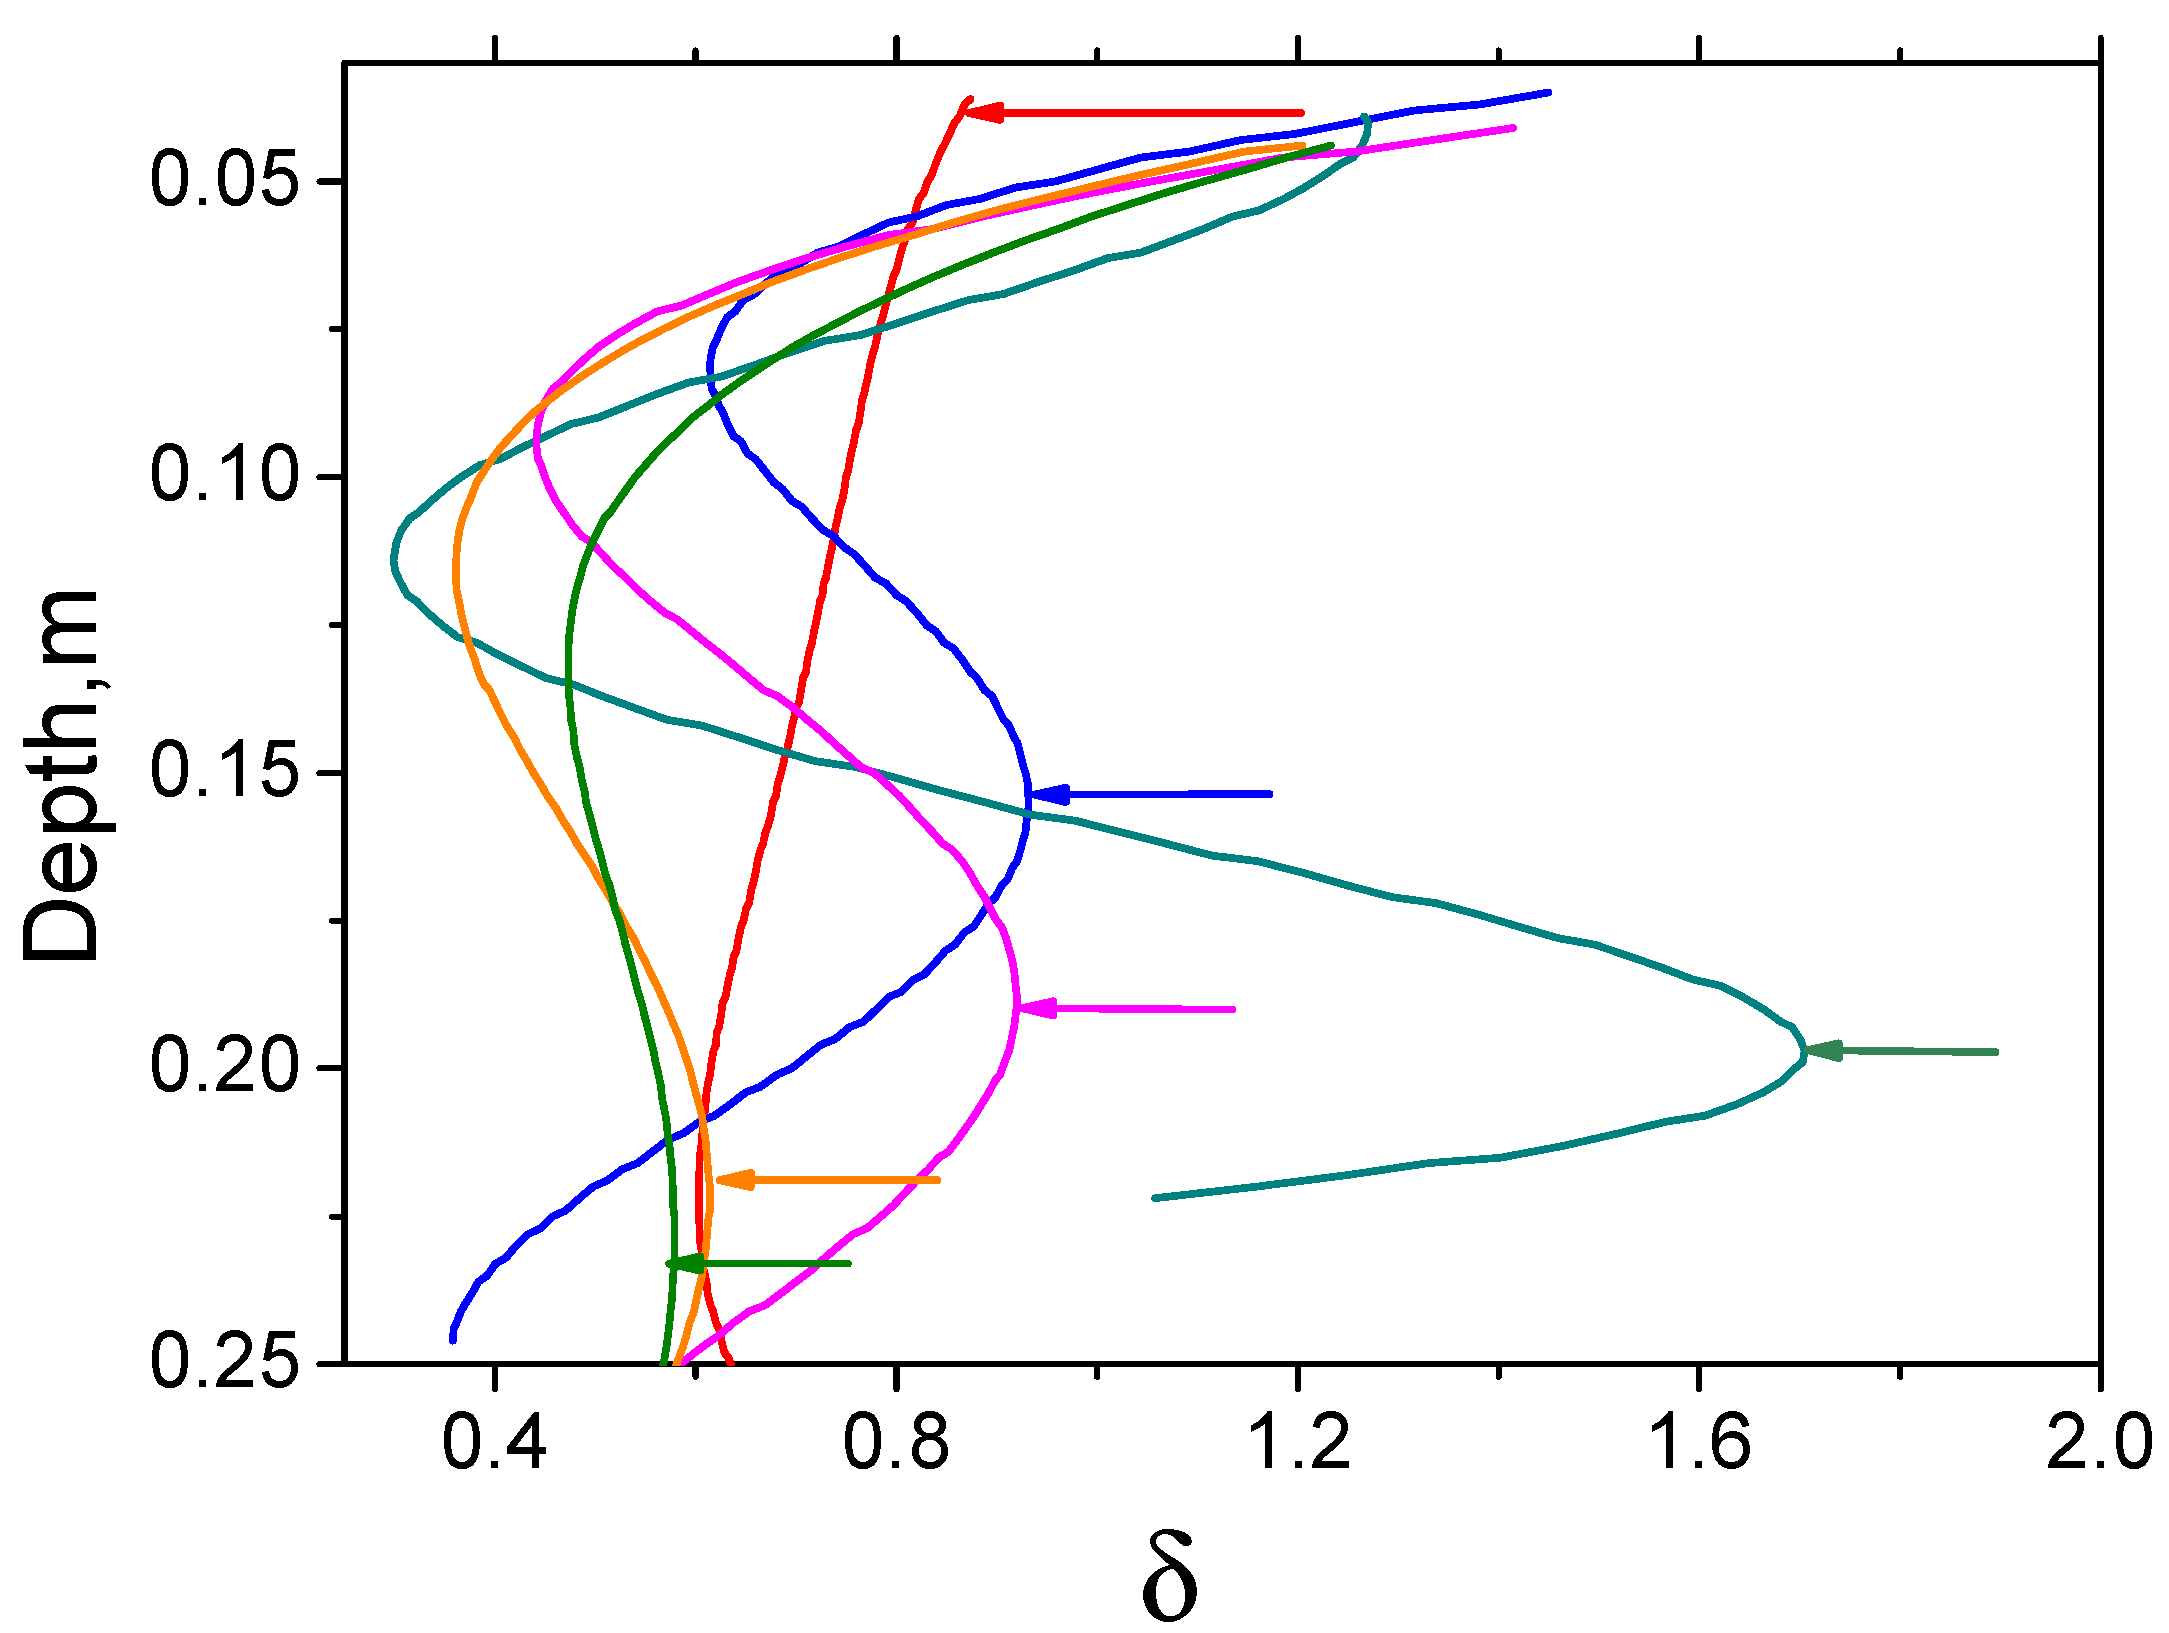
The process of water draining from top to bottom can be characterized by a time-dependent distribution of moisture in depth. The boundaries of areas with different moisture are the sources of reflected electromagnetic waves. In this regard, the relative reflectivity should carry information about such areas. To analyze this mechanism, we abandon the linear approximation (Equation (20)) and calculate the derivative of the relative reflectivity (Equation (15)). In this study, using software methods, the derivative calculation procedure is supplemented by the approximation of the calculation results by a fifth-degree polynomial. Figure 14 shows the graphs of the fragments of polynomials approximating the dependences =   f h .
Figure 14 shows that the derivative of the relative reflectivity with respect to depth immediately after soaking has a local maximum at a depth of 0.025 m and slowly decreases with increasing depth. This is explained by the fact that the GPR studies were carried out immediately after sand moistening, when water displaces the gas fraction to a depth of 0.025 m. After 0.1 h of drainage, at a depth of 0.15 m, a local maximum is formed, associated with the lower boundary of the moistened sand and the resulting anomalous reflection of electromagnetic waves due to the refractive index gradient (Equation (4)). During the first hour, the local maximum shifts to depths of up to 0.2 m. With increasing drainage time, this process continues, but at a noticeably slower rate, since the mass of draining water decreases, and the gas fraction near the bottom of the sand layer is displaced.
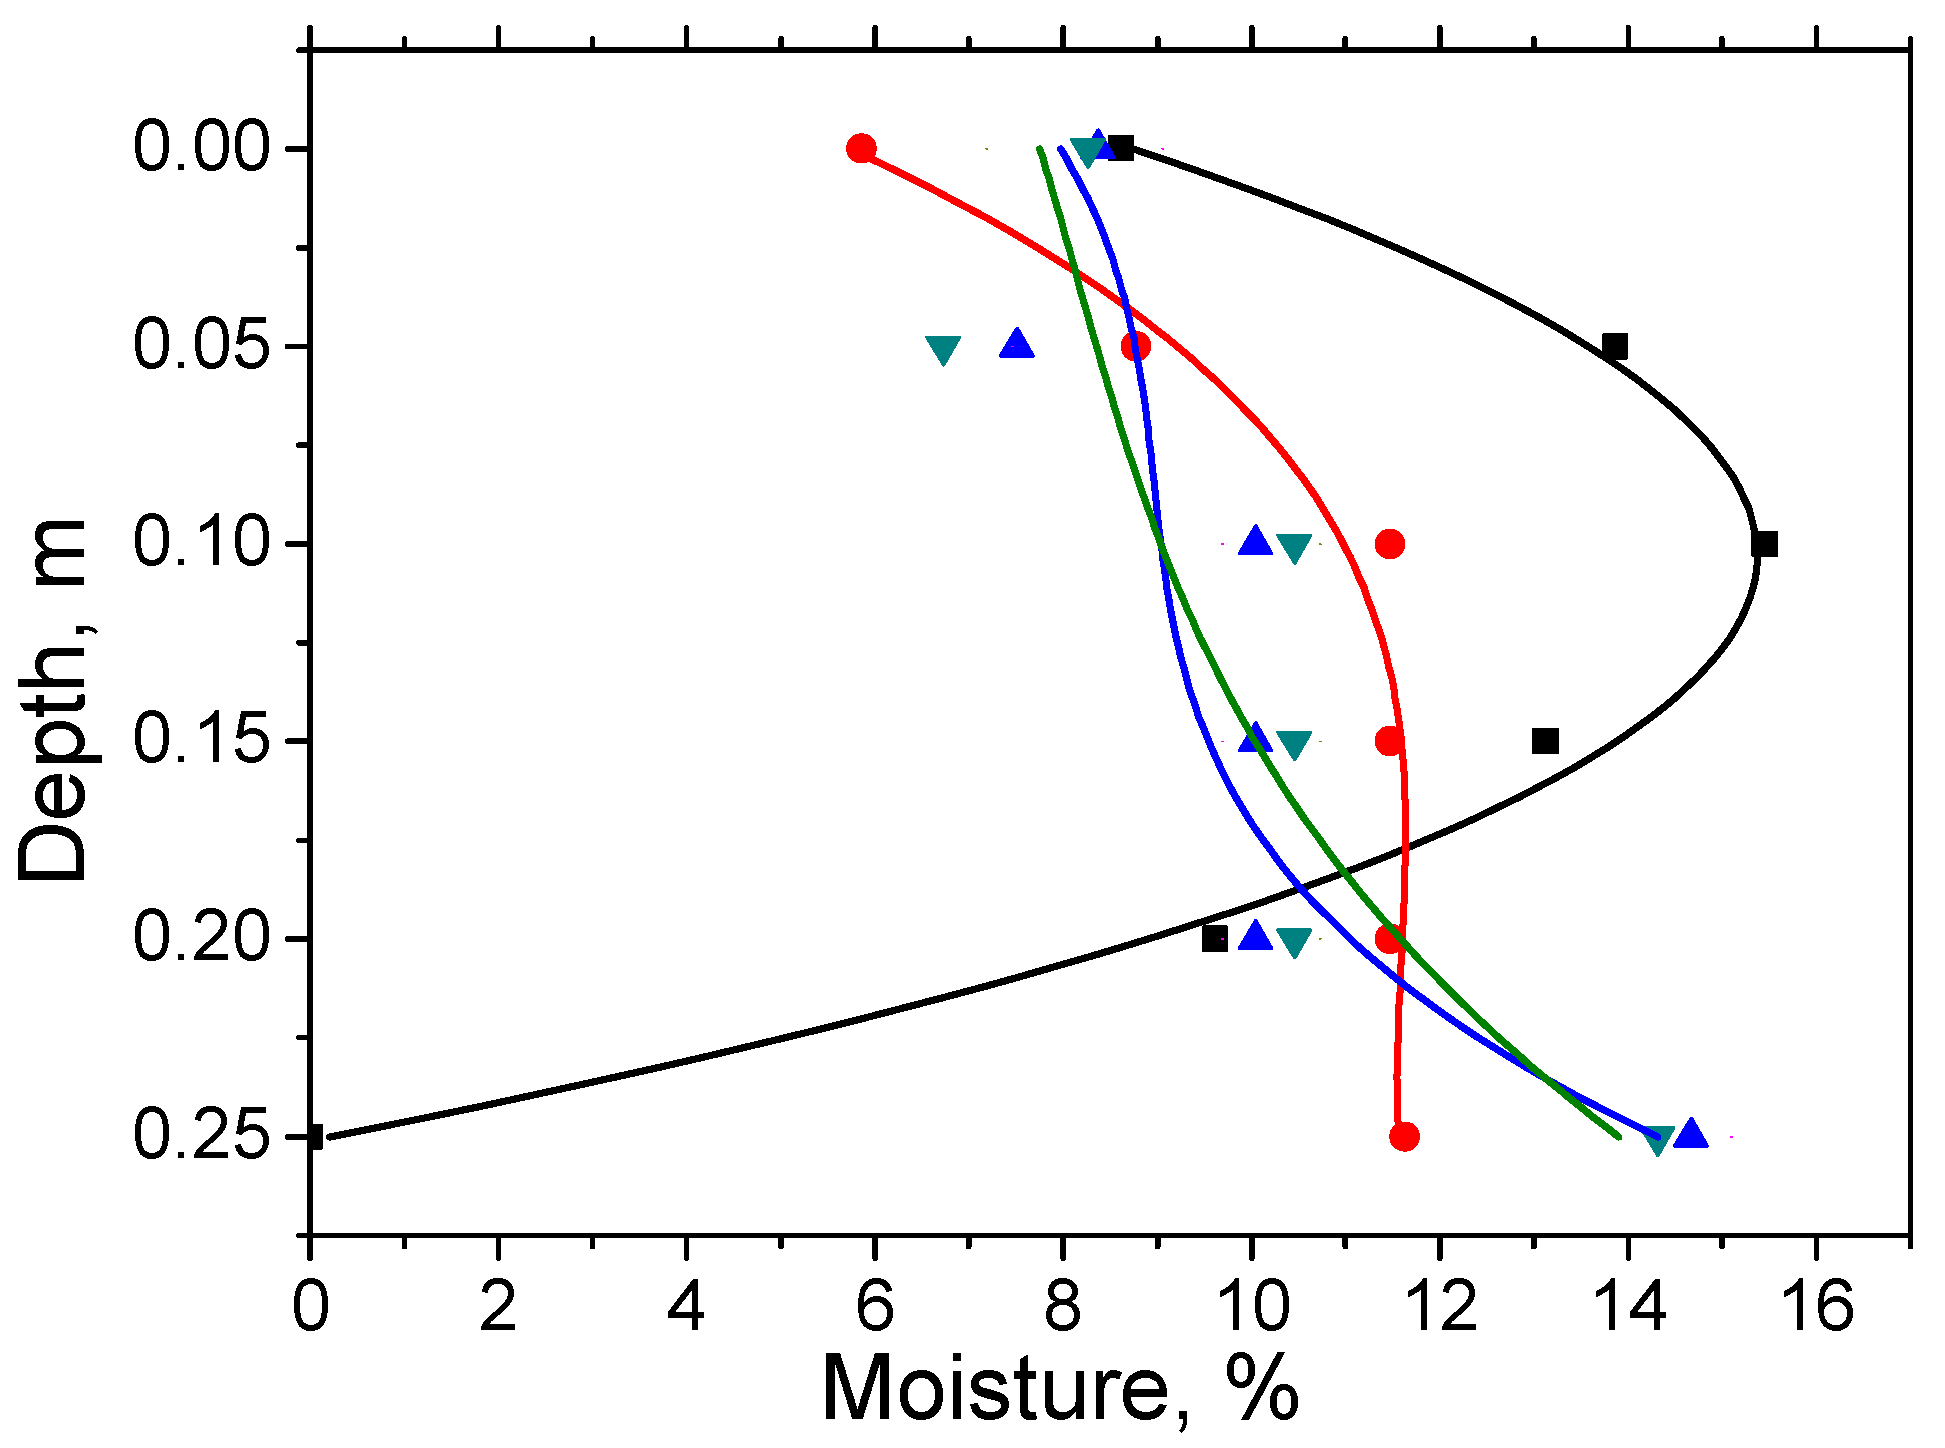
To search for areas with maximum moisture during experiment 1 at depths of 0.05 m, 0.1 m, 0.15 m, 0.2 m, and 0.25 m, the moisture was determined by non-GPR direct methods after performing GPR experiments. Directly measured moisture values were approximated by third-degree polynomials. The results of some measurements and their approximation are shown in Figure 15. The depths with the maximum moisture content were determined as the maxima of the approximating curves. Figure 15 shows that, after moistening and GPR measurements, the maximum moisture is fixed at a depth of 0.1 m, while the line corresponding in time to drainage in Figure 14 has a local extremum at a depth of 0.025 m. This apparent discrepancy is due to the fact that sand sampling for the direct moisture measurement was carried out a few minutes after the GPR measurements. As time increases, the region of maximum moisture shifts to greater depths, and, after a while, drainage stops. The profile of the corresponding stationary lines (Figure 15, blue and green) during vertical gravity drainage is determined by surface tension forces and sand properties. At the same time, the moistening of the sand in the upper part of the layer is preserved. The respective moisture content is 6–8% and is explained by the compensation of gravity by surface tension with incomplete replacement of the gas fraction.
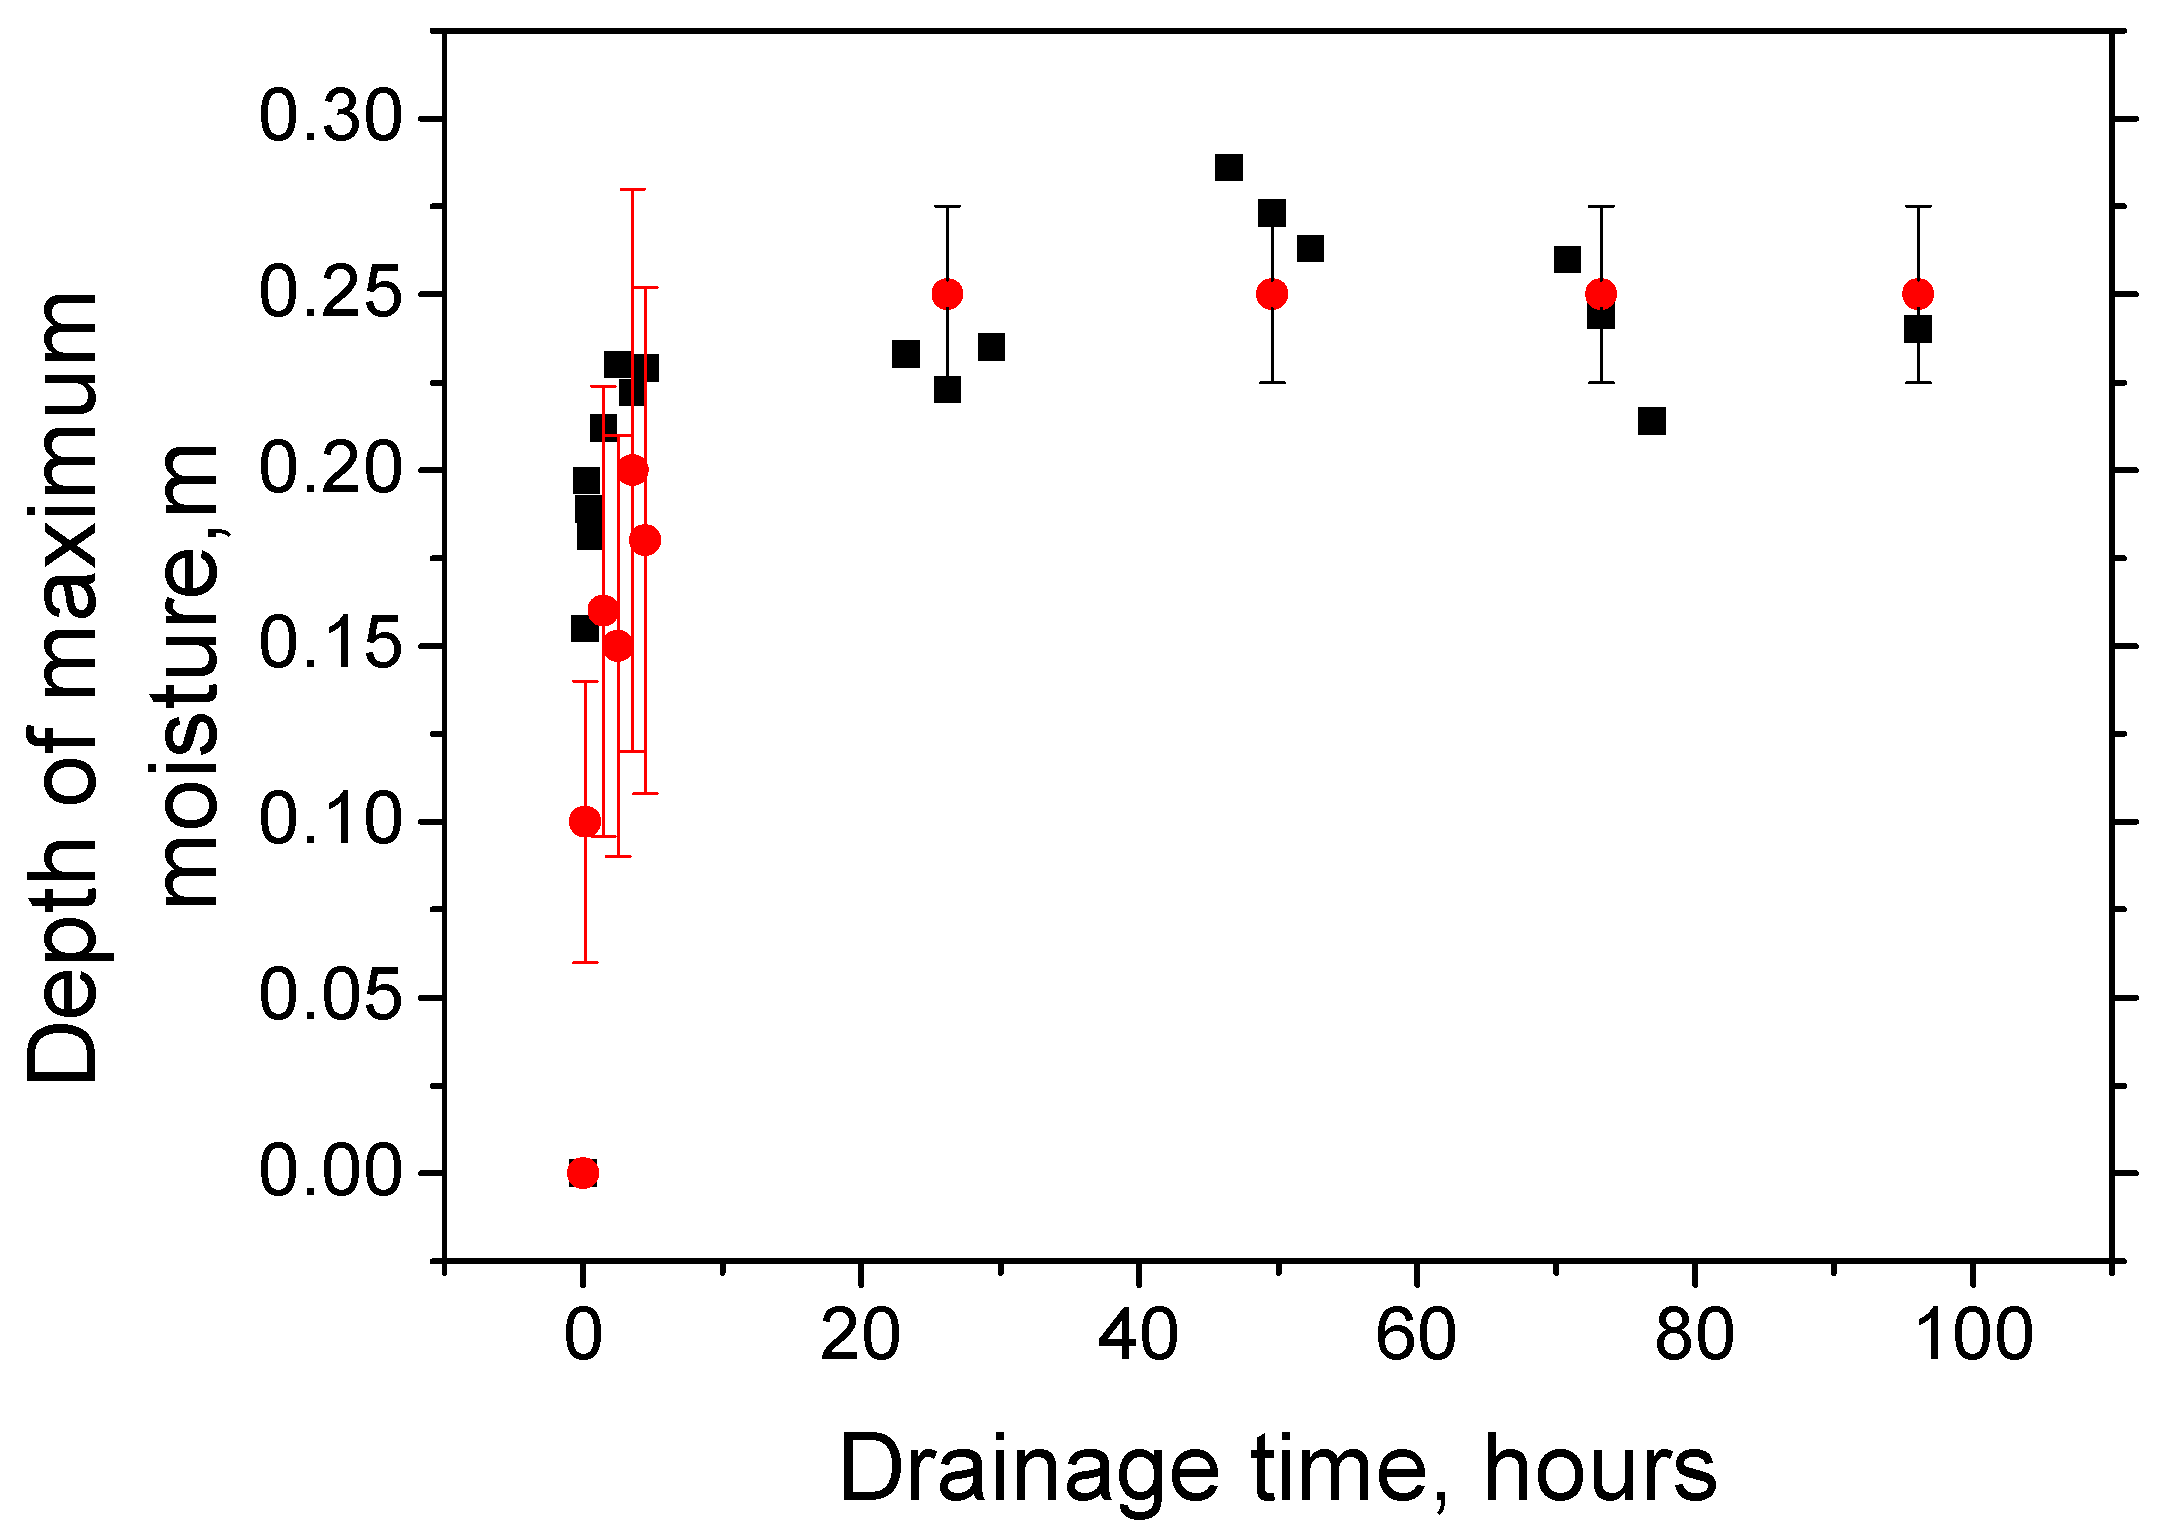
In Figure 16, the depths with the maximum moisture contents are compared with the depths of the maximum values of derivative of relative reflectivity (Equation (15)). The given data demonstrate a gradually slowing down movement of the maximum moisture front into the depth of the naturally dry sandy layer during the first 3–5 h from the start of drainage. Then, at a depth of 0.25 m, for experiment 1, this movement stops.
Figure 16 shows that the theory qualitatively reproduces the process of water drainage through the sand layer. A rigorous calculation of the Pearson correlation coefficient leads to a value of 0.907. In accordance with the Chaddock scale, such a value characterizes the correlation as ‘very high (strong)’. The quantitative difference of theory and experiment on the interval of the first 5 h of drainage is estimated to be 40%. This may be due to the fact that the sand samples for moisture measurements were taken near the side surfaces of the volume, which, as can be seen from Figure 16, were constantly moistened more slowly. This procedure for sampling sand is caused by a reluctance to deform the central zone of the volume, which mainly forms radargrams during normal incidence of an electromagnetic wave. After 20 h of the experiment, drainage in the vertical and horizontal directions stopped. In this case, the difference between the theory and the results of direct moisture measurement is stabilized at 10%.
6. Conclusions

In this work, the results of the GPR study of water drainage in sands with low content of dusty and clayey particles with moistening from above are theoretically substantiated. The main results of the study include a method for calibrating the GPR equipment, a method for calculating the electrophysical characteristics of sands in the process of water drainage, a method for processing the GPR information, which makes it possible to relate the features of wave reflection by moistened soils with the changes in moisture, and the boundaries of areas with maximum moisture.
The method of calibrating the GPR equipment made it possible to determine the amplitude of an electromagnetic wave incident on the upper boundary of the soil layer, depending on the distance from the antenna unit. The calibration performed in this work made it possible to relate the amplitude of the wave reflected by the upper boundary of the soil layer and recorded by receiving antenna with the refractive index of soil near the air–soil interface. The results of calculating the refractive indices depending on the time of water drainage demonstrate the process of lowering the moisture content of the layer. They made it possible to study the influence of the properties of sand, the volume of water used for moistening, and the thickness of the layer on the characteristics of water drainage. The method used in this work for calculating the attenuation coefficient of electromagnetic waves in soil made it possible to calculate the change in the conductivity of moistened sand on the surface and in the volume of the sand layer depending on the drainage time.
The developed method for calculating relative reflectivity and its depth derivative made it possible to relate the properties of soils, geometric features of soil layers, and the volume of drainage water with the data of the GPR measurements. It is shown that relative reflectivity and its derivative visualize the information available in radargrams on the distribution of water in the layers of sands. The processing of a series of GPR measurements obtained during the drainage process makes it possible to visualize the processes of nonstationary drainage, e.g., the change in moisture on the surface of the layer after it is moistened or the depth of water penetration into the soil layer.
The approaches developed in this work are implemented in a computer code for processing the GPR data. The combination of software and hardware for obtaining and processing the GPR data makes it possible to proceed to the introduction of the results obtained in situ into the technological process of preparing sand layers for construction work.

Author Contributions

Conceptualization and methodology, V.S.; investigation, A.V.; supervision and project administration, V.Y.; validation and writing—review and editing, A.K.; visualization, M.O. All authors have read and agreed to the published version of the manuscript.

Funding

This work was supported by the Russian Science Foundation (Grant No.21-79-20005).

Data Availability Statement

Not applicable.

Conflicts of Interest

The authors declare no conflict of interest.

Appendix A

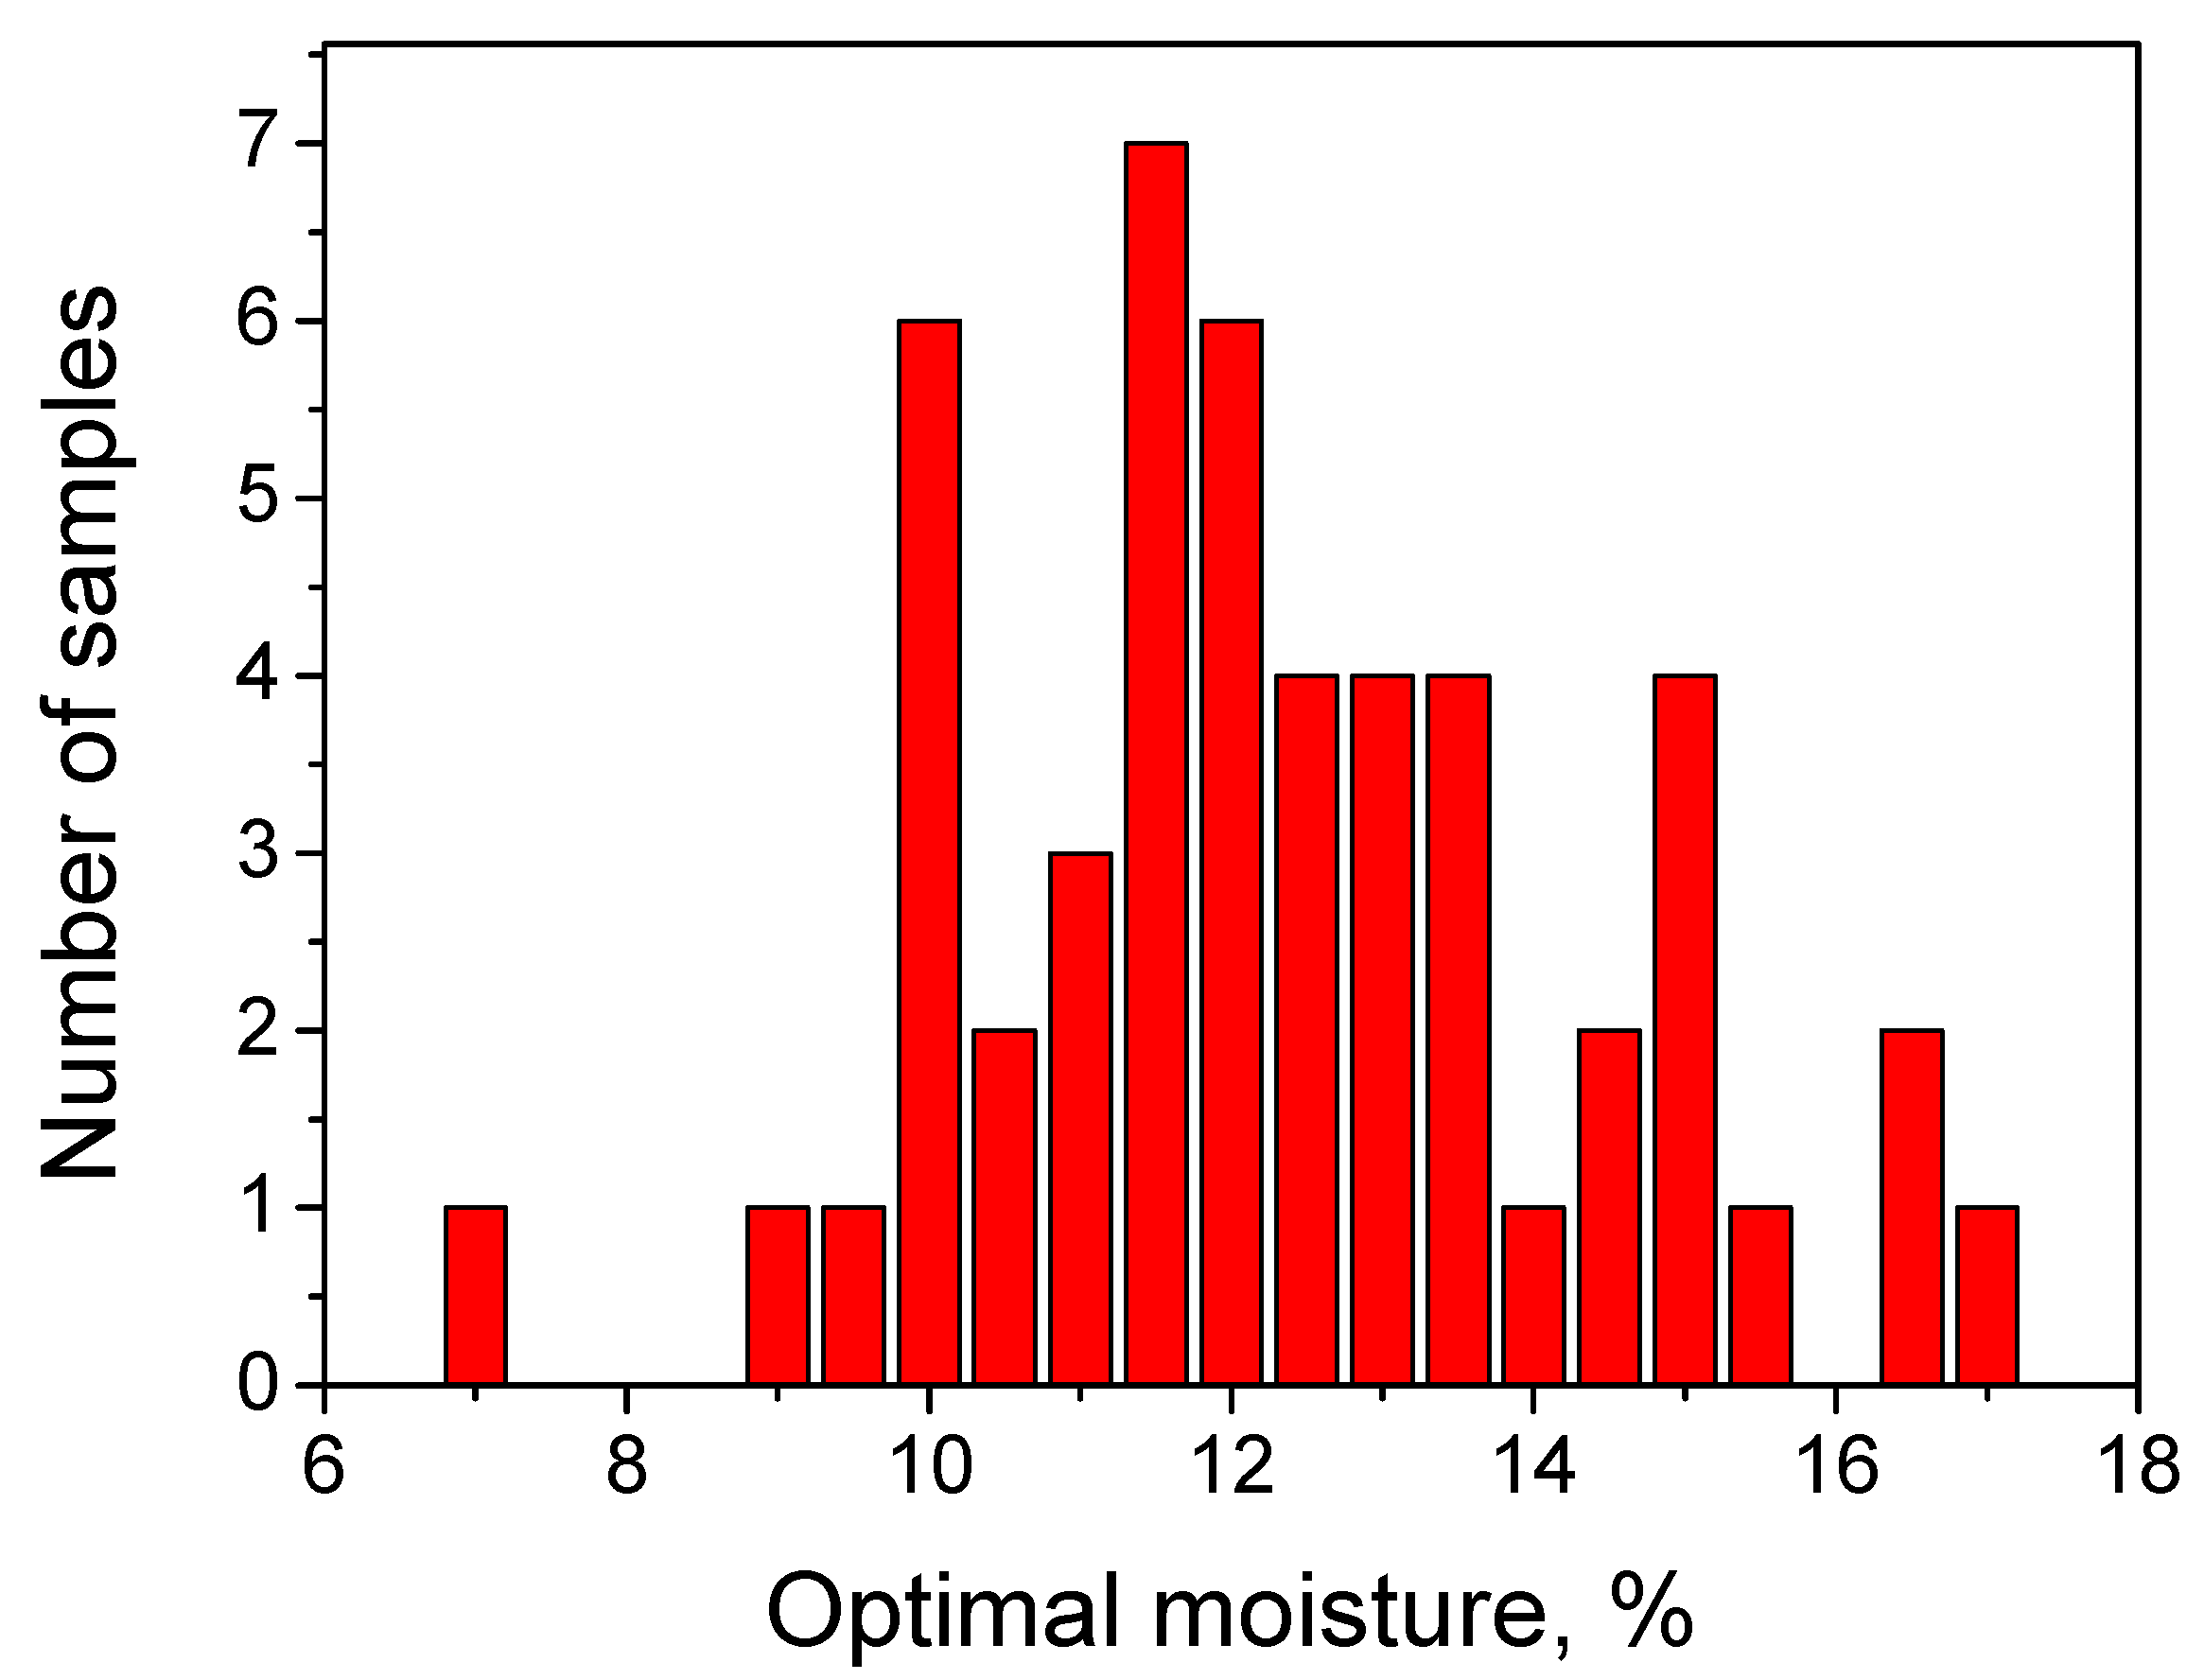
During the construction of subgrades of roads, in order to achieve maximum density, the sands must have a moisture content close to the optimal value determined, e.g., using ASTM D698-12 (2021). Sand samples from 50 different quarries in the south of Russia were used in this work to estimate the range of optimal moisture contents. The histogram of the distribution of optimal moisture built on the basis of the measurement results is shown in Figure A1. The figure shows that the range of optimal moistures can be considered limited to 7–17%.
Figure A1. Distribution of optimal moisture values among sands from 50 different quarries.
Fluids 07 00379 g0a1

References

  1. Shamir, O.; Goldshleger, N.; Basson, U.; Reshef, M. Laboratory Measurements of Subsurface Spatial Moisture Content by Ground-Penetrating Radar (GPR) Diffraction and Reflection Imaging of Agricultural Soils. Remote Sens. 2018, 10, 1667. [Google Scholar] [CrossRef] [Green Version]
  2. Tsoflias, G.P.; Halihan, T.; Sharp, J.M. Monitoring pumping test response in a fractured aquifer using ground-penetrating radar. Water Resour. Res. 2001, 37, 1221–1229. [Google Scholar] [CrossRef] [Green Version]
  3. Khakiev, Z.; Shapovalov, V.; Kruglikov, A.; Morozov, A.; Yavna, V. Investigation of long term moisture changes in trackbeds using GPR. J. Appl. Geophys. 2014, 110, 1–4. [Google Scholar] [CrossRef]
  4. Pan, X.; Wollschläger, U.; Gerhards, H.; Roth, K. Optimization of multi-channel ground-penetrating radar for quantifying field-scale soil water dynamics. J. Appl. Geophys. 2012, 82, 101–109. [Google Scholar] [CrossRef]
  5. Redman, J.D.; Davis, J.L.; Galagedara, L.W.; Parkin, G.W. Field studies of GPR air launched surface reflectivity measurements of soil water content. In Proceedings of the Ninth International Conference on Ground Penetrating Radar, Santa Barbara, CA, USA, 29 April–2 May 2002; Volume 4758, pp. 156–162. [Google Scholar] [CrossRef]
  6. Saintenoy, A.; Schneider, S.; Tucholka, P. Evaluating Ground Penetrating Radar Use for Water Infiltration Monitoring. Vadose Zone J. 2008, 7, 208–214. [Google Scholar] [CrossRef] [Green Version]
  7. Moysey, S.M. Hydrologic trajectories in transient ground-penetrating-radar reflection data. Geophysics 2010, 75, WA211–WA219. [Google Scholar] [CrossRef]
  8. Endres, A.L.; Clement, W.P.; Rudolph, D.L. Ground Penetrating Radar Imaging of an Aquifer During a Pumping Test. Groundwater 2000, 38, 566–576. [Google Scholar] [CrossRef]
  9. Dagenbach, A.; Buchner, J.S.; Klenk, P.; Roth, K. Identifying a parameterisation of the soil water retention curve from on-ground GPR measurements. Hydrol. Earth Syst. Sci. 2013, 17, 611–618. [Google Scholar] [CrossRef] [Green Version]
  10. Zhang, M.H.; Bano, M.; Feng, X.; Lesparre, N.; Girard, J.F.; Razakarisoa, O.; Belfort, B.; Lehmann, F.; Friedmann, P. Estimating water content of unsaturated sandy soils by GPR during a drainage experiment. IOP Conf. Ser. Earth Environ. Sci. 2021, 660, 012018. [Google Scholar] [CrossRef]
  11. Klotzsche, A.; Jonard, F.; Looms, M.; van der Kruk, J.; Huisman, J. Measuring Soil Water Content with Ground Penetrating Radar: A Decade of Progress. Vadose Zone J. 2018, 17, 1–9. [Google Scholar] [CrossRef] [Green Version]
  12. Ercoli, M.; Di Matteo, L.; Pauselli, C.; Mancinelli, P.; Frapiccini, S.; Talegalli, L.; Cannata, A. Integrated GPR and laboratory water content measures of sandy soils: From laboratory to field scale. Constr. Build. Mater. 2018, 159, 734–744. [Google Scholar] [CrossRef]
  13. Grote, K.; Hubbard, S.; Harvey, J.; Rubin, Y. Evaluation of infiltration in layered pavements using surface GPR reflection techniques. J. Appl. Geophys. 2005, 57, 129–153. [Google Scholar] [CrossRef]
  14. Topp, G.C.; Davis, J.L.; Annan, A.P. Electromagnetic determination of soil water content: Measurements in coaxial transmission lines. Water Resour. Res. 1980, 16, 574–582. [Google Scholar] [CrossRef] [Green Version]
  15. Cui, F.; Ni, J.; Du, Y.; Zhao, Y.; Zhou, Y. Soil water content estimation using ground penetrating radar data via group intelligence optimization algorithms: An application in the Northern Shaanxi Coal Mining Area. Energy Explor. Exploit. 2020, 39, 318–335. [Google Scholar] [CrossRef]
  16. Serbin, G.; Or, D. Near-Surface Soil Water Content Measurements Using Horn Antenna Radar: Methodology and Overview. Vadose Zone J. 2003, 2, 500–510. [Google Scholar] [CrossRef]
  17. Poisson, J.; Chouteau, M.; Aubertin, M.; Campos, D. Geophysical experiments to image the shallow internal structure and the moisture distribution of a mine waste rock pile. J. Appl. Geophys. 2009, 67, 179–192. [Google Scholar] [CrossRef]
  18. Saarenketo, T.; Scullion, T. Road evaluation with ground penetrating radar. J. Appl. Geophys. 2000, 43, 119–138. [Google Scholar] [CrossRef]
  19. Jonard, F.; Weihermüller, L.; Schwank, M.; Jadoon, K.Z.; Vereecken, H.; Lambot, S. Estimation of Hydraulic Properties of a Sandy Soil Using Ground-Based Active and Passive. Microwave Remote Sensing. IEEE Trans. Geosci. Remote Sens. 2015, 53, 3095–3108. [Google Scholar] [CrossRef]
  20. Born, M.; Wolf, E. Basics of Optics: Handbook. for Universities, 2nd ed.; Main Edition Physical and Mathematical Literature; Nauka: Moscow, Russia, 1973; Volume 721. [Google Scholar]
  21. Bittelli, M.; Salvatorelli, F.; Pisa, P.R. Correction of TDR-based soil water content measurements in conductive soils. Geoderma 2008, 143, 133–142. [Google Scholar] [CrossRef]
  22. Khakiev, Z.B.; Yavna, V.A.; Sulavko, S.N.; Kislitsa, K.Y. Determination of complex dielectric constant and soil moisture by GPR method. In Proceedings of the 12th Conference and Exhibition Engineering Geophysics, Anapa, Russia, 25–29 April 2016. [Google Scholar] [CrossRef]
  23. Forte, E.; Dossi, M.; Pipan, M.; Colucci, R.R. Velocity analysis from common offset GPR data inversion: Theory and application to synthetic and real data. Geophys. J. Int. 2014, 197, 1471–1483. [Google Scholar] [CrossRef]
  24. Shapovalov, V.; Okost, M.; Vasilchenko, A.; Yavna, V. Gpr-Based Moisture Content Determination in the Ground Construction Layers During the Construction of Subgrades. In Proceedings of the Engineering and Mining Geophysics 2019 15th Conference and Exhibition, Gelendzhik, Russia, 22–26 April 2019; Volume 2019, pp. 124–130. [Google Scholar] [CrossRef]
  25. Dossi, M.; Forte, E.; Andri, S.; Nardini, A.; Vella, R.; Pipan, M. Percolation monitoring and water content estimation by Ground Penetrating Radar in a controlled environment. J. Appl. Geophys. 2021, 190, 104336. [Google Scholar] [CrossRef]
  26. Anbazhagan, P.; Bittelli, M.; Pallepati, R.R.; Mahajan, P. Comparison of soil water content estimation equations using ground penetrating radar. J. Hydrol. 2020, 588, 125039. [Google Scholar] [CrossRef]
  27. Yavna, V.A.; Shapovalov, V.L.; Vasilchenko, A.A.; Okost, M.V.; Morozov, A.V. State Register of Computer Codes. Available online: https://www.fips.ru/publication-web/publications/document?type=doc&tab=PrEVM&id=AAA40CE7-7D2D-45D4-B2AE-A689A763BF51 (accessed on 7 December 2022).
  28. Khakiev, Z.B.; Yavna, V.A.; Ermolov, K.M. Assessment of the informativeness of methods for determining the ballast layer contamination from the reflected GPR signal. In Proceedings of the 12th Conference and Exhibition Engineering Geophysics, Anapa, Russia, 25–29 April 2016. cp-482-00030. [Google Scholar] [CrossRef]
Figure 1. Scheme of the GPR experiment.
Fluids 07 00379 g001
Figure 2. Results of calibration of antennas No. 278 (■—experiment, ●—theory). Horizontal bars show the scatter of ±8%.
Fluids 07 00379 g002
Figure 3. Radargrams of sand sample No. 1: a—direct transmission signal, b—upper surface of sand, c—lower surface of sand, d—waterproof partition. (A,B) Sand in a naturally dry state; (C,D) sand after moistening with 15.1 L of water and 50 h after moistening. N numbers the traces, t is time, and h is the depth of the sand layer. The timescale shown on the left applies to all radargrams. The change in the depth scales shown to the right of the radargrams reflect the time dependence of relative permeability of moistened sand during water drainage.
Fluids 07 00379 g003
Figure 4. Traces of the radargrams of sand in experiment 1: (A) sand in naturally dry state; (B) sand after moistening with 15.1 L of water; (C) sand 50 h after moistening. a—a direct signal, b—upper surface of the sand, d—waterproof partition.
Fluids 07 00379 g004
Figure 5. Dependence of the sand refractive index on the water drainage time on narrow (A) and wide (B) time intervals. Calculation by Equation (5): black squares ■—experiment 1; red circles ●—experiment 2. Calculation by Equation (8): blue empty squares □—experiment 1).
Fluids 07 00379 g005
Figure 6. Dependence of the sand refractive index on the water drainage time on narrow (A) and wide (B) time intervals. Calculation by Equation (5): red circles ●—experiment 2; black empty squares □—experiment 3; red empty circles ○—calculation by Equation (19) in experiment 3.
Fluids 07 00379 g006
Figure 7. Dependence of the refractive index of a sand on water drainage time of on the narrow (A) and wide (B) time intervals. Calculation using Equation (5): black squares ■—experiment 1; red circles ●—experiment 4.
Fluids 07 00379 g007
Figure 8. Experiment 1: (A) trace envelopes (G, Equation (9)) obtained before moistening (black) and immediately after moistening (red) and their exponential approximations; (B) coefficient of attenuation of electromagnetic waves as function of time of water drainage.
Fluids 07 00379 g008
Figure 9. Experiment 1. Dependence of conductivity on water drainage time on a narrow (A) and wide (B) time intervals. The values of n were used, calculated for the near-surface layer of sand using Equation (5) (red circles ●) and on average for the entire layer of sand using Equation (8) (black squares ■).
Fluids 07 00379 g009
Figure 10. Relative reflectivity of sand f(h) for experiment 1 (sand sample No. 1, solid lines) and experiment 2 (sand sample No. 2, dashed lines) for different drainage times indicated by the line colors: black color—naturally dry sand; red color—immediately after moistening; green blue, brown, and dark-blue colors—after 0.5, 3.5, 24, and 48 h of water drainage.
Fluids 07 00379 g010
Figure 11. Relative reflectivity of sand f(h) for experiment 2 (volume of moistening water 15.1 L, dashed lines) and experiment 3 (volume of moistening water 22.8 L, dotted lines) for different drainage times indicated with lines colors: black—naturally dry sand; red—immediately after moistening; green, blue, brown, and dark blue—after 0.5, 3.5, 24 and 48 h of water drainage.
Fluids 07 00379 g011
Figure 12. Relative reflectivity of sand f(h) for experiment 1 (sand layer thickness 0.3 m, solid lines) and experiment 4 (sand layer thickness 0.6 m, dash-dotted lines) for different drainage times indicated with lines colors: black—naturally dry sand; red—immediately after moistening; green, blue, brown, and dark blue—after 0.5, 3.5, 24, and 48 h of water drainage.
Fluids 07 00379 g012
Figure 13. Dependence of moisture (W, %—red circles ●) and tangent of the slope angle of the relative reflectivity graph (tanα—black squares ■) on the time of water drainage on a narrow (A) and wide (B) time intervals. The vertical bars indicate errors of ±20%.
Fluids 07 00379 g013
Figure 14. Polynomial functions approximating the derivatives of relative reflectivity δ (Equation (15)) for experiment 1 at different points in time from the beginning of drainage. The following colors were chosen to indicate the time: immediately after moistening—red; after 0.1 h—blue; 0.2 h—green; 0.4 h—pink; 3.5 h—orange; after 4.5 h—olive. The arrows indicate the positions of the local maxima of the derivatives δ; h is the depth measured from the top surface of the sand layer.
Fluids 07 00379 g014
Figure 15. Directly measured moisture contents as functions of depth, and their approximation by polynomials of the third degree. To indicate the time, symbols and colors are used: immediately after soaking—■ (black); after 1 day—● (red); after 2 days—▲ (blue); after 3 days—▼ (green).
Fluids 07 00379 g015
Figure 16. Experiment 1. Comparison of the depths of the sand layer with maximum moisture (●) and the depths with maximum values of the derivatives of the relative reflectivity (Equation15) (■). The colored vertical bars show the scatter in measured sand moisture: red bars—±40%, black bars—±10%.
Fluids 07 00379 g016
Table 1. Parameters of the sand samples used in measurements determined according to GOST 8735, ASTM D2434-22, and ASTM D6913/D6913M-17.
Parameter Sample 1Sample 2
Maximum density, g/cm31.691.69
Optimum moisture, %14.013.3
Filtration coefficient, m/day5.123.02
Bulk density, g/cm31.491.42
True density, g/cm32.682.68
Porosity, %44.447.1
Dusty and clayey particles, %0.93.1
d500.360.36
Coefficient of uniformity0.610.40
Skewness1.941.45
Kurtosis2.190.57
Table 2. Granulometric composition of sands (determined according to ASTM D6913/D6913M-17).
SampleSieve Size, mm
105210.50.250.1<0.1
Rest on sieve, %10.40.30.81.47.568.820.30.6
20.20.62.71.69.054.329.91.7
Table 3. Experimental conditions.
Experiment
(N)
Sand SampleWaterproof Partition at a Depth of 0.3 mWater Volume for Moistening, lThe Experiments (N1–N2) Are Compared, the Role of Factors Are Established:
11Yes15.1(1–2), filtration by sand layers
22Yes15.1(2–3), volume of moistening water
32Yes22.8(1–4), base water permeability
41No15.1
Publisher’s Note: MDPI stays neutral with regard to jurisdictional claims in published maps and institutional affiliations.