Article

Wall-Modeled and Hybrid Large-Eddy Simulations of the Flow over Roughness Strips

1
Department of Mechanical and Materials Engineering, Queen’s University, Kingston, ON K7L 3N6, Canada
2
Engineering Department, University of Campania Luigi Vanvitelli, 81031 Aversa, Italy
*
Author to whom correspondence should be addressed.
Fluids 2023, 8(1), 10; https://doi.org/10.3390/fluids8010010
Submission received: 10 November 2022 / Revised: 17 December 2022 / Accepted: 20 December 2022 / Published: 27 December 2022
(This article belongs to the Special Issue Recent Advances in Fluid Mechanics: Feature Papers, 2022)

Abstract

:
The flow over alternating roughness strips oriented normally to the mean stream is studied using wall-modeled large-eddy simulations (WMLES) and improved delayed detached-eddy simulations (IDDES) (a hybrid method solving the Reynolds-averaged Navier–Stokes (RANS) equations near the wall and switching to large-eddy simulations (LES) in the core of the flow). The calculations are performed in an open-channel configuration. Various approaches are used to account for roughness by either modifying the wall boundary condition for WMLES or the model itself for IDDES or by adding a drag forcing term to the momentum equations. By comparing the numerical results with the experimental data, both methods with both roughness modifications are shown to reproduce the non-equilibrium effects, but noticeable differences are observed. The WMLES, although affected by the underlying equilibrium assumption, predicts the return to equilibrium of the skin friction in good agreement with the experiments. The velocity predicted by the IDDES does not have memory of the upstream conditions and recovers to the equilibrium conditions faster. Memory of the upstream conditions appears to be a critical factor for the accurate computational modeling of this flow.

1. Introduction

Roughness occurs in many applications in engineering and the natural sciences, such as in pipes, turbine blades, atmospheric boundary layers and plant canopies. Because of its practical importance, the effects of roughness on flow have been studied for many years, starting from the seminal work in [1], which was reviewed in [2,3] and can be summarized as (1) increased drag [1,4], (2) decreased anisotropy of the Reynolds stresses [5], (3) modification of the near-wall region through break-up of the streaky structures and (4) the presence of an additional production mechanism for the turbulent kinetic energy [2,6].
In many cases, roughness is not uniform; rather, regions of varying roughness heights are adjacent to each other. This occurs, for instance, in boundary layers over plant canopies or mixed terrain, where built areas, woods and planted fields can be present. In all these cases, a sudden change in the wall boundary condition (BC) occurs that modifies the flow, and its effects can be significant. The simplest type of heterogeneous roughness is represented by the abrupt transition from a two-dimensional rough patch oriented normally to the flow to a smooth surface or from a smooth to a rough patch. Although very simple, this particular configuration is compelling because it can be found very often, for example, in atmospheric boundary layers [7,8] or in meteorological flows [9]. Downstream of the transition, an internal boundary layer is formed that can be separated into two regions: an equilibrium inner layer, in which the flow has adjusted to the change of the BC, and an outer one, in which the flow still has memory of the different upstream BC.
Several investigators have studied this flow either experimentally [8,10,11,12,13,14] or numerically [15,16,17,18,19]. A common observation is that after the transition, the flow variables return to equilibrium at different downstream locations. For instance, the skin friction adapts more rapidly to the new conditions than the mean velocity and Reynolds stresses.
Experimentally, it was found that the skin friction measurement is very strongly affected by the technique used. With an indirect method that infers the wall shear stress from outer flow data, two sources of error arise: first, the use of equilibrium relations is not justified (the Clauser plot, for instance), and second, if the data are taken from locations outside the equilibrium region of the internal boundary layer, the effect of the transition might not propagate yet to the measurement location. Additionally, if the measurements are taken very close to the wall, then in the equilibrium region, the viscous component of the drag can be evaluated, but the form drag prediction is unreliable.
Wall-resolved numerical simulations such as direct numerical simulations (DNSs) and large-eddy simulations (LESs) can provide more insights than experiments, since the flow inside the roughness sublayer is known and the contributions of both the form and viscous drags to the skin friction can be evaluated. However, these simulations are limited to low or intermediate Reynolds numbers by their high computational cost, which is particularly significant due to the opposite requirements that the roughness size should be small enough to avoid blockage but large enough to achieve the fully rough regime [3].
The first fully resolved simulation of the flow over a rough-to-smooth transition was performed by Ismail et al. [19], who confirmed the long recovery region required to reach self-similarity. Li et al. [14] complemented their experimental database with a fully resolved simulation, demonstrating that a good estimation of the skin friction recovery in the vicinity of the transition can only be attained by using direct methods.
Unfortunately, the engineering need for the prediction of high Reynolds number flows cannot be met by computationally expensive wall-resolved calculations, while turbulence models for the affordable Reynolds-averaged Navier–Stokes (RANS) simulations have difficulties in predicting flows that are strongly out of equilibrium (such as for heterogeneous roughness). Furthermore, typical corrections used to include the effects of roughness [20,21,22,23,24] were developed using equilibrium assumptions (typically fully rough flow in the absence of pressure gradient) and are therefore not very accurate in non-equilibrium rough wall boundary layers [25].
Methods that combine the LES approach in the outer region of the flow with a simpler methodology near solid surfaces are gaining popularity, due to their ability to capture the outer layer non-equilibrium naturally with much lower computational costs compared with wall-resolved calculations. These savings, of course, are at the expense of additional modeling. The two most common techniques of this type are wall-modeled large-eddy simulation (WMLES) and hybrid RANS/LES methods. In the first case, the outer layer is obtained from the solution of the filtered Navier–Stokes equations that govern LES, and approximate methods (for instance, correlations based on the log law or other shape functions) are used to derive the wall stress from the outer layer data. In hybrid RANS/LES methods, the character of the turbulence model changes in such a way that the RANS approach is used near the wall while switching to LES at some distance from the surface. Corrections for roughness have been developed for both of these approaches. Comprehensive reviews of these methods can be found in [26,27,28,29] for WMLES and [30,31] for hybrid RANS/LES. Although they tend to be based on equilibrium arguments, these methods may be more accurate than their RANS analogs, since the inner layer eddies have shorter time scales than the outer layer ones and tend toward equilibrium faster, while the non-equilibrium effects are accounted for by the outer layer LES [28].
Several investigators have performed WMLES of the flow over heterogeneous roughness and strips normal to the flow direction in particular, which are the focus of the present study. Bou-Zeid et al. [15,32] imposed locally the law of the wall to evaluate the wall shear stress from the LES field. They pointed out how surface heterogeneity highly affects the flow, inducing sharp variations in the velocity profiles and discontinuities in the shear stress. Saito and Pullin [17] instead derived an ordinary differential equation for the friction velocity based on filtered quantities supplied by the outer LES. Their work was centered on the effects of different Reynolds numbers and roughness heights for a smooth-rough-smooth surface arrangement. They concluded that in both smooth-to-rough and rough-to-smooth transitions, a slower initial response in the recovery of the wall shear stress was found when increasing the Reynolds number, whereas the response was faster when increasing the roughness height. Chamorro and Porté-Agel [8] proposed a new model to estimate the velocity profile over a rough-to-smooth transition, using a weighted average between two limiting logarithmic profiles. The first one corresponded to the upstream equilibrium velocity, while the second log law was adjusted to the downstream local flow conditions after recovery. This methodology has the potential to be implemented as a BC for the LES field.
In the investigations described above, only one type of modeling approach for the wall BC was considered, but of crucial importance is understanding how different modeling approaches predict the flow behavior in step changes in surface roughness, particularly identifying the limitations of the different methodologies. The purpose of the present work is to complement the above investigations by assessing the accuracy of two typical techniques, which are WMLES and hybrid RANS/LES, in predicting the sudden transition from a smooth surface to a rough one, and vice versa. In addition to this, roughness is included using two different methods: the modification of either the log law or model equations and the use of a localized drag force [33]. Because of the independence of the drag model from the particular turbulence model used, this technique is particularly attractive, since it does not require ad hoc adjustments when the model for the resolved scales is changed.
In the following, the problem formulation, including model equations and roughness corrections, will be presented first. The numerical method and BCs used will then be described, and the numerical results will be discussed. Our final conclusions and directions for future work will close the paper.

2. Methodology

2.1. Governing Equations

The governing equations for incompressible flow can be formally written the same way for both LES and unsteady RANS approaches:
u ¯ i x i = 0
u ¯ i t + x j ( u ¯ i u ¯ j ) = P ¯ x i + ν 2 u ¯ i x j x j τ i j x j ,
where the overbar represents either the LES spatial filtering or the Reynolds-averaging operation. In the above equations, u ¯ i stands for the resolved velocity, P ¯ = p ¯ / ρ is the (resolved) kinematic pressure, ν is the constant kinematic viscosity and τ i j = u i u ¯ j u ¯ i u ¯ j represents the residual (unresolved) stresses. The latter have to be interpreted as either the subfilter-scale (SFS) stresses in LES or the Reynolds stresses in unsteady RANS simulations and need to be modeled.

2.2. Turbulence Models

The unknown residual stresses are normally approximated using an eddy viscosity assumption for the deviatoric part of the stress tensor:
τ i j d τ i j 1 3 δ i j τ k k = 2 ν T S ¯ i j ,
where
S ¯ i j = 1 2 u ¯ i x j + u ¯ j x i
is the resolved strain rate tensor. For incompressible flows, the isotropic part of the stress tensor may be absorbed into an effective resolved pressure field. The present WMLES method uses the eddy viscosity SFS model proposed by Vreman [34], which was constructed in such a way that the modeled dissipation is relatively small in the near-wall regions. The standard value of the model constant was used.
The hybrid RANS/LES method used in this work follows the improved delayed detached-eddy simulation (IDDES) approach [35]. The IDDES in its formulation with the Spalart–Allmaras (SA) turbulence model was used, in which a transport equation for the eddy viscosity ν T is solved [36]. The RANS and LES fields are coupled by introducing a hybrid turbulent length scale, which is modified as follows. Near the wall, according to the SA model, the distance from the wall is used, whereas in the outer layer, a blending function is formulated that allows shifting from the RANS levels of the eddy viscosity in the near-wall region to the LES levels of the eddy viscosity in the core of the flow. The two regions are separated by a zone where the eddy viscosity is very low to allow the rapid generation of eddies. More details on the IDDES formulation can be found in the original paper [37].

2.3. Numerical Model

The simulations were conducted using the open-channel configuration sketched in Figure 1, where x, y and z represent the streamwise, wall-normal, and spanwise directions, respectively. The domain size was L x × L y × L z = 56 δ × δ × 14 δ , where δ is the open-channel height and the rough strip, whose length is L r , occupies 66 % of the domain. The present geometry corresponds to the experimental set-up in [14], where a spatially developing boundary-layer flow was examined rather than the periodic open channel used here. The Reynolds number based on the bulk velocity was R e b = U b δ / ν = 121,000, which roughly corresponds to the experimental value at the rough-to-smooth interface. Following the notation used in [14], the transition location was indicated by x o , and x ^ = x x o stands for the relative streamwise position.
A fractional step method was used to advance the governing equations in time. The Crank–Nicolson time advancement was used for the wall-normal diffusion, and a third-order Runge–Kutta scheme was used for the remaining terms. Spatial discretization was performed using conservative second-order finite differences on a staggered grid. In the WMLES, the spatial grid was uniform and isotropic, while for the IDDES, it was suitably stretched in the wall-normal direction, with the first grid point being located at y + < 1 (where a plus denotes scaling in the inner units).
Periodic BCs were applied in the homogeneous streamwise and spanwise directions, simulating an infinite domain of alternating rough and smooth strips, while a symmetry condition was imposed at the top boundary. For IDDES, no-slip conditions were applied at the wall. For WMLES, the wall stress was obtained, given the velocity at the interface, by satisfying the log law of the wall. Details will be given in the next subsection.

2.4. Roughness Modeling

Depending on the particular approach followed, different methods were used to incorporate the effect of roughness on the flow. One consisted of modifying either the model for the unresolved scales (for IDDES) or the wall BC (for WMLES). The other was based on the addition of a drag force to the resolved momentum in Equation (2). Aupoix and Spalart [23] proposed two different extensions of the SA model to include the effect of roughness. The so-called “Boeing extension”, which is employed here, consists of a change in the BC for the eddy viscosity field, which must satisfy the following relation at the wall:
ν ˜ n = ν ˜ d ,
instead of ν ˜ = 0 , where ν ˜ is the modified eddy viscosity used in the SA model (which is proportional to ν T ). In addition, the length-scale d must be modified to account for the fact that y = 0 corresponds to a virtual wall where the turbulent quantities are non-zero. They suggested using d = d o + y , where d o = 0.03 k s is the distance between the virtual wall and the bottom of the roughness sublayer and k s is the equivalent sand grain roughness height. In the WMLES case, as mentioned above, the wall stress is obtained using an approximate integration of the equations of motion between the inner and outer layer interface at y = y i f and the wall [26]. We follow the simplest (and most common) approach (i.e., the use of the logarithmic law of the wall) [38]. If the wall is rough, a roughness function Δ U + = f ( k s + ) is introduced to account for the increased wall stress caused by the form drag on the roughness elements. Therefore, the logarithmic law of the wall takes the following forms for the smooth and the rough strips, respectively:
u i f + = 1 κ log y i f + + B ( for x ^ > 0 ) ,
u i f + = 1 κ log y i f k s + 8.5 ( for x ^ < 0 ) ,
where the subscript i f denotes quantities evaluated at the inner and outer layer interface, which is located at y = 0.05 δ . Note that y i f exceeds the location of the first grid point to allow better development of the near-wall eddies [39]. In the above expressions, κ = 0.41 is the von Kàrmàn constant, and B = 5.0 . The present roughness height k s matches the experimental value at the transition location k s + 130 [14], which results in Δ U + 8.2 for the roughness function.
As an alternative, one can employ the drag model recently proposed in [33]. Roughness effects are included by adding a forcing term to the right-hand side of the Equation (2). The drag force, which is active in a volume region adjacent to the wall, referred to as the “roughness zone”, is defined by
f i = α i j | u r z | u r z , j
where α i j = diag { α t , α t , α n } determines the force intensity, with the subscripts t and n denoting the wall-tangential and wall-normal components, respectively. Note that the roughness zone extends in the wall-normal direction up to a distance corresponding to the mean peak height of the rough surface. In this study, the normal component was set to zero, and the tangential component was chosen to give the same roughness function obtained by using the equivalent sand grain roughness height modification. Practically, α i j = diag { α , α , 0 } was prescribed.
By combining the two turbulence models and the two roughness models introduced above, four different methods were tested in this work. In the following discussion, WMLES- k s and IDDES- k s denote the simulations with roughness model modifications, whereas WMLES-DM and IDDES-DM are the calculations that use the drag model. In addition, angle brackets will denote quantities averaged over time and in the spanwise direction, with a prime representing the resolved fluctuations.

3. Results

3.1. Grid Convergence Study

A grid convergence study was conducted for the WMLES. Several meshes were used, whose parameters are listed in Table 1. The corresponding mean velocity profiles at the ends of the rough and smooth strips are shown in Figure 2. The medium grid was considered to have converged and was used to generate the results presented in the following section.
Regarding the IDDES, a rigorous grid convergence study could not be carried out since the character of the solution (in particular at the RANS/LES interface) depended on the grid size. Then, the same resolution as the grid-converged WMLES was used in the wall-parallel directions while increasing the number of points in the wall-normal direction such that y + < 1 for the first grid point away from the wall. The maximum grid spacing (close to the top boundary) was 0.025 δ , which was slightly larger than that of WMLES but fine enough to resolve the outer layer structures.

3.2. Skin Friction

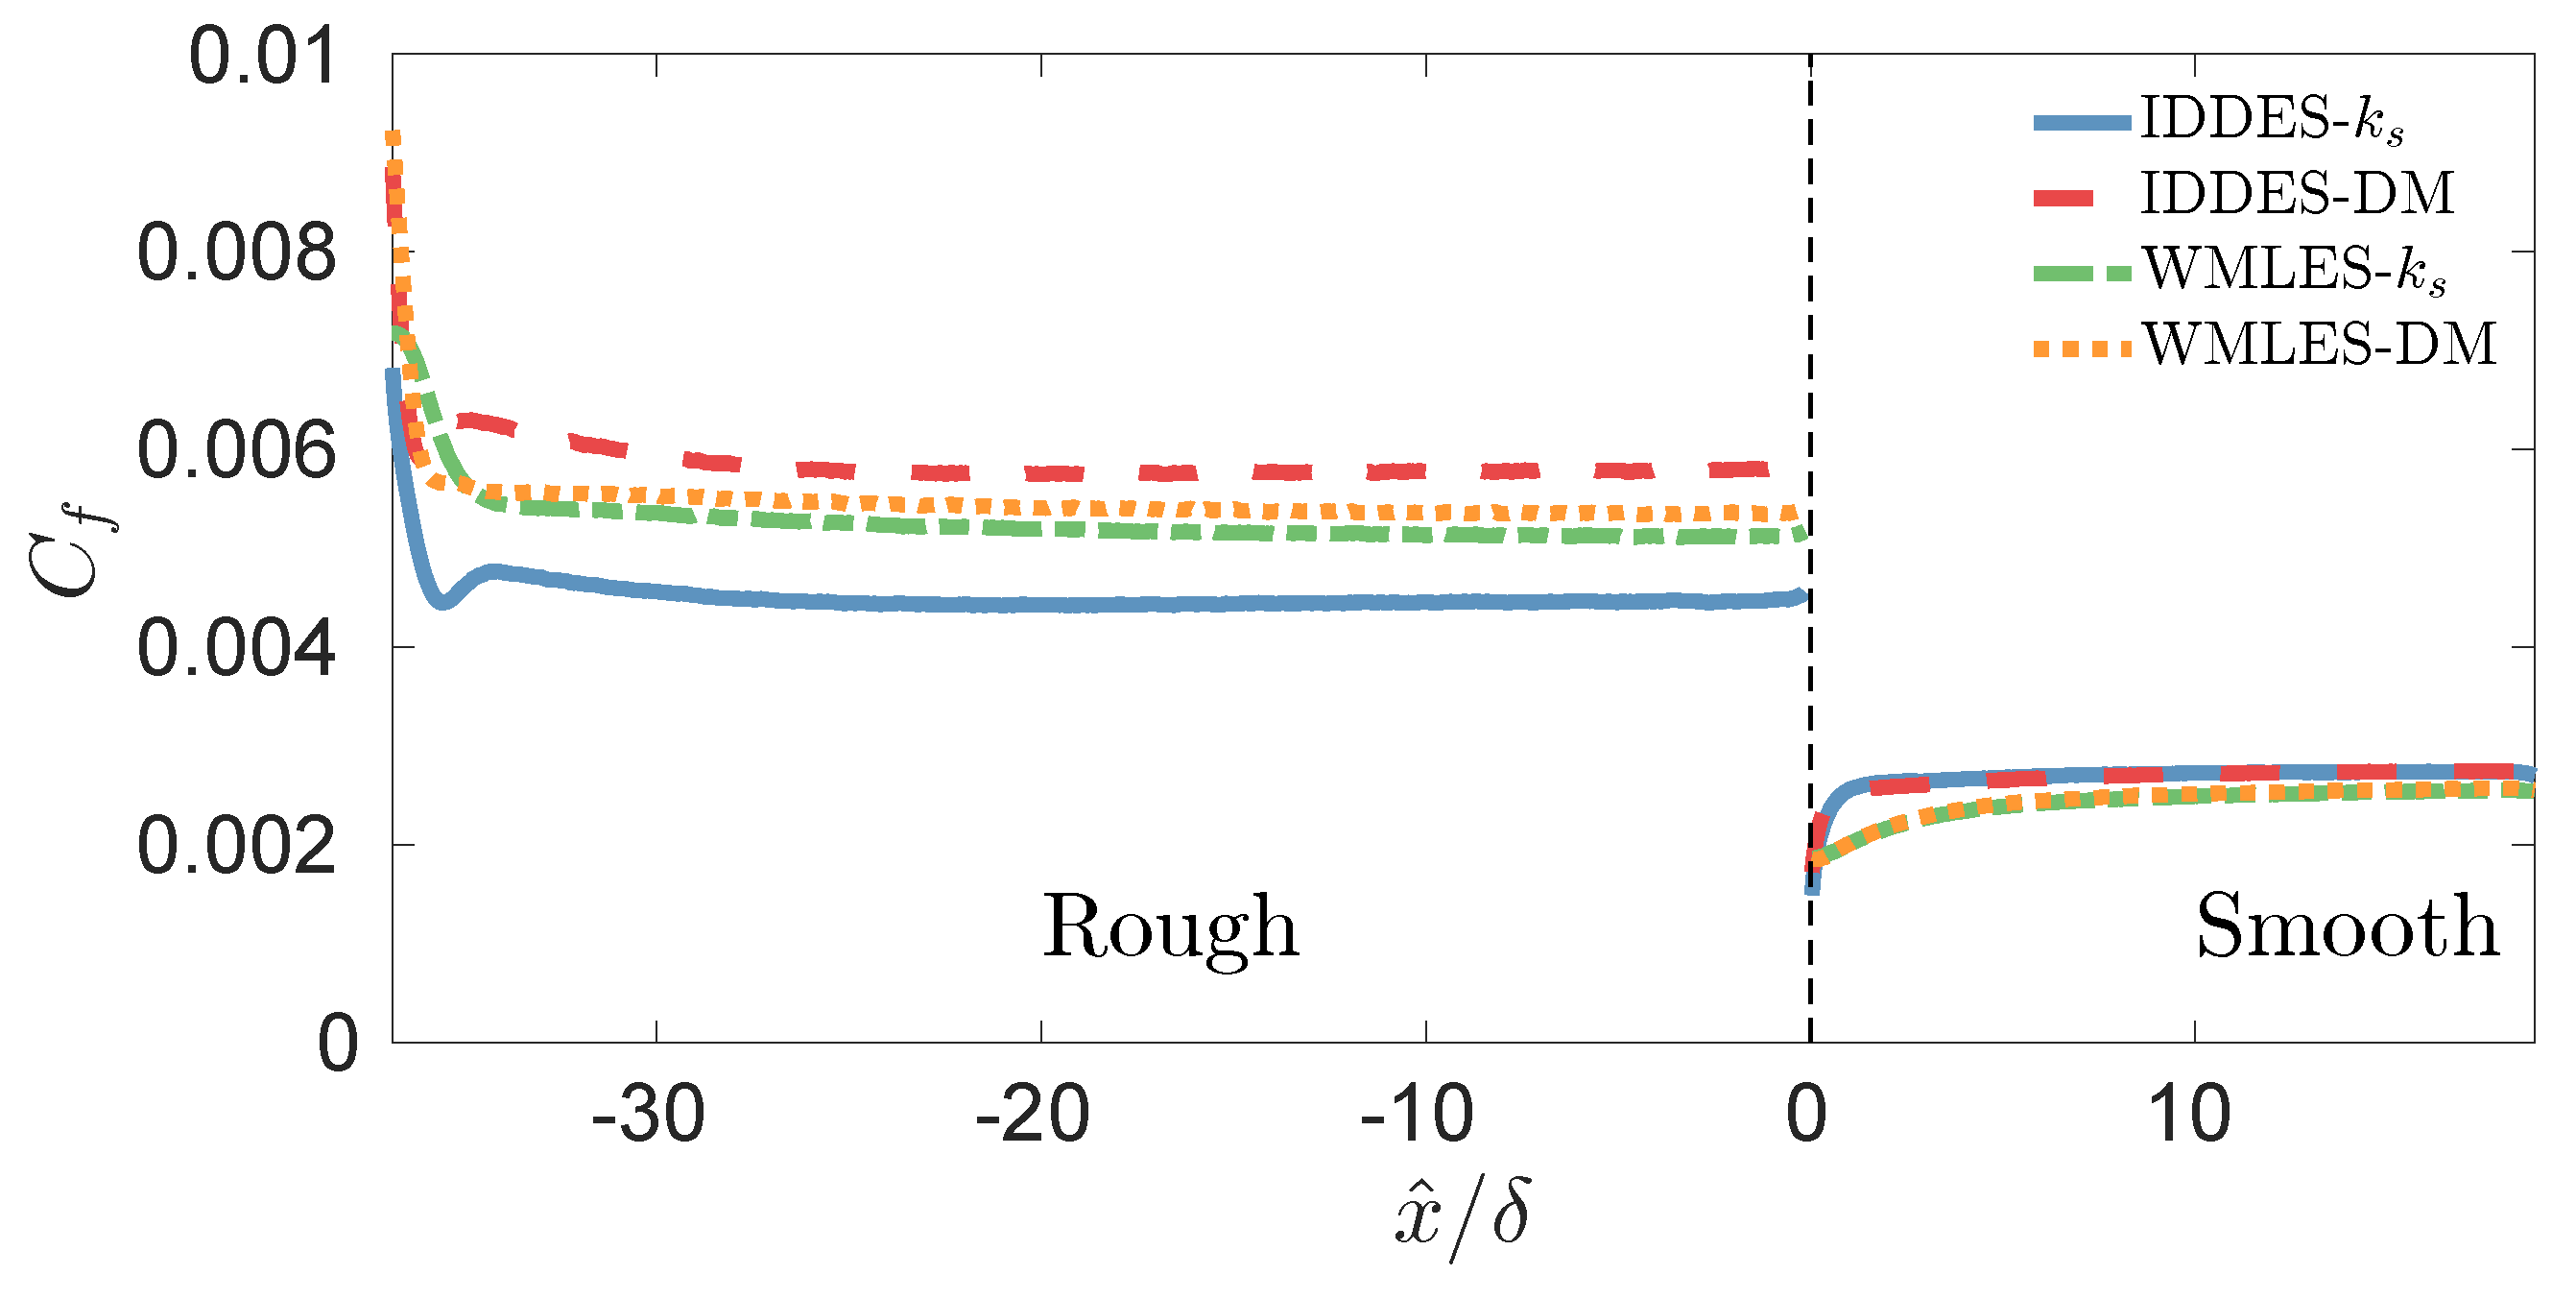
Figure 3 shows the skin friction coefficient predicted by the four models. In all cases, the sudden increase and decrease in C f at the interface was predicted. However, some discrepancies existed. At the end of the rough strip, the WMLES were in good agreement with each other, reflecting the fact that both the wall BC and the drag model were calibrated using fully developed rough channel data. There was a significant difference between the IDDES results, however, which was probably due to the sensitivity of the drag model constant α to the grid resolution when coupled with IDDES. This parameter was actually calibrated in reference simulations for which coarser resolutions (but sufficient for achieving grid convergence) were used. Here, the grid was finer in the streamwise direction to resolve the surface discontinuity, and a new calibration appears to be necessary. In IDDES, the grid plays a very important role because of the definition of the model’s length scale, whose changes affect not only the eddy viscosity level in the outer layer but also (and more importantly) the location of the RANS/LES interface.
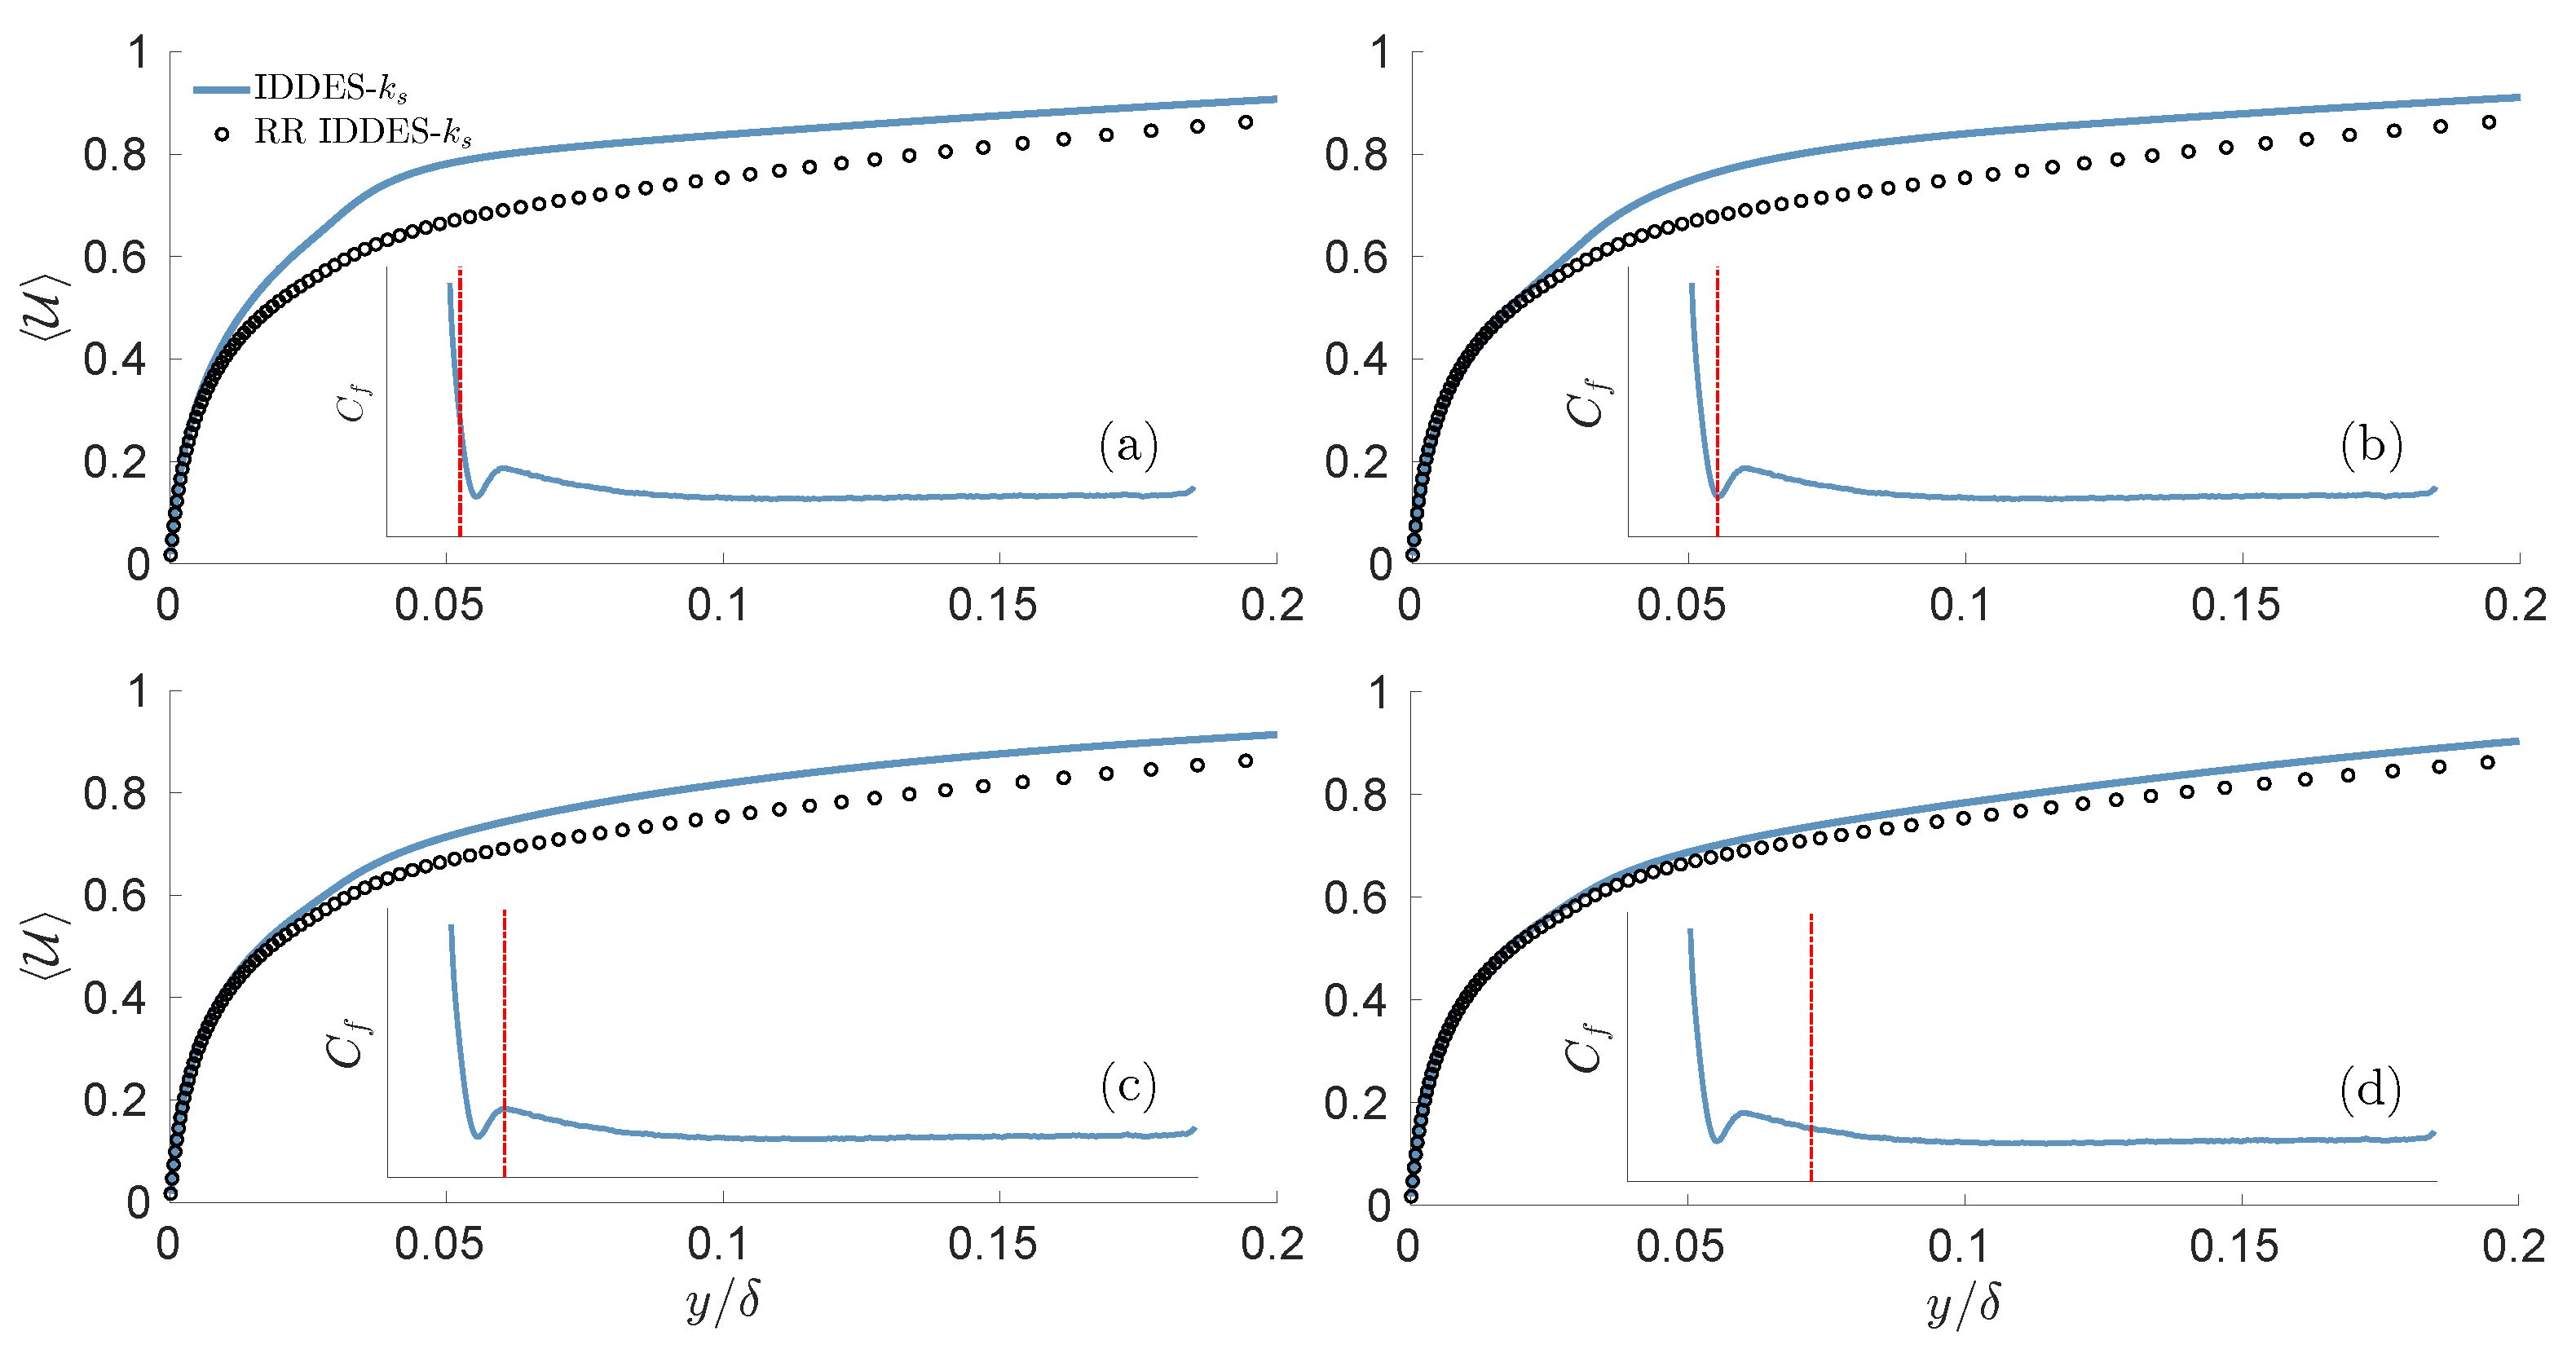
The recovery length on the smooth strip predicted by the IDDES was much shorter than that obtained from the WMLES. This issue will be discussed further momentarily. After the smooth-to-rough interface, the IDDES showed a small dip that was not present in the WMLES. A similar undershoot was found in the WMLES of [17], becoming more prominent when the Reynolds number or the roughness height were increased. This phenomenon was due to the global mass conservation that was enforced in the channel. To explain this behavior, the mean velocity profile with the IDDES- k s model at four locations around the dip region was compared with that at the reference location on the rough strip, which was close to fully developed rough conditions. Before the dip (Figure 4a), the velocity was higher than the reference throughout the layer, still resembling the smooth strip profile. At the dip itself (Figure 4b), the mean velocity profile in the wall layer matched the reference location, whereas the outer layer, which adapted more slowly to the new surface conditions, was still accelerated. After this location, the outer layer begins to approach a fully developed rough state, as is shown in Figure 4c. The mass flux is maintained to be constant, and thus the velocity decrease in the outer layer must be balanced by a velocity increase elsewhere. Since the wall region has a faster response to disturbances propagating from the outer layer, the velocity increase takes place in the wall region, resulting in a higher velocity gradient at the wall and the subsequent formation of the dip in the skin friction coefficient. After the dip (Figure 4d), the inner and outer layer recovered at the same speed, attaining self-preservation. The aforementioned effects all took place below the WMLES interface ( y / δ = 0.05 ), which explains why with this methodology, the dip was not present.
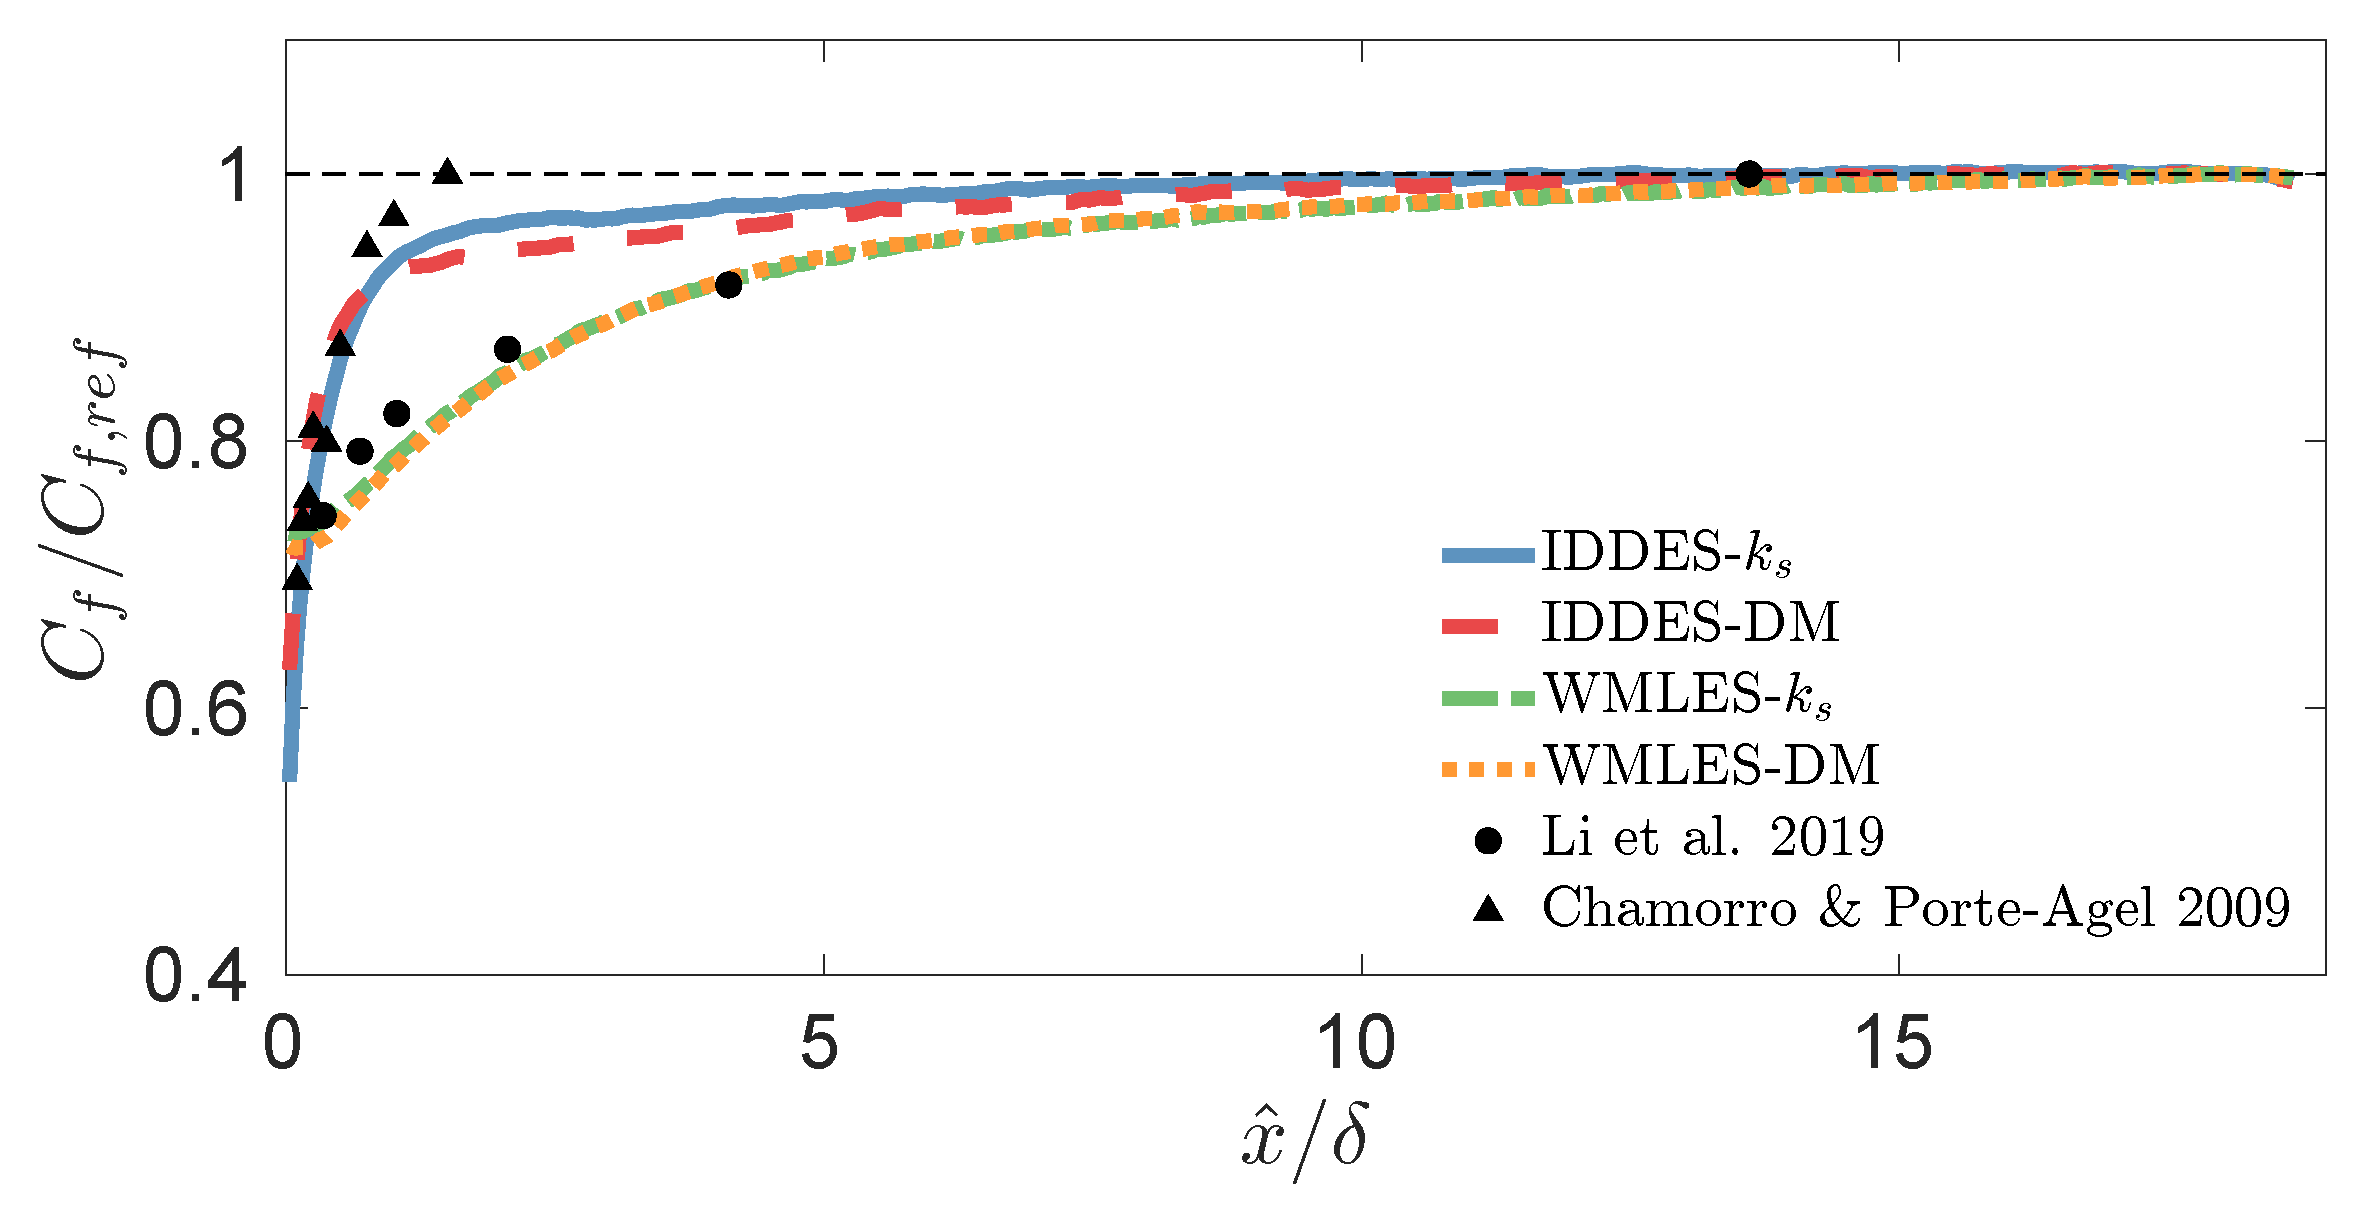
Figure 5 compares the skin friction coefficient on the smooth strip with the experimental data [8,14]. Here, the skin friction coefficient was normalized by C f , r e f (i.e., the value of C f at 95% of the smooth strip). The position was normalized by either the open channel height δ in the numerical simulations or the boundary layer thickness δ b l at the transition location in the experiments. It is worth noting a substantial difference in the C f prediction between the two experimental datasets. The experiments by Chamorro and Porté-Agel [8] were carried out at a higher Reynolds number of R e = U δ b l / ν 273 , 000 (where U is the freestream velocity), while the equivalent sand grain roughness height was k s + 479 (evaluated at the end of the rough-to-smooth transition). The experiments by Li et al. [14], on the other hand, were performed at R e 110,000 with k s + 130 at the same location. In addition, the measurement techniques were different, as near-wall hot wire measurements were performed in [8], whereas oil-film interferometry (OFI) was used in [14]. Because both experimental techniques take information within the viscous sublayer, they were expected to give approximately the same results. Therefore, differences may be attributed to the discrepancy in the Reynolds number and equivalent sand grain roughness height, as was also conjectured by Li et al. [14]. In the present simulations, the freestream Reynolds number at the transition location was R e = U δ / ν 142,000 (where for a channel flow, U is the centerline velocity), and as mentioned in the previous section, k s + = 130 . In this way, since the current flow conditions were much closer to those used in [14], one would expect better agreement with this experimental dataset.
The normalization by C f , r e f removed the discrepancies due to errors in the prediction of the fully developed roughness, highlighting the response of the models to the change in the BC. The roughness modeling did not affect the recovery length significantly. The WMLES accurately reproduced the recovery of the skin friction coefficient at the flow conditions in [14]. The IDDES predictions, however, agreed better with the higher- R e results. The reason for this difference will be discussed later. Another distinction between the IDDES and WMLES is the fact that in the WMLES, the wall stress depended on the velocity at the interface. The BC change did not affect the velocity at the interface immediately but required some downstream distance to penetrate to the height of the interface. In other words, with WMLES, the wall stress has memory of the upstream flow. In the IDDES, on the other hand, the BC transition was immediately felt throughout the layer because of the model modifications. This issue will be discussed in Section 3.4. Furthermore, as will be shown later, the Reynolds shear stress predicted by the IDDES was higher than that obtained by the WMLES, as the enhanced mixing caused the mean velocity profile to be flatter and the wall stress to increase.

3.3. Mean Velocity

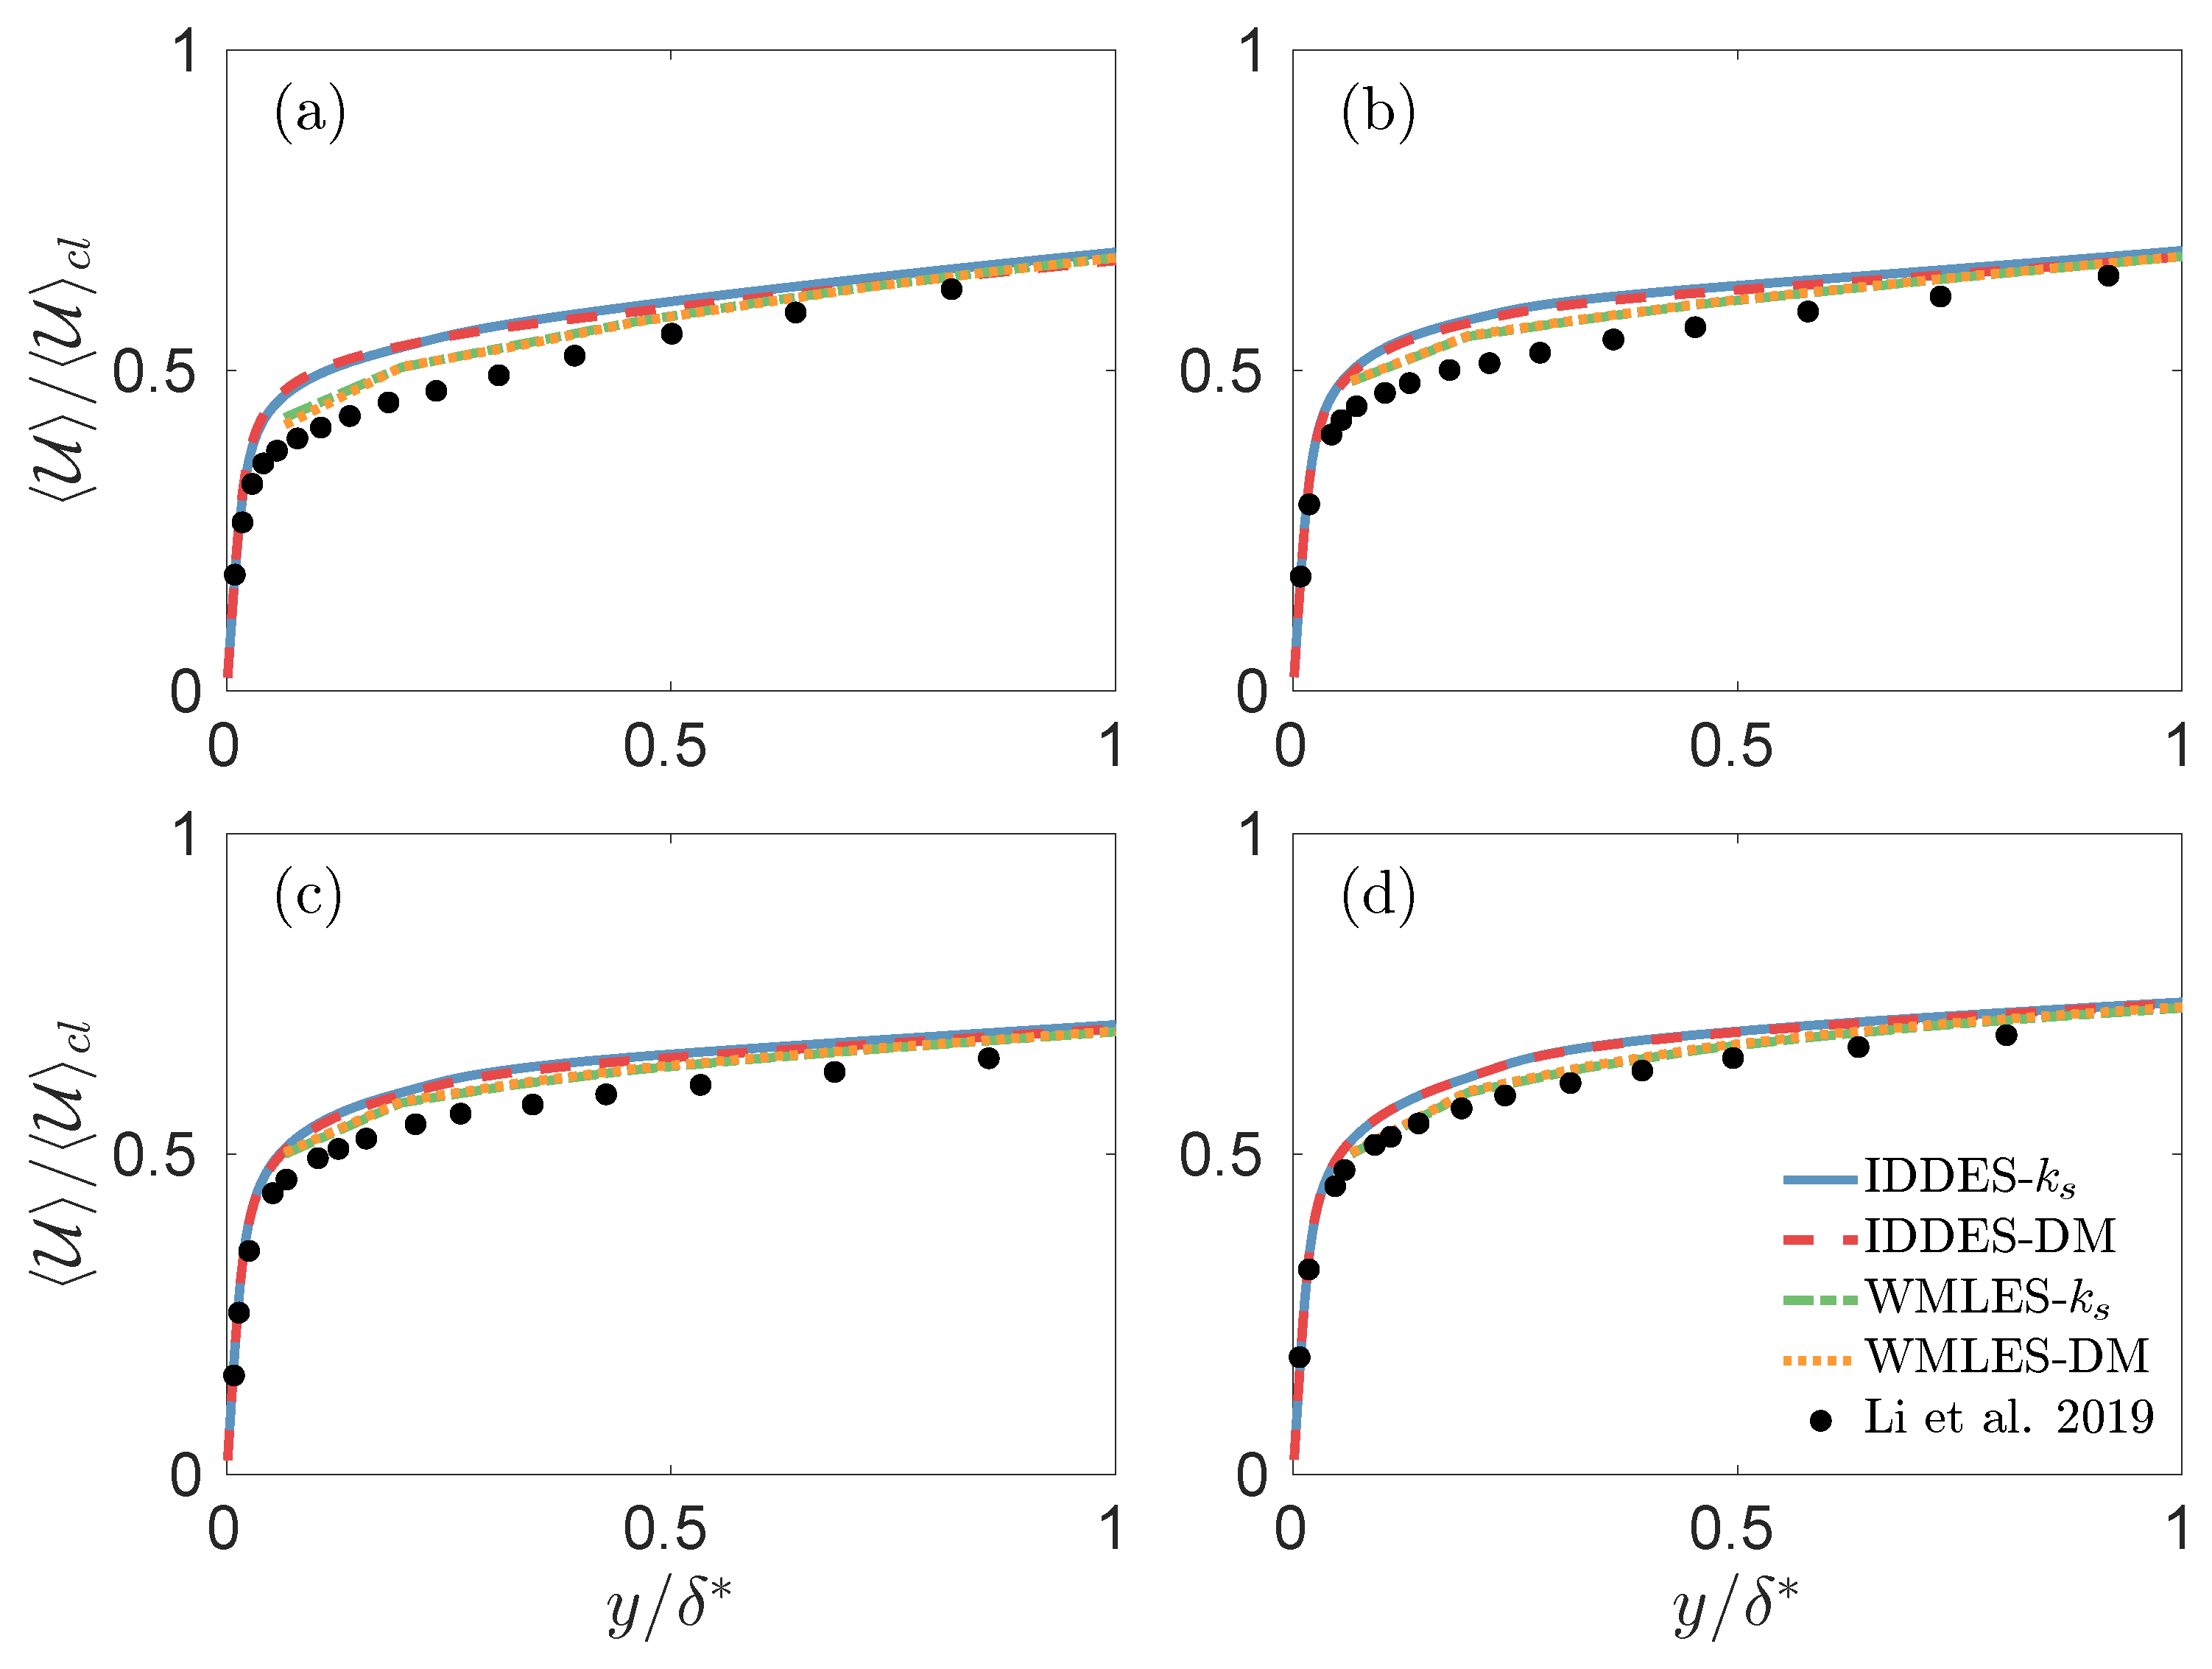
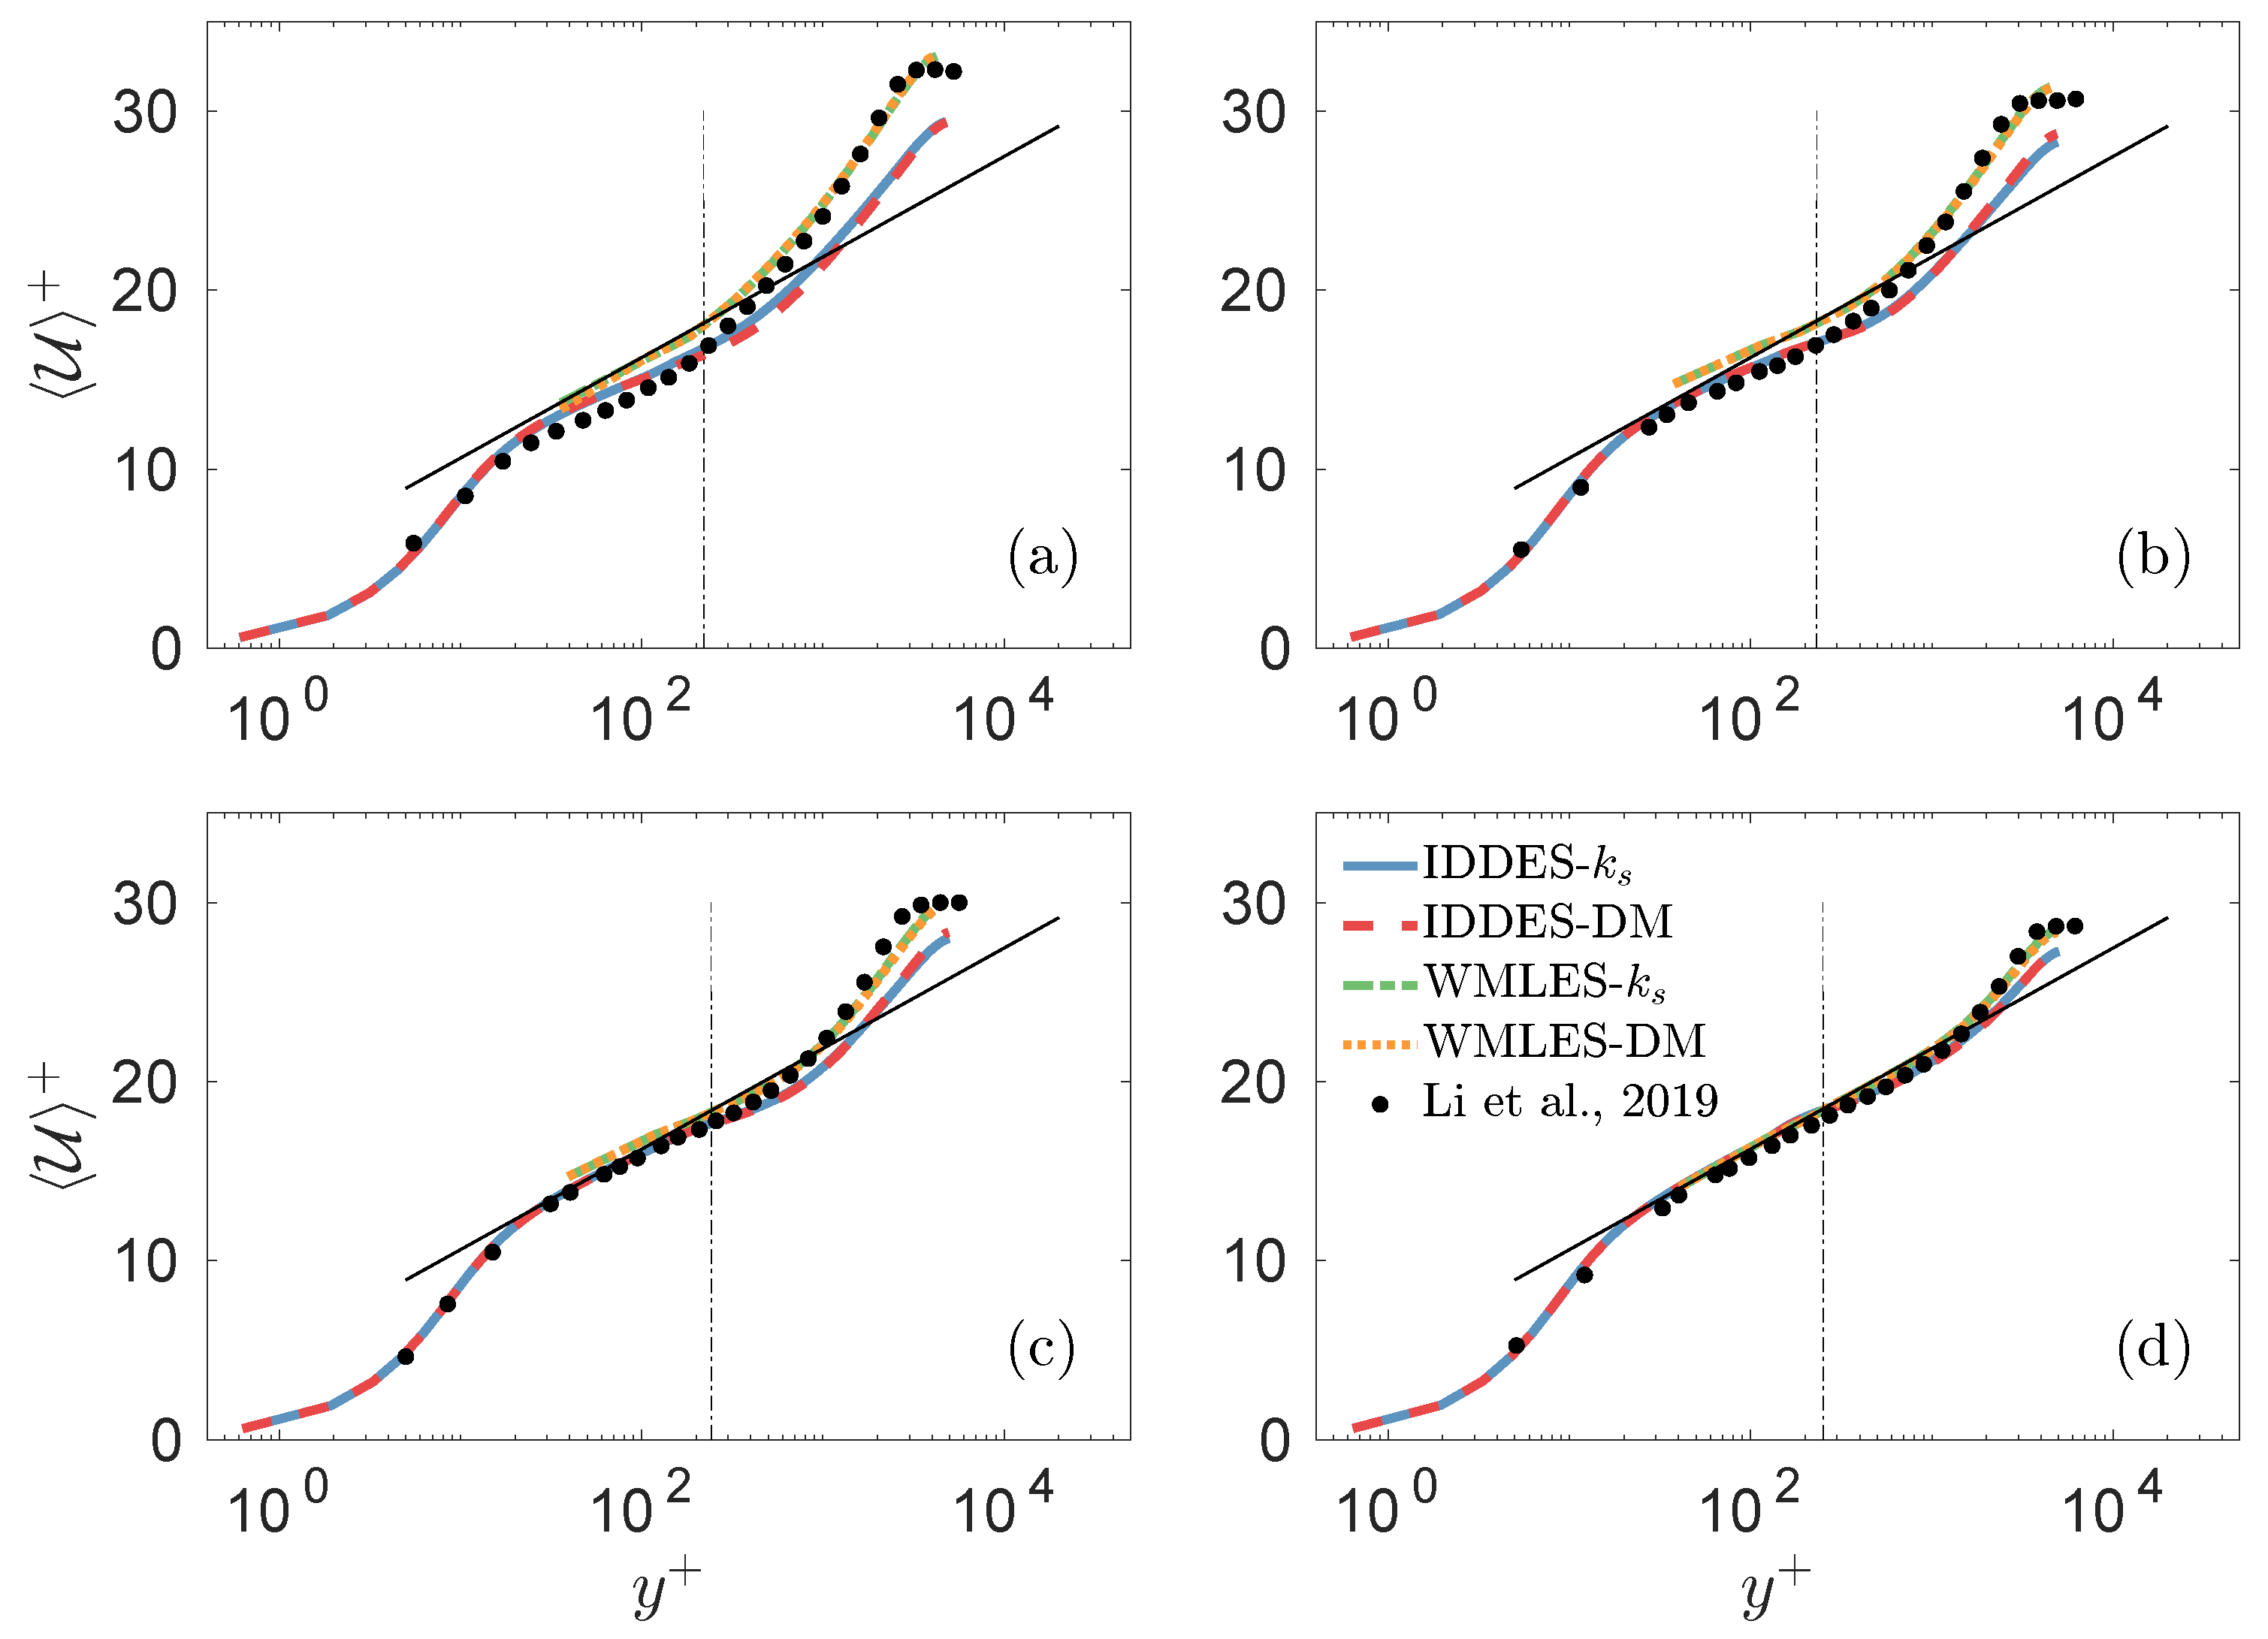
The mean velocity profiles are shown in Figure 6 and Figure 7. In the first figure, the velocity is plotted in the outer units (i.e., normalized by the center-line velocity U c l ) as a function of y / δ * . Four streamwise locations after the transition were considered. The closer prediction of the skin friction coefficient obtained with WMLES was accompanied by better agreement with the experimental data in [14] in terms of the mean velocity profiles as well. The velocity profiles obtained from the IDDES were flatter, reflecting the overpredition of the wall stress due to its faster recovery (observed in Figure 5). In particular, a region of a higher velocity is visible near the wall (Figure 6). Regarding roughness modeling, little difference was observed between the drag force method and the model modifications. The mean velocity profiles in the inner units, i.e., U + = U / u τ and y + = y u τ / ν , where u τ represents the local friction velocity depending on the x position, are shown in Figure 7. Apparently, in the experiments, the flow preserved some memory of the rough wall condition even after the transition, as evidenced by the presence of a downward displacement of the logarithmic layer (the roughness function) at the first location. The boundary condition in Equation (6), on the other hand, forced the WMLES to match the standard log law at the interface. As a consequence, the reversion to the equilibrium log law was immediate. Above the interface, however, the velocity profile was parallel to the experimental one, reflecting the fact that the error was due to the incorrect wall stress prediction, while the outer flow was captured accurately. The IDDES did not suffer from the same constraint. However, the shift of the log law was not as significant as in the experiments, again indicating a faster recovery toward equilibrium.

3.4. Eddy Viscosity and Reynolds Stresses

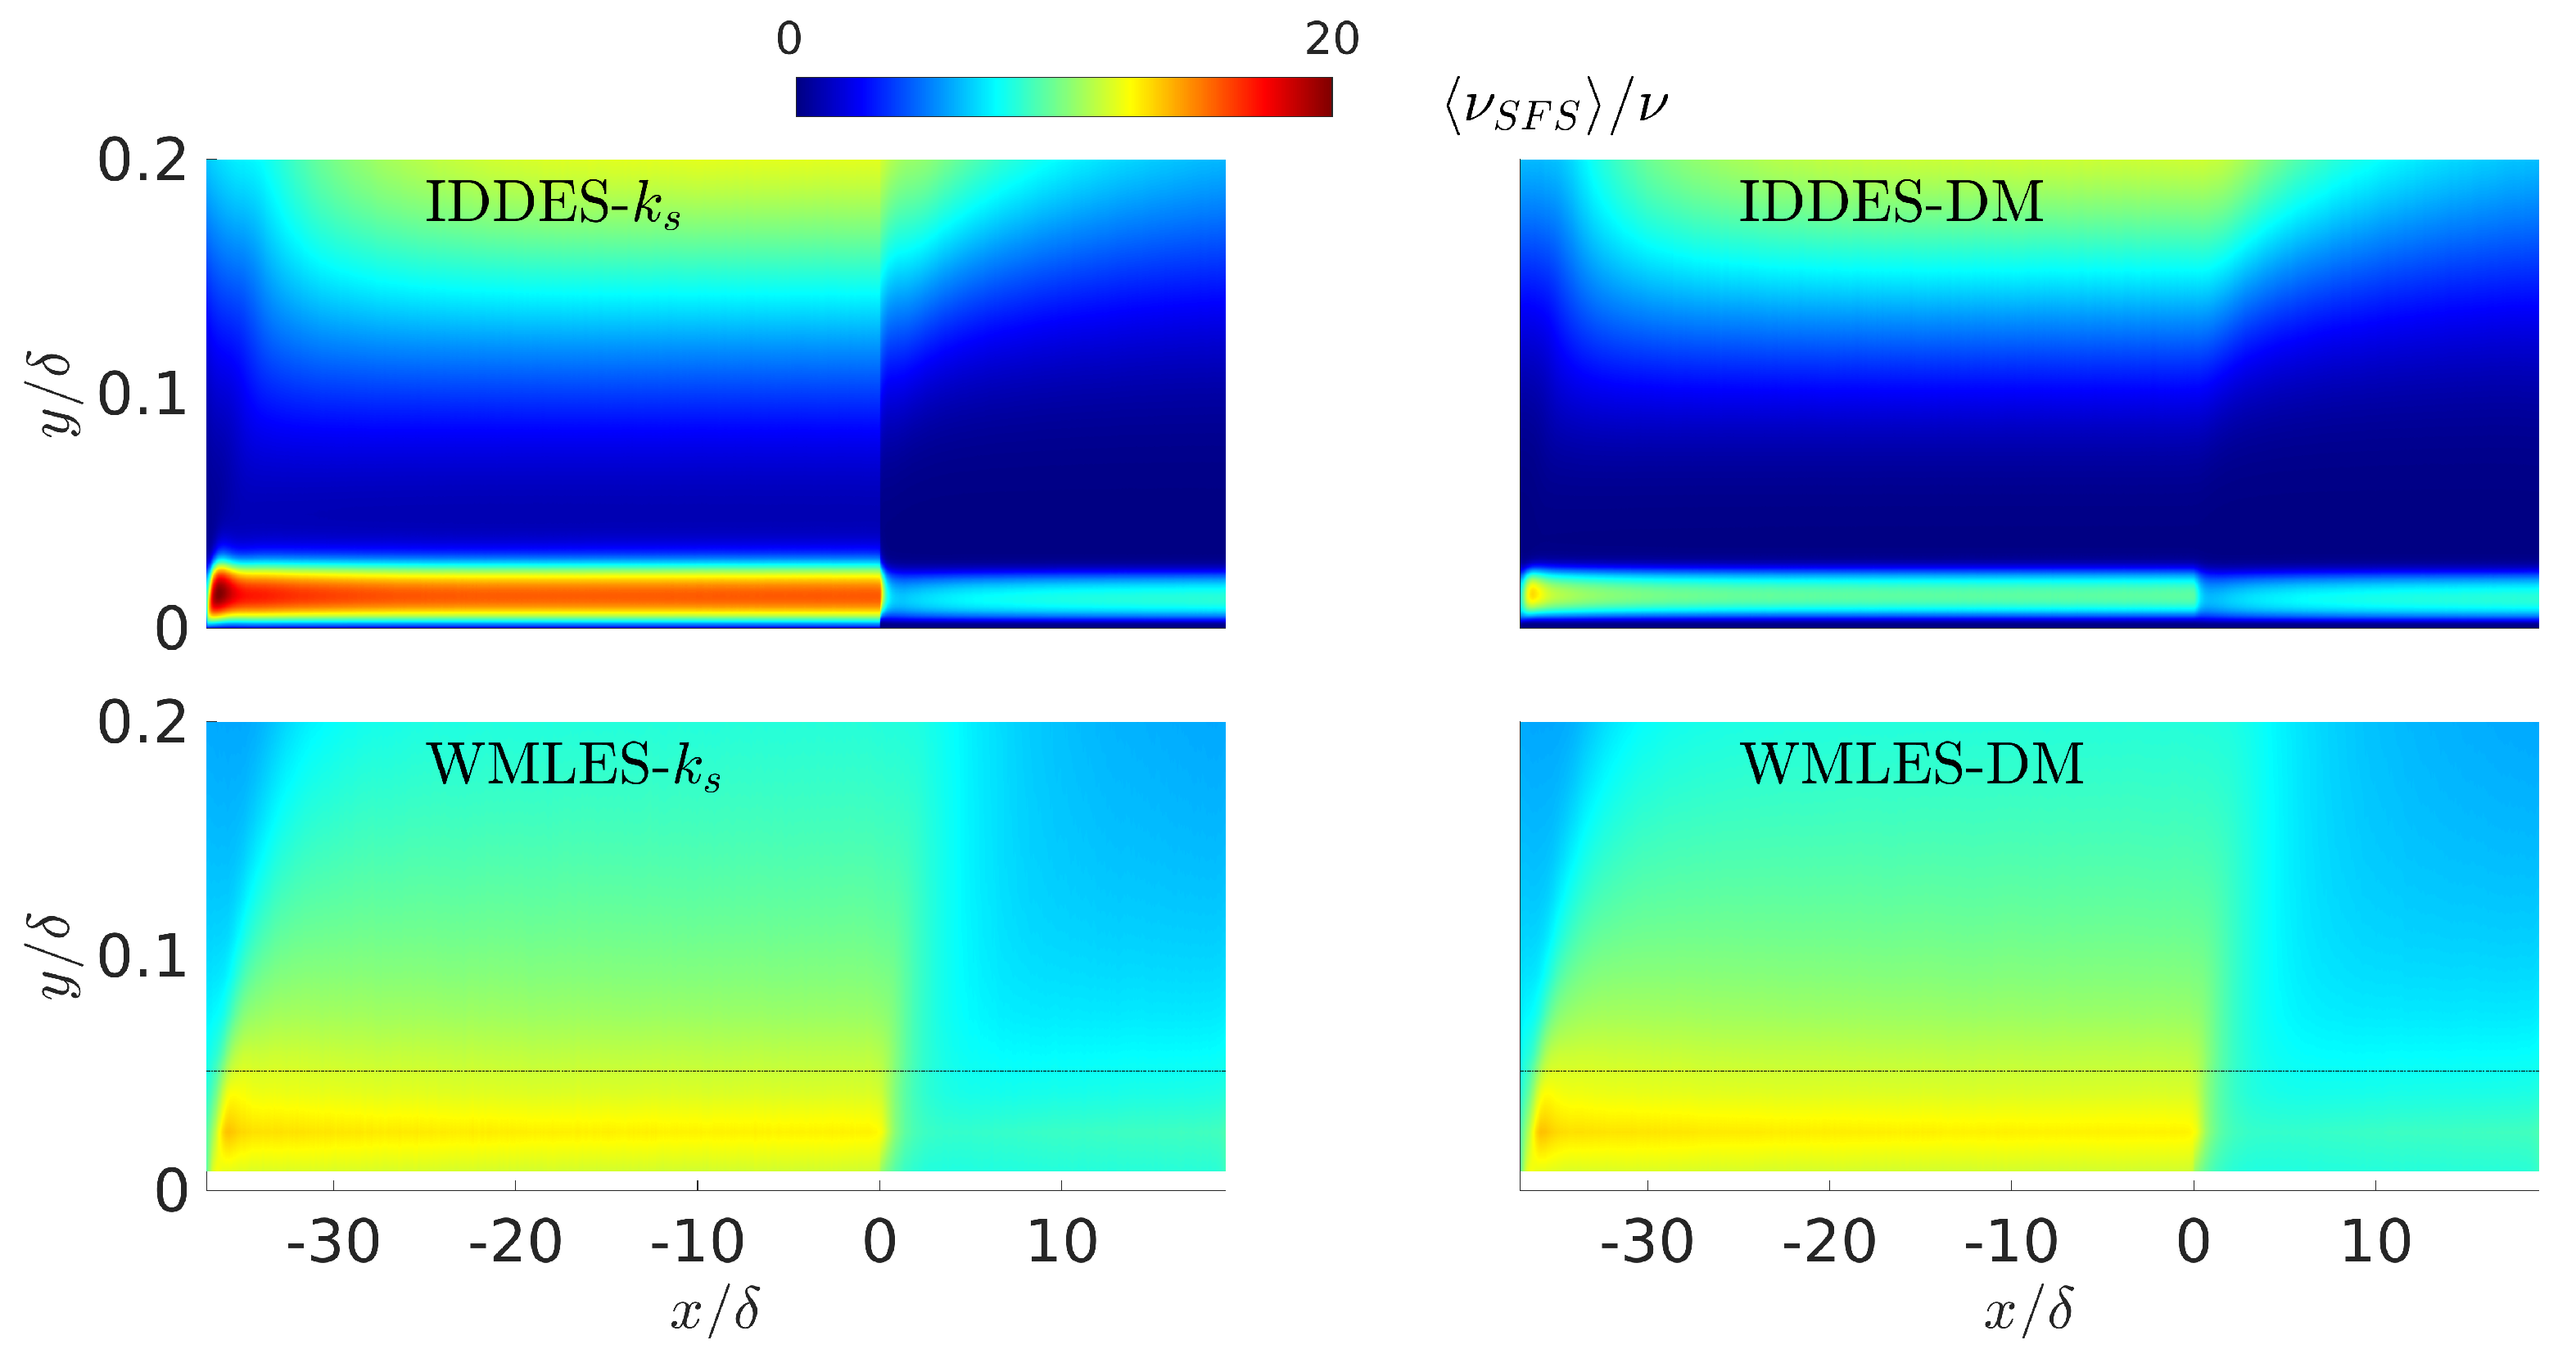
To better understand the difference between the two different turbulence modeling approaches, in Figure 8, the contour maps of the normalized eddy viscosity ν T / ν are shown. It should be pointed out that ν T represents the subfilter-scale eddies only in the WMLES calculations, while it parameterized the effect of all the eddies in the RANS region of the IDDES, although only the subfilter ones in the outer LES zone. As far as IDDES are concerned, the roughness modifications employed by the IDDES- k s enhanced the eddy viscosity level close to the wall. At the rough-to-smooth interface, the model changed abruptly as the roughness modifications were removed, resulting in a discontinuous eddy viscosity field. On the contrary, when the drag model was used for the IDDES-DM, the eddy viscosity smoothly varied across the interface. Very close to the wall, ν T increased slightly because of the near-wall flow acceleration, which was due to the removal of the forcing term outside of the roughness zone. This change, which occurred suddenly, affected the model’s length scale, which depended on both the grid size and the solution itself (see the discussion in Section 2 of [37]). Practically, for the IDDES-DM, the sudden change in roughness modified the eddy viscosity indirectly (affecting the velocity, which in turn changed the length scale and thus ν T ). Therefore, the variation was weaker than that for the IDDES- k s , where the model modifications directly affected the modeled eddy viscosity.
In the WMLES, on the other hand, the eddy viscosity field was continuous, and a decrease was observed at the interface, reflecting the mean velocity changes. Note that the form of the eddy viscosity model did not change at the interface, and ν T reacted only to the velocity changes. Most of these effects occurred below the inner/outer layer interface.
Furthermore, Figure 9 shows the eddy viscosity profiles near the rough-to-smooth interface at four different streamwise locations. At the end of the roughness strip, where a quasi-equilibrium rough wall flow condition was reached, the ν T predicted by the IDDES- k s was significantly higher than that for the IDDES-DM, as can be seen in Figure 9a. In fact, in the former case, the increased drag due to roughness was entirely accounted for by the wall shear stress definition:
τ w = ( ν + ν T ) U y | y = 0 ,
where, since ν T > 0 at the wall, the modeled eddy viscosity leads to increased friction. On the other hand, for the drag-model case where ν T = 0 at the wall, the additional force (Equation (8)) supplies the drag due to the roughness elements, while the turbulence model is not directly modified. Since both approaches were calibrated using Nikuradze’s data [1], they provided the same effective drag and the same velocity profile. Immediately after the interface, in the IDDES- k s , the eddy viscosity at the wall changed from a finite value to zero, as illustrated in Figure 9b, and took on very low values, especially for y / δ 0.01 . Since this region was in the RANS zone, a lower ν T implied decreased total stress, which resulted in the flow acceleration near the wall (and led to the excessively rapid increase in C f observed in Figure 5). Within a sort distance (less than half the height of a channel), as illustrated in Figure 9d, ν T fell below the smooth wall value in the RANS region while it was relatively unchanged in the LES zone. This fact also contributed to the higher velocity further from the wall observed in Figure 6. For x ^ / δ 1 , the value of ν T predicted with the two approaches was the same, and the equilibrium smooth wall condition was achieved within 8 δ . The WMLES, as observed before, had a much more gradual response to the change in the surface roughness, since the changed BC did not affect the outer flow for some distance. The fact that memory of the upstream conditions was maintained allowed a more accurate prediction of the eddy viscosity and velocity.
Figure 10 shows the streamwise development of various quantities of interest near the rough-to-smooth interface. Two y positions were chosen for the IDDES solutions: one very close to the wall and another one in the outer LES zone. Near the wall, the mean velocity predicted by the IDDES in Figure 10a showed the sudden acceleration discussed in Section 3.3. A smoother behavior only occurred further away from the wall. The eddy viscosity behaviors discussed earlier are perhaps most clearly shown in Figure 10b. Note the jump in ν T , which becomes less significant away from the wall.
Considering the Reynolds shear stress, in the IDDES- k s , the discontinuous eddy viscosity led to the jump in the modeled stress. The point closest to the wall was in the RANS region, and the modeled stress was predominant. The increase in resolved shear stress u v immediately after the interface, which can be observed in Figure 10c, was insufficient to balance it. The total stress reached the values expected for a smooth wall very quickly, as shown in Figure 10d. This decrease, as mentioned above, caused the flow acceleration downstream of the interface. On the other hand, in the WMLES case, the eddy viscosity and thus the total stress were continuous across the interface while decreasing quite slowly downstream, which reflects the decreased turbulence level over the smooth wall. As a consequence, the flow acceleration was milder, as illustrated in Figure 10a.
Similar but reversed behaviors can be observed for the smooth-to-rough transition. The eddy viscosity predicted by the IDDES- k s had an upward jump that was not balanced by the reduction in resolved shear stress, and the flow decelerated in the near-wall region. This sharp velocity gradient immediately drove the flow toward rough conditions in the near-wall region (Figure 4b), leading to a faster recovery for C f than what occurred for the WMLES. As explained in Section 3.2, since the outer region is less affected by the rapid changes experienced near the wall in WMLES, the flow requires more time to readjust, forcing the near-wall region to further accelerate and creating the dip shown in Figure 3.

4. Conclusions

Two modeling approaches (i.e., the log law-based wall-modeled large-eddy simulations (WMLES) and the improved delayed detached-eddy simulations (IDDES)), were used to predict the flow over alternating rough and smooth strips oriented normally to the mean stream in an open-channel configuration. Comparisons with experimental data highlighted that the WMLES captured the recovery of the skin friction to equilibrium flow conditions downstream of the rough-to-smooth transition and predicted fairly accurately the mean velocity profile. However, being constrained to match the log law at the inner/outer layer interface, the WMLES were unable to reproduce the variation in the roughness function after the rough-to-smooth transition. The IDDES predicted a much faster recovery for both the mean velocity and the skin friction.
In the IDDES, there was a strong coupling between the boundary conditions and the modeled eddy viscosity, particularly if both the model and boundary conditions were modified to account for the roughness. This coupling resulted in the excessively rapid variation in the Reynolds shear stress and a disproportionate flow acceleration (on the rough-to-smooth interface) or deceleration (on the smooth-to-rough surface), which resulted in too rapid a return to equilibrium. In terms of the mean velocity profile normalized in the inner units, the IDDES were not constrained to match the log law as the WMLES were, and they should be able to predict the recovery of the roughness function to the zero equilibrium value of the smooth strip, as provided by the experiments. However, because of the excessively rapid return to equilibrium, the readjustment of the roughness function was incorrectly predicted with IDDES. In the WMLES, on the other hand, the wall shear stress was calculated based on the outer layer information. Because of this, the perturbation introduced by the change in the boundary condition must propagate away from the wall before the wall model reacts. The WMLES effectively retained memory of the upstream conditions, producing a smooth recovery of the modeled shear-stress and skin friction coefficient.
When comparing the two approaches to roughness modeling, they gave essentially the same results, which largely depends on the fact that both approaches are calibrated to match Nikuradze’s data [1]. The drag model, which is much simpler to implement, appears to be very promising, even if additional studies in different configurations are needed to reach more general conclusions.
Finally, in the present arrangement of roughness strips, the WMLES were found to give better prediction of the flow field than IDDES. In addition, IDDES have a much higher computational cost, and the model length scale appears to be extremely sensitive to the flow conditions. However, since log law-based WMLES are not expected to be accurate in other complex flow configurations (in the presence of strong pressure gradients or flow separation, for instance), the development and testing of wall models that have memory of the upstream conditions (such as the one recently proposed by Fowler et al. [40]) is desirable.

Author Contributions

Conceptualization, T.S., U.P. and G.D.; methodology, T.S. and U.P.; software, T.S.; validation, T.S., U.P. and G.D.; formal analysis, T.S., U.P. and G.D.; investigation, T.S., U.P. and G.D.; resources, U.P. and G.D.; data curation, T.S. and U.P.; writing—original draft preparation, T.S. and U.P.; writing—review and editing, U.P. and G.D.; supervision, U.P. and G.D.; project administration, U.P. and G.D.; funding acquisition, G.D. and U.P. All authors have read and agreed to the published version of the manuscript.

Funding

U.P. acknowledges financial support from the Natural Sciences and Engineering Research Council (NSERC) of Canada under the Discovery Grant program.

Data Availability Statement

The data presented in this study are available on request from the corresponding author. The data are not publicly available due to size of data sets.

Acknowledgments

The authors acknowledge the computational support by CINECA under the ISCRA initiative (Project HP10BSBCBZ) and by Alliance-Compute Canada.

Conflicts of Interest

The authors declare no conflict of interest.

Abbreviations

The following abbreviations are used in this manuscript:
BCboundary condition
DNSdirect numerical simulation
IDDESimproved delayed detached-eddy simulation
LESlarge-eddy simulation
RANSReynolds-averaged Navier–Stokes
SASpalart–Allmaras
SFSsubfilter scale
WMLESwall-modeled large-eddy simulation
WRLESwall-resolved large-eddy simulation

References

  1. Nikuradse, J. Strömungsgesetze in Rauhen Rohren. VDI-Forschungsheft 1933, 361, 1–64. [Google Scholar]
  2. Raupach, M.R.; Antonia, R.A.; Rajagopalan, S. Rough-wall boundary layers. Appl. Mech. Rev. 1991, 44, 1–25. [Google Scholar] [CrossRef]
  3. Jiménez, J. Turbulent flows over rough walls. Annu. Rev. Fluid Mech. 2004, 36, 173–196. [Google Scholar] [CrossRef]
  4. Colebrook, C.F. Turbulent flow in pipes, with particular reference to the transition region between smooth and rough pipe laws. J. Inst. Civ. Eng. 1939, 11, 133–156. [Google Scholar] [CrossRef]
  5. Shafi, H.S.; Antonia, R.A. Anisotropy of the Reynolds stresses in a turbulent boundary layer on a rough wall. Exp. Fluids 1995, 18, 213–215. [Google Scholar] [CrossRef]
  6. Finnigan, J. Turbulence in plant canopies. Annu. Rev. Fluid Mech. 2000, 32, 519–571. [Google Scholar] [CrossRef]
  7. Cheng, H.; Castro, I.P. Near-wall flow development after a step change in surface roughness. Bound. Layer Meteorol. 2002, 105, 411–432. [Google Scholar] [CrossRef]
  8. Chamorro, L.P.; Porté-Agel, F. Velocity and surface shear stress distributions behind a rough-to-smooth surface transition: A simple new model. Bound. Layer Meteorol. 2009, 130, 29–41. [Google Scholar] [CrossRef] [Green Version]
  9. Garratt, J.R. The internal boundary layer—A review. Bound. Layer Meteorol. 1990, 50, 171–203. [Google Scholar] [CrossRef]
  10. Bradley, E.F. A micrometeorological study of velocity profiles and surface drag in the region modified by a change in surface roughness. Q. J. R. Meteorol. Soc. 1968, 94, 361–379. [Google Scholar] [CrossRef]
  11. Antonia, R.A.; Luxton, R.E. The response of a turbulent boundary layer to a step change in surface roughness. Part 1. Smooth to rough. J. Fluid Mech. 1971, 48, 721–761. [Google Scholar] [CrossRef]
  12. Antonia, R.A.; Luxton, R.E. The response of a turbulent boundary layer to a step change in surface roughness. Part 2. Rough to smooth. J. Fluid Mech. 1972, 53, 737–757. [Google Scholar] [CrossRef]
  13. Hanson, R.E.; Ganapathisubramani, B. Development of turbulent boundary layers past a step change in wall roughness. J. Fluid Mech. 2016, 795, 494–523. [Google Scholar] [CrossRef] [Green Version]
  14. Li, M.; de Silva, C.M.; Rouhi, A.; Baidya, R.; Chung, D.; Marusic, I.; Hutchins, N. Recovery of wall-shear stress to equilibrium flow conditions after a rough-to-smooth step change in turbulent boundary layers. J. Fluid Mech. 2019, 872, 472–491. [Google Scholar] [CrossRef]
  15. Bou-Zeid, E.; Meneveau, C.; Parlange, M.B. Large-eddy simulation of neutral atmospheric boundary layer flow over heterogeneous surfaces: Blending height and effective surface roughness. Water Resour. Res. 2004, 40, W02505. [Google Scholar] [CrossRef] [Green Version]
  16. Abkar, M.; Porté-Agel, F. A new boundary condition for large-eddy simulation of boundary-layer flow over surface roughness transitions. J. Turbul. 2012, 13, N23. [Google Scholar] [CrossRef]
  17. Saito, N.; Pullin, D.I. Large eddy simulation of smooth–rough–smooth transitions in turbulent channel flows. Int. J. Heat Mass Trans. 2014, 78, 707–720. [Google Scholar] [CrossRef]
  18. Ismail, U.; Zaki, T.A.; Durbin, P.A. The effect of cube-roughened walls on the response of rough-to-smooth (RTS) turbulent channel flows. Int. J. Heat Fluid Flow 2018, 72, 174–185. [Google Scholar] [CrossRef]
  19. Ismail, U.; Zaki, T.A.; Durbin, P.A. Simulations of rib-roughened rough-to-smooth turbulent channel flows. J. Fluid Mech. 2018, 843, 419–449. [Google Scholar] [CrossRef] [Green Version]
  20. Wilcox, D.C. Reassessment of the scale-determining equation for advanced turbulence models. AIAA J. 1988, 26, 1299–1310. [Google Scholar] [CrossRef]
  21. Hellsten, A.; Laine, S. Extension of the k-omega-SST turbulence model for flows over rough surfaces. In Proceedings of the 22nd AIAA Atmospheric Flight Mechanics Conference, New Orleans, LA, USA, 11–13 August 1997. [Google Scholar]
  22. Knopp, T.; Eisfeld, B.; Calvo, J.B. A new extension for k-ω turbulence models to account for wall roughness. Int. J. Heat Fluid Flow 2009, 30, 54–65. [Google Scholar] [CrossRef]
  23. Aupoix, B.; Spalart, P.R. Extensions of the Spalart–Allmaras turbulence model to account for wall roughness. Int. J. Heat Fluid Flow 2003, 24, 454–462. [Google Scholar] [CrossRef]
  24. Aupoix, B. Roughness corrections for the k-ω shear stress transport model: Status and proposals. ASME J. Fluids Eng. 2015, 137, 021202. [Google Scholar] [CrossRef]
  25. Dutta, R.; Nicolle, J.; Giroux, A.M.; Piomelli, U. Evaluation of turbulence models in rough-wall boundary layers for hydroelectric application. Int. J. Fluid Mach. Sys. 2017, 10, 228–239. [Google Scholar] [CrossRef]
  26. Piomelli, U.; Balaras, E. Wall-layer models for large-eddy simulations. Annu. Rev. Fluid Mech. 2002, 34, 349–374. [Google Scholar] [CrossRef] [Green Version]
  27. Piomelli, U. Wall-layer models for large-eddy simulations. Prog. Aerosp. Sci. 2008, 44, 437–446. [Google Scholar] [CrossRef]
  28. Larsson, J.; Kawai, S.; Bodart, J.; Bermejo-Moreno, I. Large eddy simulation with modeled wall-stress: Recent progress and future directions. Mech. Eng. Rev. 2016, 3, 1–23. [Google Scholar] [CrossRef] [Green Version]
  29. Bose, S.T.; Park, G.I. Wall-modeled large-eddy simulation for complex turbulent flows. Annu. Rev. Fluid Mech. 2018, 50, 535–561. [Google Scholar] [CrossRef]
  30. Spalart, P.R. Detached-Eddy Simulation. Annu. Rev. Fluid Mech. 2009, 41, 181–202. [Google Scholar] [CrossRef]
  31. Heinz, S. A review of hybrid RANS-LES methods for turbulent flows: Concepts and applications. Prog. Aerosp. Sci. 2020, 114, 100597. [Google Scholar] [CrossRef]
  32. Bou-Zeid, E.; Parlange, M.B.; Meneveau, C. On the parameterization of surface roughness at regional scales. J. Atmos. Sci. 2007, 64, 216–227. [Google Scholar] [CrossRef]
  33. Varghese, J.; Durbin, P.A. Representing surface roughness in eddy resolving simulation. J. Fluid Mech. 2020, 897, A10. [Google Scholar] [CrossRef]
  34. Vreman, A.W. An eddy-viscosity subgrid-scale model for turbulent shear flow: Algebraic theory and applications. Phys. Fluids 2004, 16, 3670–3681. [Google Scholar] [CrossRef]
  35. Travin, A.K.; Shur, M.L.; Spalart, P.R.; Strelets, M.K. Improvement of delayed detached-eddy simulation for LES with wall modelling. In Proceedings of the European Conference on Computational Fluid Dynamics ECCOMAS CFD 2006, Bergen, The Netherlands, 5–8 September 2006; Wesseling, P., Oñate, E., Pèriaux, J., Eds.; TU Delft: Delft, The Netherlands, 2006; pp. 410–432. [Google Scholar]
  36. Spalart, P.R.; Allmaras, S.R. A one-equation turbulence model for aerodynamic flows. Rech. Aerosp. 1994, 1, 5–21. [Google Scholar]
  37. Shur, M.L.; Spalart, P.R.; Strelets, M.K.; Travin, A.K. A hybrid RANS/LES model with delayed DES and wall-modeled LES capabilities. Int. J. Heat Fluid Flow 2008, 29, 1638–1649. [Google Scholar] [CrossRef]
  38. Schumann, U. Subgrid-scale model for finite difference simulation of turbulent flows in plane channels and annuli. J. Comput. Phys. 1975, 18, 376–404. [Google Scholar] [CrossRef] [Green Version]
  39. Kawai, S.; Larsson, J. Wall-modeling in large eddy simulation: Length scales, grid resolution, and accuracy. Phys. Fluids 2012, 24, 015105. [Google Scholar] [CrossRef]
  40. Fowler, M.; Zaki, T.A.; Meneveau, C. A Lagrangian relaxation towards equilibrium wall model for large eddy simulation. J. Fluid Mech. 2022, 934, 1–37. [Google Scholar] [CrossRef]
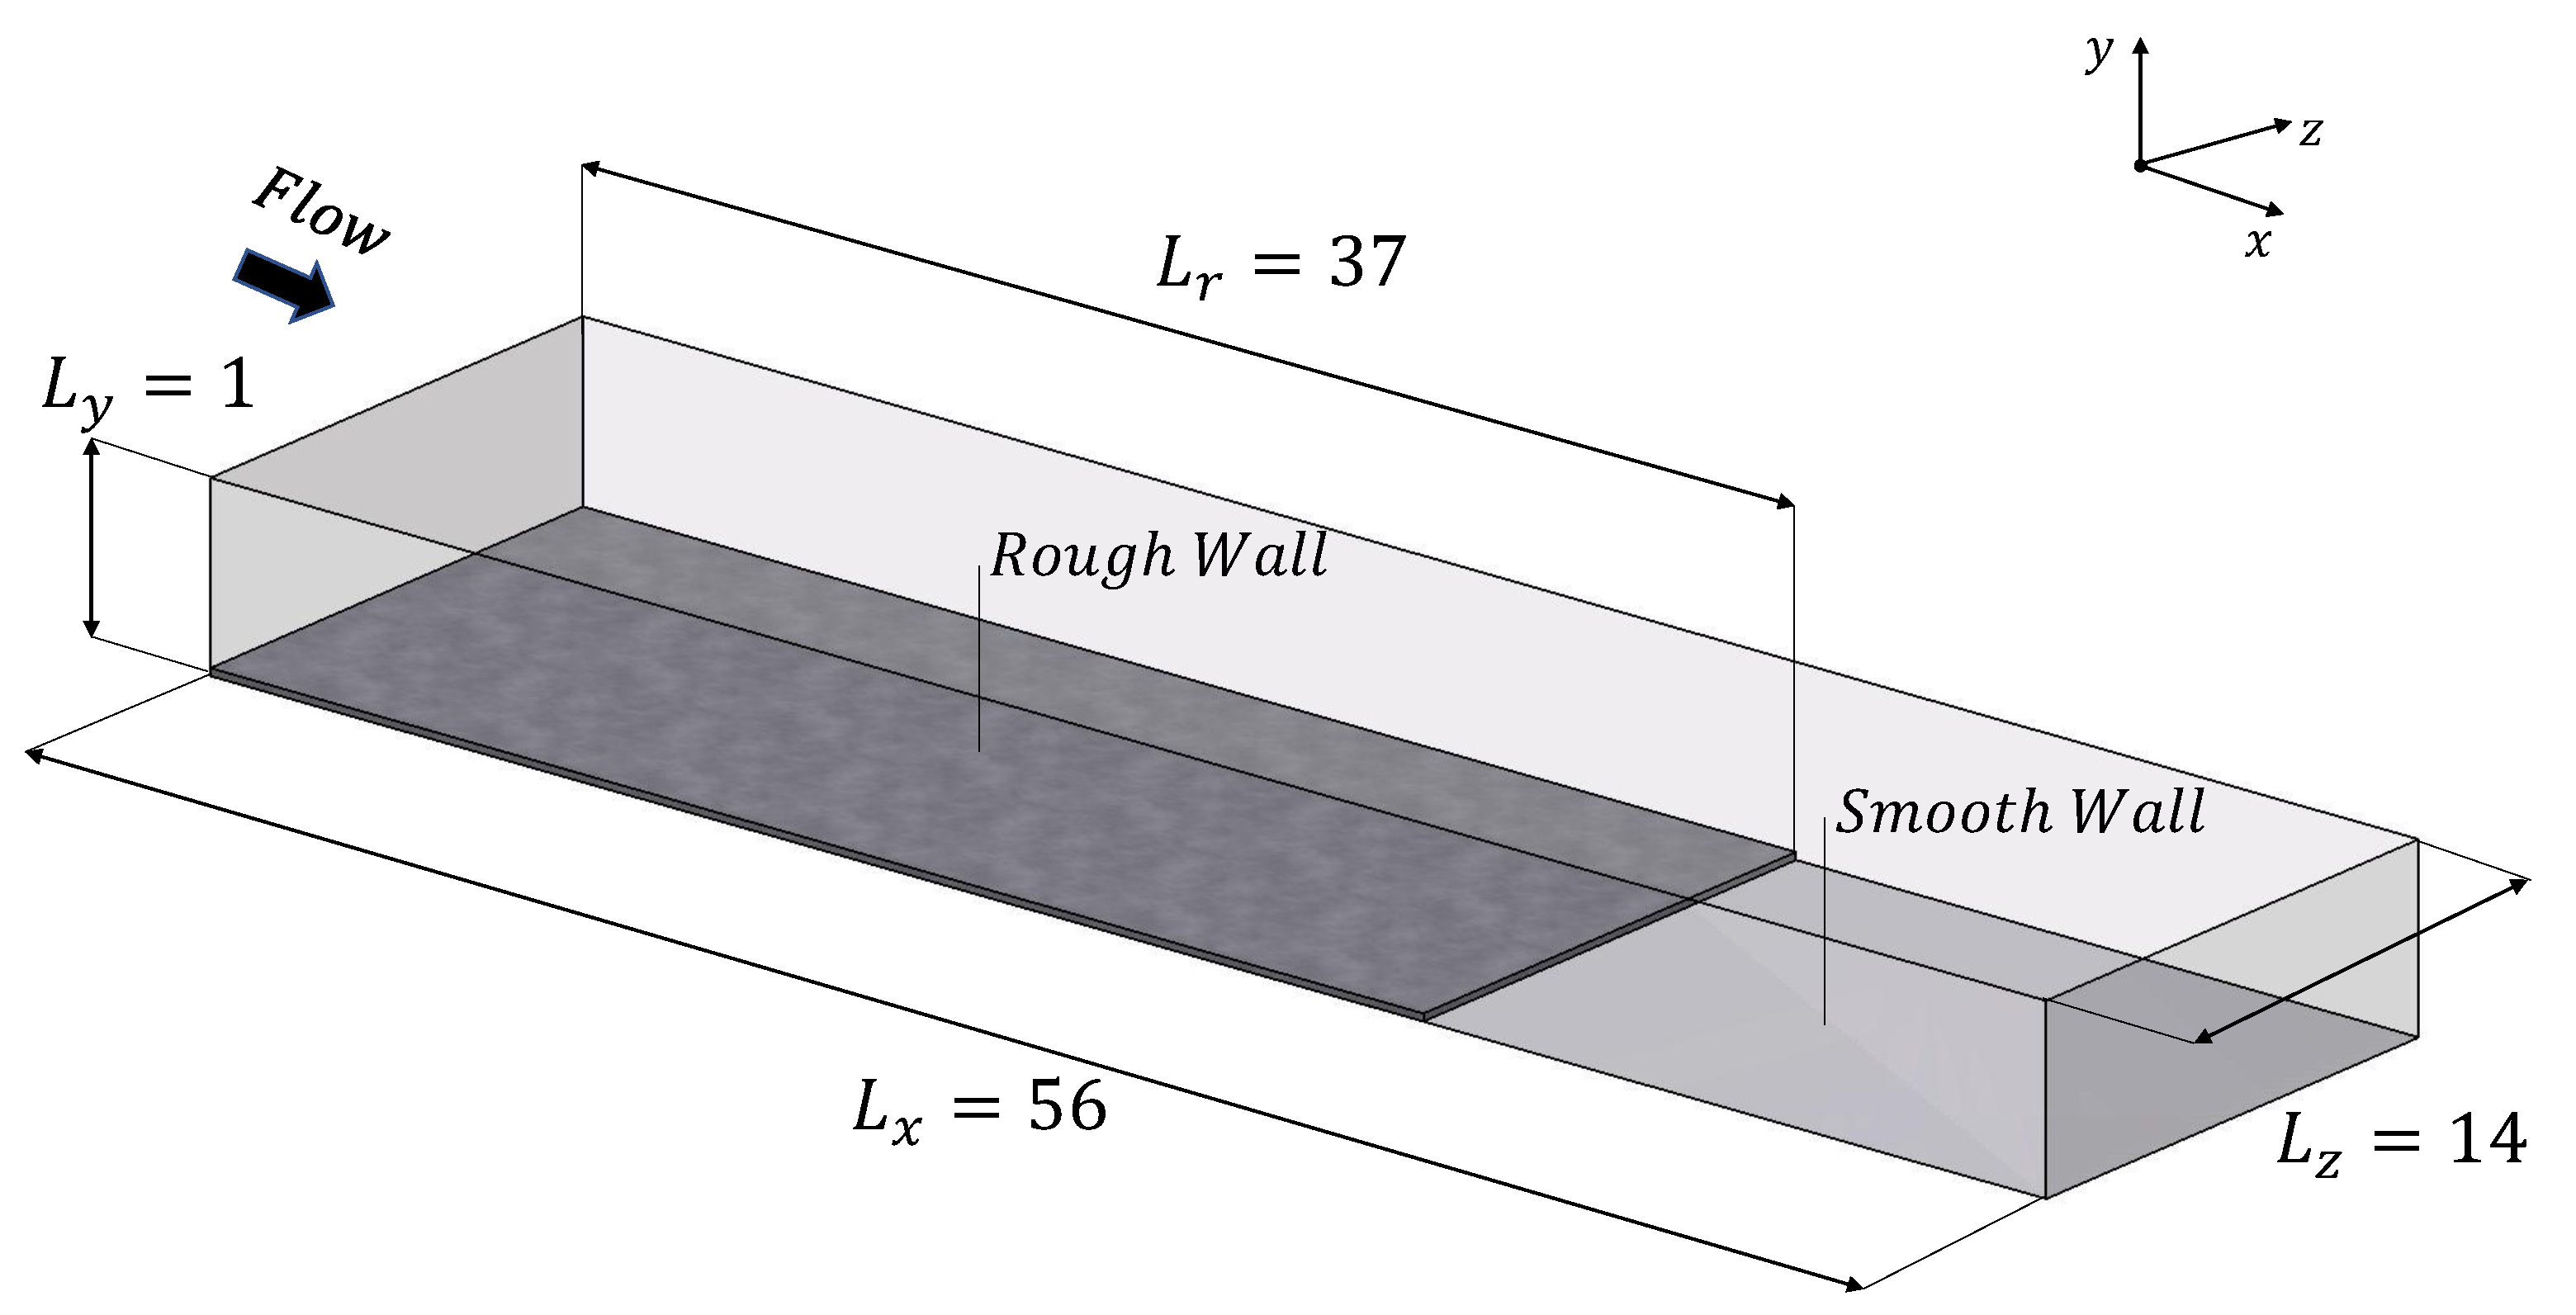
Figure 1. Sketch of the computational domain (not to scale).
Fluids 08 00010 g001
Figure 2. WMLES grid convergence study: mean velocity profiles at 95 % of the length of the (left) rough and (right) smooth strips. Normalization is carried out with the center line velocity U c l and the displacement thickness δ * .
Fluids 08 00010 g002
Figure 3. Skin friction coefficient development over rough and smooth strips.
Fluids 08 00010 g003
Figure 4. IDDES- k s model: mean velocity profile at the locations shown in the insets, compared with the mean velocity profile at the rough reference location. The different positions are located: (a) before the dip, (b) at the dip, (c) at the crest, (d) after the crest.
Fluids 08 00010 g004
Figure 5. Normalized skin friction coefficient on the smooth strip compared with experimental results [8,14].
Fluids 08 00010 g005
Figure 6. Mean velocity profiles in outer units at (a) 3%, (b) 10%, (c) 19% and (d) 63% of the length of the smooth strip compared with experimental results [14].
Fluids 08 00010 g006
Figure 7. Mean velocity profiles in inner units at (a) 3%, (b) 10%, (c) 19% and (d) 63% of the length of the smooth strip. The thin line represents the log law (6), and the vertical dashed line represents the location of the inner/outer layer interface for WMLES [14].
Fluids 08 00010 g007
Figure 8. Contours of eddy viscosity normalized by the fluid viscosity. The horizontal dashed line indicates the location of the inner/outer layer interface for WMLES.
Fluids 08 00010 g008
Figure 9. Profiles of the normalized eddy viscosity ν T / ν near the rough-to-smooth interface at (a) 0.2 %, (b) 0.2%, (c) 1% and (d) 5% of the smooth strip length. The shaded regions show the eddy viscosity variation between the fully smooth and fully rough limits (corresponding to the lower and upper boundaries, respectively).
Fluids 08 00010 g009
Figure 10. Streamwise development near the rough-to-smooth interface for (a) mean velocity, (b) eddy viscosity, (c) resolved Reynolds shear stress and (d) total Reynolds shear stress.
Fluids 08 00010 g010
Table 1. WMLES grid-convergence study: summary of mesh parameters.
ResolutionGrid Points Δ x = Δ z Δ x r + = Δ z r + 1 Δ x s + = Δ z s + 1
Coarse 1024 × 60 × 256 0.055400279
Medium 1792 × 60 × 448 0.031219155
Fine 2240 × 60 × 560 0.025175124
1 The subscripts r and s represent values at the end of rough and smooth strips, respectively.
Disclaimer/Publisher’s Note: The statements, opinions and data contained in all publications are solely those of the individual author(s) and contributor(s) and not of MDPI and/or the editor(s). MDPI and/or the editor(s) disclaim responsibility for any injury to people or property resulting from any ideas, methods, instructions or products referred to in the content.