Abstract
The open source and freely available fluid flow solver named caffa3d was adapted to simulate the performance of a medium-scale Hydrostatic Pressure Machine (HPM) with straight radial blades, which had been previously tested in a laboratory facility. A fully detailed explanation of the code caffa3d is not intended to be included in this paper, but some of its main characteristics are mentioned for completeness. In addition, convergence and grid sensitivity analysis were performed in order to assess the adequacy of the model. Evolution of instantaneous power over a few turns of the HPM shows typical blade pass frequency for all operating discharges and another oscillatory phenomena at rotating frequency for higher discharges. The Power—Discharge and Efficiency—Discharge curves obtained from the simulations present a good correlation with the experimental curves, up to the discharge value corresponding to the maximum power of the HPM. The comparison error in power and efficiency remained below 6% for discharge lower than 97.8 L/s. For higher discharge, the flow through the HPM becomes very unsteady, with big eddy structures, underfilling of the buckets and recirculation down to the entry of the channel, significantly reducing the generated power. This behaviour was also observed during the previous experiments. In the present work, the foundations for the study of other types of turbines with caffa3d are laid.
1. Introduction
In small countries with mostly flat terrains, the explotation of medium- and large-scale hydropower has become prohibitive, due to the great impact of flooding large areas. Nowadays, new hydropower stations in these countries are preferably of mini and micro scales, for which conventional turbines are very expensive [1,2,3].
The evaluation of new devices for micro hydropower schemes usually does not justify the investment that represents the use of commercial CFD codes or the excecution of model tests. On the other hand, a lot of time and money could be spent while trying different designs in the exact location of the scheme. To assess the performance of these new devices, CFD simulations could be performed through open source and freely available fluid flow solvers, which represent a great opportunity to save on investment costs in this kind of projects. If the design and/or evaluation take part within a university research or academic project, the use of this kind of tools becomes even more convenient. Researchers, professors and students benefit from the use of open source fluid flow solvers by having the opportunity to understand and even modify the original codes in order to solve particular issues. Nevertheless, within industrial environments, the use of commercial packages is mostly preferred [4,5]. Among a few examples of open source fluid flow solvers, OpenFOAM is by far the most used around the globe, having a great community of developers who help to improve its capabilities. OpeanFOAM was initially developed by Henry Weller in 1989 [6] and it was made freely available in 2004 [7].
In this work, we chose to use the open source and freely available fluid flow solver named caffa3d [8,9], developed from a family of 2D flow solvers included in [10] by researchers of the Computational Fluid Mechanics Group of the Faculty of Engineering of Universidad de la República (Uruguay). It shares several characteristics with other open source flow solvers and it is coded in Fortran 90, demanding lesser programming skills than other packages. The most common and successful applications of caffa3d are simulation of blood flow to predict the rupture of an intracranial aneurysm [11,12], simulation of the wake produced by wind turbines [13] and evaluation of wind farms, atmospheric boundary layer simulation to analyze wind flows in urban environments and pollutant dispersion [9], and the development of a numerical wind tunnel [14]. There was an incipient use of the solver to simulate the performance of a rotating device, specifically a Hydrostatic Pressure Machine (a type of water wheel [15,16]), although in this first attempt some difficulties aroused which did not allowed to obtain correct results [17].
Turbulence modelling is the main issue to solve in most common CFD simulations, included turbomachinery flows. Most researchers use RANS (Reynolds Average Navier Stokes) to model turbulence, along with several closure models such as and , meanwhile others prefer the use of LES (Large Eddy Simulation) along with closure models such as Smagorinsky for sub-grid scales. RANS solves the turbulence by time averaging of Navier–Stokes equations, while LES does it by averaging in space while maintaining time accuracy of fluid turbulence, making it more convenient for unsteady simulations. In the field of turbomachinery simulations, RANS is the preferred choice for most researchers [5,18], despite of its poor accuracy, due to higher computational cost and the use of not enough fine grids for LES [19].
When dealing with turbomachinery simulations in CFD, rotating parts are other important part of the problem. The rotation of the machine within the fluid domain could be solved by several methods, such as MRF (Multiple Reference Frames), SM (Sliding Meshes) or IBCM (Immerse Boundary Condition Method). Among the first two, that work with body fitted grids to model the solid surface of the machine, MRF (also called frozen-rotor) handles the rotation by solving the equations in a rotating reference frame (using relative velocities and considering Coriolis and transport forces) for those blocks close to the machine and in an absolute reference frame for the rest of the blocks [20], while SM solves the equations for the entire domain in an absolute reference frame but it needs to rotate the block grids around the machine and solve the connectivity between the cells of the interface [8]. In MRF method all the mesh blocks of the domain remain stationary in their respective reference frames, and a steady flow condition must exist at the interface between the subdomains, so it is not useful for transient simulations. In the IBCM [21], there is no special treatment for the grid, as the solid is represented by an external mass force field acting like the real solid body and imposing a velocity equal to the body’s one in the grid cells lying within it’s surface. For rotating bodies, one need to re-calculate the distance between cells and body’s surface at every time step, making the method computationally expensive.
In addition, in those turbomachines working partially submerged under water, the simulation of two very distinct fluids (air and water) is another challenging task. In order to simulate two phase flows, the methods are devided into Lagrangian approaches, such as SPH (Smoothed Particle Hydrodinamics) described in [22,23], and Eulerian approaches which in turn are divided into interface-tracking and interface-capturing methods [10]. Among the latter, VOF (Volume Of Fluid), proposed by [24], is the most popular method.
Section 2 presents some details of caffa3d (including its main equations and discretization schemes), a description of the HPM chosen as case study, the computational domain and mesh, initial and boundary coinditions, solver parameters and fluid properties and method for power and efficiency calculation. In addition, a convergence study and grid sensitivity analysis is presented.
In Section 3, the use of caffa3d to simulate a hydropower device is validated through the analysis of the performance of a medium-scale HPM with straight radial blades. Some turbulence characteristics of the flow in the channel are shown. The generated power and efficiency for different discharges are compared with previous experimental results and a qualitative comparison of the flow across the wheel for two distinct conditions is presented. Similar analyses were conducted in the past by other researchers using commercial CFD codes [25].
The main emphasis of the present study was not to perform a rigurous analysis of the turbulent quantities, but to evaluate the use of caffa3d to assess the global performance of a hydropower device.
2. Numerical Method
2.1. Description of Flow Solver caffa3d
The solver caffa3d is an implementation of the finite volume method in Fortran 90; it uses mesh blocks adapted to the geometry; it can be combined with the immersed boundary conditions method; and it can be parallelized through domain decomposition under a model of distributed memory using the MPI library. The coupling between the velocity field and the pressure field is conducted with the SIMPLE method (Semi-Implicit Method for Pressure-Linked Equations). The code of the caffa3d program is developed in several modules that solve the fluid motion or Navier–Stokes equations as well as several sets of specific equations for particular problems (such as turbulence modeling, mesh motion, two-phase flows, scalar transport, radiation, etc.). It is completed with specific modules for data processing (domain geometry, indexing, interfaces, boundary conditions, writing of results, communication between regions, etc.). In [8,9,14], the structure of the code is described in depth, including its mathematical models, the spatial and temporal discretization schemes and the SIMPLE equation coupling method.
Taking advantage of the possibility of parallelizing the simulations, the solver is executed in ClusterUy, the National Supercomputing Center of Uruguay, which has 1216 state-of-the-art CPU computing cores, of which 1120 are Intel Xeon-Gold 6138 2.00 GHz cores and 96 are AMD EPYC 7642 2.30 GHz cores, 3.8TB of RAM and 100352 Nvidia Tesla P100 GPU compute cores with 12 Gb of memory interconnected by a high-speed 10 Gbps Ethernet network [26].
2.1.1. Turbulence Modeling
To model the turbulence in caffa3d, the LES (Large Eddy Simulation) technique is used together with the Smagorinsky model [27] for the modeling of the sub-grid scales. This method consists of treating the effect of the sub-grid scales as a eddy viscosity (), which is added to the dynamic viscosity () of the simulated fluid to obtain a net viscosity () which is used in the momentum balance equation. The calculation must be performed for each cell of the domain, whereby the viscosity is no longer uniform. The expression used to calculate the sub-grid scale eddy viscosity is [10]:
where is the density of the fluid, is a characteristic parameter of the eddy viscosity models, is the norm of the deformation tensor of the filtered velocity field and is the width of the applied filter (which is proportional to the cube root of the volume of each cell). In caffa3d, the parameter is not a constant (as it could be in other models), but calculated for each cell element at each time step as [28]:
where is the Reynolds number of the sub grid scales. This approach helps to attenuate the value of in regions with low turbulence intensity, where the Smagorinsky model impose excessive dissipation, such as near solid boundaries.
The Smagorinsky model is complemented with a special wall function for the treatment of the turbulence inside the boundary layer [10]. In fact, for high Reynolds numbers, the viscous sublayer becomes too thin to be acurately modeled by the geometrical grid. If a wall cell element lies within the viscous sublayer, then the eddy viscosity is calculated through Equation (1), but if this is not the case, some correction must be made. The distance from the center of the cell to the wall (y) is expressed in dimensionless form as , where is the shear velocity and is the shear stress at the wall. The viscous sublayer is limited by . However, if the wall cell element lies outside the visocus sublayer and within the logarithmic sublayer, the eddy viscosity is calculated as:
where is the von Karman constant and ( is an empirical constant in the dimensionless velocity profile of the logarithmic sublayer). This correction should be applied if the wall cell element lies in the logarithmic sublayer, i.e., if [29].
Due to its high accuracy in the time domain, LES was the chosen technique for turbulence modeling of the flow through the HPM. However, it will require very fine grids to do its work.
2.1.2. Free Surface Flows
In order to simulate open channel flows, caffa3d implements the VOF (Volume of Fluid) method [24,30] with CICSAM technique for the calculation of flow across cell’s boundaries [31,32] and the estimation of surface tension forces from [33]. In the VOF method, a scalar is introduced to represent the volume fraction that one of the fluids (in this case water) occupies in each cell at each instant of time. If, in any cell, we have it means that the cell is completely occupied by water (or fluid 1), while if we have it means that the cell is completely occupied by air (or fluid 2). If, in any cell, we have , it means that such cell lies within the interface between the fluids. The density () and viscosity () of each cell are calculated from the properties of each fluid (subscript w for water and a for air) and the value of in such cell, according to the following equations:
The transport equation of the scalar (6) is solved together with the mass (7) and momentum (8) conservation equations to find the position of the interface at each instant:
where m/s2 is the gravitational acceleration, is the force at the interface due to surface tension (in the case of water–air interface N/m), calculated according to the expression proposed by [33]:
The VOF method implemented in caffa3d uses the CICSAM (Compressive Interface Capture Scheme for Arbitrary Meshes) technique based on the donor–acceptor approach for the calculation of the scalar fluxes across cell faces [31,32]. The donor–acceptor approach consists of using information from upstream and downstream of a cell, to establish an approximate shape of the interface, and then using this shape to calculate the fluxes, taking into account the slope of the interface. The CICSAM technique was introduced by [31] to solve a problem encountered when using the VOF method on problems with more than one dimension (it tends to wrinkle the interface).
Additionally, to avoid values without physical meaning of the scalar (less than 0 or greater than 1), a procedure called predictor–corrector is implemented that assigns the value 0 or 1 to these cases as required [31].
This type of simulation especially requires that the Courant–Friedrichs–Lewy (CFL) condition be satisfied to guarantee the stability of the numerical scheme [34,35]. This condition implies that, for all volume cells, the following equation must be verified:
where is the Courant number, u is the fluid velocity at the center of the cell, is the time step, and is the smallest dimension of the cell. As very small cells are required in the areas close to the solid surfaces (to correctly simulate the viscous sublayer), it is necessary to work with small time steps as well. In unsteady flow simulations, it is difficult to predict the maximum values of velocities that may occur, so it may happen that the CFL condition is initially satisfied but at some point is no longer fulfilled. To solve this problem, the VOF module of caffa3d includes a routine to adapt the time step in each iteration step, so that the Equation (10) is always verified.
2.1.3. Turbomachinery Modeling
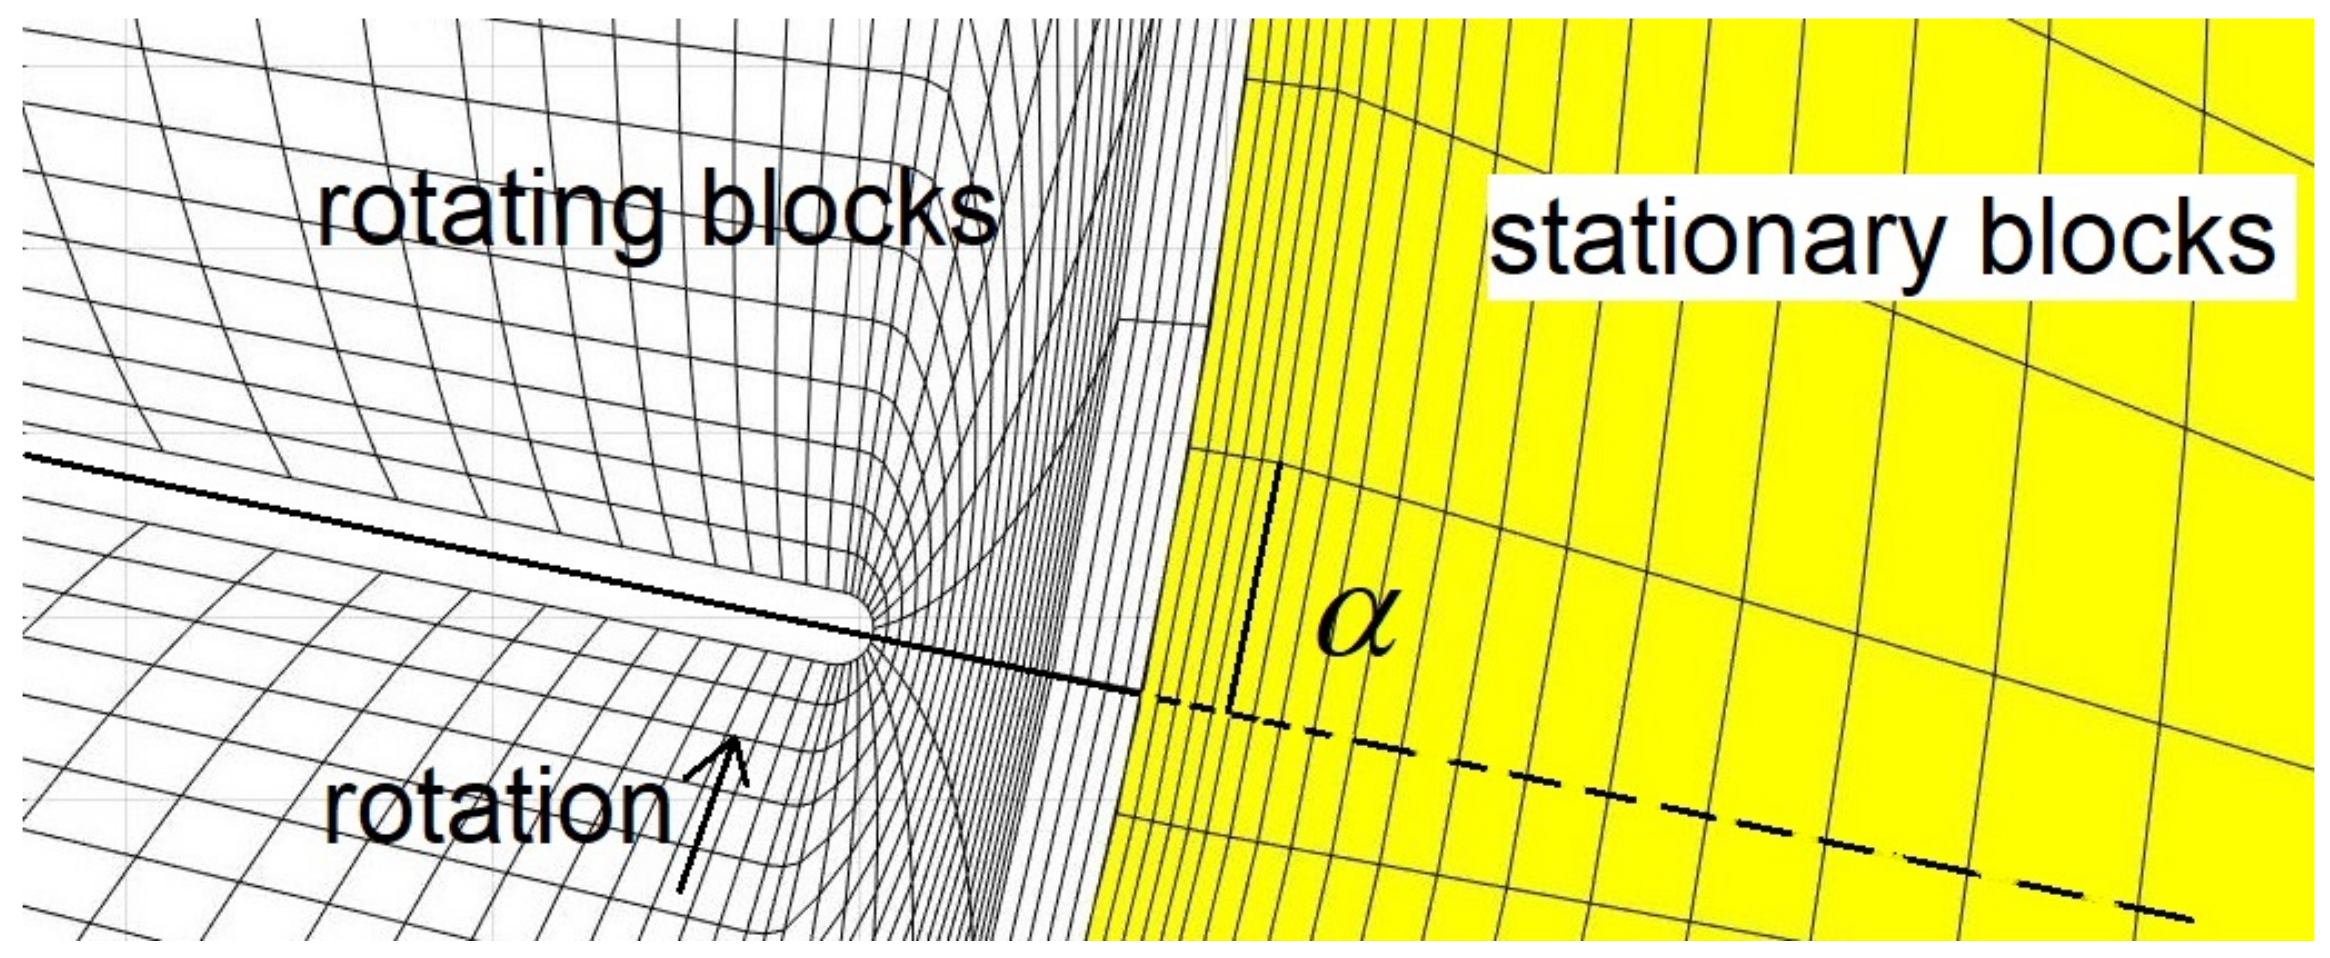
To model a rotating device, such a hydropower turbine or water wheel, the computational domain is divided in stationary and rotary block meshes. The rotation of the moving blocks is obtained by trigonometric relationships and the communication across the interface bewteen stationary and moving blocks is treated with the Sliding Mesh (SM) technique [8]. The governing equations for the entire domain are solved in an absolute reference system. In this case, the subdomain mesh blocks containing the rotor and its surfaces rotate at the same rotation speed, which is achieved by a simple rotation of the cell coordinates from trigonometric relationships. It results in an inherently non-stationary simulation and the exact position of the rotor is captured at each time step, which is why it was the approach chosen in this research for the simulation of flow through turbomachines. In the faces of the cells of the interface between the rotating mesh and the static mesh, corrections must be added in the fluxes (for mass, momentum, a passive scalar, etc.) and some connectivity information must also be updated (indexing). The SM method is implemented in caffa3d within a specific module that deals with the generic movement (translation or rotation) of grid blocks. The module includes subroutines that initializes the position of the blocks, defines the type of movement and its speed, and calculates the new positions occupied by the centers of cells and faces of the moving mesh blocks. When a block moves with respect to another one without overlapping, there is a sliding interface between them that must be specially treated, in order to correctly establish a relationship between the cell faces of one block and another. In the case of rotational movement, the relative displacement angle is defined between the centers of the faces of both blocks that make up the interface (Figure 1). For non-zero values of , each cell face of one of the rotating blocks corresponds to at least two cell faces of the other block.
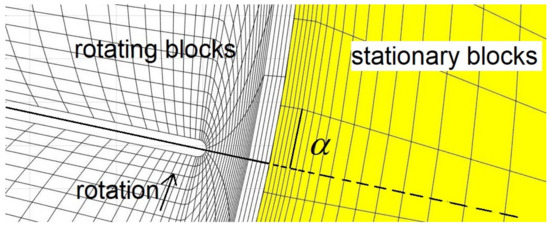
Figure 1.
Diagram of the sliding interface, showing the relative displacement angle between a rotating block and other static ones (particular case).
The momentum conservation equation for moving blocks must consider the local derivative of absolute velocity (), and relative velocities () for mass flows, as presented in the following equation [8]:
where in the velocity vectors , the subscript A refers to the inertial reference system and the subscript R refers to the reference system that rotates with the blocks, is the density, the dynamic viscosity, the gravitational acceleration, and p the pressure. All magnitudes are evaluated in each volume cell of the grid.
2.1.4. Discretization of Equations
Each of the above mentioned equations in the mathematical model is dicretized and linearized at each cell. The discretization is performed in a collocated grid, while the Rhie-Chow interpolation is used to avoid checkerboard pressure problems [8,36]. The goal is to obtain a discrete approximation for all velocity components, in the form of the followingequation for the case of u velocity component:
where are the coefficients of the heptadiagonal matrix of size (n being the total number of grid elements), P represents the cell in which equation is being solved and W, E, S, N, B and T represent the west, east, south, north, bottom and top neighbors of cell P. is the independent vector term. The approximation consist of an implicit first order upwind term combined with an explicit second order linear interpolation deferred correction in the source term. A complete description of the discretized equations can be found in [8], but, as an example, the following equation presents the discretization of the convective u flux for a given element through east face () in Equation (8):
where is the mass flux through the face, which is assessed within the resolution of the mass balance equation, considering a correction in the pressure field, with the SIMPLE method for velocity–presure coupling, is the blending factor between upwind and linear interpolation approximation. The superscript c stands for convective, u for the velocity component and e for the east face. The implicit term in Equation (13) contributes to the coefficients , while the explicit term is added to the source term .
Within each time step, caffa3d solves alternately and successively the discretized equations of momentum and mass balance of the form of Equation (13), together with one or several scalar transport equations.
2.2. Case Study
The hydropower device chosen for this study was a Hydrostatic Pressure Machine [15,16] that is a type of water wheel that gets the power from a channel flow with a head difference between upstream and downstream of the wheel. The use of this device was proposed together with other devices, for obtaining hydropower energy in low head sites, in the framework of the research project HYLOW [37]. The wheel’s speed of rotation is set at a specific value for a given discharge, in order to maintain a constant head upstream, while a weir keeps a constant head downstream. Therefore, this type of machine works typically under constant head.
The analyzed hydraulic wheel has a diameter of 1200 mm, and is made up of 12 radially arranged straight blades of 400 mm long and 970 mm wide (see Figure 2). The width of the channel where the wheel is inserted is slightly greater than the width of the wheel, with the lateral gap equal to 3 mm. The gap between the tip of the blades and the curved bottom is 5 mm. This model of HPM was one of the several models that were tested within the HYLOW project [38,39].

Figure 2.
Diagram of the HPM with straight blades tested in the HYLOW project. Taken from [38].
Among all the water level configurations analyzed in [38,39], two stand out. One configuration where the level upstream () matches the upper edge of the hub and downstream () matches the lower edge of the hub (as in Figure 2), called the reference configuration. The other configuration is where the level upstream () matches the upper edge of the hub and the level downstream () is 200 mm below the lower edge of the hub, which is the configuration with maximum power and efficiency. In order to validate the numerical simulations with caffa3d, only the reference water level configuration was considered.
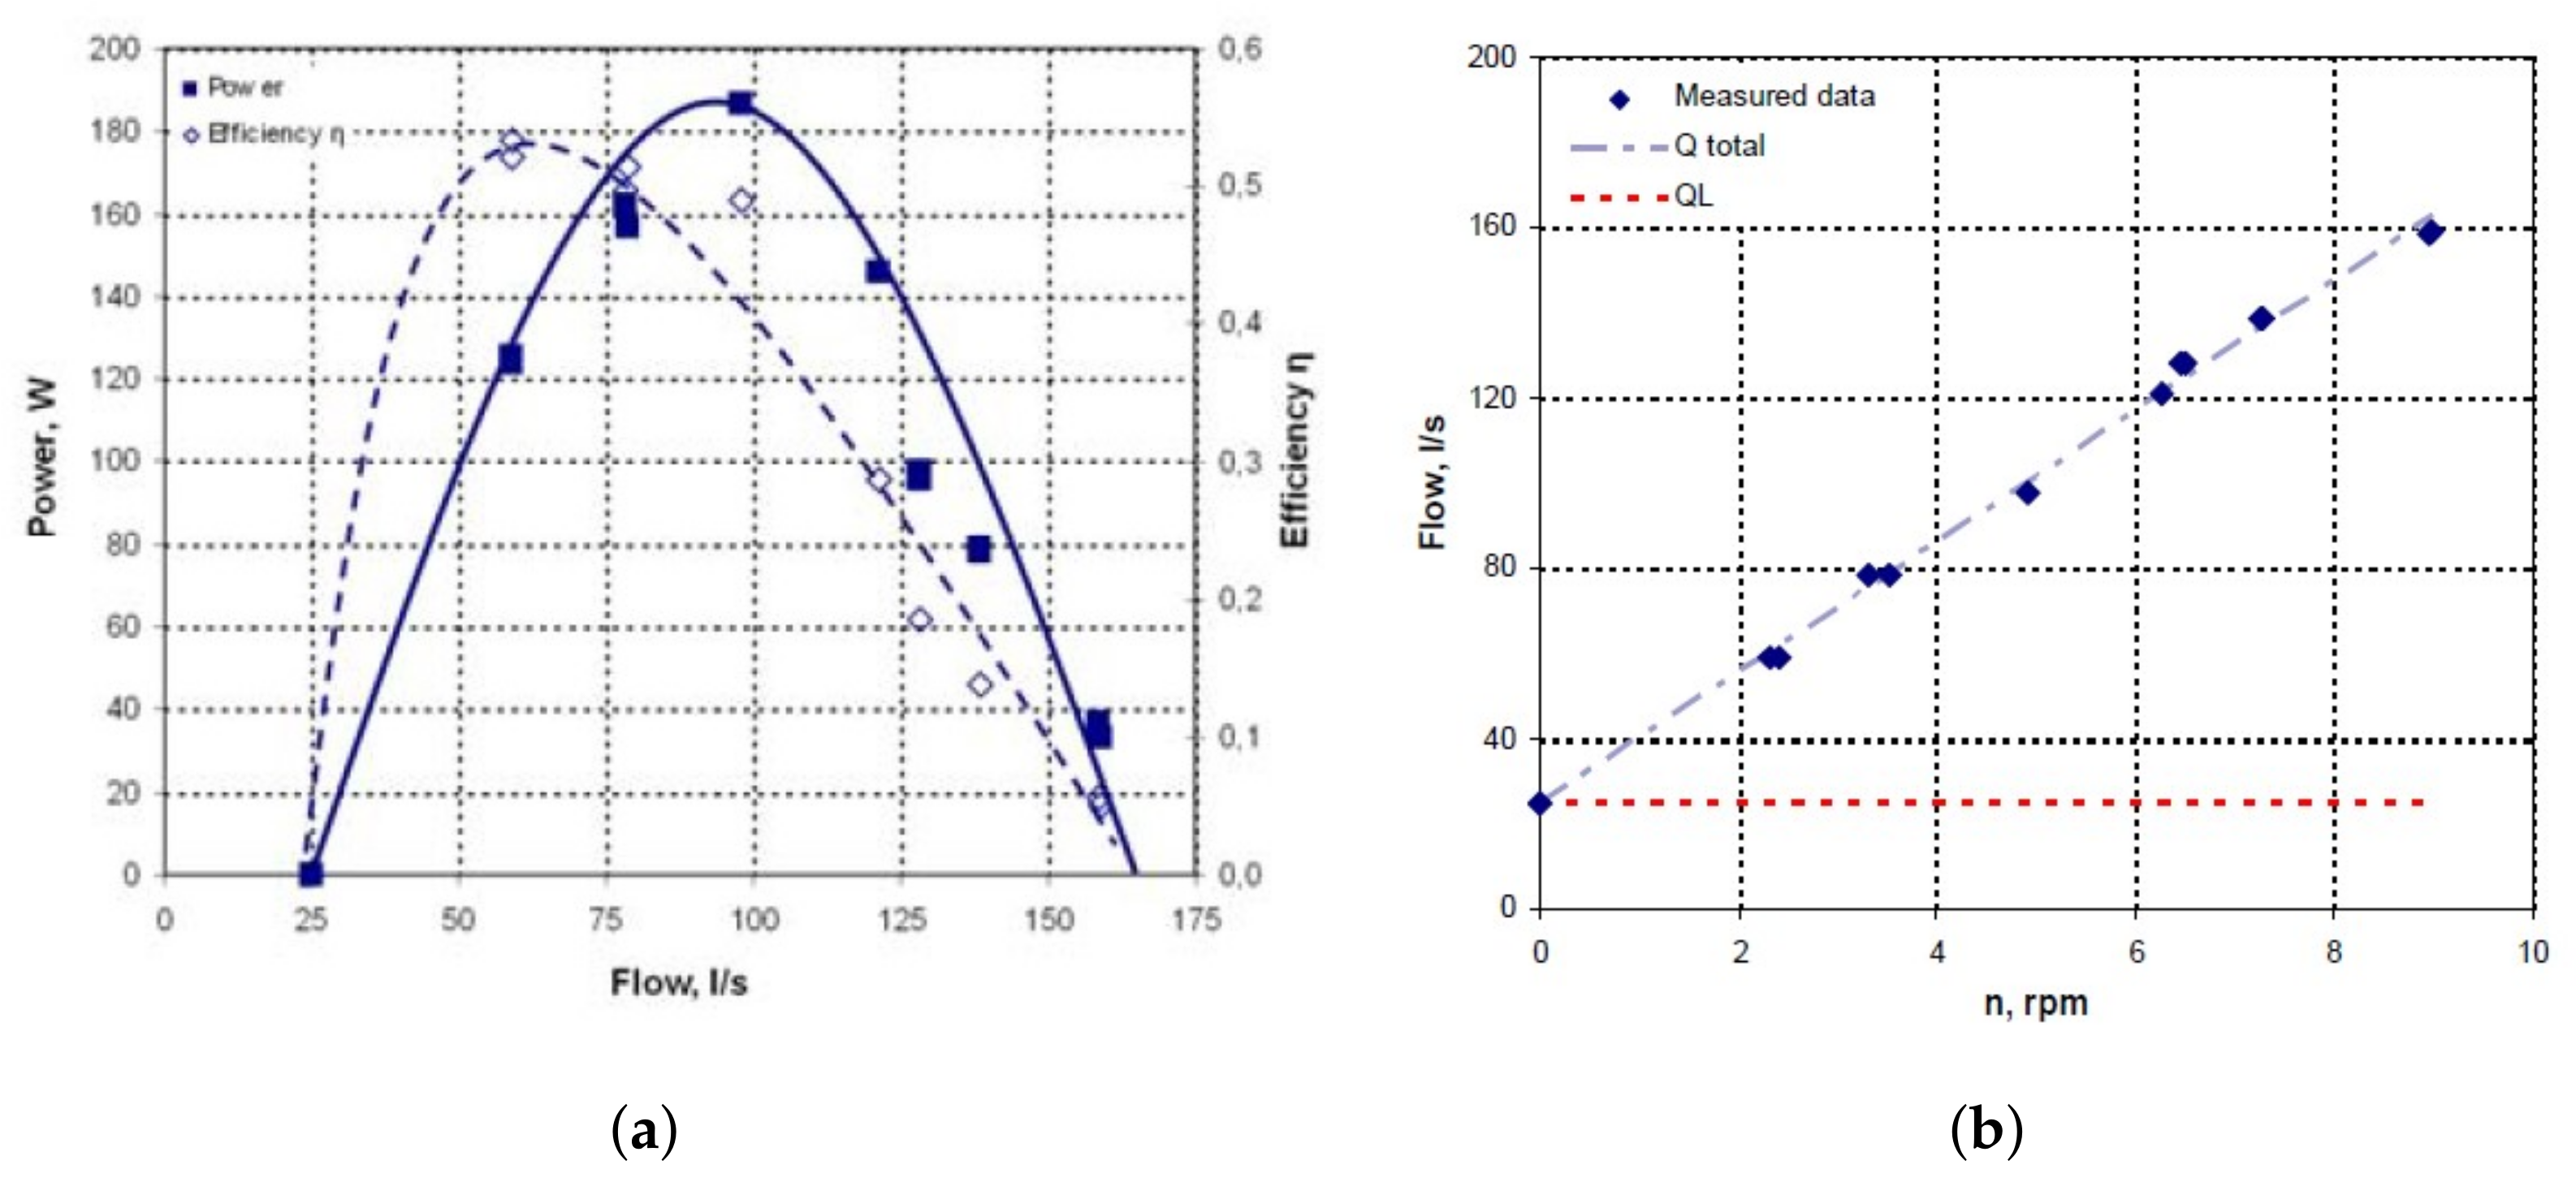
Figure 3a shows the Power—Discharge and Efficiency—Discharge curves for the reference configuration. It is observed that the maximum power of 186.7 W occurs for a discharge of 97.8 L/s and the maximum performance of 53% is reached with a discharge of 58.9 L/s. Figure 3b shows the linear relationship between the total discharge and the rotating speed of the wheel, as well as the value of the leakage flow (which in this case resulted in L/s. Both figures were extracted from an internal report of the HYLOW project [38].
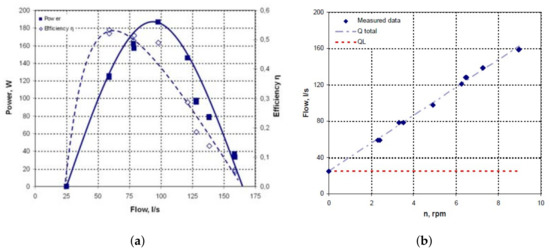
Figure 3.
Operational curves of the HPM of medium-scale and radial straight blades tested in the HYLOW project (taken from [38]). (a) shows Power—Discharge and Efficiency—Discharge curves while (b) shows the relationship between discharge and rotating speed.
From Figure 3a,b, the operating points of the HPM to be simulated in caffa3d were obtained, which are presented in Table 1.

Table 1.
Operating points of the HPM with straight blades of 1200 mm in diameter, based on experimental tests.
2.3. Domain, Mesh, Boundary Conditions and Other Parameters
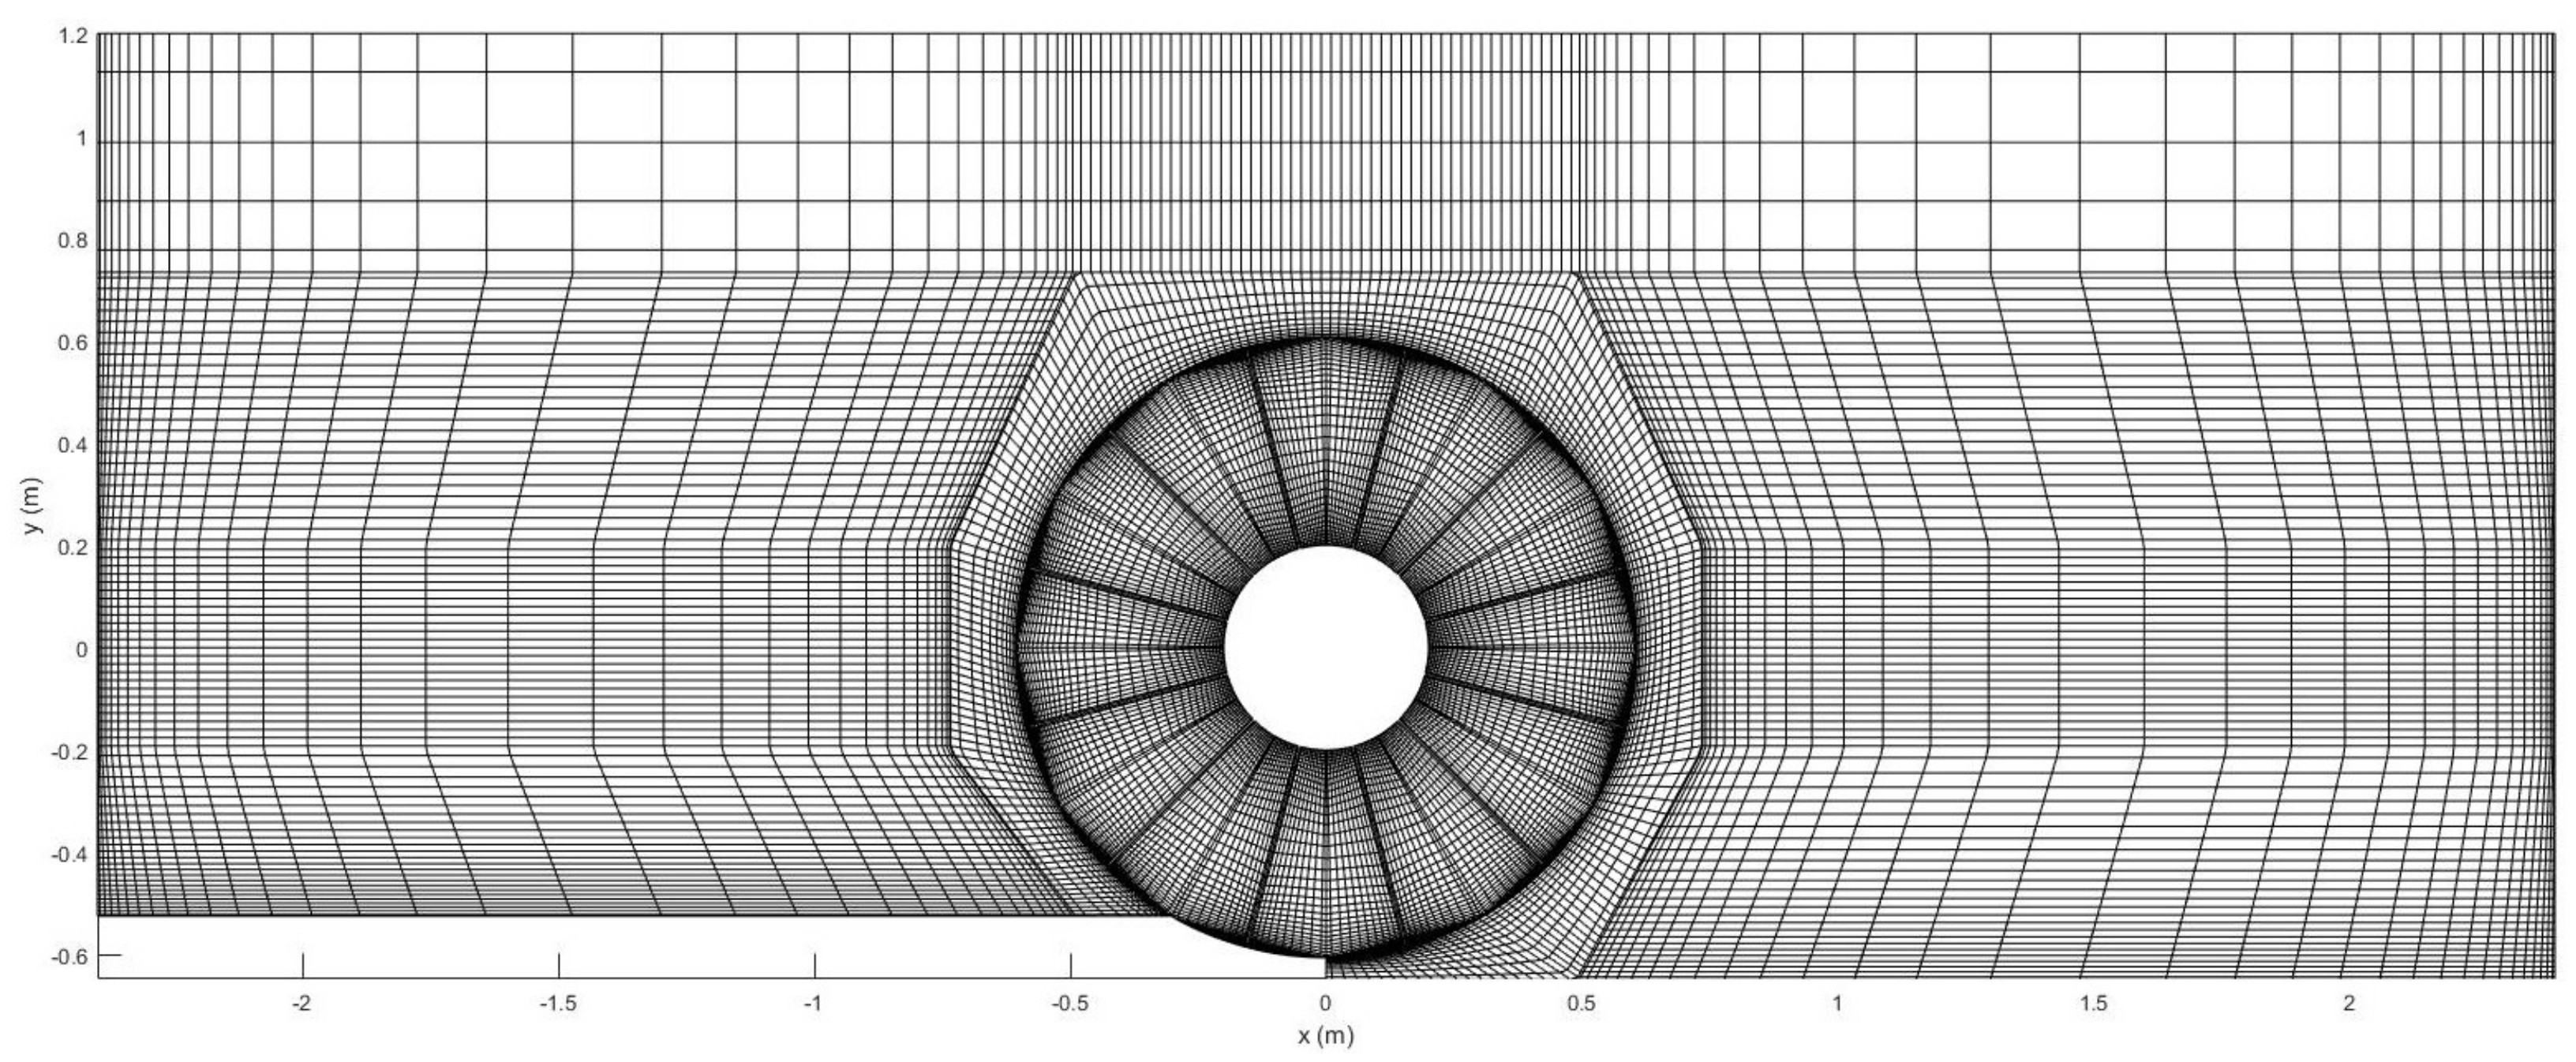
Seeking to optimize the computational capabilities, a reduced domain was chosen instead of covering the entire real channel that was used for the experimental tests. Taking advantage of the geometric symmetry of the wheel and the channel, and in order to reduce computational time, only one half of the complete domain was modeled, imposing a symmetry-type boundary condition on the plane corresponding to the longitudinal half of the channel. Figure 4 shows an image of the computational mesh generated for the entire domain, which covers the channel of length 4.8 m (with the HPM axis in the center) and width 488 mm (half of the width of the real HPM plus the lateral gap), with a height of 1.73 m to cover the entire part of the channel occupied by water and a significant volume of air. The circular hole centered at is the hub of the HPM (which is not included in the mesh).
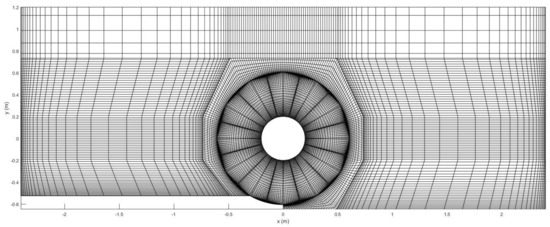
Figure 4.
Complete computational mesh for the simulation of the HPM in caffa3d.
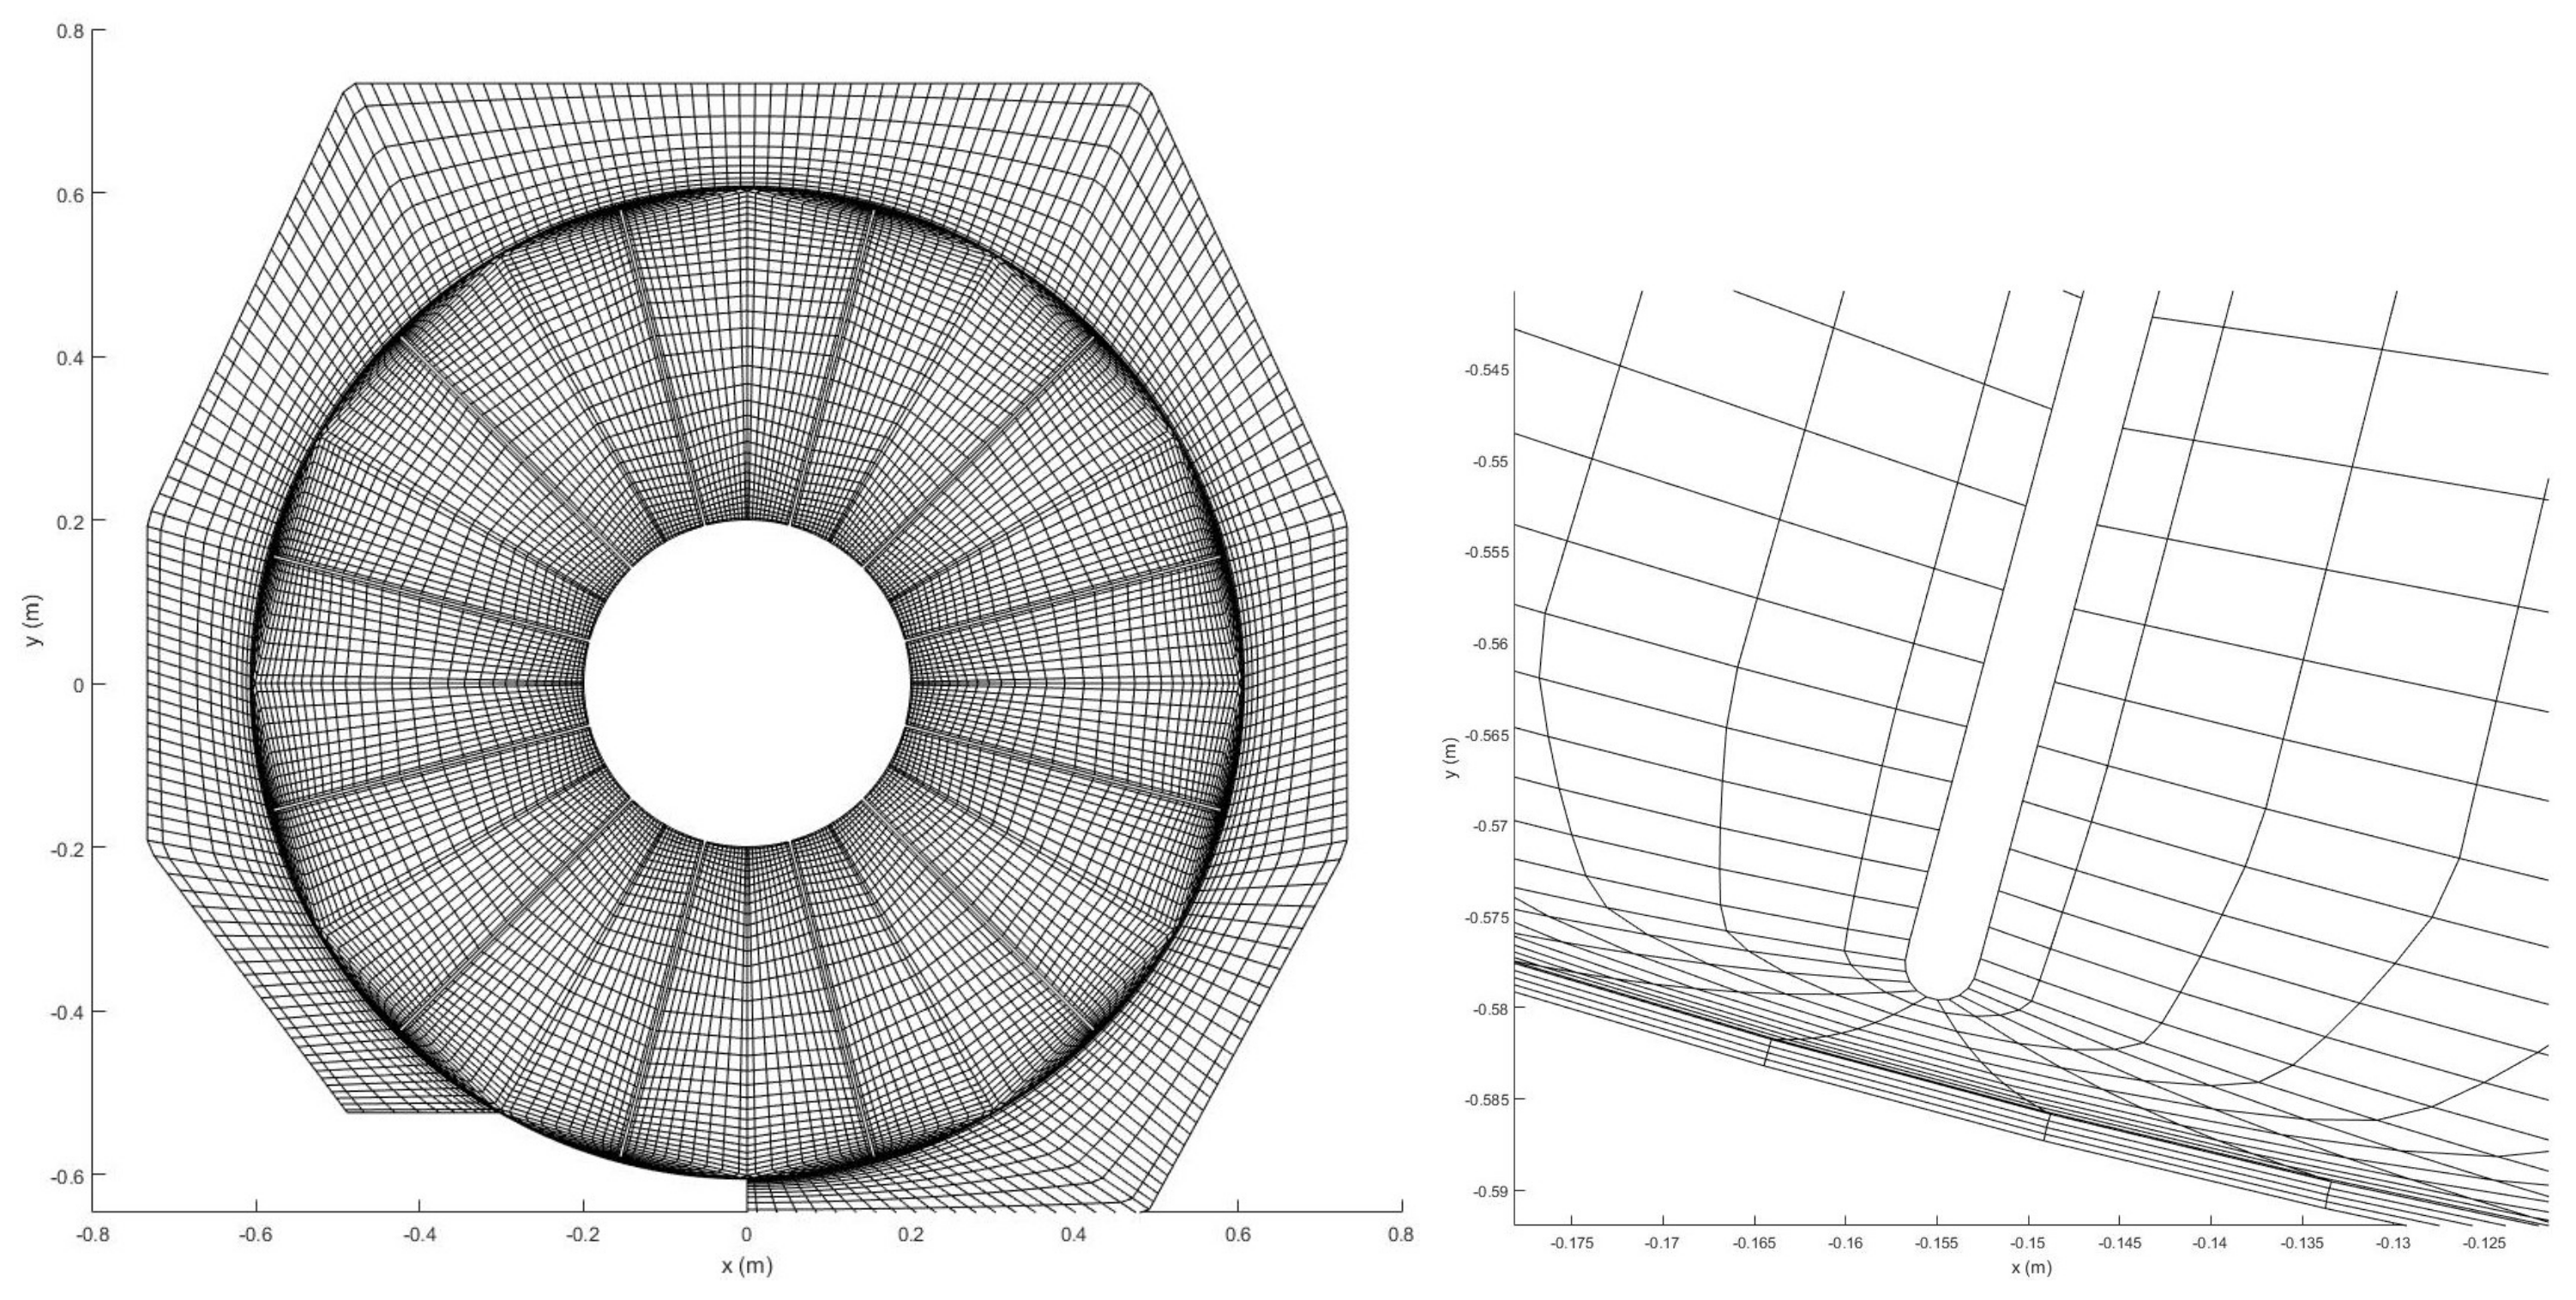
Details of parts of the mesh near the HPM and its blades are presented in Figure 5, and specifically a part of a blade is observed in the right image, represented by a hole in the mesh as well as the hub. The denser annular region around the HPM corresponds to the two annular cylinder-shaped blocks that form part of the sliding interface.
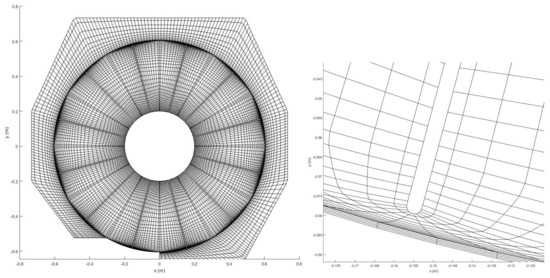
Figure 5.
Part of the computational mesh around the HPM.
The entire domain is broken down into 98 structured mesh blocks, which in turn are grouped into 28 regions, each of which is assigned to a different processor in order to parallelize the simulations. In total, we have hexagonal cells. To give an idea of the density of the mesh, the left blocks representing the entrance of the channel (see Figure 4) has 26 elements in x (longitudinal) direction, 77 elements in y (vertical) direction, and 24 elements (among all the blocks that conform the width of the channel) in z (normal) direction. In this block, the distance from the center of the first element to the floor is mm, resulting in , lying in the logarithmic sublayer [29]. In addition, the blocks surrounding each blade of the HPM, are of C-type mesh, with 84 × 10 × 24 elements. In this block, the distance from the center of the first element to the walls of the HPM (hub and blades) is mm.
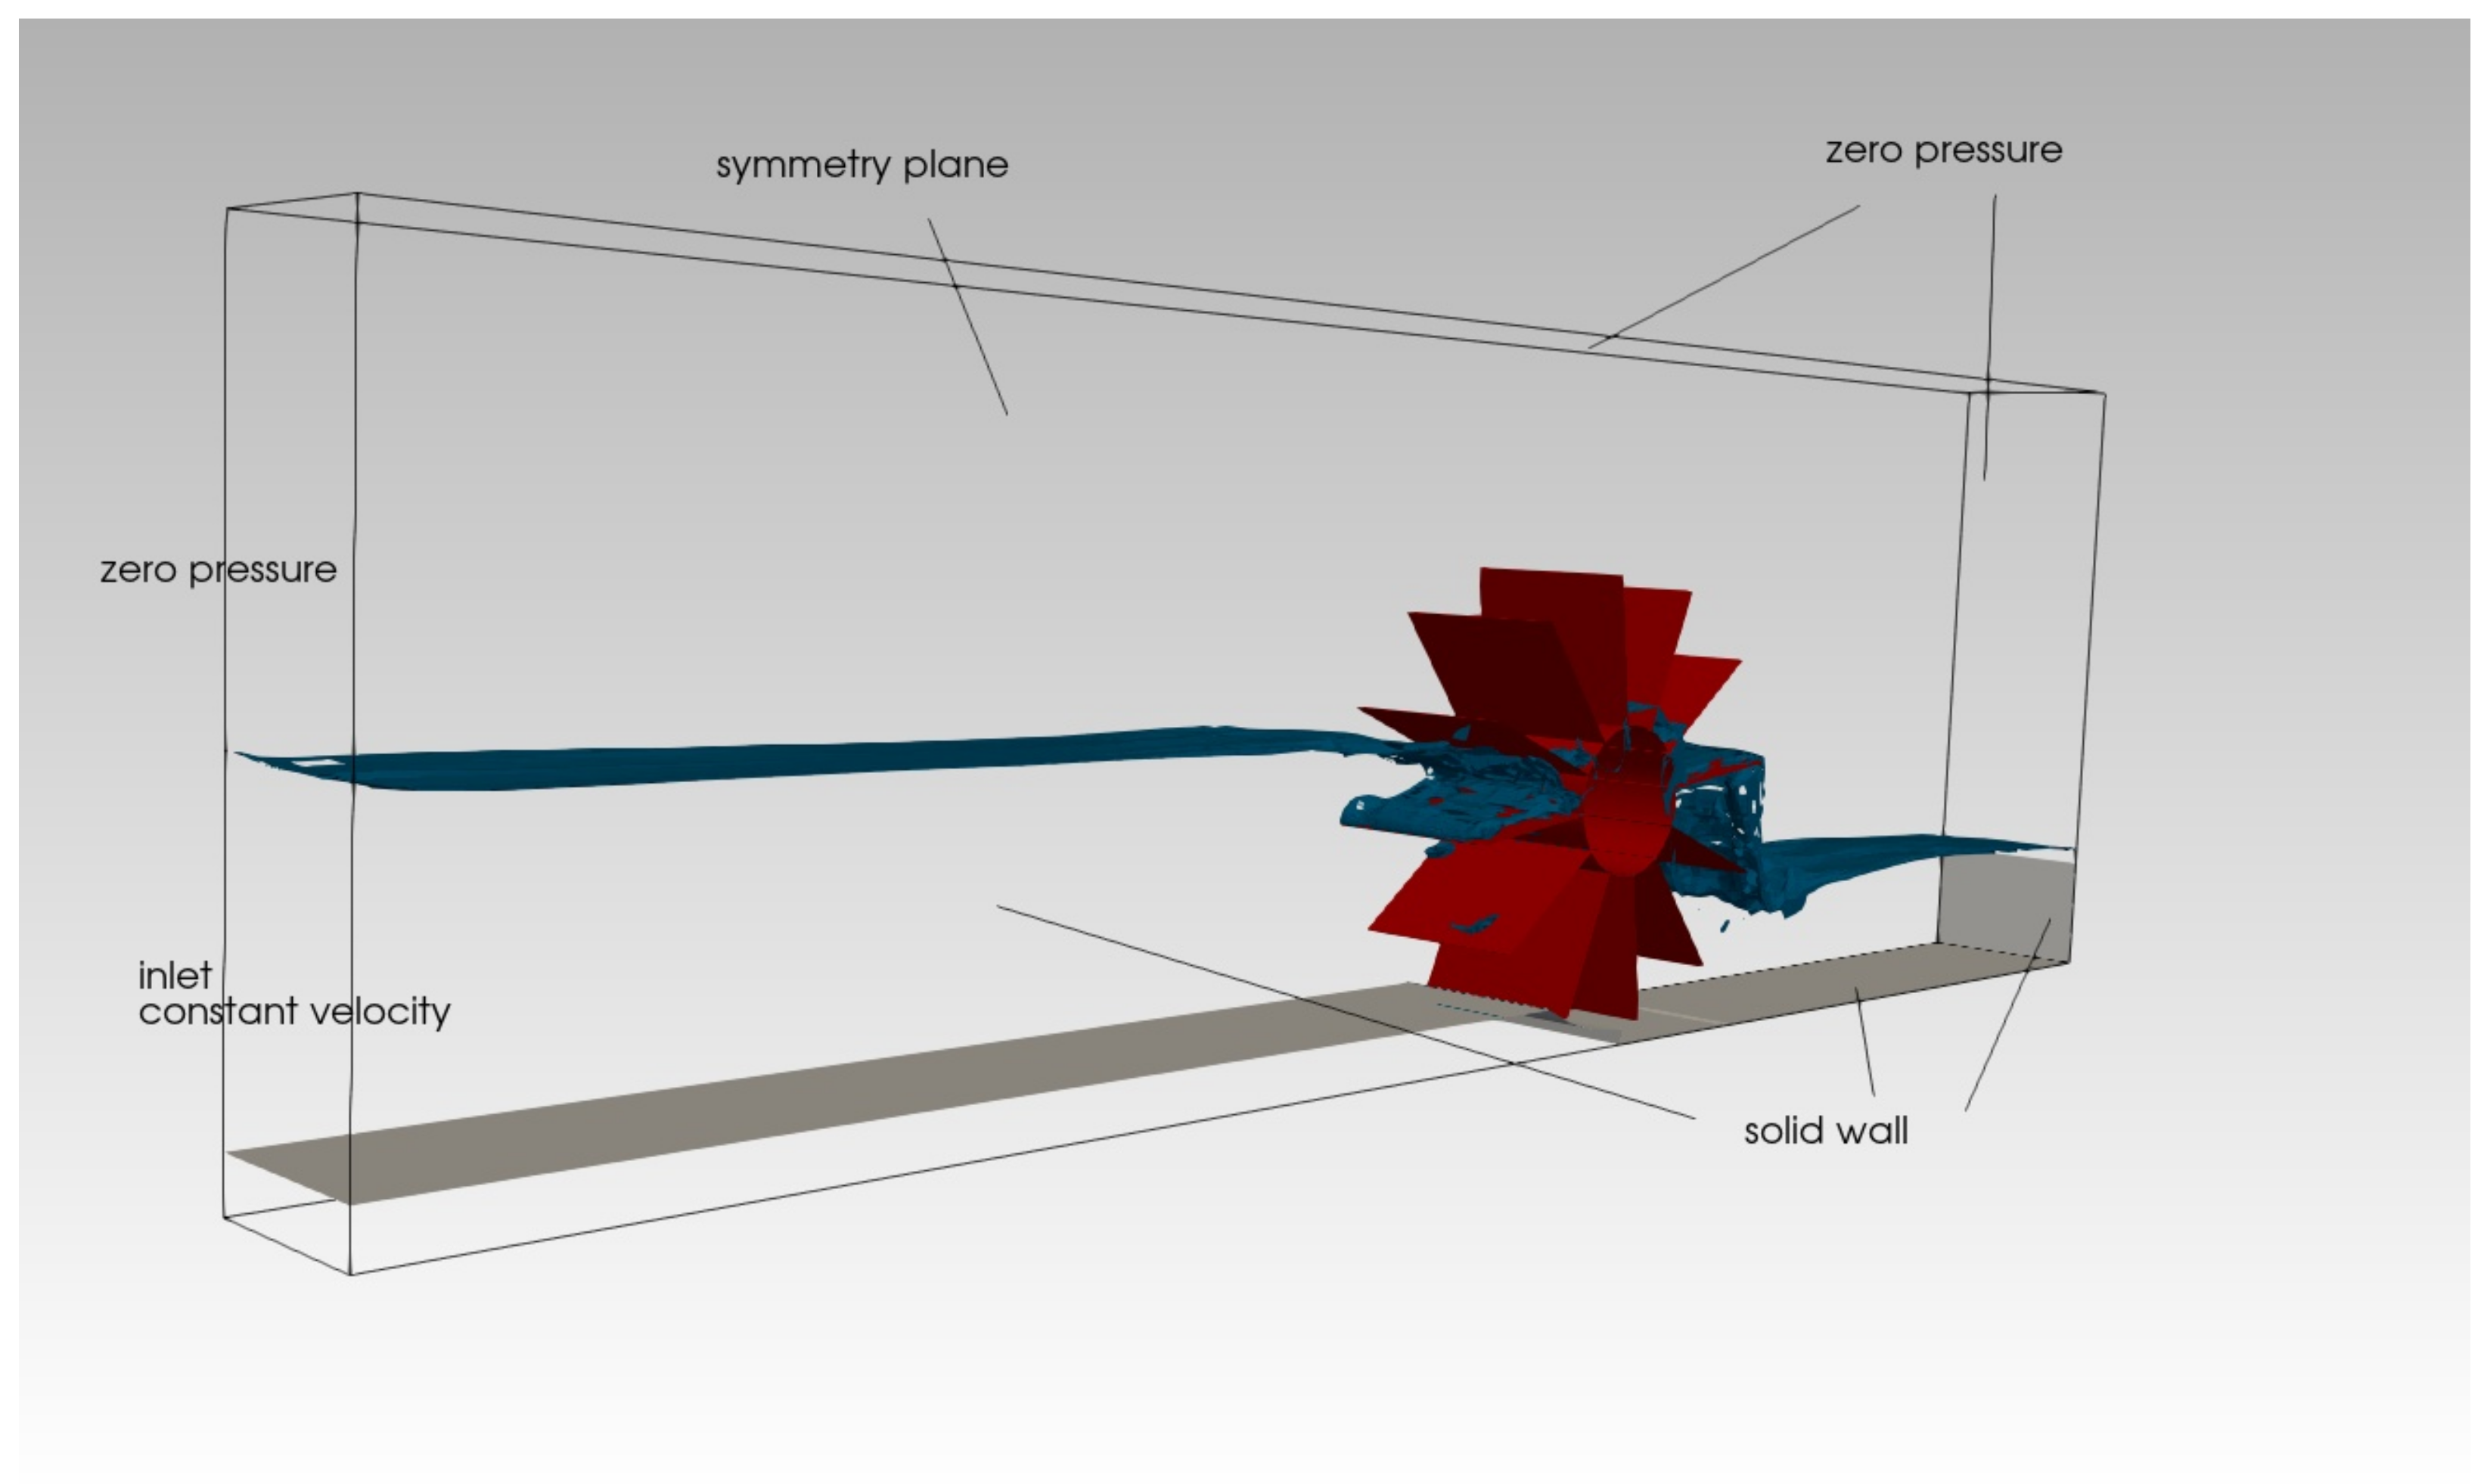
Regarding the boundary conditions of the domain (Figure 6), the back lateral surface is treated as a plane of symmetry (longitudinal half of the channel) and the front lateral surface is treated as a wall with no traversing condition (channel wall). A constant pressure condition equal to zero (simulating atmospheric air) is assigned to the upper surface and the lower surface is treated as a wall with no traversing condition (channel floor). The left surface has an inlet condition with uniform velocity from the channel floor to a height corresponding to the upper edge of the hub (water entry) and then a zero pressure condition (corresponding to the air zone). The right surface has a wall condition from the bottom up to a certain height (simulating a sharp crested weir) and then a zero pressure condition to enable the exit of water and air. Finally, the surfaces corresponding to the boundary of the HPM (blades and hub) are treated as solid walls with no traversing condition and rotating at constant speed; this is then a time dependant boundary condition.
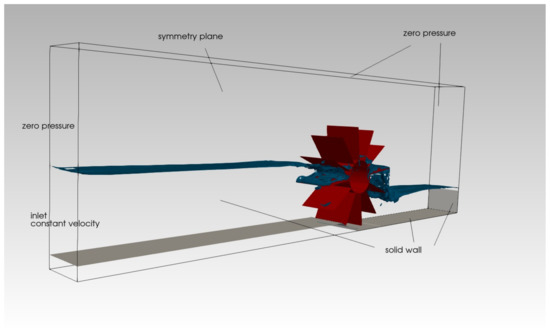
Figure 6.
Boundary conditions of the computational domain.
Water and air are at rest at the initial time, while the interface is at the upper edge of the HPM’s hub from the axle towards upstream and at the lower edge of the HPM’s hub from the axle towards downstream (as in Figure 2). The HPM is stopped at initial time and suddenly starts rotating at the corresponding speed (due to the low rotating speed it was not necessary to increase it gradually to avoid instabilities).
The time step used in the simulations, depending on the rotating speeds and discharges values, varied between s and s. It was verified that CFL condition was met. For the discretized momentum, continuity and VOF function transport equations, a total of three, three and two, respectively, inner iterative steps were performed, whereas six steps of the outer iteration were conducted.
The properties of water are those corresponding to atmospheric pressure and a temperature of 20 °C ( kg/m3 and Pa·s). Air density corresponds to atmospheric pressure and a temperature of 20 °C ( kg/m3), while Pa·s, which is 100 times higher than that corresponding to the mentioned conditions, in order to reduce spurious velocities in air [17]. For the force due to surface tension, the value of N/m corresponding to the tension between water and air was used. The properties of water, together with the simulated inlet velocities (0.056 m/s to 0.169 m/s) and the length scale of the HPM ( m), give a Reynolds number () between and .
2.4. Power and Efficiency Calculation
From the pressure and shear stress vectors in the cells of the wheel’s surface S, the torque M applied by the water to the HPM was calculated as:
where is the vector from the axle O to a generic point P belonging to S. Then, the mechanical power applied to the HPM was calculated as:
where is the rotating speed in rad/s. To obtain the mechanical power at the HPM’s shaft it would only be necessary to subtract the friction loss in the bearings, but since this is difficult to determine, a direct comparison is proposed between the power calculated from the simulations and the power presented in the HYLOW reports.
The available (maximum) power is the hydraulic power of the flow through the HPM, calculated as:
where Q is the discharge, the head difference upstream and downstream of the HPM calculated from the water levels ( and ) and the free surface velocities ( and ). The dynamic head (last term in Equation (16)) can be neglected as the velocities are very low. Due to intrinsic losses during the energy transfer, the hydraulic power exerted on the HPM is lower than the available hydraulic power.
Finally, the efficiency of the HPM can be calculated as the quotient between the mechanical power absorbed by the HPM and the hydraulic power available in the channel ().
2.5. Convergence Study
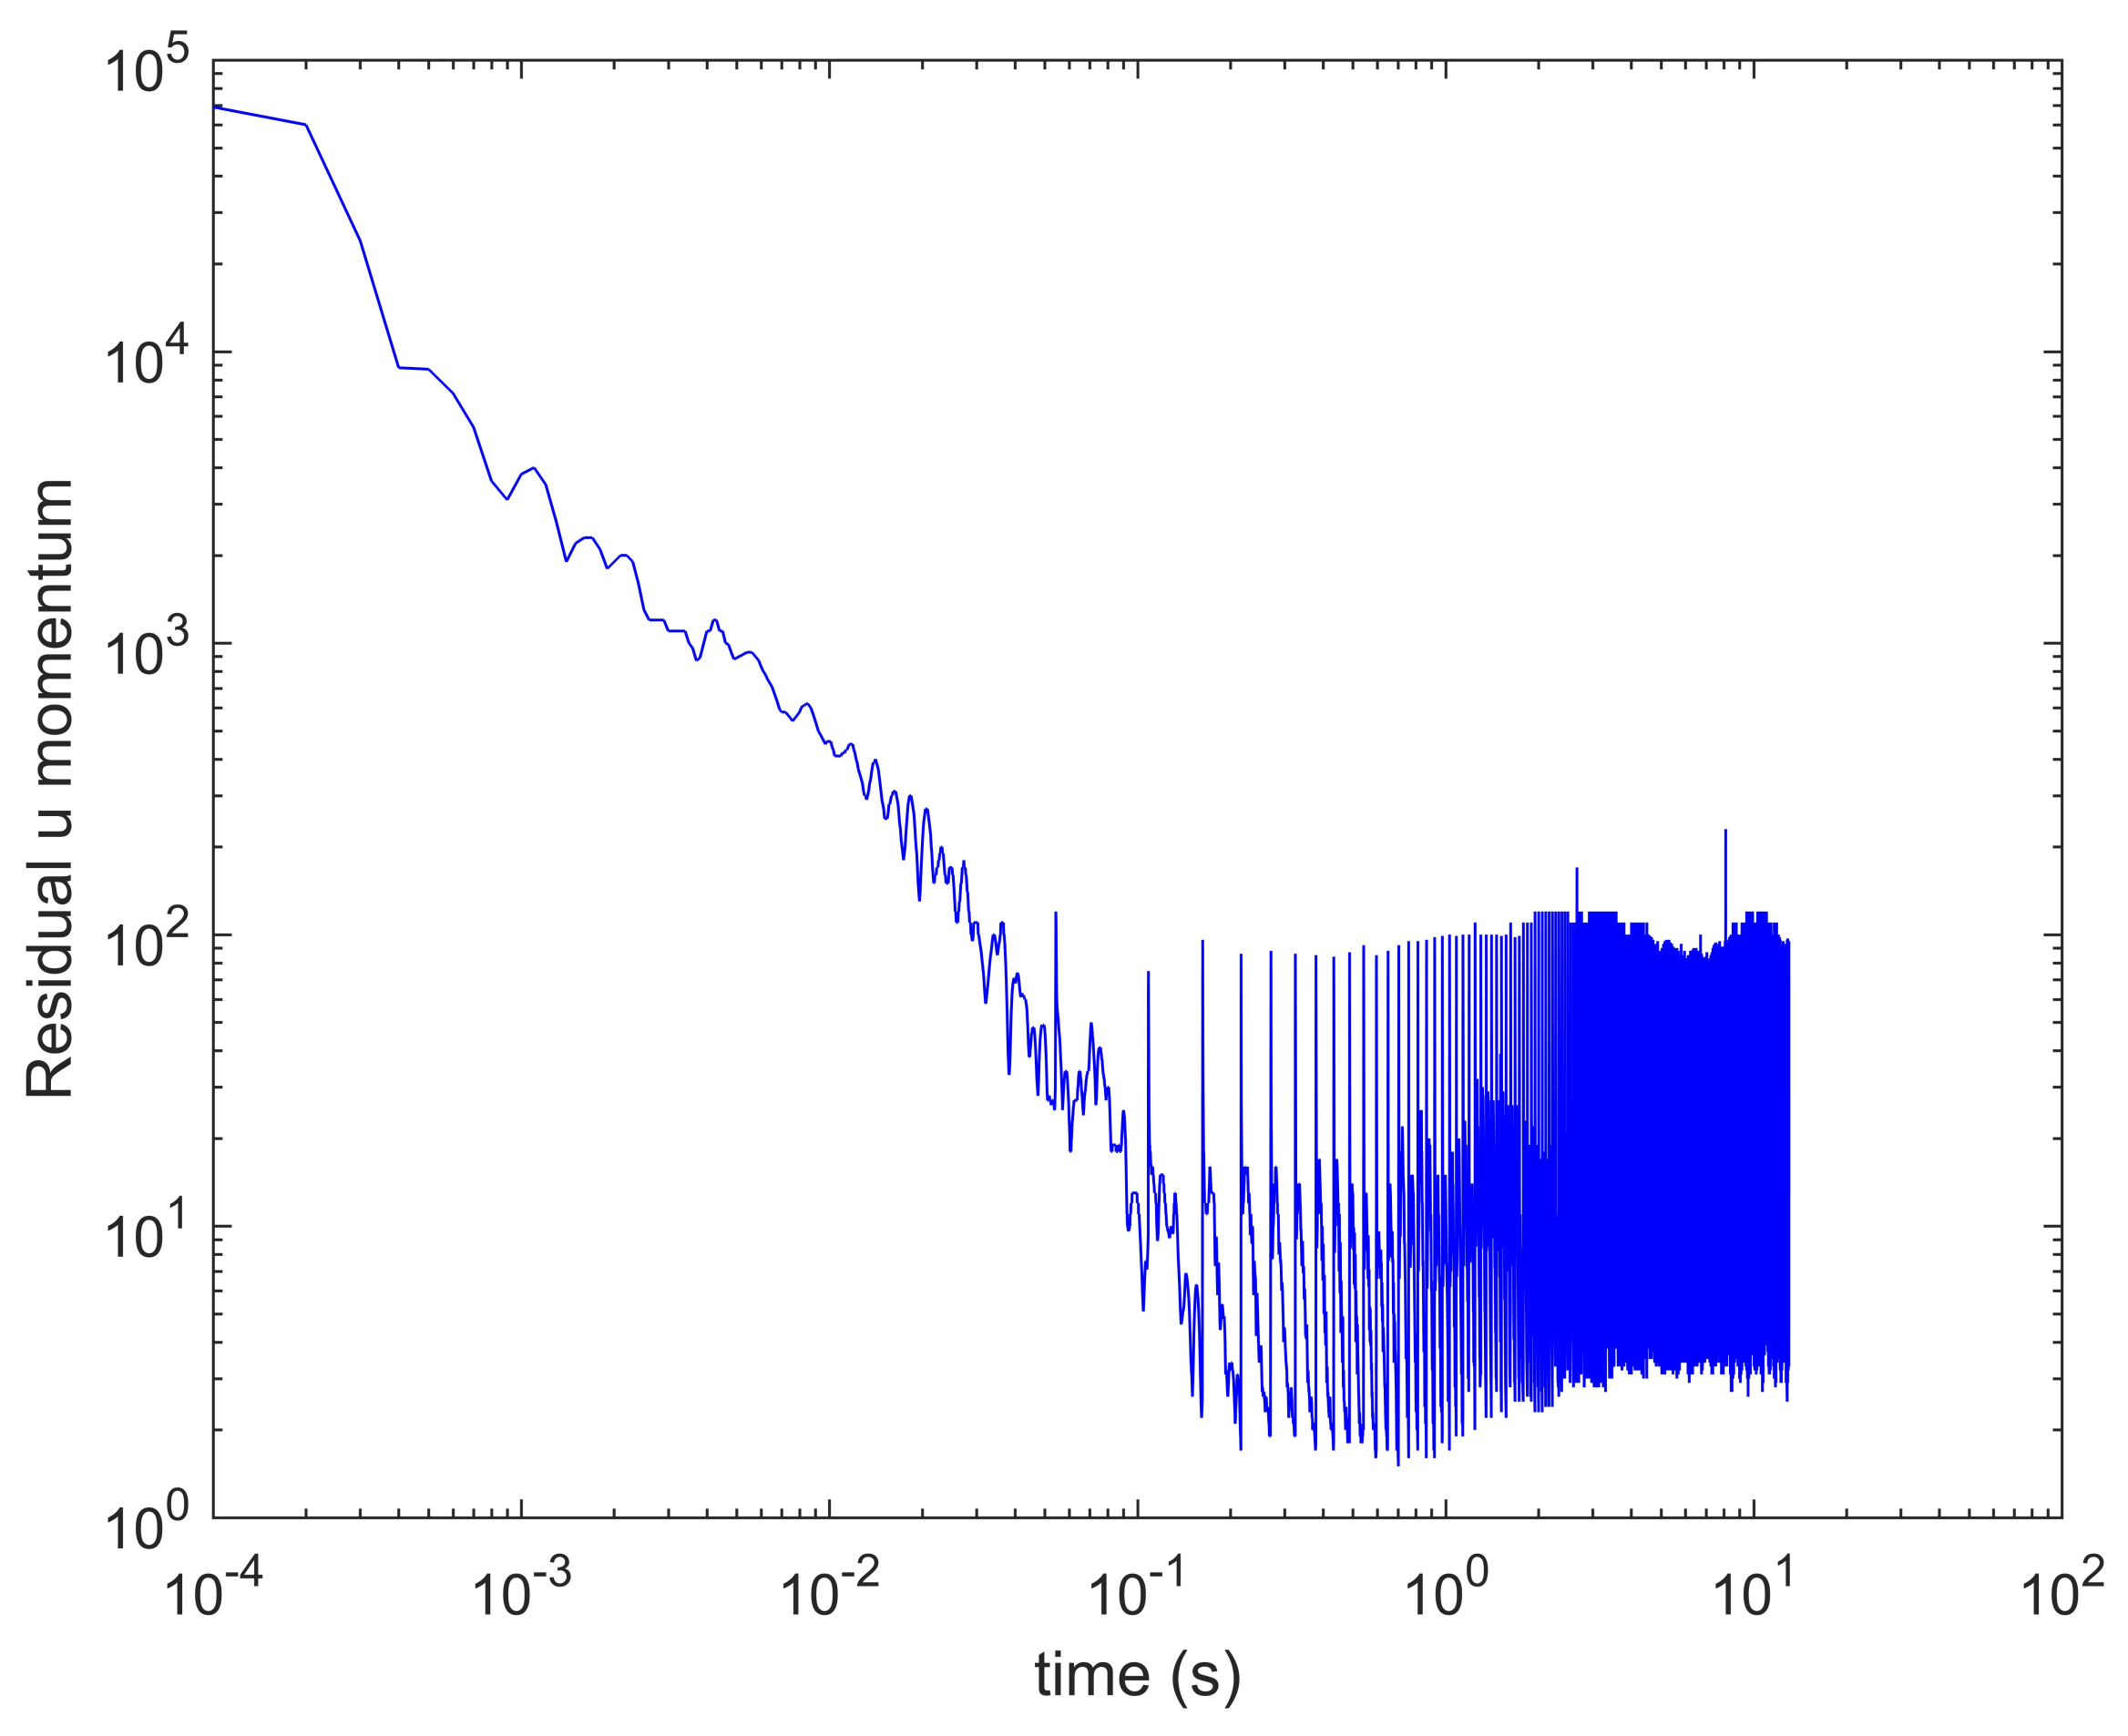
Because of some instabilities during the startup of the simulations, we first need to assess the time from which the flow becomes roughly steady, and then carry out all the analysis from this time on (thus removing the initial period of startup). This assessment could be conducted watching at the reduction of the residuals of the equations over time advance. Figure 7 shows this information for the momentum equation in u velocity component, where it can be seen how at s the residual stops dropping. A similar behaviour is found in the residual of mass balance equation, meanwhile for the VOF equation the residual stops dropping much earlier ( s).
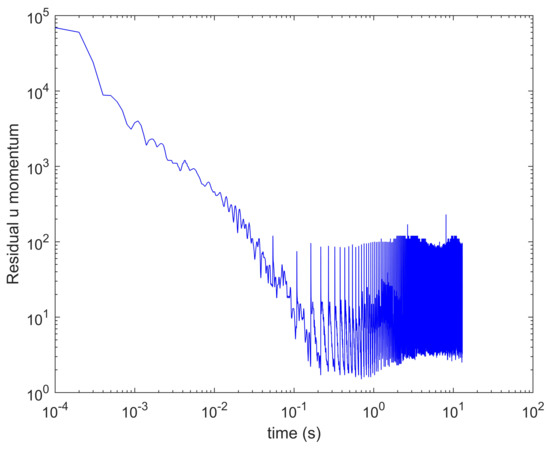
Figure 7.
Residual drop over time advance, for the u velocity component momentum equation.
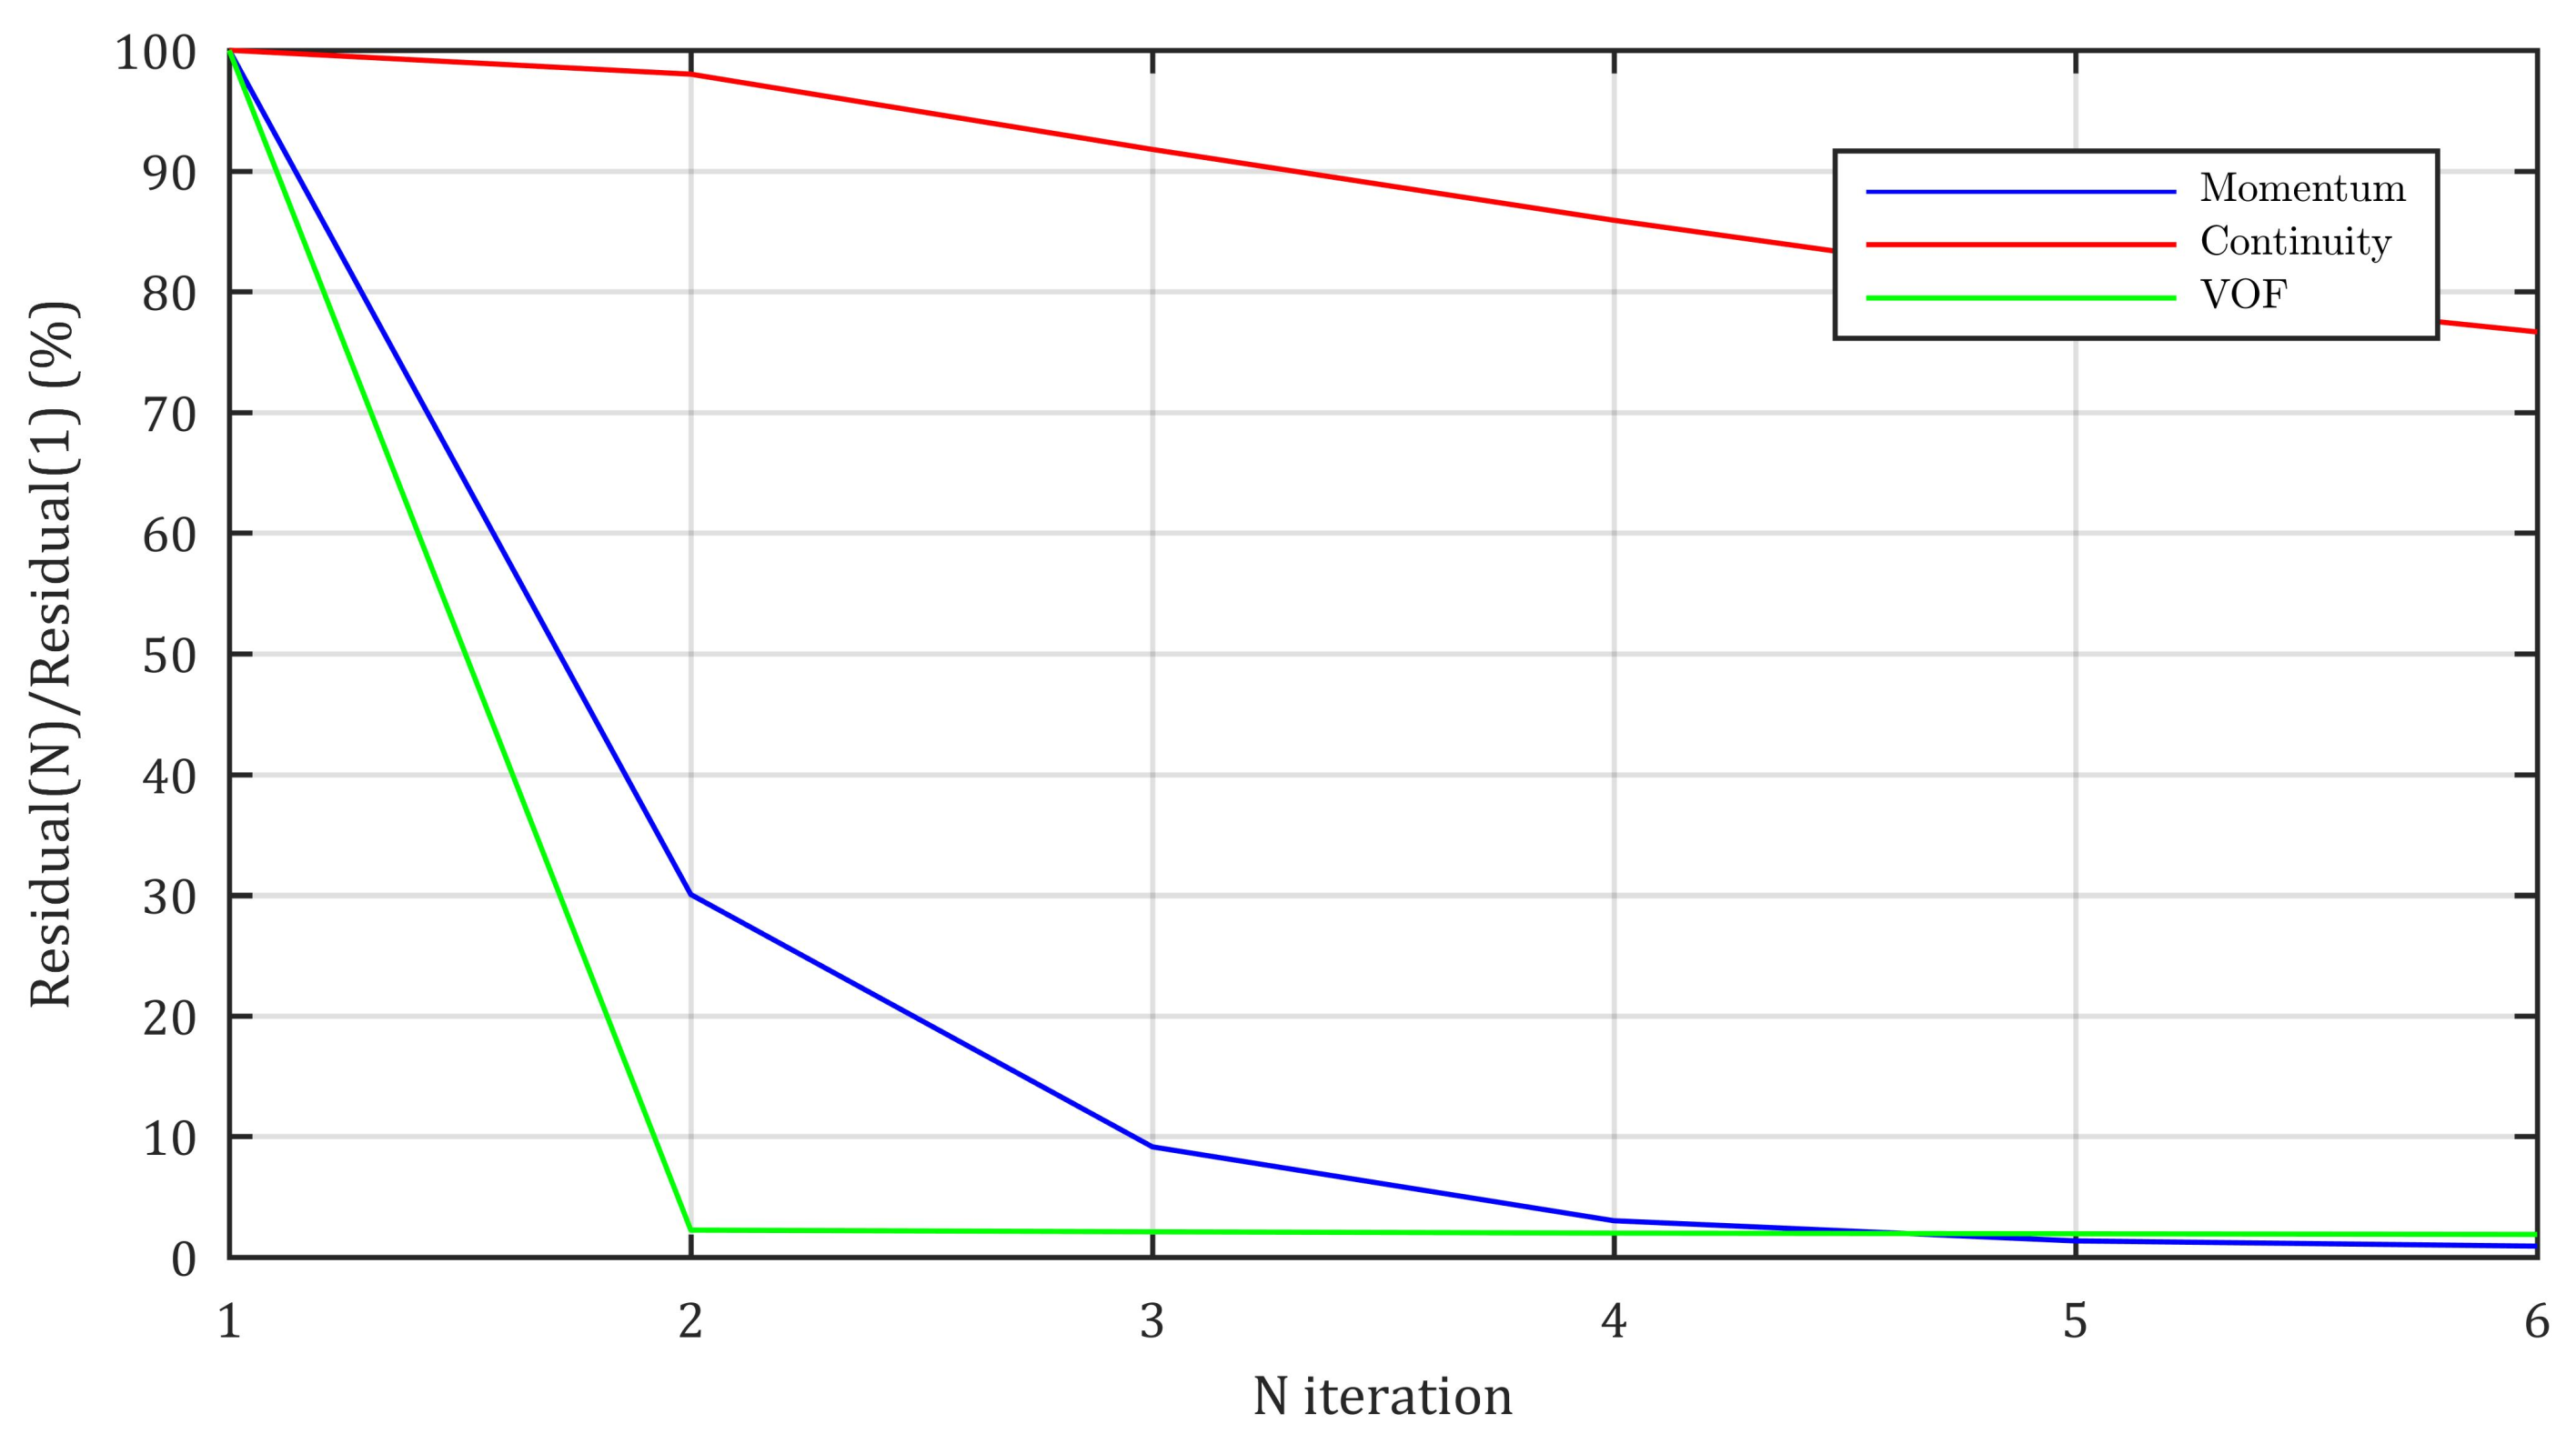
In this kind of simulations, the residuals of the equations should drop along the iterative process at each time step, reaching a steady value at certain number of steps of the outer iteration. The operating point of maximum power was selected to perform the iteration convergence study. For the assessment of the residual drop along the iterative process, the average among all time steps (from the initial time of steadiness assessed earlier), for each iteration step was performed. The result is plotted in Figure 8 for the residual of momentum, mass balance and VOF equations, where the value of the residual at each iterative step is normalized by its maximum value (the one at the first iterative step). It can be seen how at the number of six steps of the outer iteration, the residual of momentum equation is reaching a steady value. The residual of the mass balance equation appears to continuously drop beyond si steps, but at a very low rate, meaning that after the first iteration the mass balance is guaranteed. In addition, the transport equation of VOF method, would only need two steps to reach a steady residual.
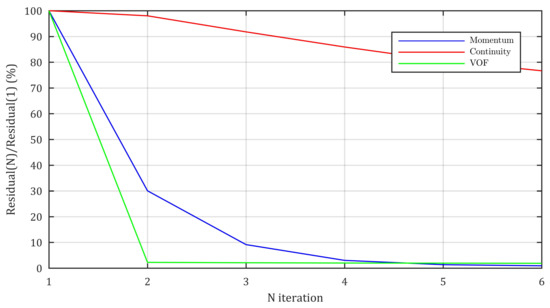
Figure 8.
Residual drop along iterative steps, for the u velocity component momentum equation, the mass balance equation and the VOF scalar transport equation.
2.6. Grid Dependency Study
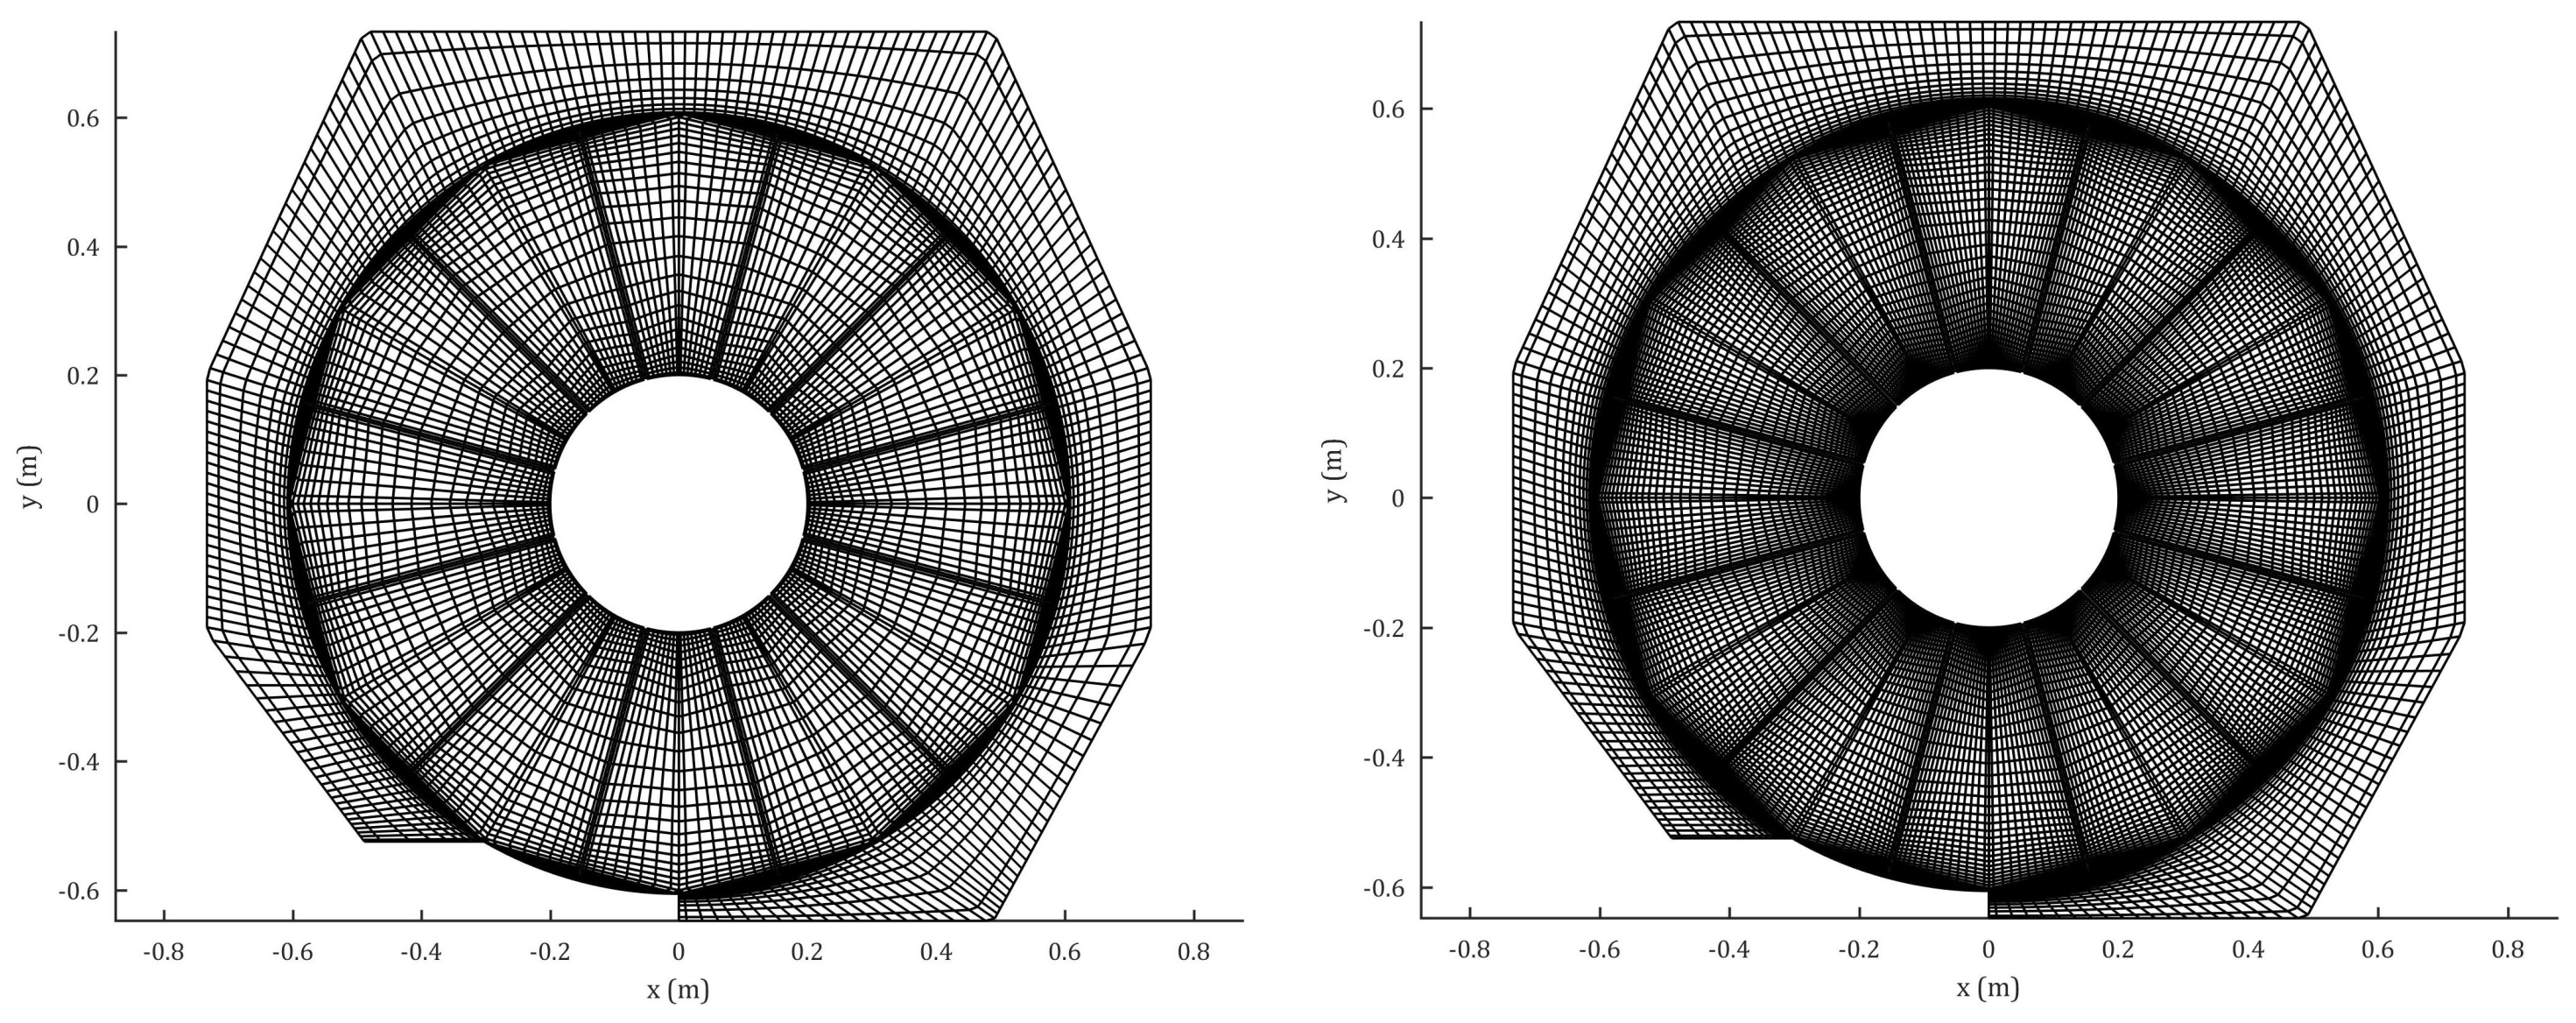
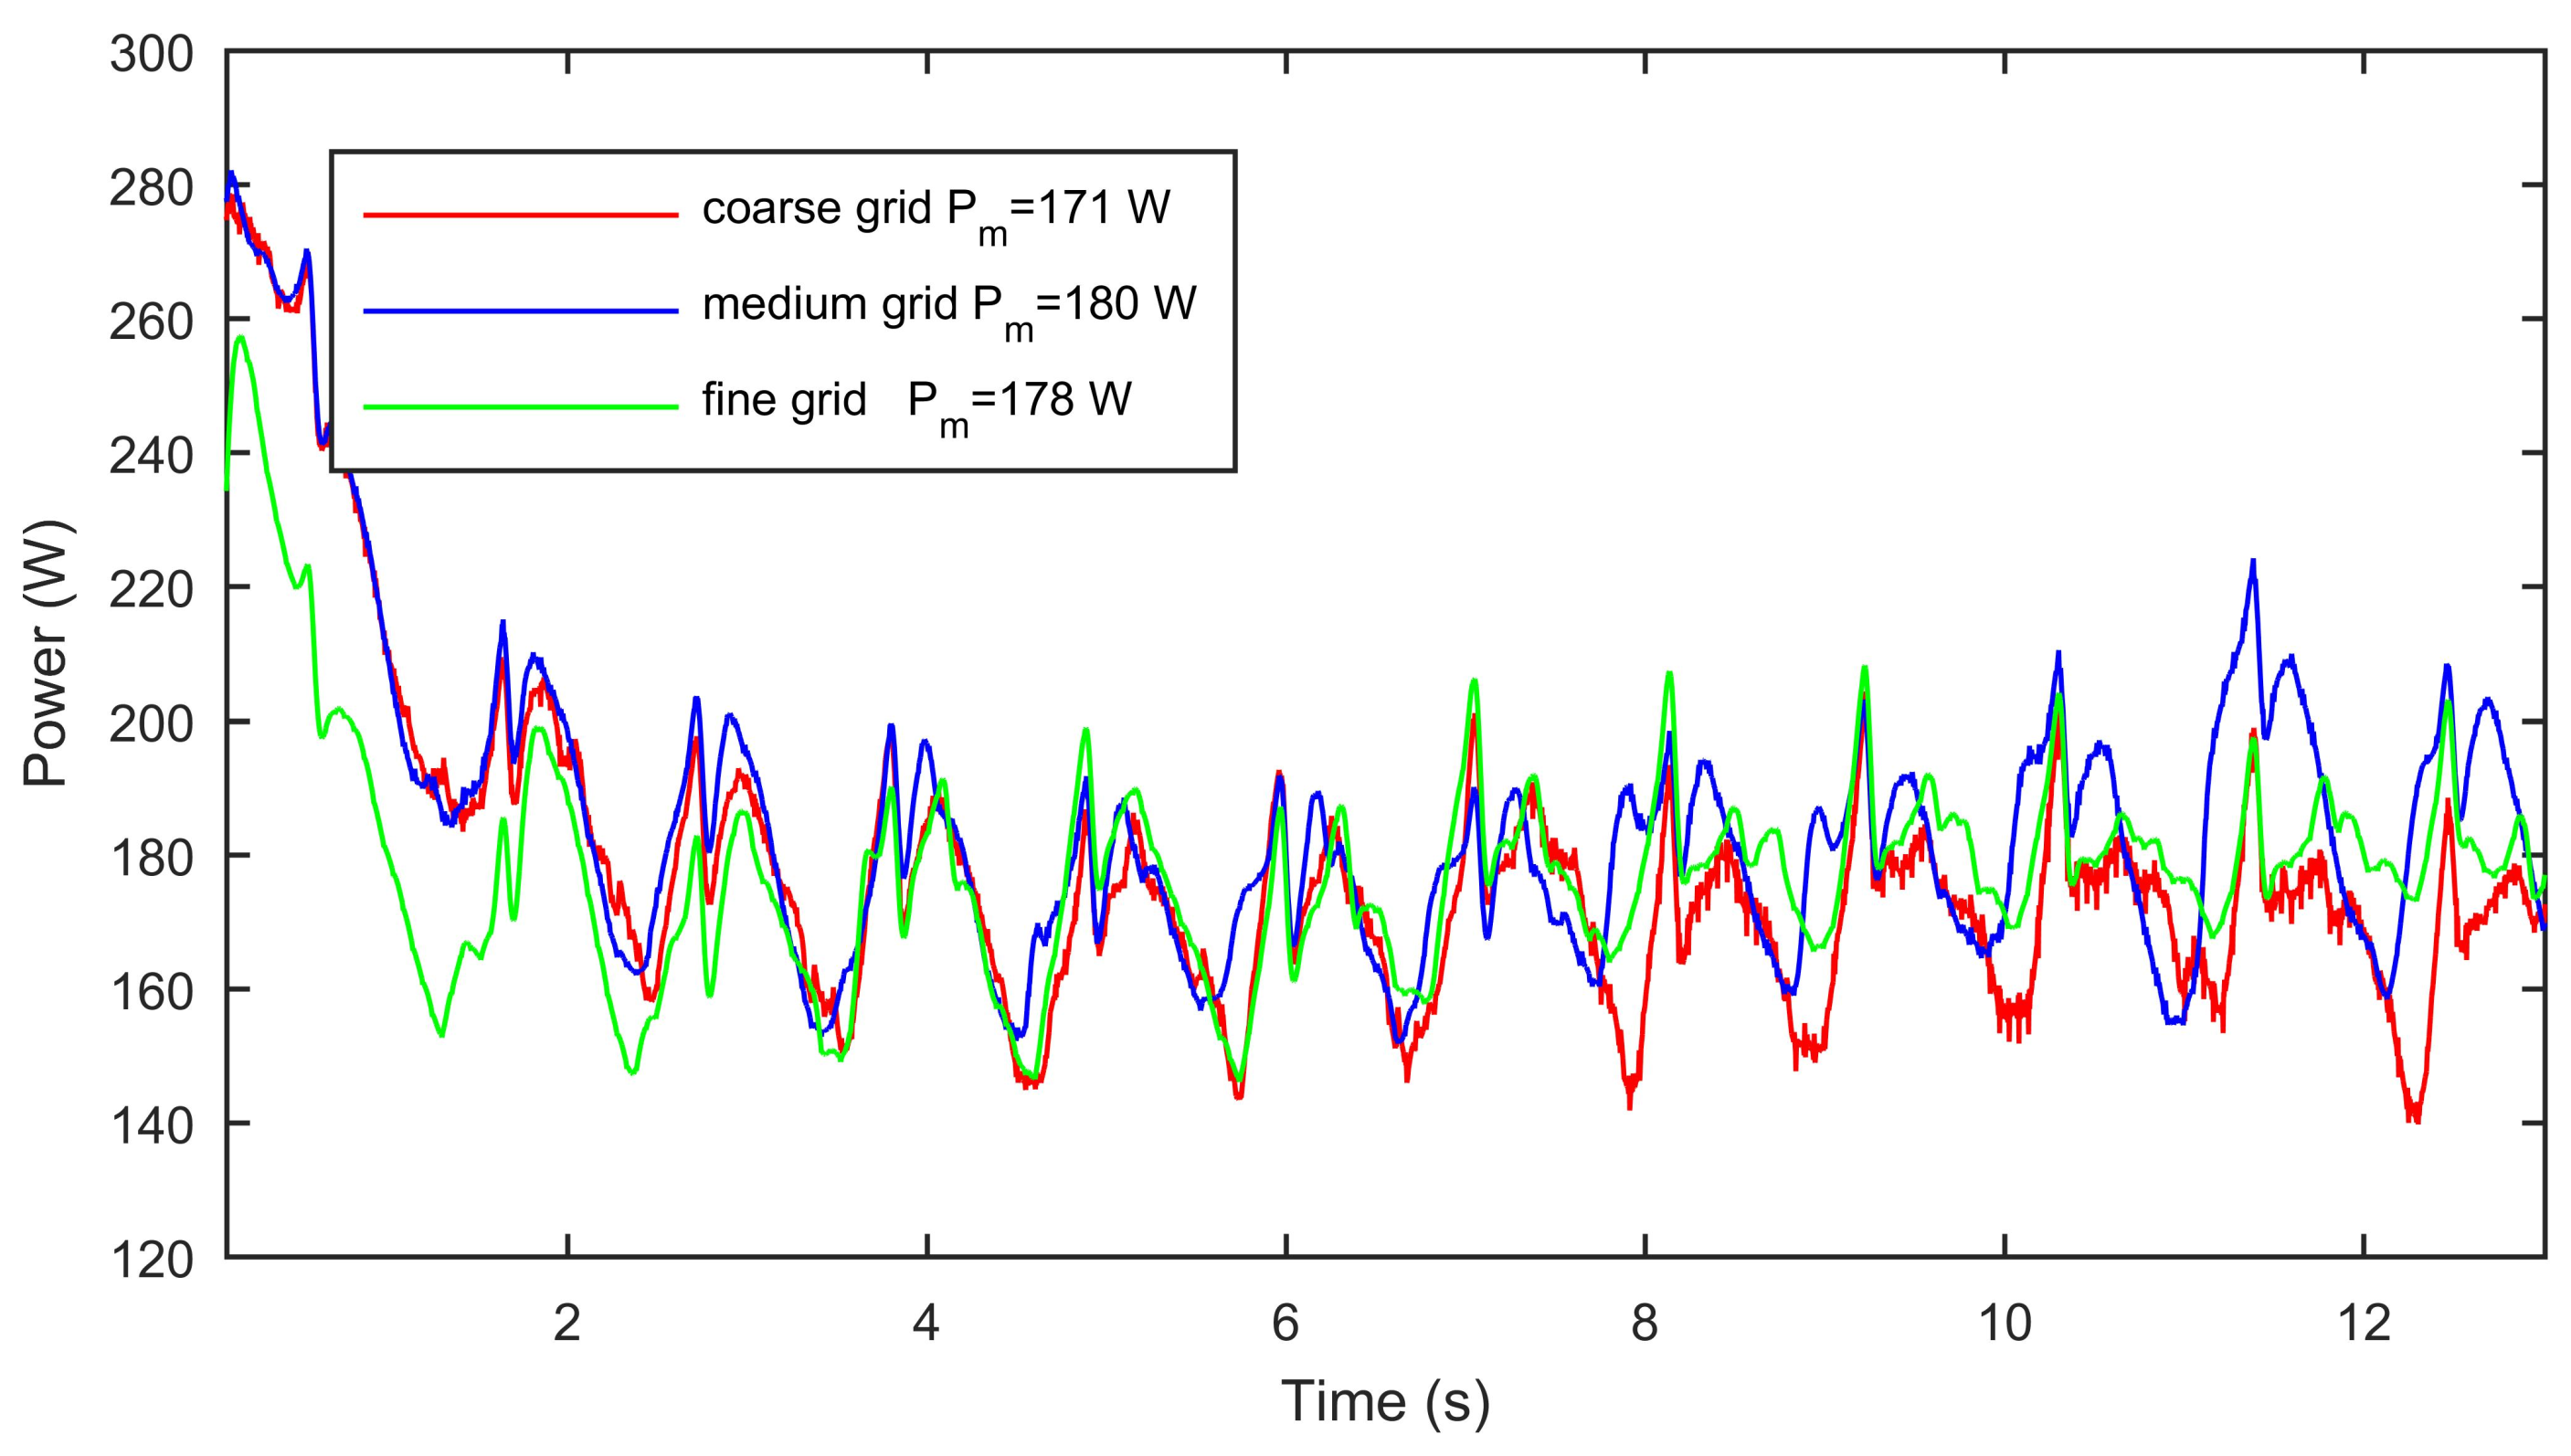
A grid sensitivity analysis was also performed, in order to check if the density of the mesh used along the simulations was adequate. Figure 9 shows the other two grids generated to assess the dependency. The medium grid (not shown in Figure 9) corresponds to the one described in Section 2.3. The coarse grid has roughly half the elements of the medium grid (), while the fine grid has roughly double the elements of the medium grid (). To give an idea of the density of the new meshes, in the blocks surrounding each blade, the distance from the center of the first element to the walls is 4 mm in the coarse mesh and 2.3 mm in the fine mesh, while in the medium mesh it is 3.1 mm.
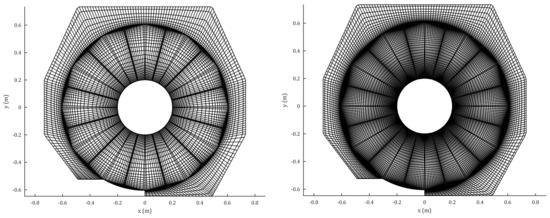
Figure 9.
Part of the computational mesh around the HPM, for the coarse (left) and fine (right) grids.
The operating point of maximum power was again selected to perform the grid dependency study. It was obtained, as expected, that the finer the grid, the lower the residuals of the equations. In addition, power evolution over time up to the first complete revolution of the HPM was plotted for the three grids, showing very similar behaviours (Figure 10). The first peak of power is related to the startup of the machine, and it was not considered when calculating the mean values.
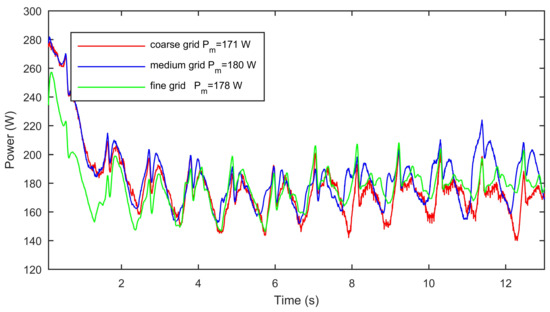
Figure 10.
Power evolution for operating point at L/s, for three grids with different densities (medium, coarse and fine).
The medium density grid was the one that gave an average power closer to the experimental value (186.7 W). This was the grid used across the present work for validating the simulations over the full operating range of the HPM.
3. Results and Discussion
The analysis of the simulation results is divided into four parts. Before presenting the data involved in the validation of the simulation and the characterization of the flow field, some characteristics of the turbulence of the resolved flow are shown. Regarding the validation of the simulations, a quantitative study is presented, where the calculation of the instantaneous power is carried out for different operating discharges of the HPM obtained from the numerical simulations. Then, the average power and efficiencies for each discharge were calculated and compared with the values presented in the HYLOW project. Finally, a qualitative study of the flow in the channel around the HPM is presented, with images of the behavior of the flow and streamlines colored by velocity and pressure.
3.1. Turbulence Charactaristics of the Flow
The main turbulence quantities of the flow were evaluated at one of the operating points of the HPM ( 58.9 L/s and rpm). The Reynolds number calculated from the mean velocity of the cross section of the channel downstream of the HPM and the height of the water in the same section, resulted in . The Reynolds number of the subgrid scales defined in Section 2.1.1 took values between 400 and 4000. In addition, the friction Reynolds number calculated from the shear velocity and half of the water height resulted in values around 3000.
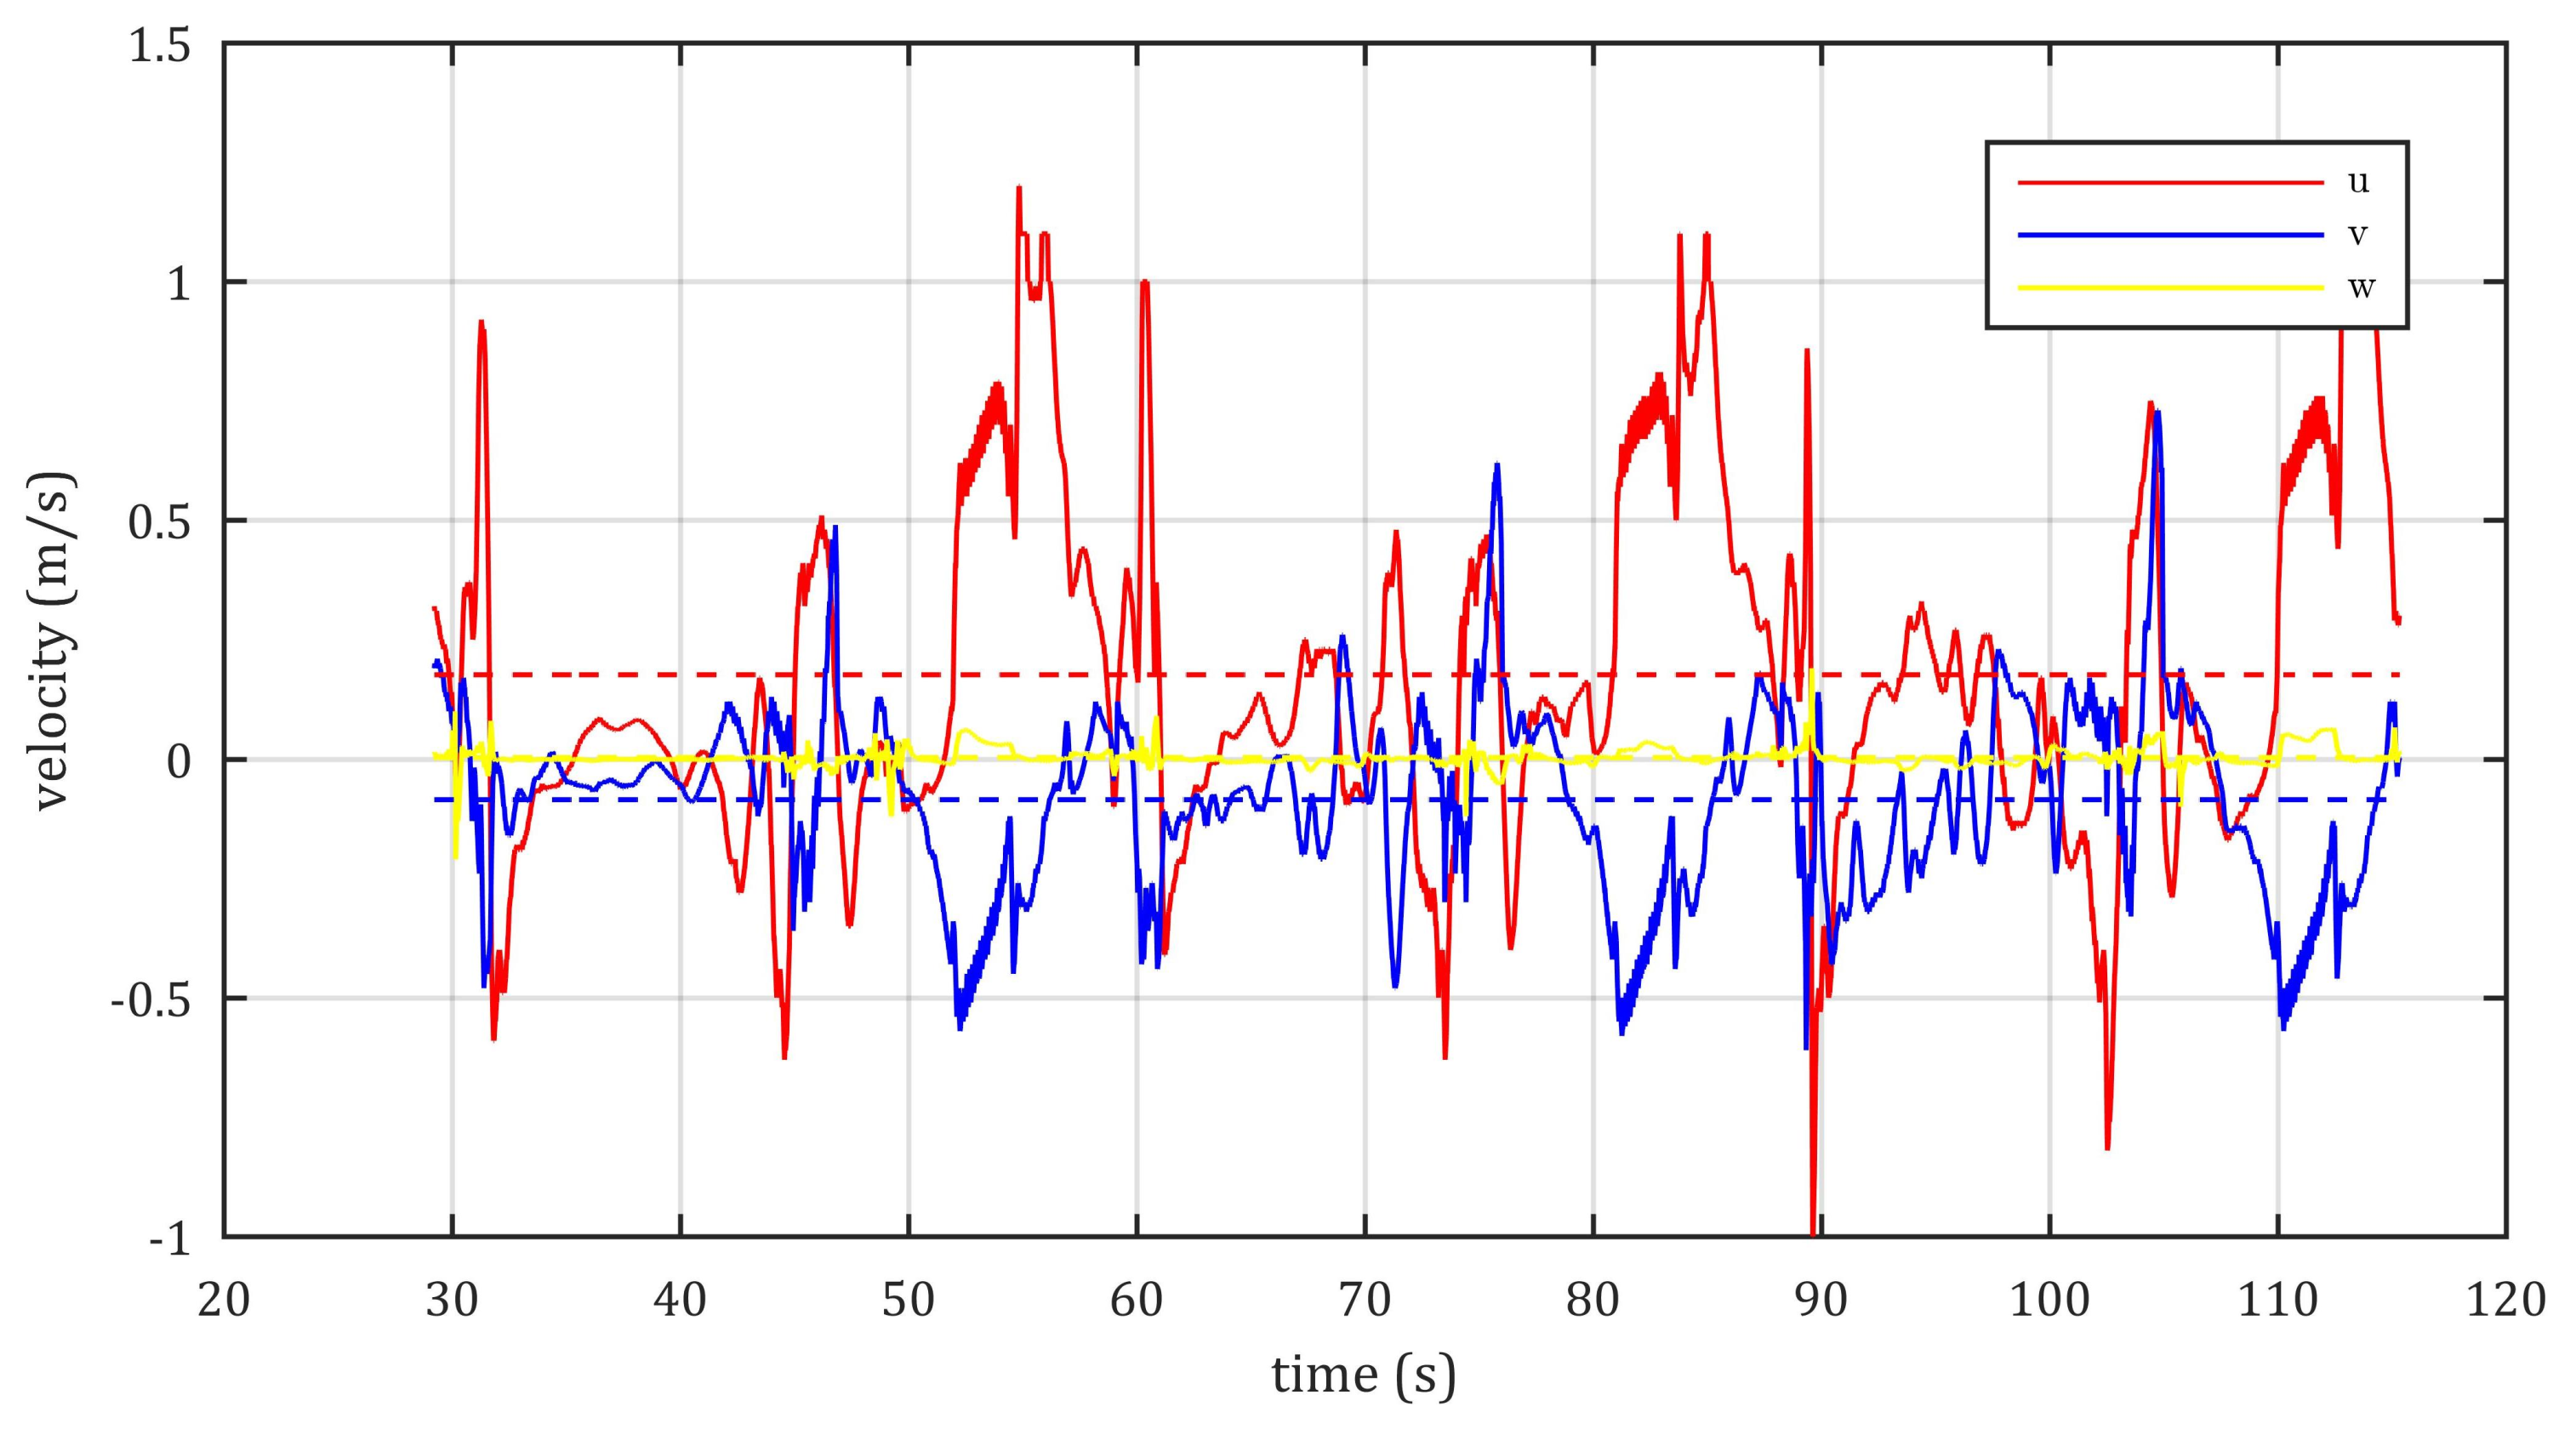
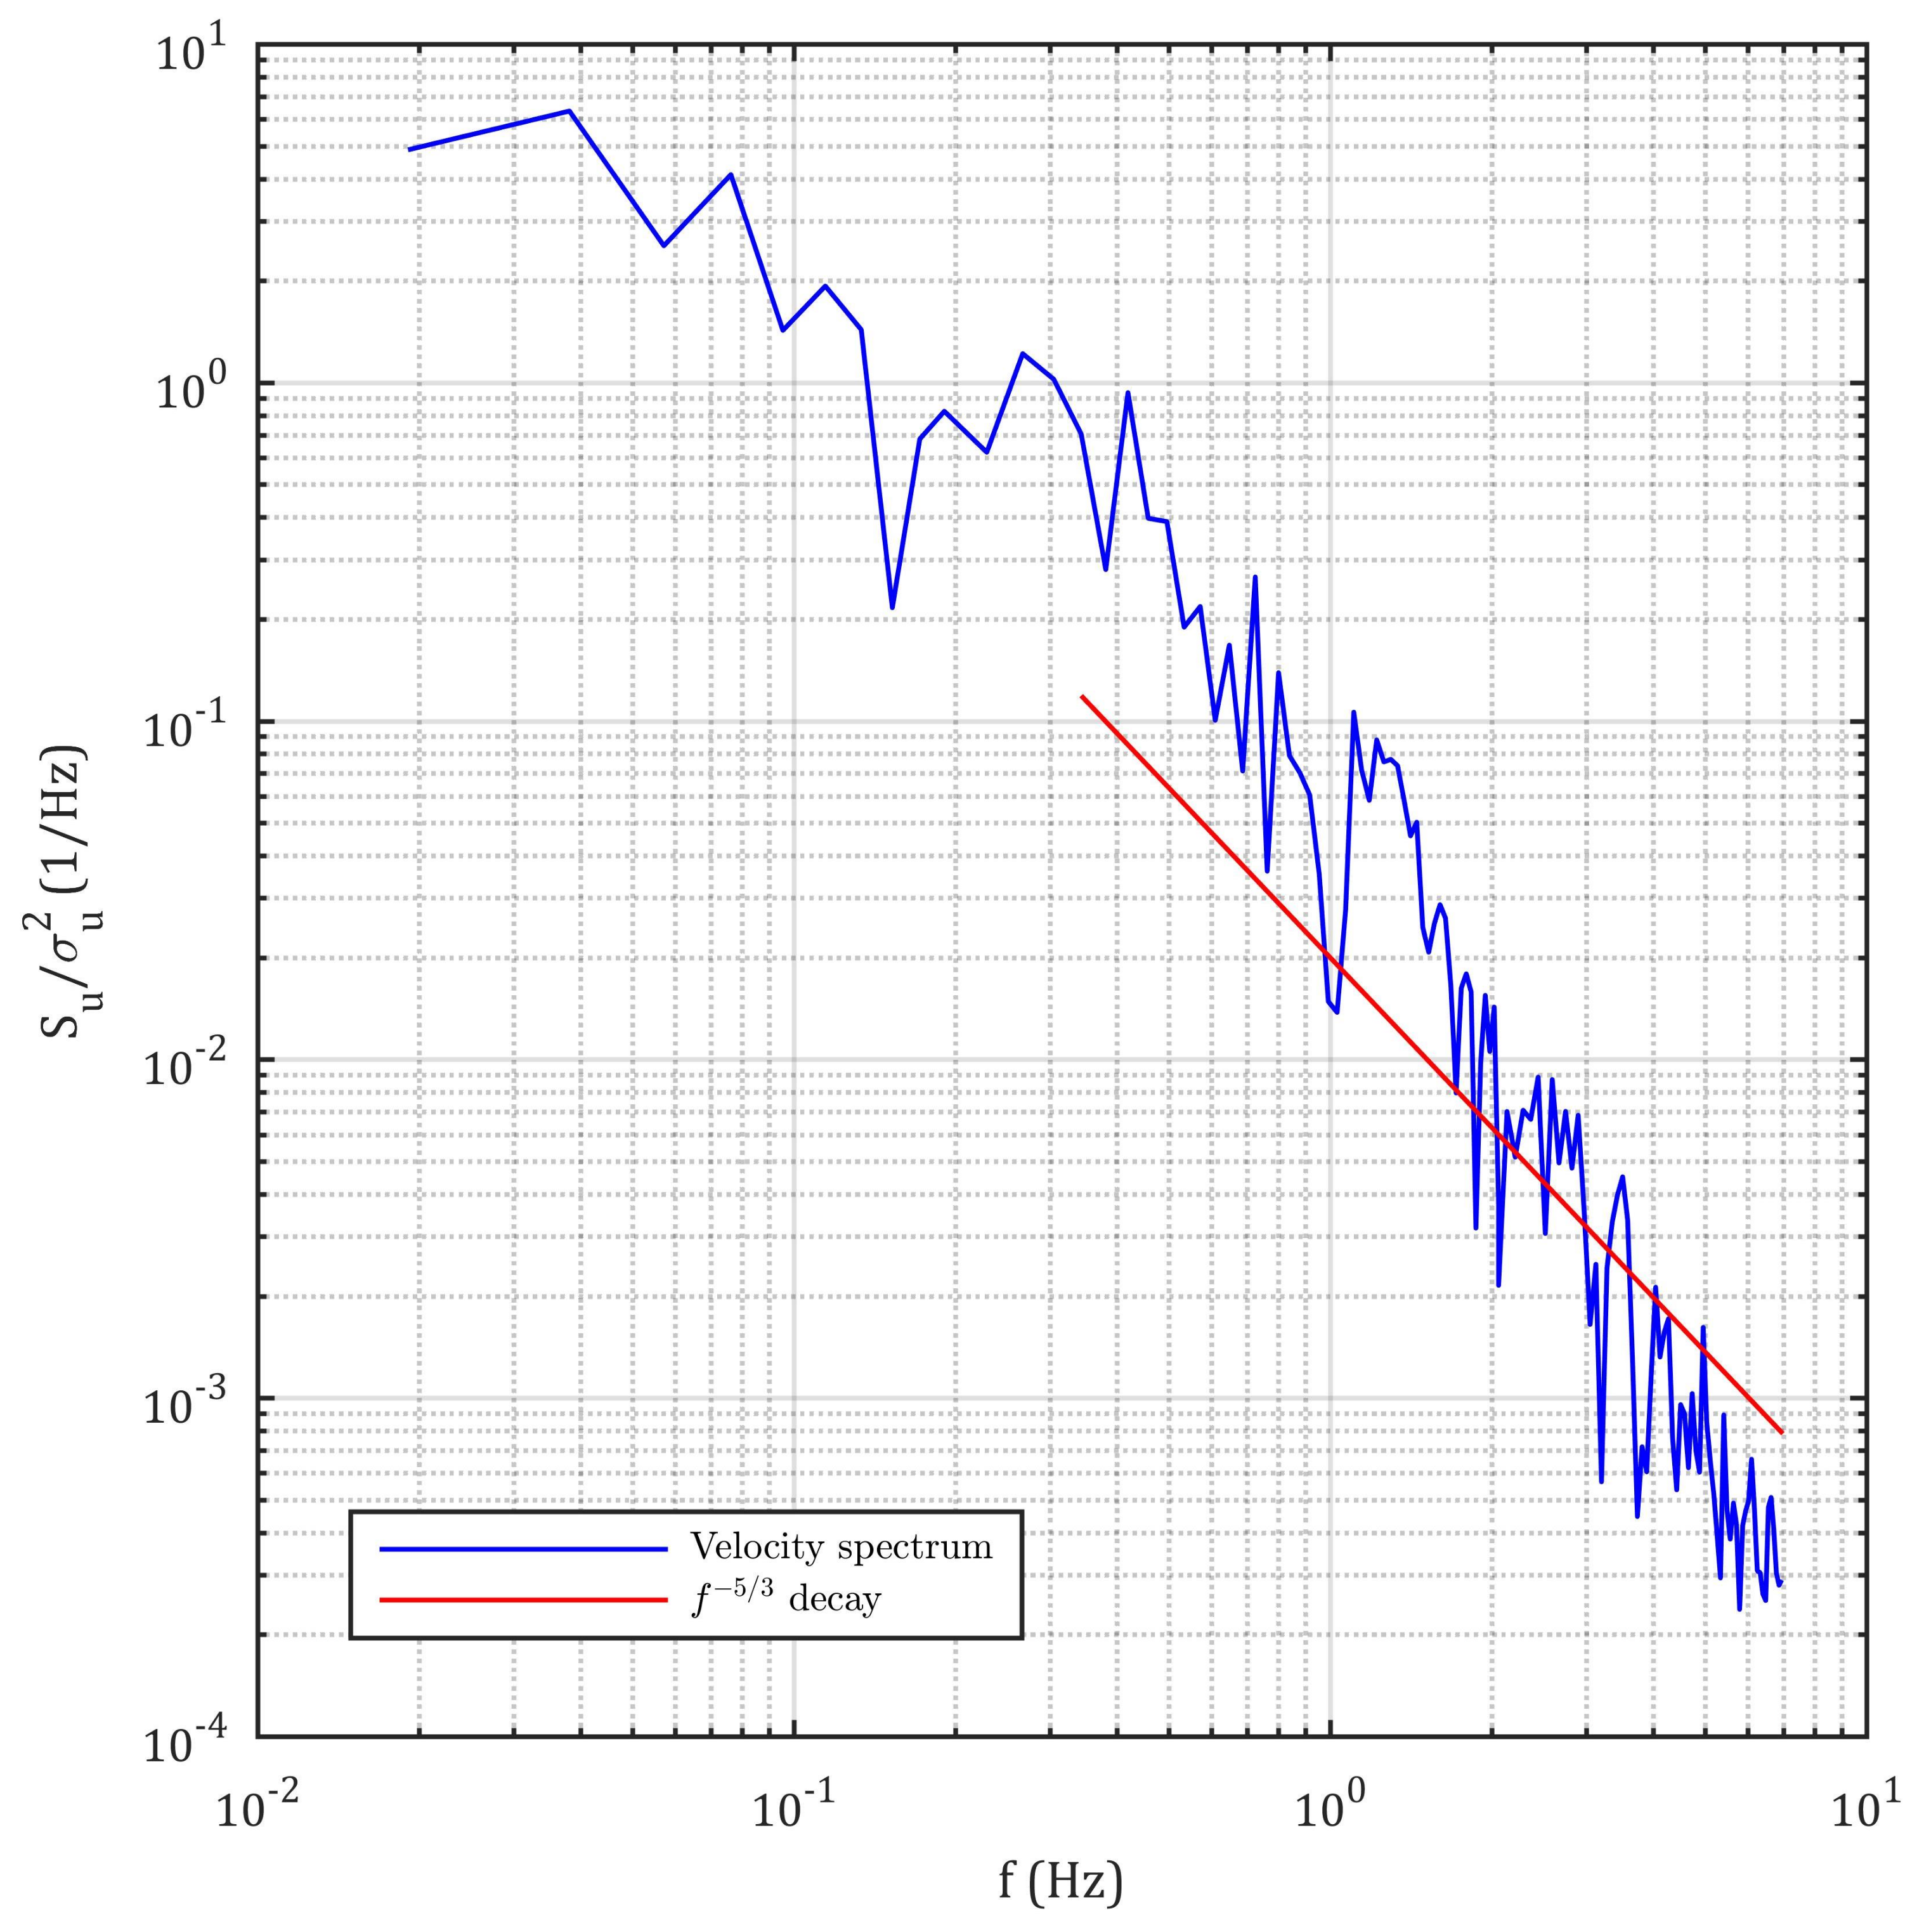
In order to obtain an idea of how well the turbulence of the flow was modeled, the spectrum of the turbulent velocity of a given cell element was obtained. The cell under study is an hexaedron of 51 mm × 7.3 mm × 14 mm (in longitudinal, transversal and vertical direction, respectively, and it is located downstream and close to the HPM (at 97 mm above the floor). The spectrum shows the turbulent kinetic energy distribution among all the scales of the flow, from the production to the dissipation scales, as well as the inertial subrange in between. Following Kolmogorov’s hypothesis [29], a decay of the energy in a rate of −5/3 is expected in the inertial subrange. For a correct spectral analysis, the mean velocity must be steady in the analysed period, conditioned that is satisfied for the three velocity components (longitudinal-u, vertical-v and transversal-w), as shown in Figure 11 for a period of 86 s.
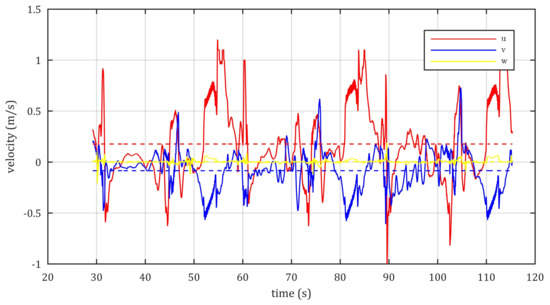
Figure 11.
Time series of the three velocity components (longitudinal-u, vertical-v and transversal-w). Broken lines represent the averages of each component.
The power spectrum of the longitudinal component of velocity is calculated by means of the fast Fourier transform, as described in [40]. For a better definition of the spectrum, the frequency range was divided in three subranges. For the low frequency range (between and 0.191 Hz), the entire set of data was used to calculate the spectrum. For the medium frequency range (between 0.191 Hz and 2.06 Hz), the data were divided in two subsets and the average of both spectrums was calculated. Finally, for the high frequency range (between 2.06 Hz and ), the data were divided in four subsets and the average of all four spectrums was calculated. The result was normalized by the square of the standard deviation (representing a power spectral density) and plotted against frequency in Figure 12, together with the −5/3 decay law. Because the number of data points used to compute the spectrum has to be a power of 2, it was necessary to cut the data to 52.4 s ( data points). The minimum frequency is related to the total time of the data and is assessed as Hz, while the maximum frequency depends on the average horizontal velocity ( m/s) and the length of the cell element ( mm) and is assessed as Hz.
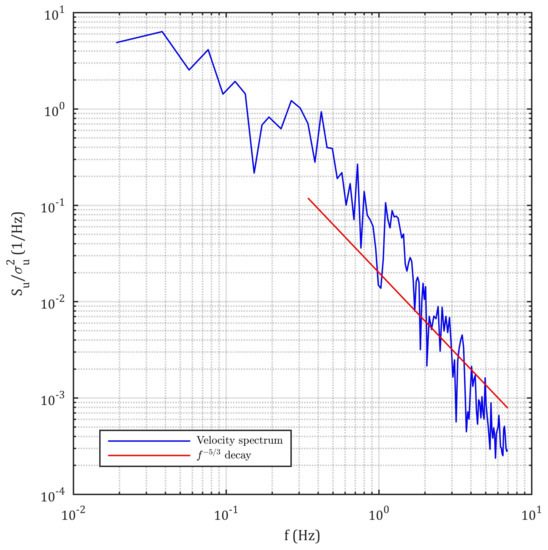
Figure 12.
Power spectral density of the longitudinal component of velocity.
From the value of the spectrum at one can obtain an estimate of the longitudinal integral length scale (characteristic of the energetic vortices) as [29]:
which in this case resulted in m (similar to half the height of the water in the channel downstream of the HPM). The turbulence intensity () resulted as high as 94%, supporting the choice of LES over RANS to model the turbulence in this study.
3.2. Instantaneous Power
The maximum discharge in the simulations was 120 L/s (higher discharges yielded great instabilities that did not represented the actual performance of the HPM), and the working point L/s was added, which, although it was not included in the experimental tests, was useful to obtain smoother operating curves in a zone of unsteady performance of the HPM. In addition, the point corresponding to L/s was included, which was not part of the experimental tests either. A simulation was carried out in order to evaluate the leakage flow through the HPM (), for which the wheel was left stationary and the same discharge as in the experimental tests (25 L/s) was considered. It was found that the water levels before and after the HPM remained constant for a considerable time (20 s), so it was possible to conclude that L/s in the simulations of the analyzed HPM.
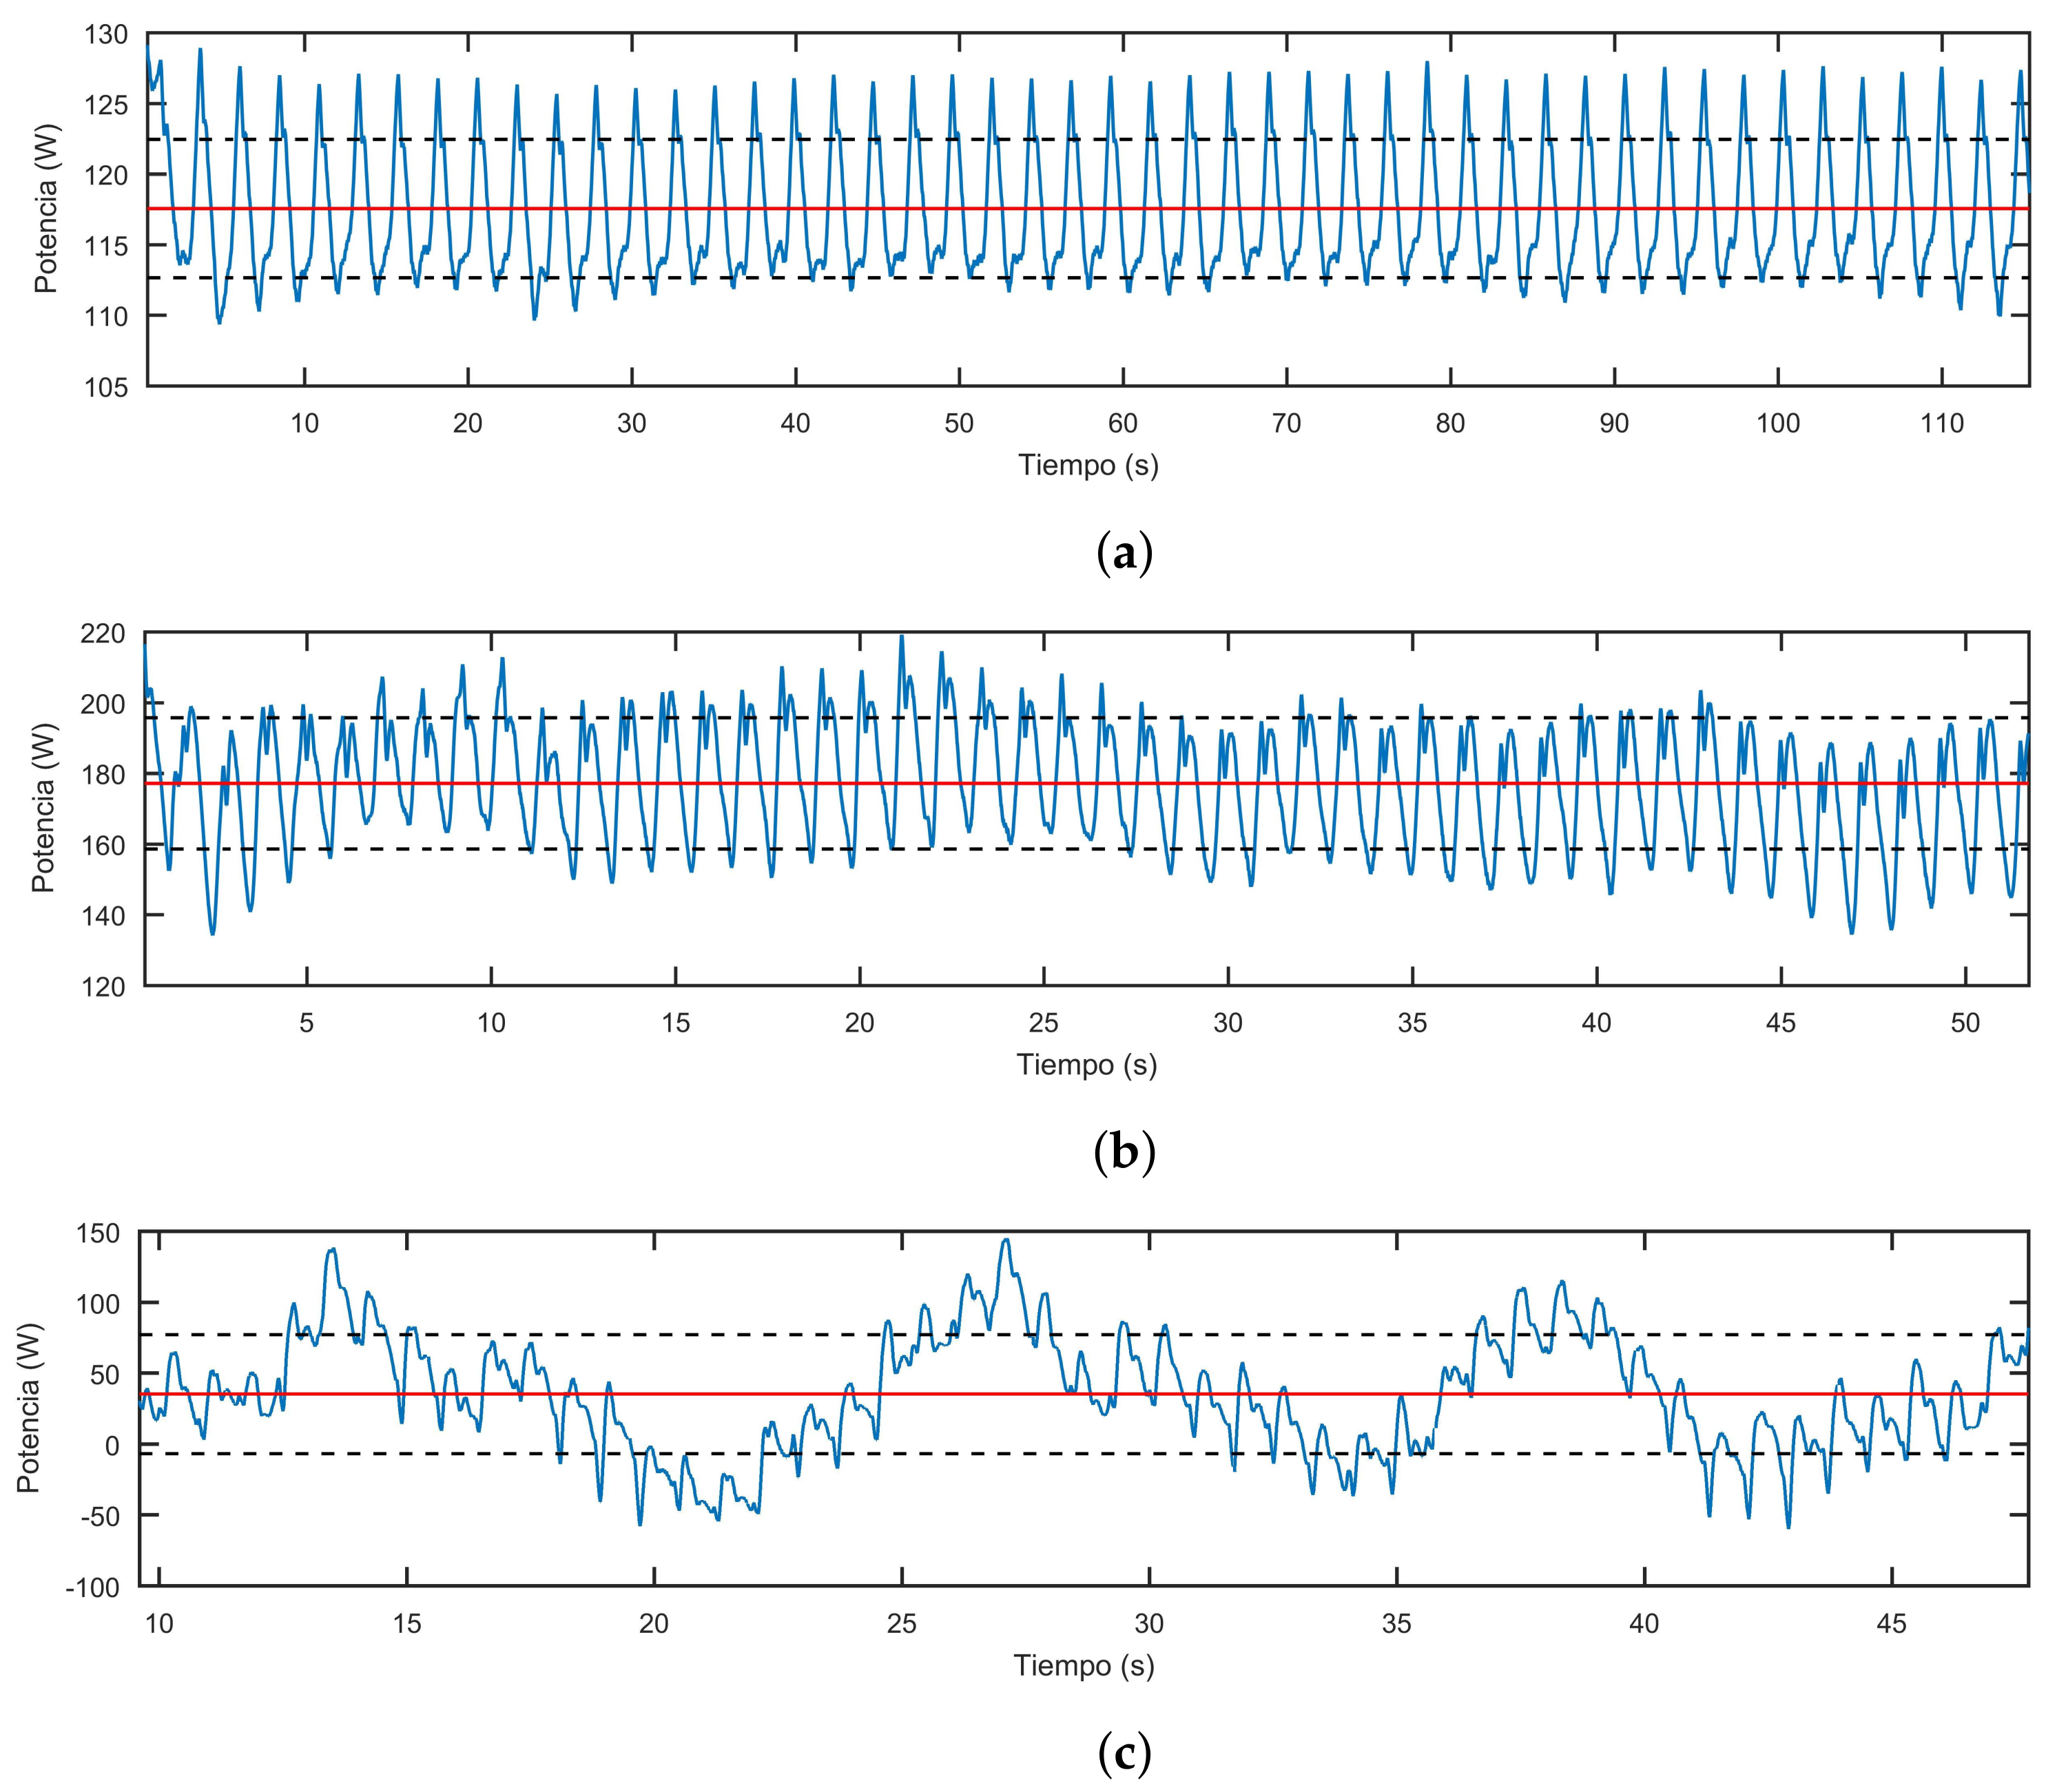
Figure 13 shows time evolution of the instantaneous power of the HPM for discharges 58.9 L/s (Figure 13a), 97.8 L/s (Figure 13b) and 120 L/s (Figure 13c). The first few seconds are not shown, because from the beginning of the simulation up to the first blade passage, a power peak was observed followed by a transient behaviour where the power does not stabilize. The time interval that is plotted in each graph corresponds to four turns of the HPM. In each graph, the red line corresponds to the mean power and the broken black lines represent the intervals corresponding to the standard deviation of the power.
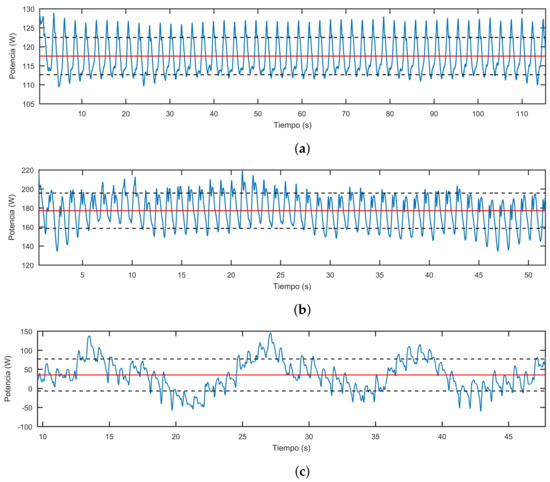
Figure 13.
Instantaneous power over 4 turns of the HPM for three operating points: (a) L/s, (b) L/s and (c) L/s.
The waveform with the highest frequency presented by the power curves responds to the blade pass frequency of the HPM. In the curves corresponding to discharges greater than 97.8 L/s, this waveform is superimposed with another of lower characteristic frequency associated with a complete turn of the wheel. This last wave increases its amplitude as the discharge increases, even causing the HPM to present time intervals with negative power (see Figure 13c).
3.3. Mean Power and Efficiency
From the time evolution of the instantaneous power, the average power for each discharge was calculated and the efficiency for each working point was assessed. Table 2 summarizes the main parameters and results of the operation of the HPM at different discharges. The rotating speeds, which differ from those presented in Figure 3b and in Table 1, were selected in such a way that during the simulations the water level before the HPM remained constant at the upper edge of the hub (the level after the HPM is controlled by the height of the weir).

Table 2.
Operating points of the HPM of straight blades of in diameter, from the simulations in caffa3d.
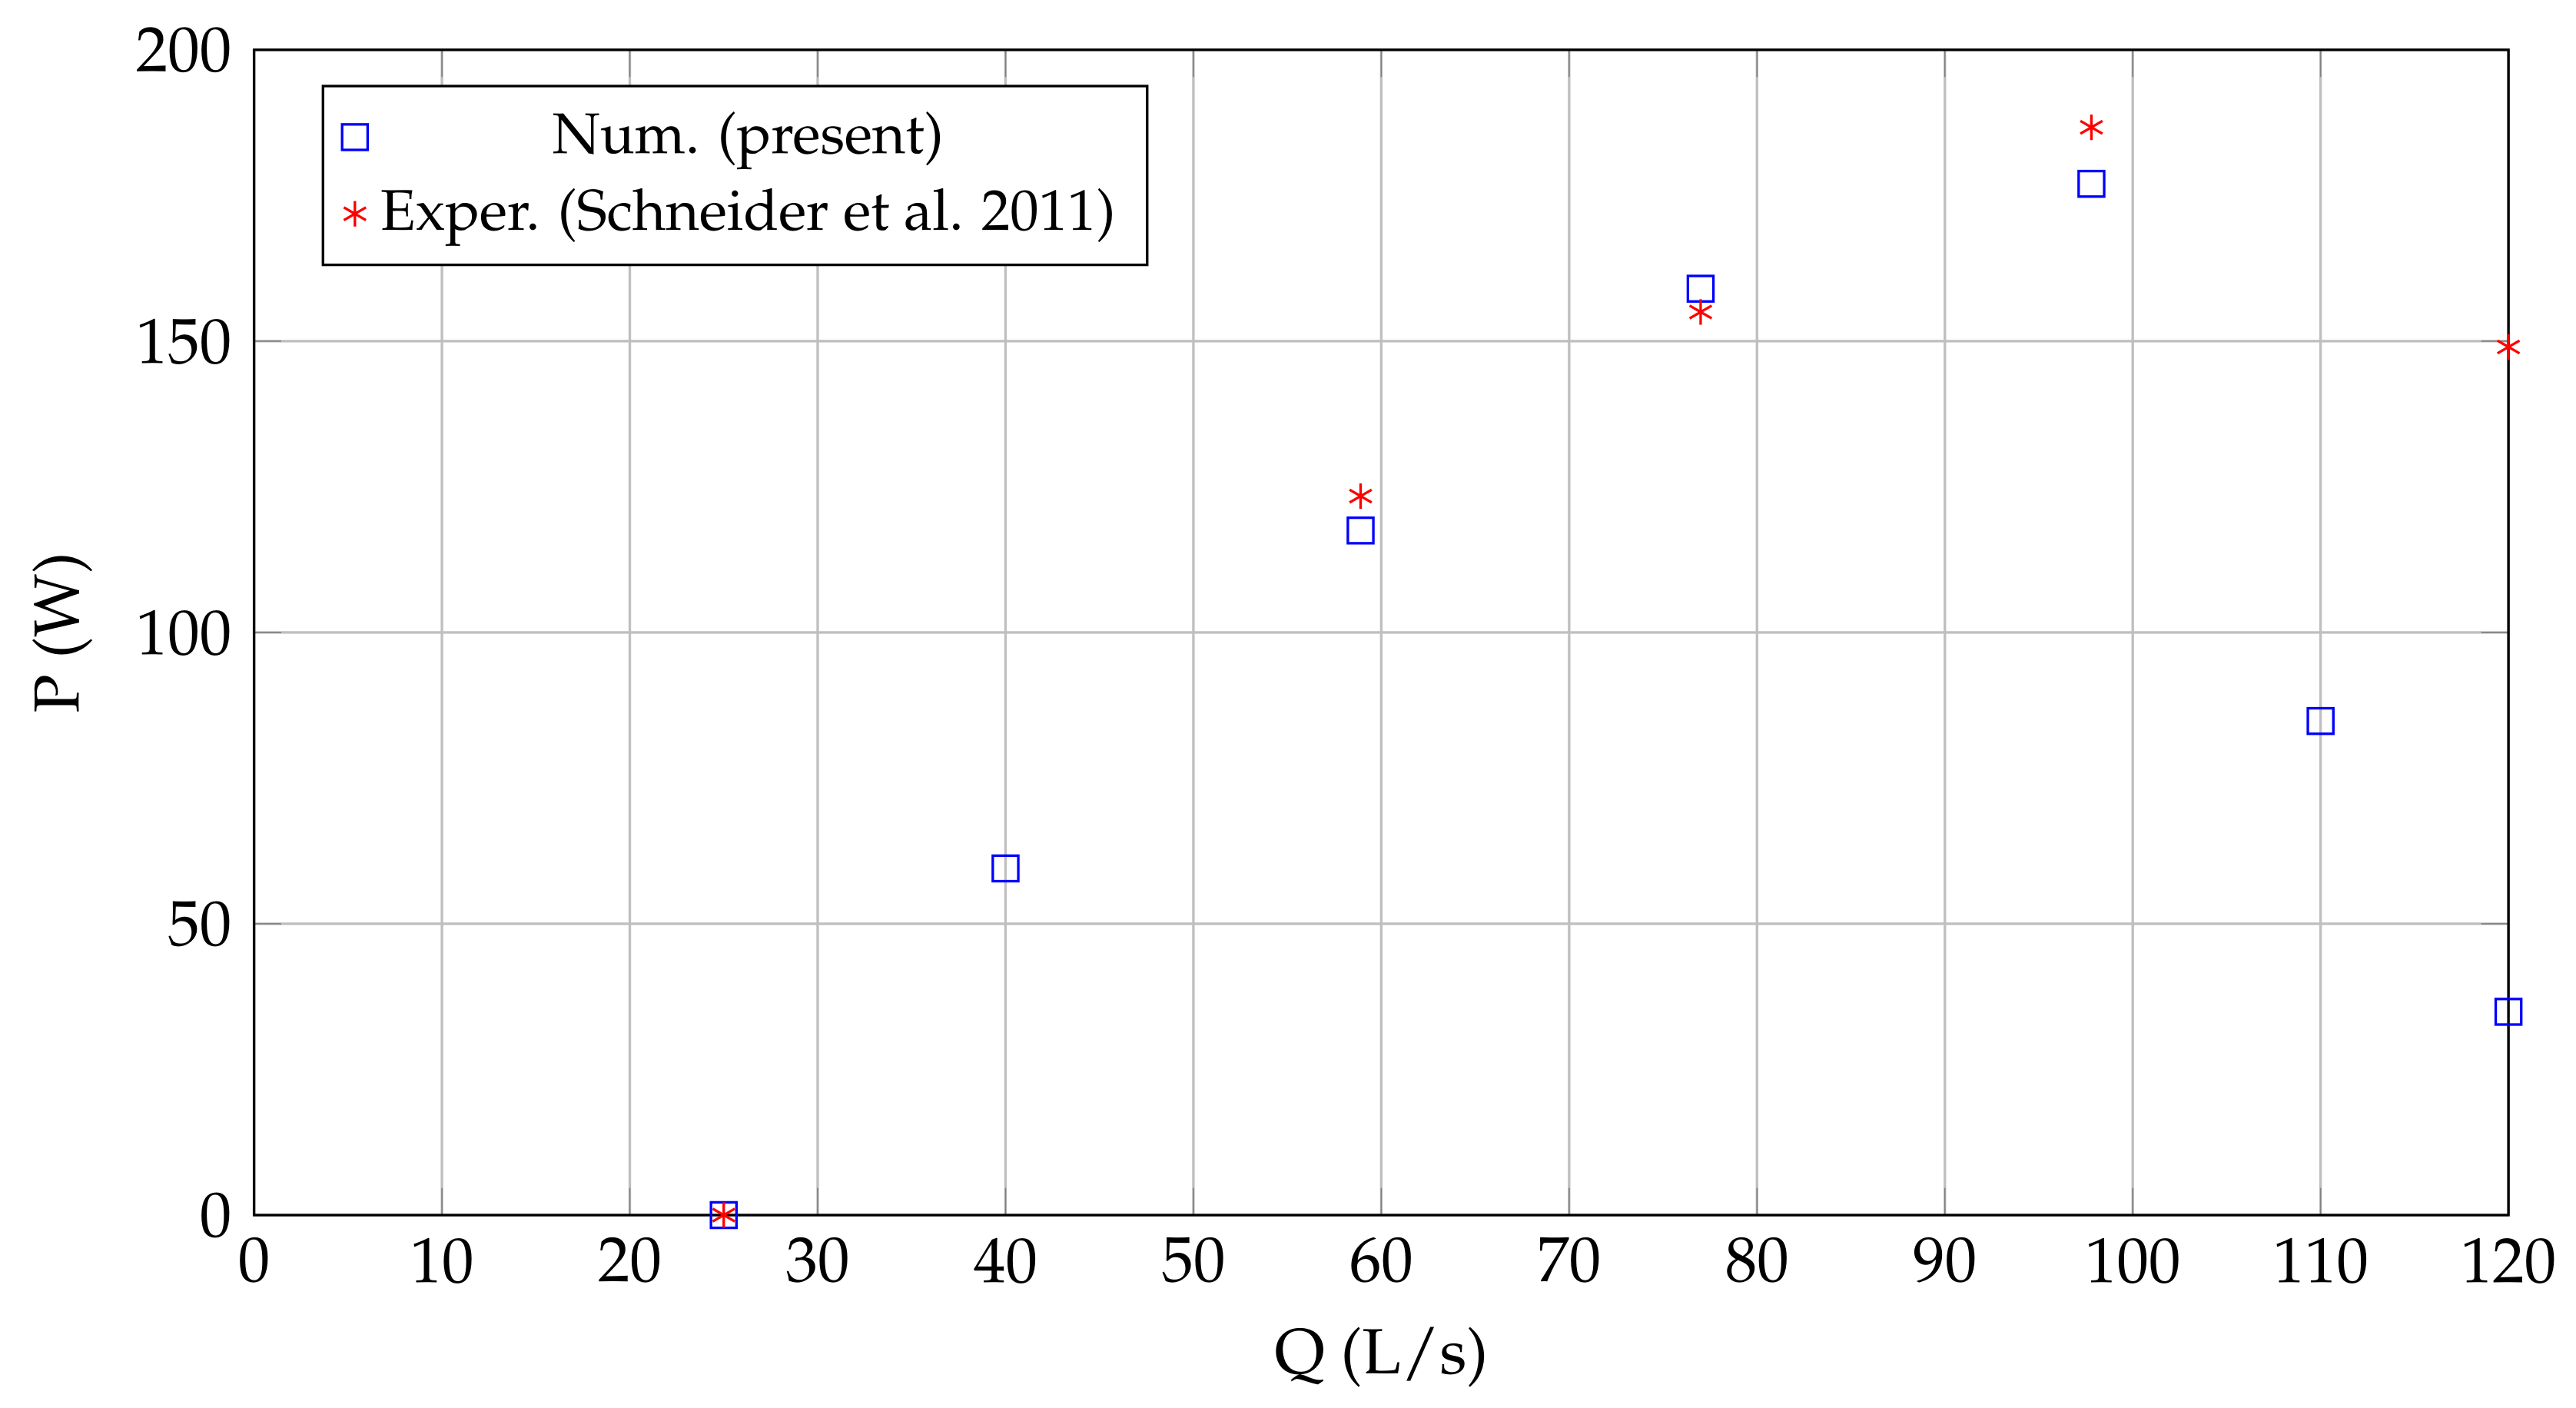
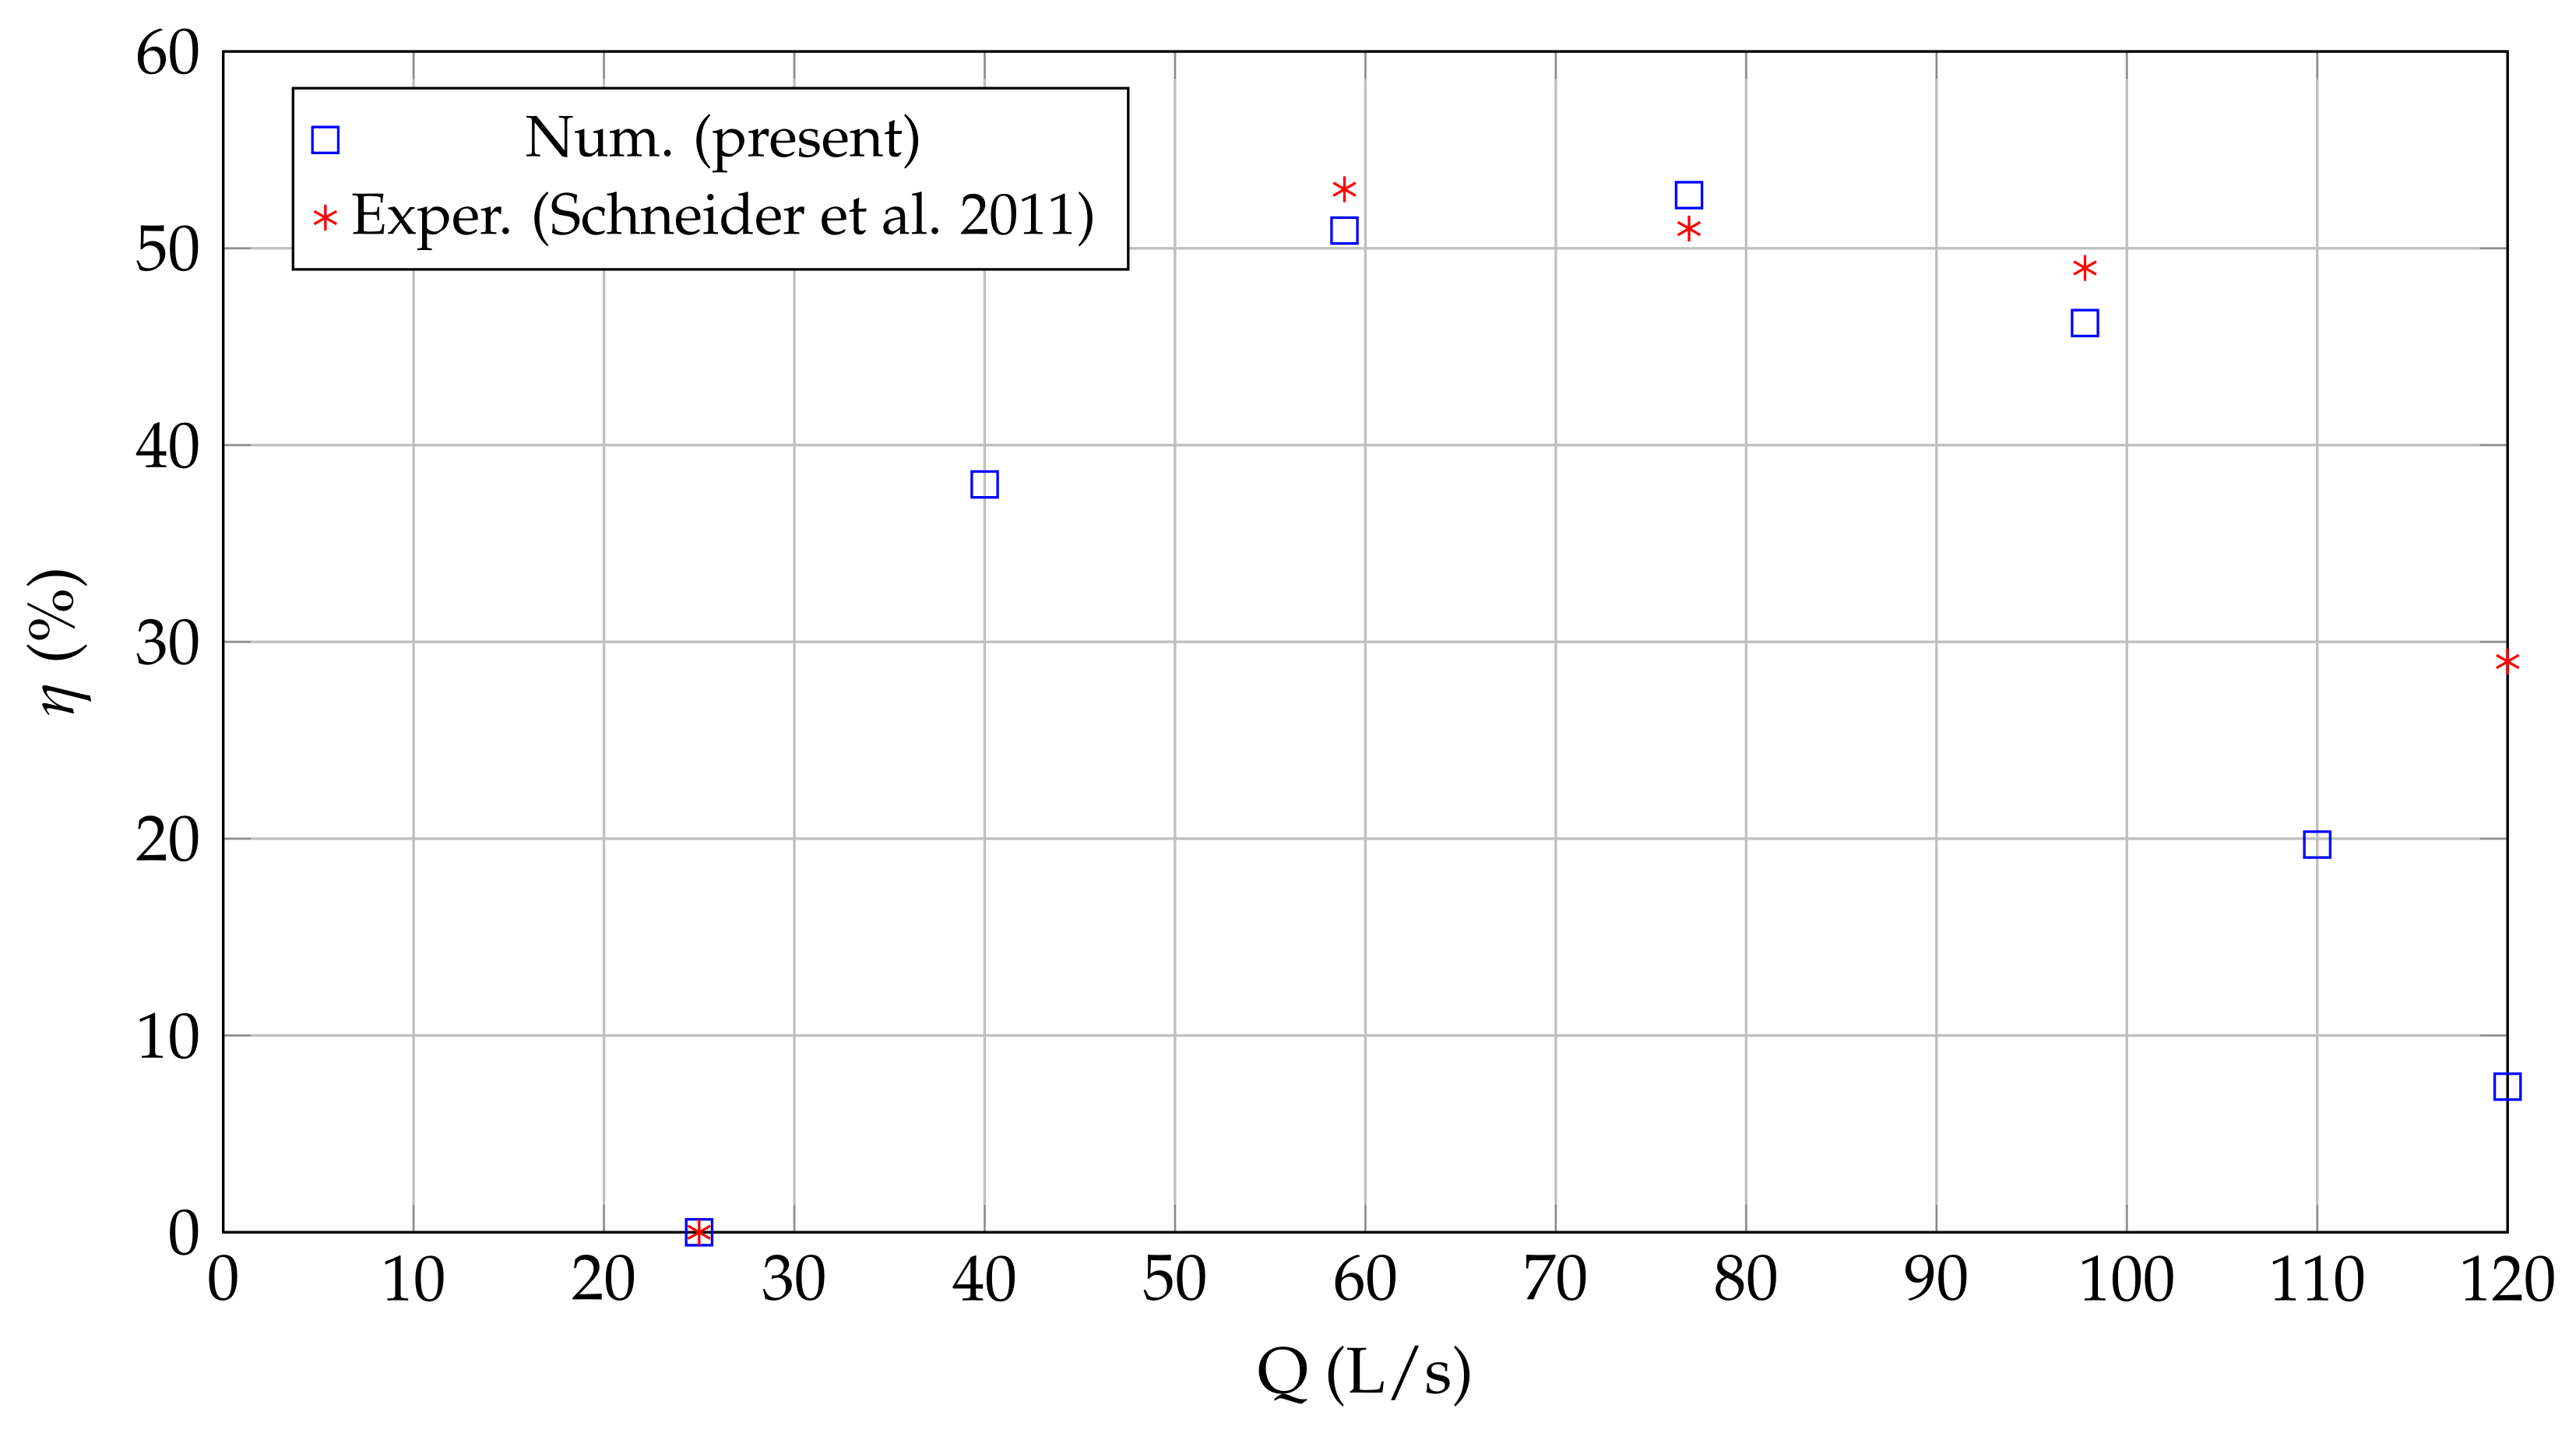
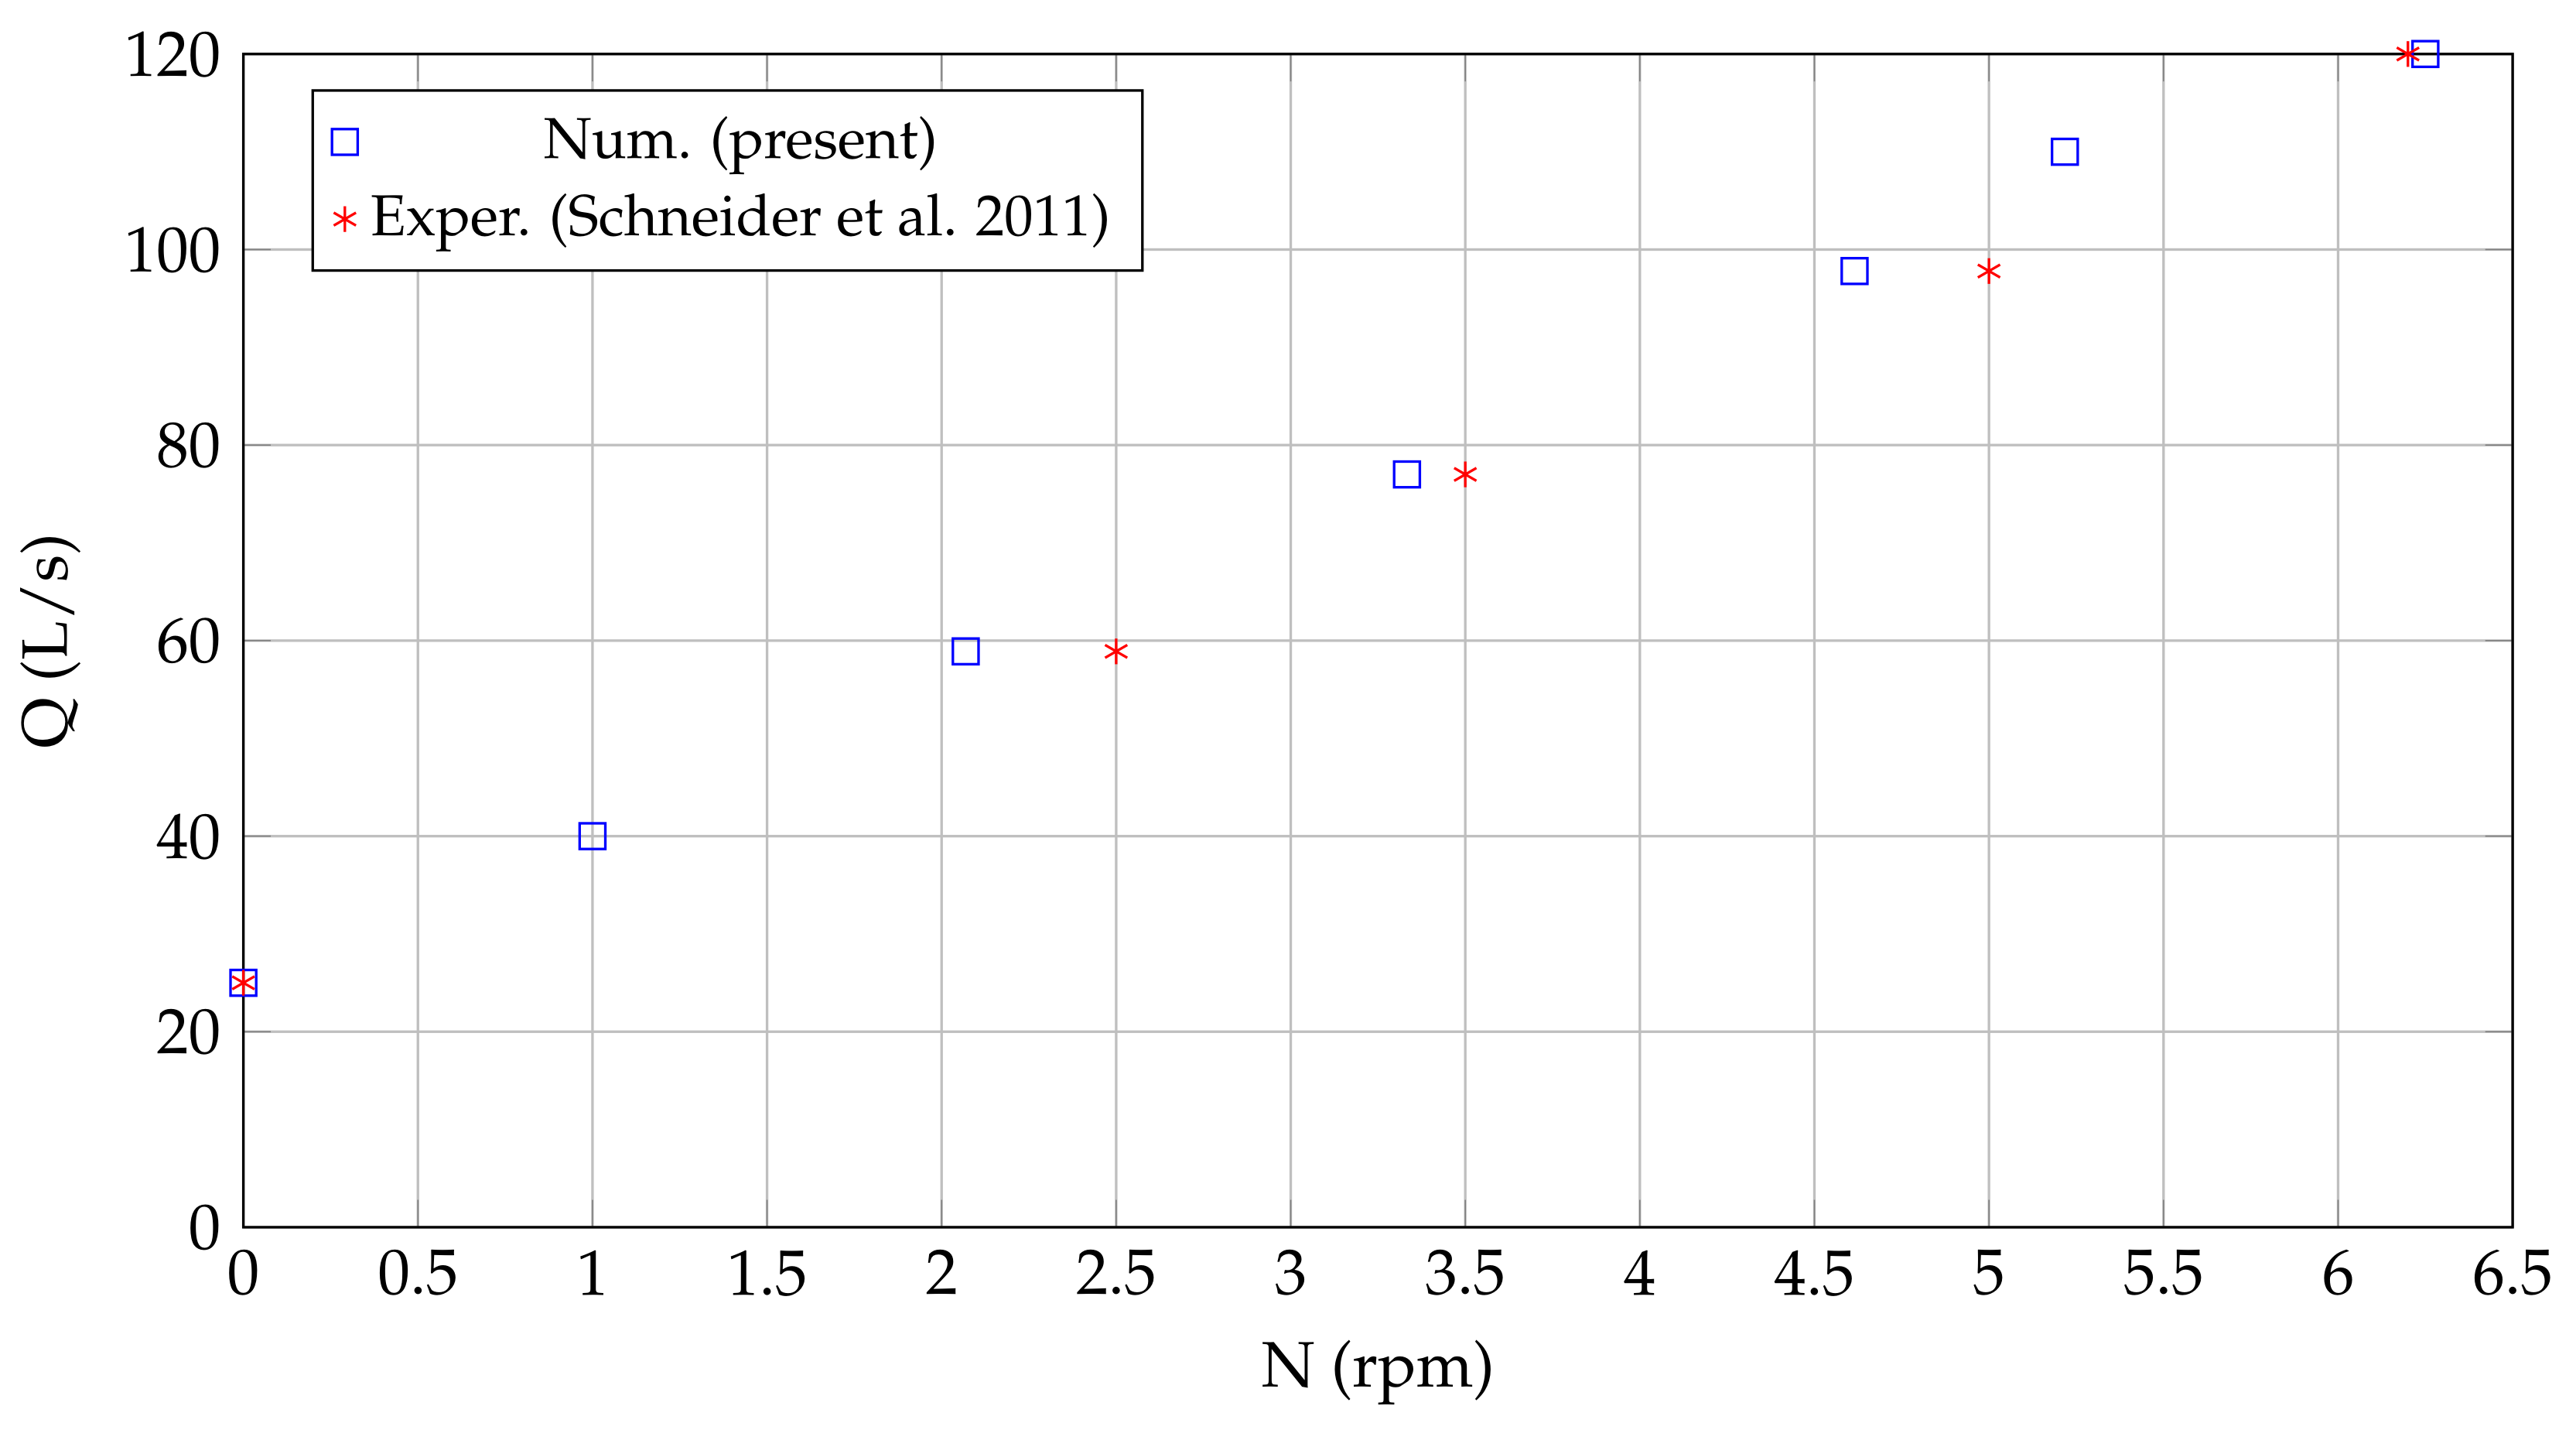
Figure 14, Figure 15 and Figure 16 show the Power—Discharge, Efficiency—Discharge and Discharge—Rotating speed curves (respectively), obtained from the numerical simulations, along with the operating points surveyed in the previous experimental tests summarized in Table 1.
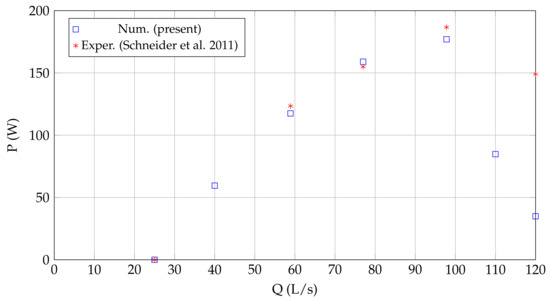
Figure 14.
Power—Discharge curve of the HPM. Comparisson of numerical with experimental results presented in Schneider et al. (2011) [38].
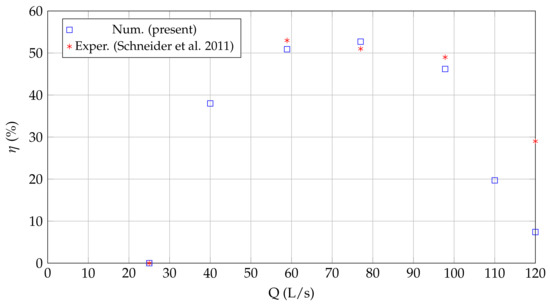
Figure 15.
Efficiency—Discharge curve of the HPM. Comparisson of numerical with experimental results presented in Schneider et al. (2011) [38].
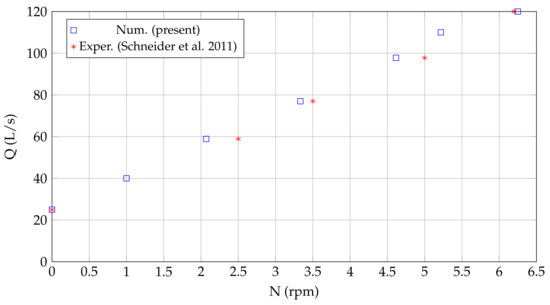
Figure 16.
Relationship between discharge and rotating speed of the HPM. Comparisson of numerical with experimental results presented in Schneider et al. (2011) [38].
From the previous figures, a very good correlation between the numerical and experimental results can be seen, for discharges between 25 L/s (minimum discharge) and 97.8 L/s (maximum power), concluding that the simulations carried out in caffa3d managed to reproduce the operation of the HPM in this working range. However, for higher discharges, the numerical simulations yielded much lower power and efficiency values, possibly explained by overestimated turbulence modelling. Although it is an aspect to be solved in the model and the numerical simulations, it is still acceptable that it can reproduce the global variables of the real operation between the minimum discharge and that corresponding to the maximum power, including the best efficiency point. It would be very rare to have discharges outside this range in actual operation of this HPM.
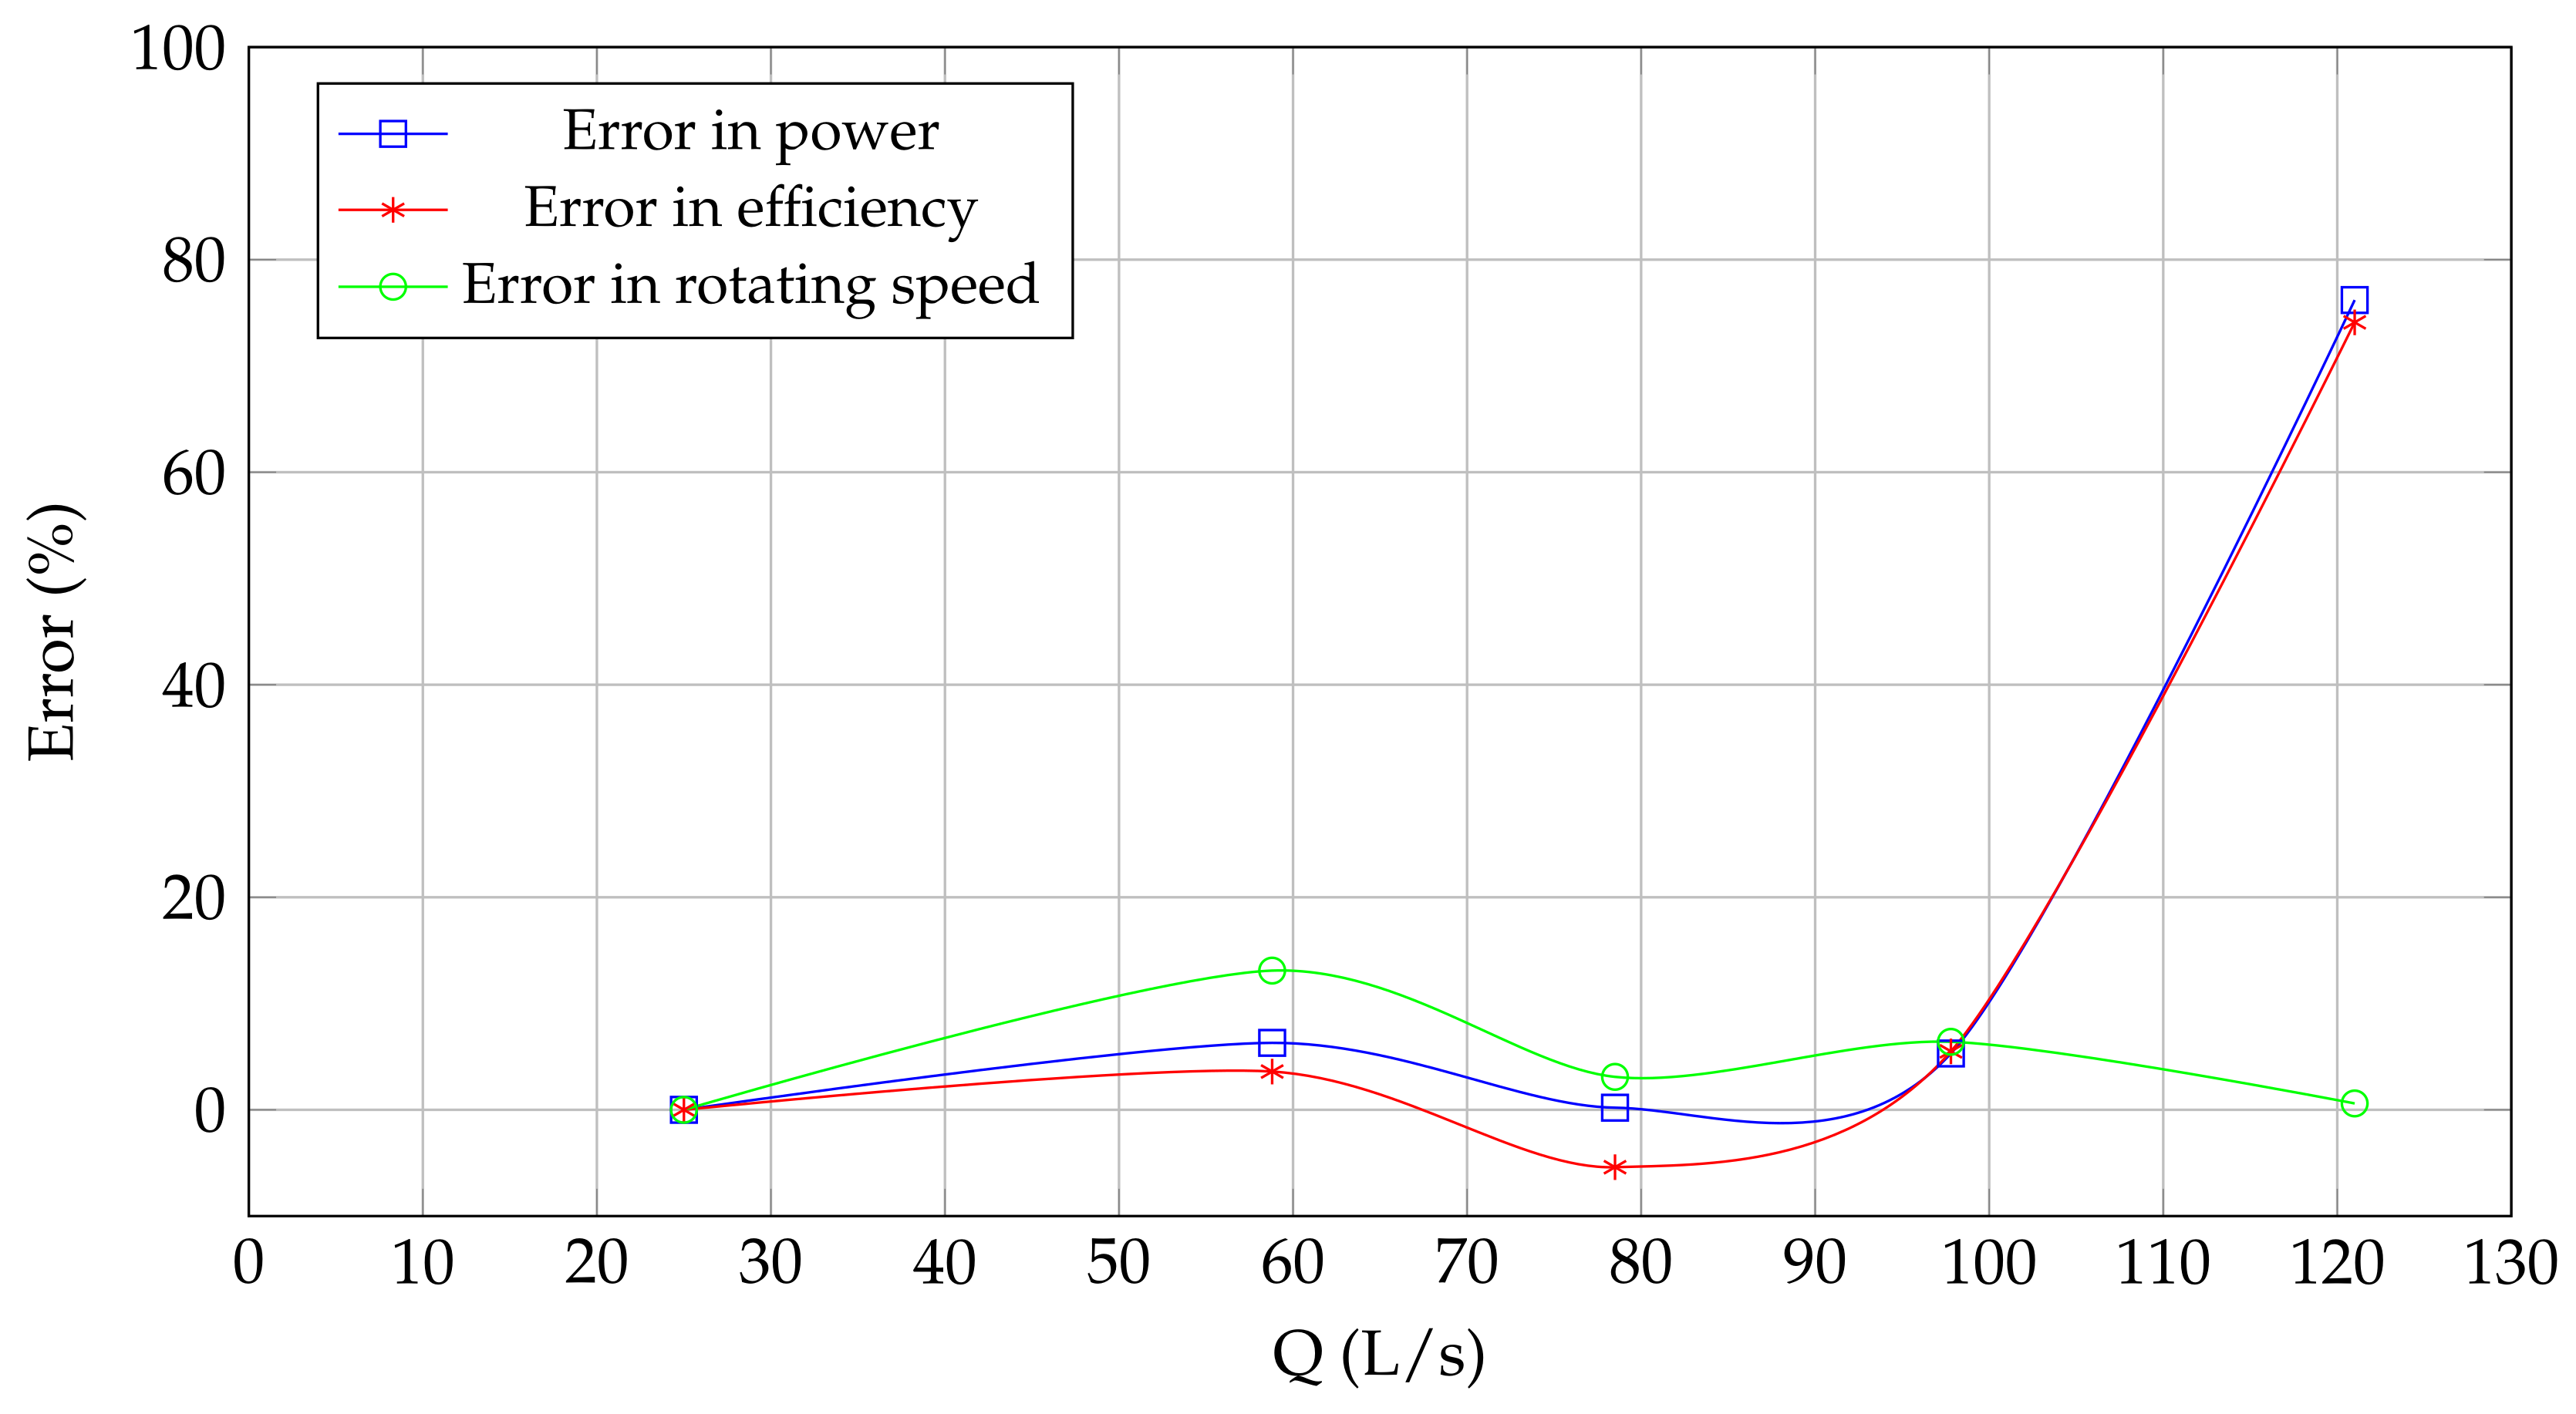
Figure 17 shows the comparison error between the values of the different magnitudes (power, efficiency and rotating speed) obtained numerically with caffa3d and those obtained experimentally in the HYLOW project. The error is expressed relative to the experimental value and it is shown for various discharges.
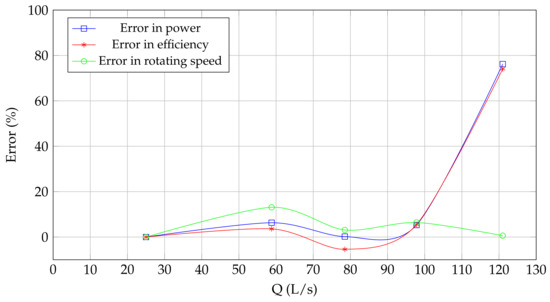
Figure 17.
Comparison errors for various discharges.
It is clear that the comparison error in power and efficiency increase rapidly when the discharge goes from 97.8 L/s to 120 L/s. However, for discharges up to 97.8 L/s, the error in power and efficiency remained below 6%, indicating a good correlation. On the other hand, the comparison error in the rotating speed remains low for the entire range of analyzed discharges. This behaviour reaffirms the above comments about the adequacy of the model and the numerical simulations to analyze the performance of the HPM in the operating range between the point of minimum discharge and the point of maximum power.
3.4. Channel Flow Analysis
In order to complement the previous analysis, images of the water flow in the channel through the HPM are presented below, for two operating points. Due to the transient nature of the HPM operation, instantaneous images of the flow are shown for a specific time instant. Such instant was chosen in order to appreciate the characteristic behaviour of the flow through the HPM for each operating point.
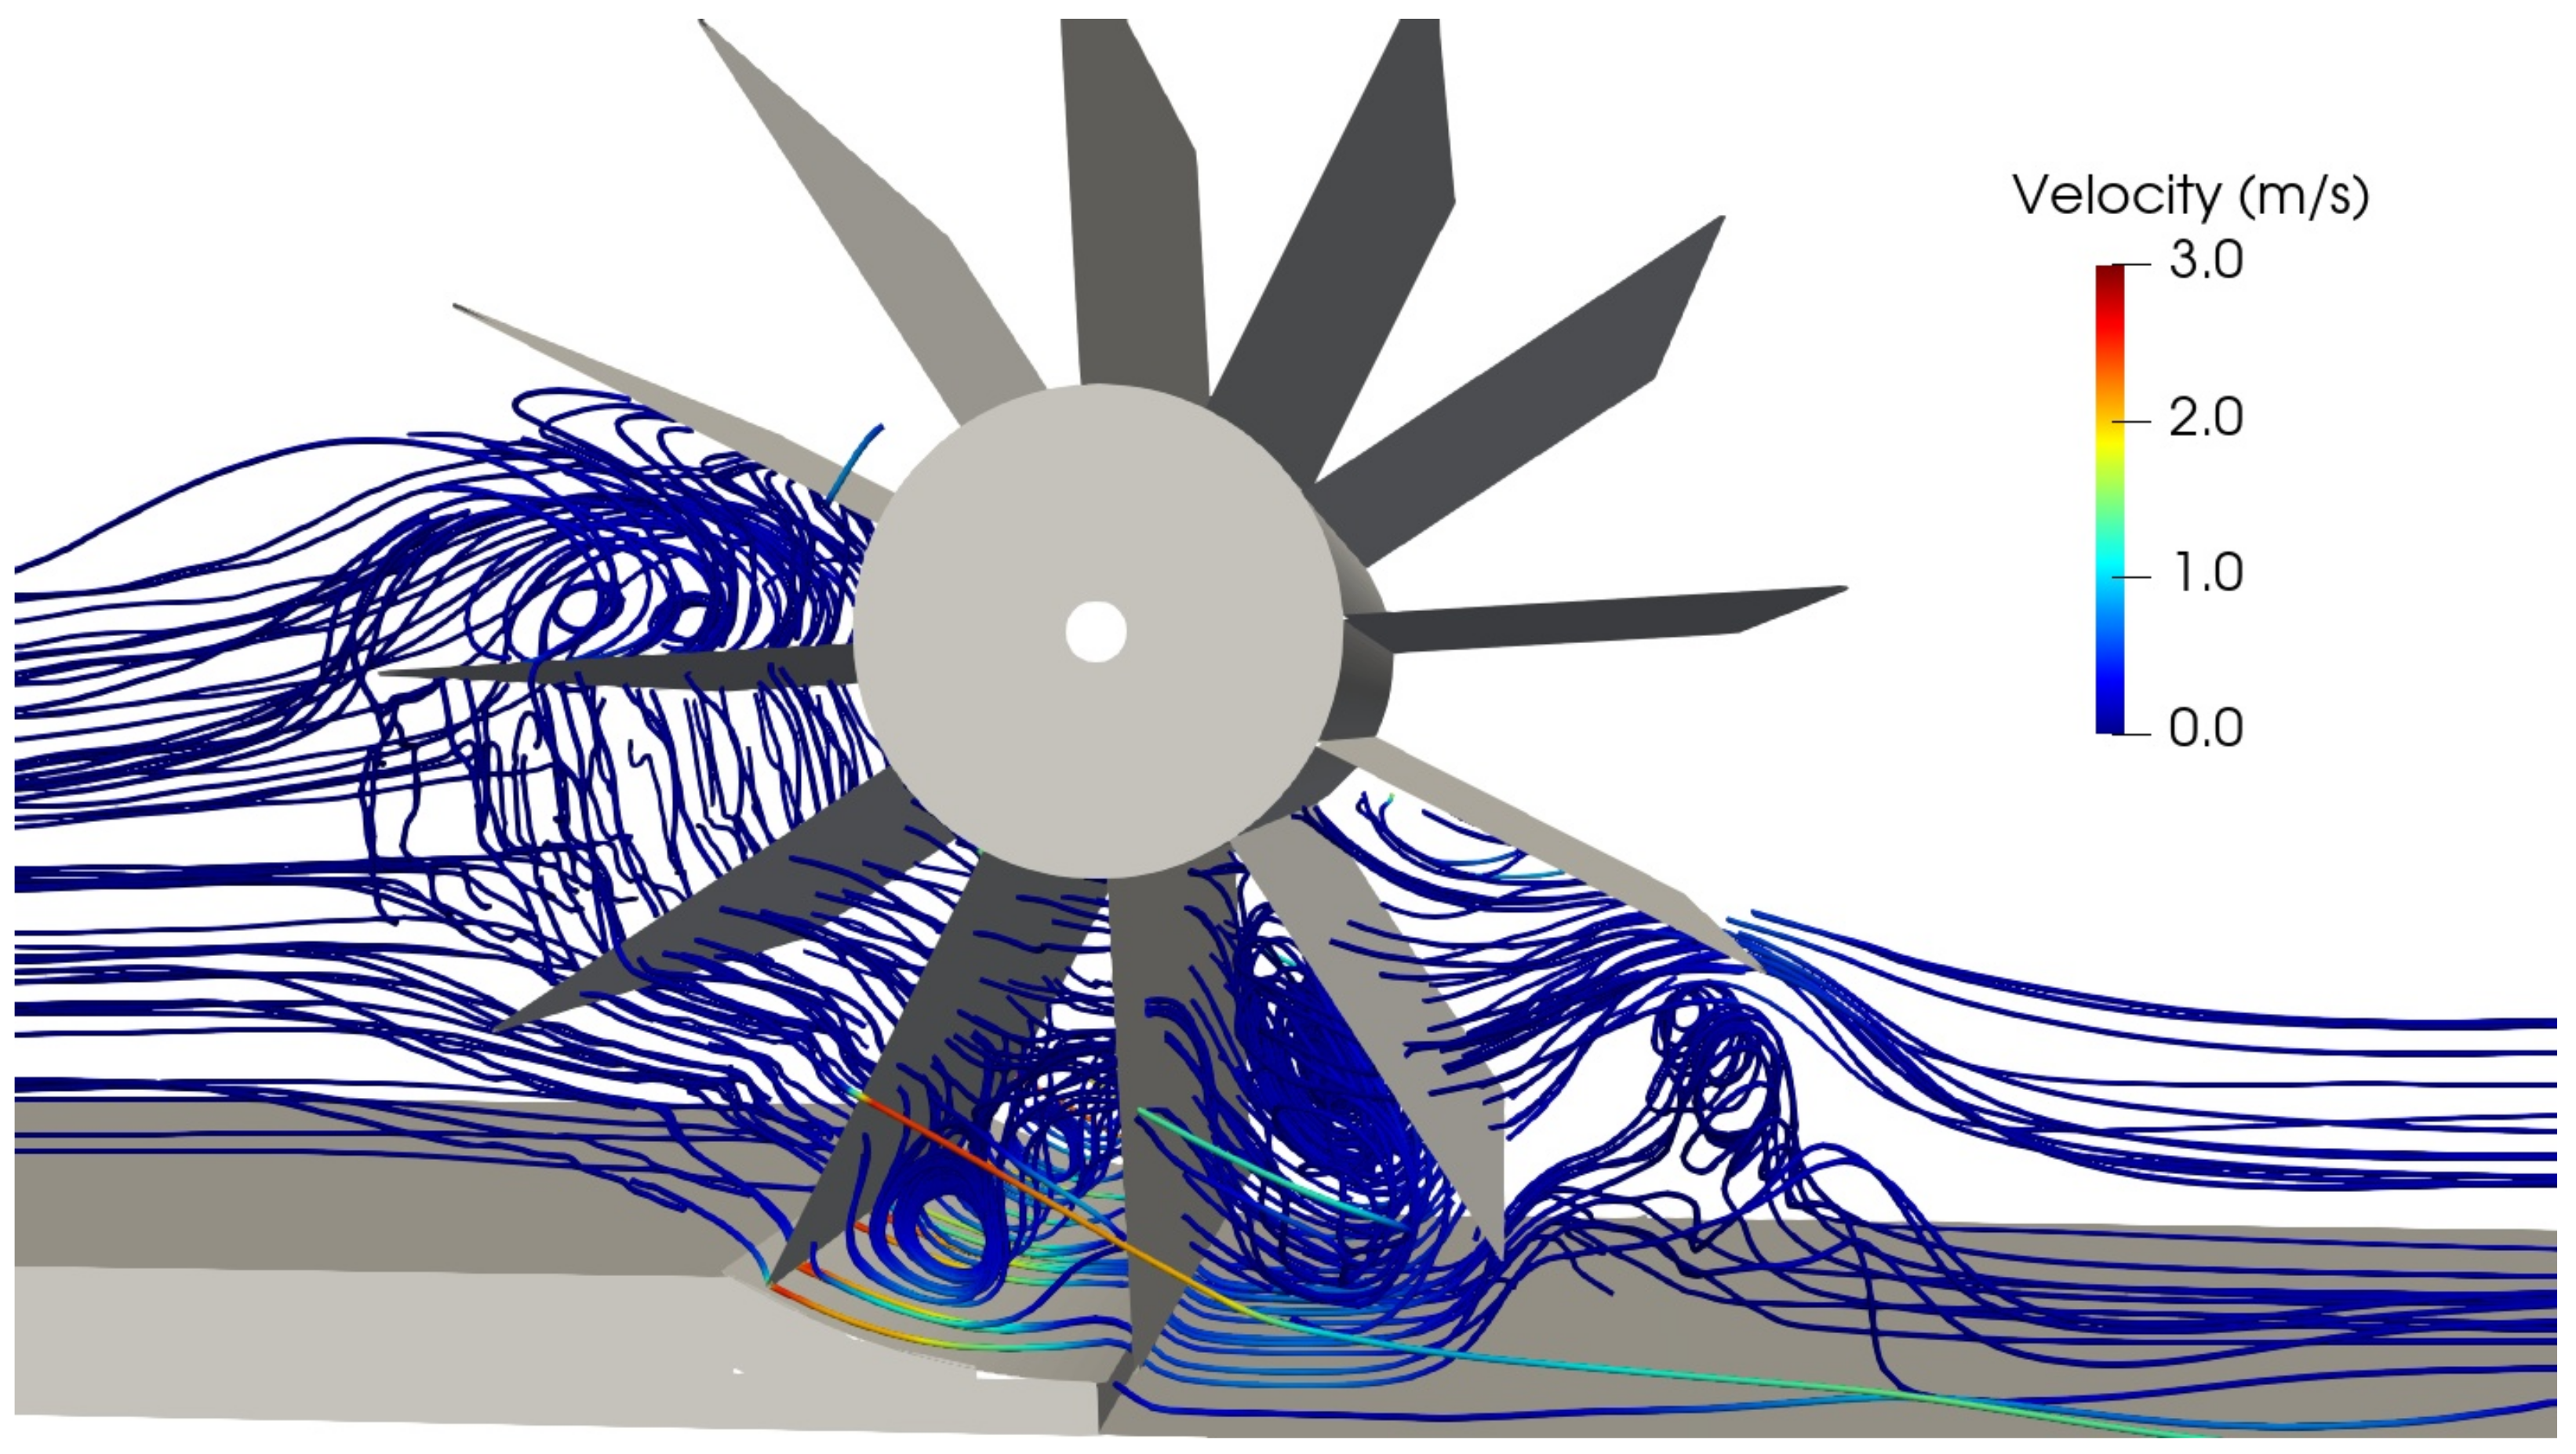
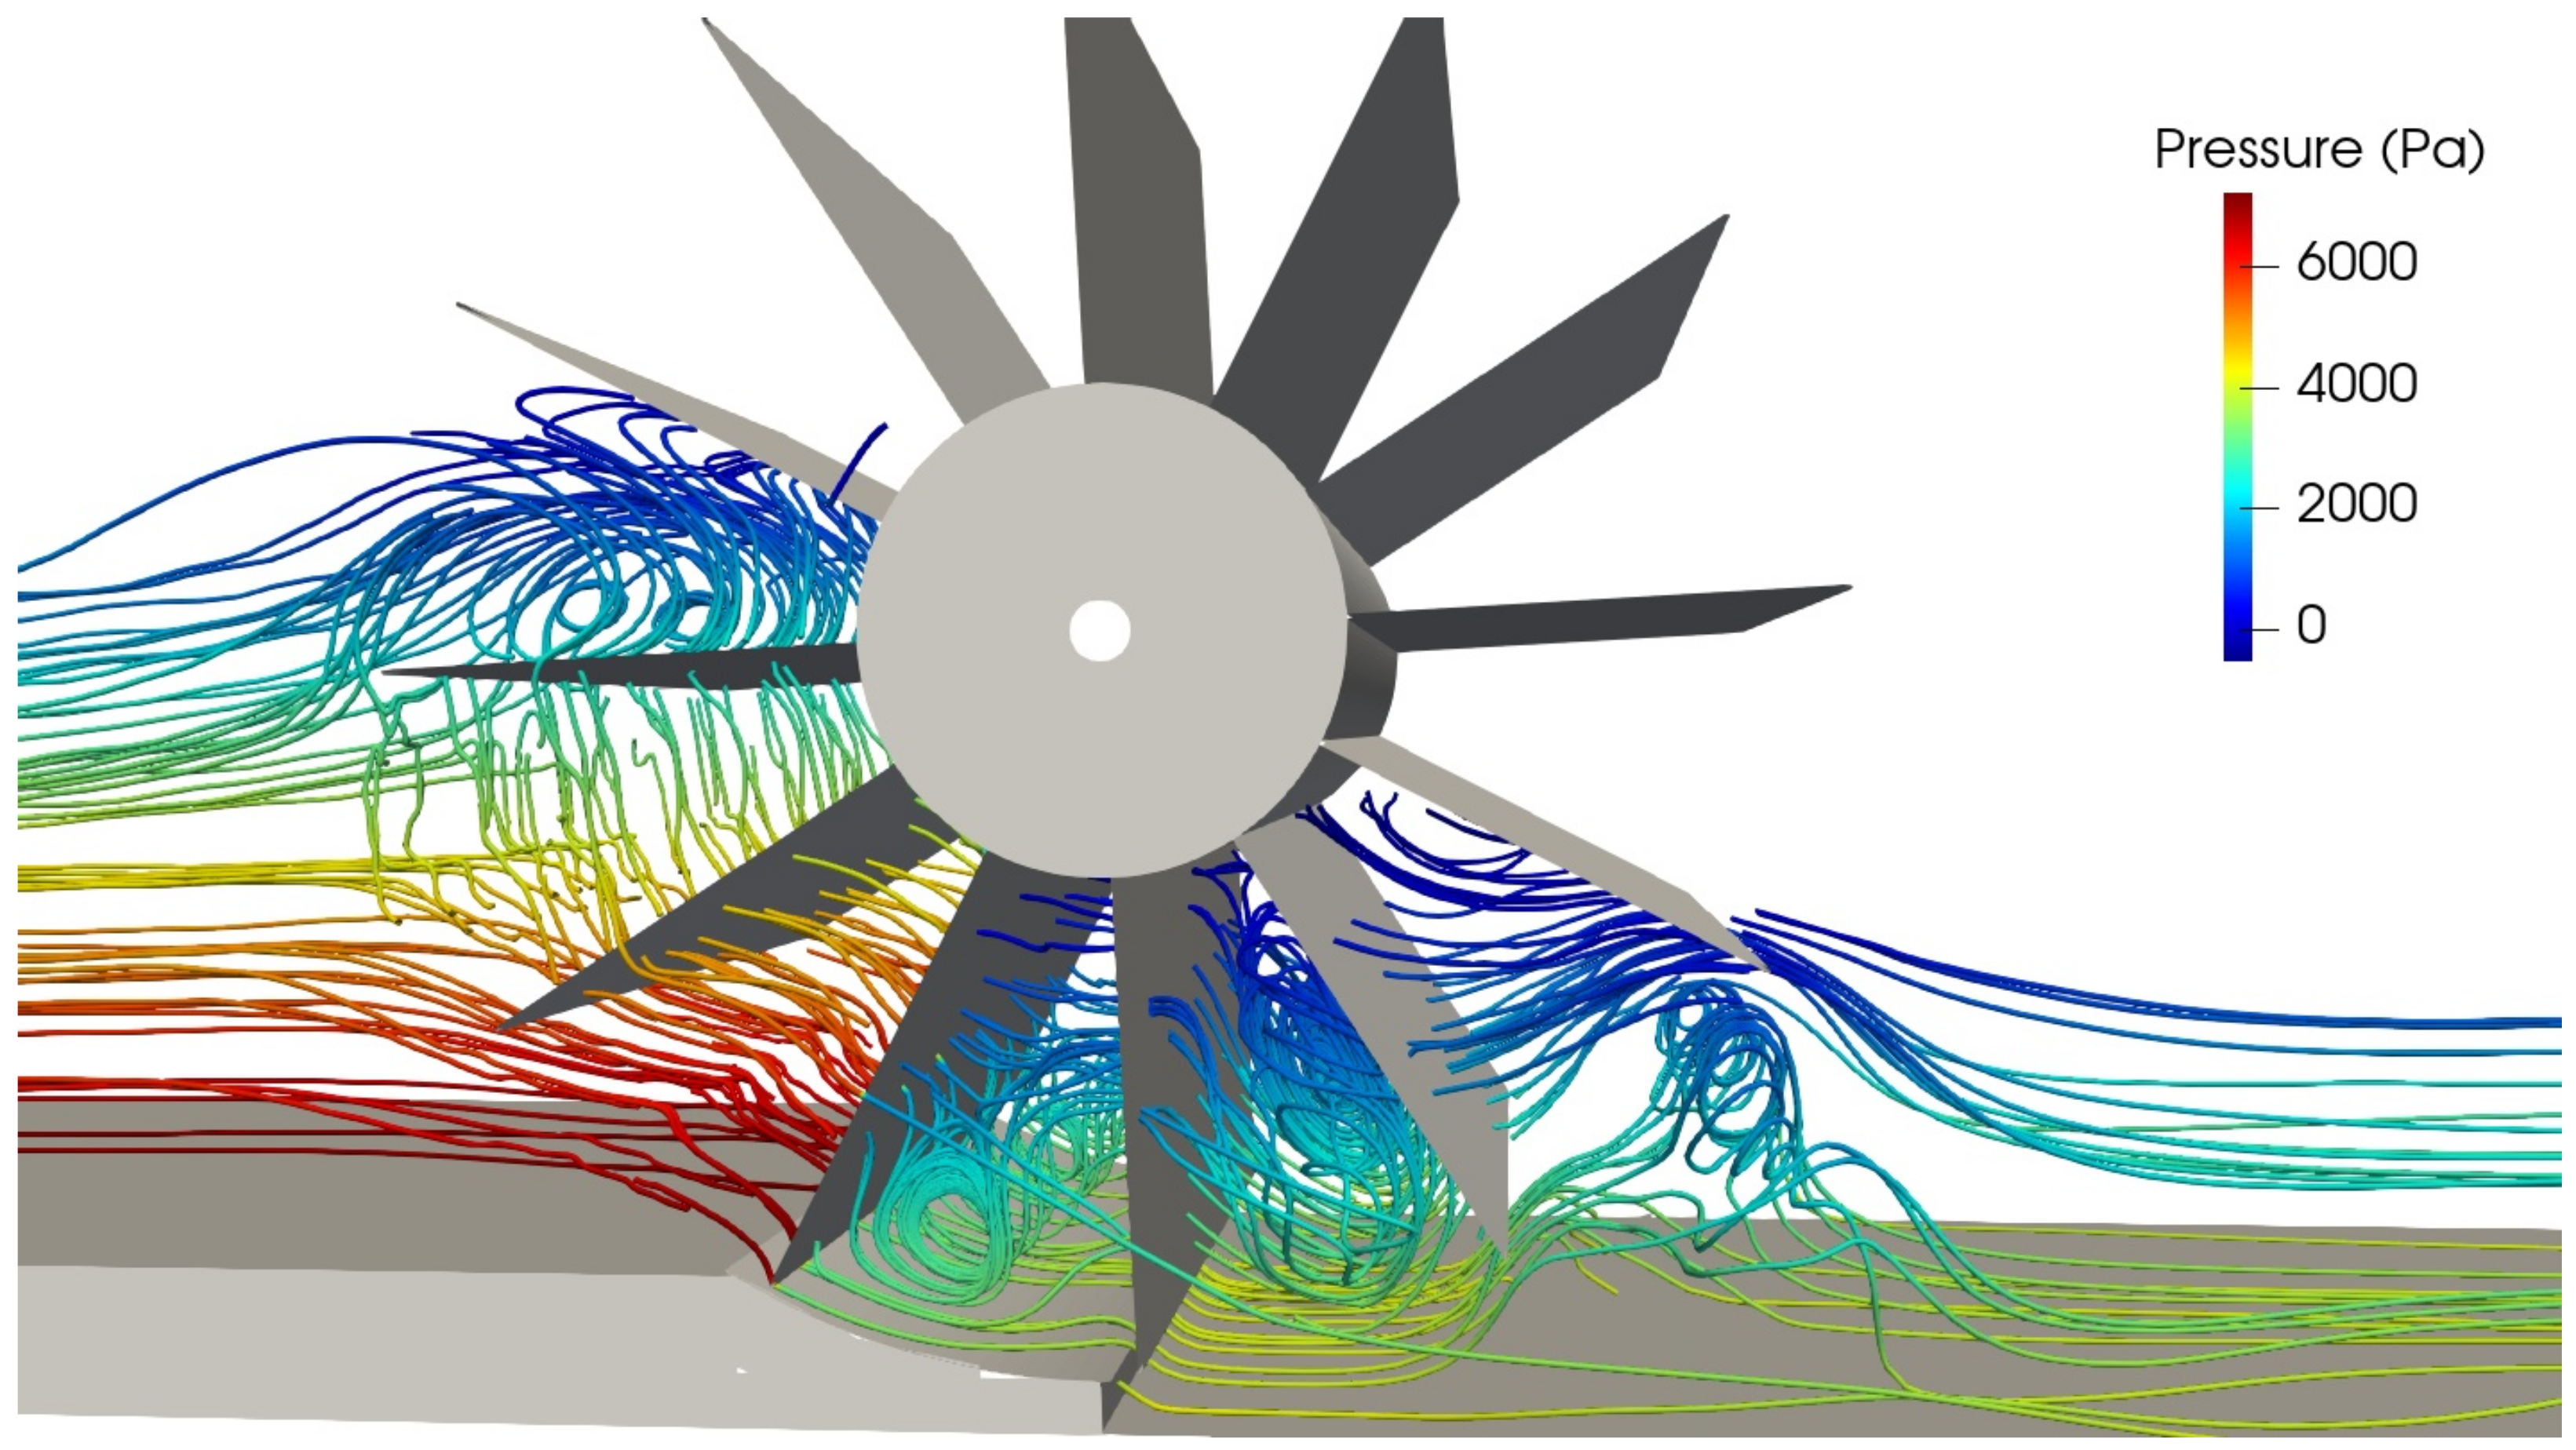
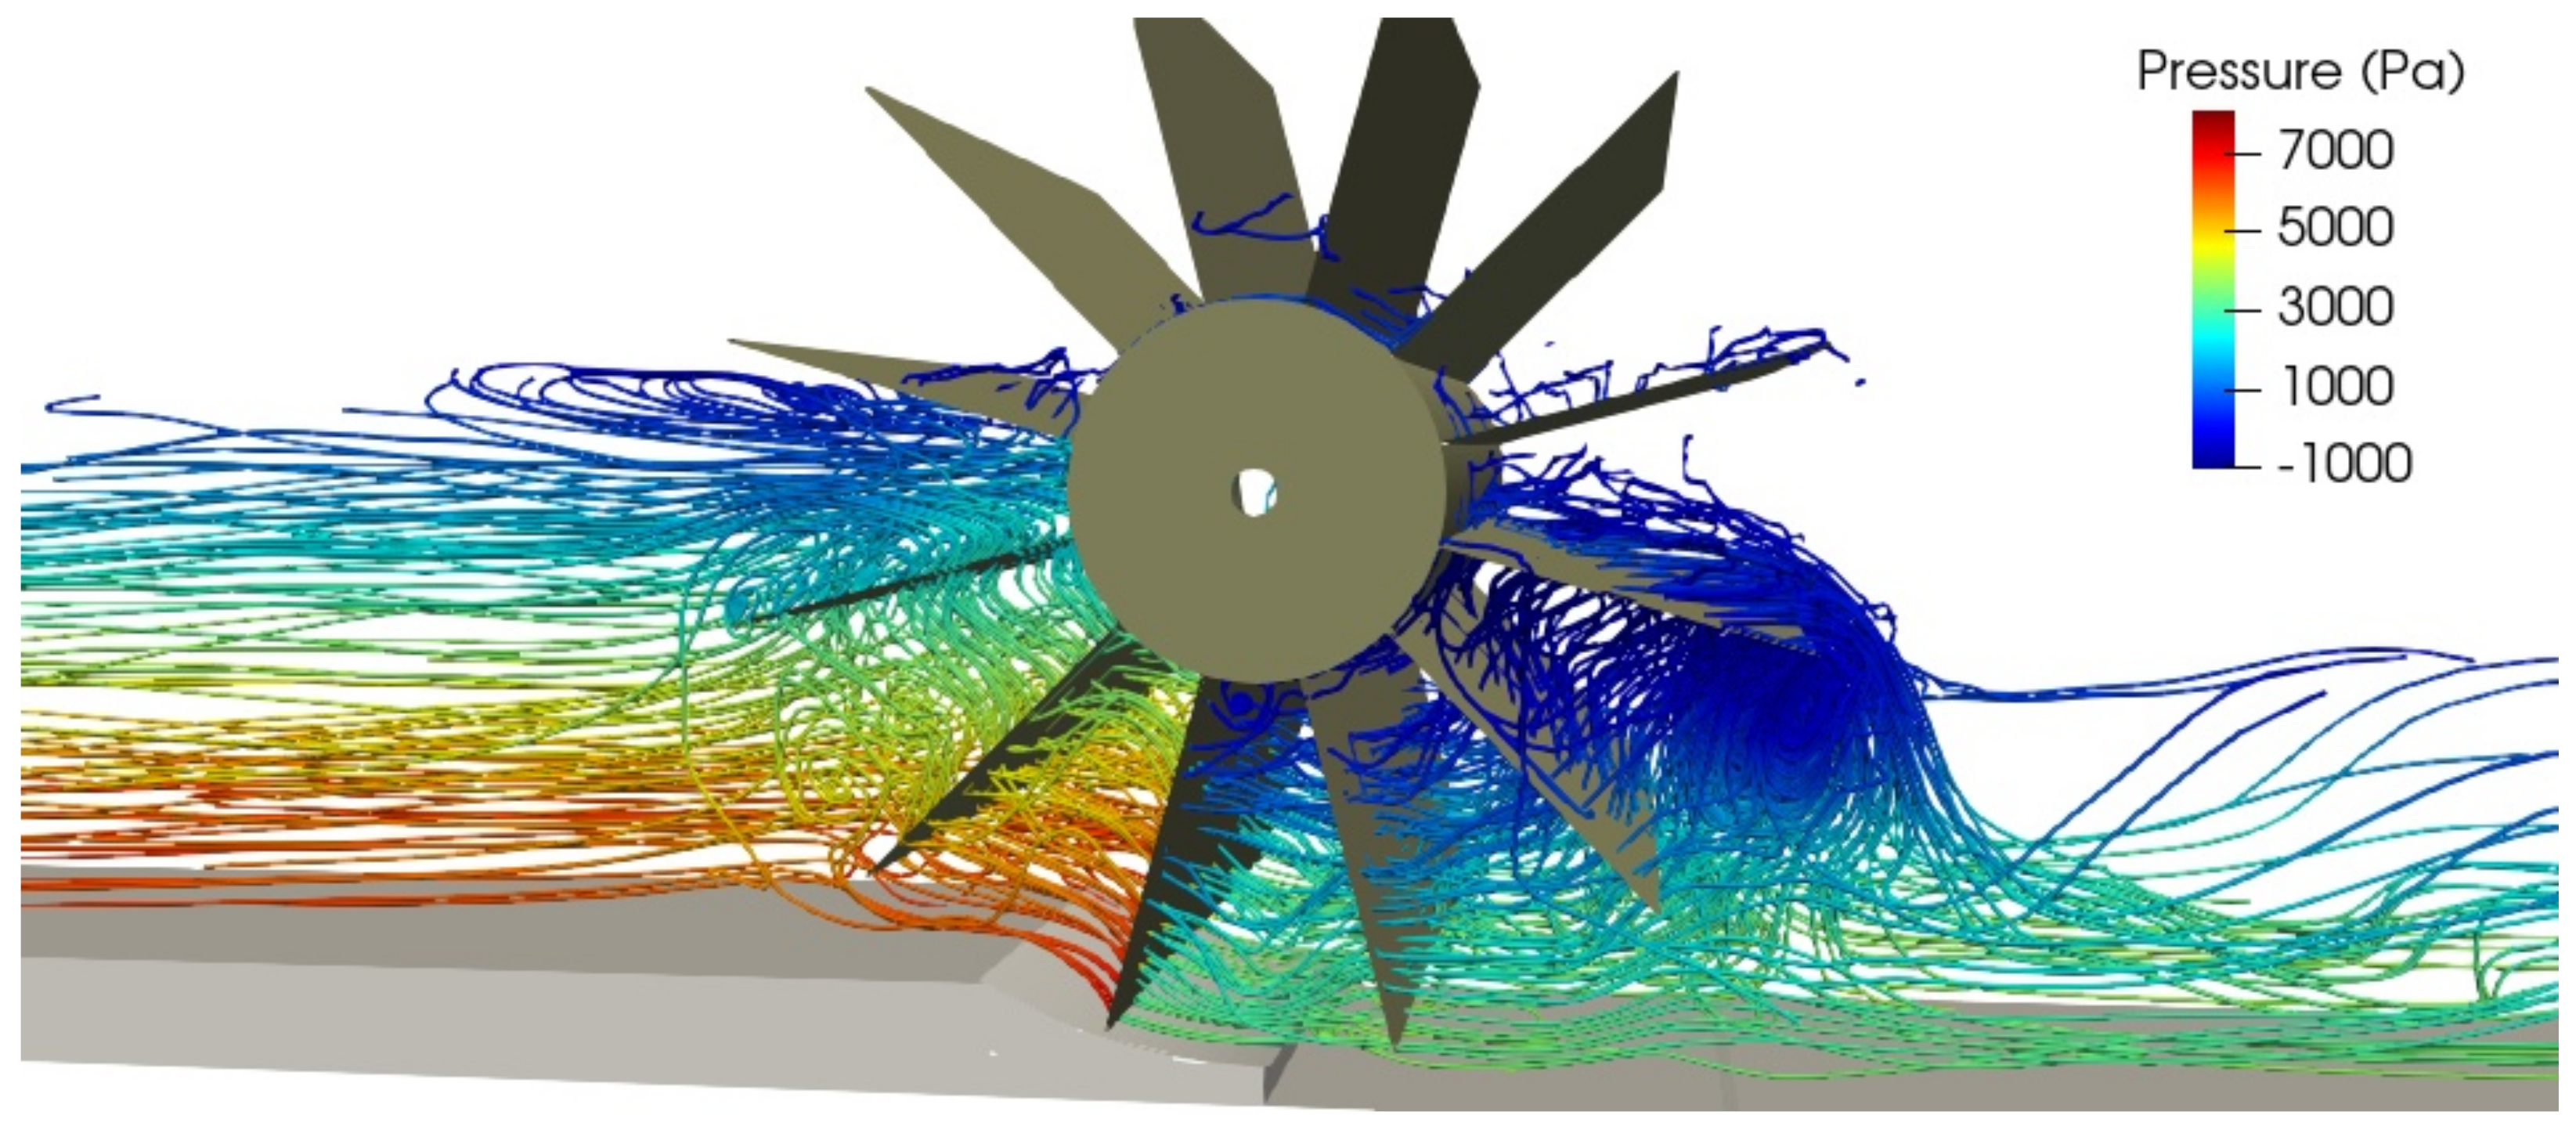
The maximum efficiency (from experimental tests) operating point is considered first, with L/s and rpm. The following figures show the instantaneous streamlines through the HPM (the images correspond to the same instant of time). Figure 18 shows the streamlines colored by the magnitude of the velocity vector, while Figure 19 shows the streamlines colored by pressure.
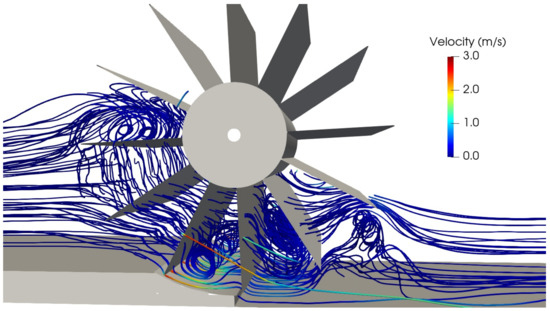
Figure 18.
Image of instantaneous streamlines through the HPM colored by velocity, L/s.
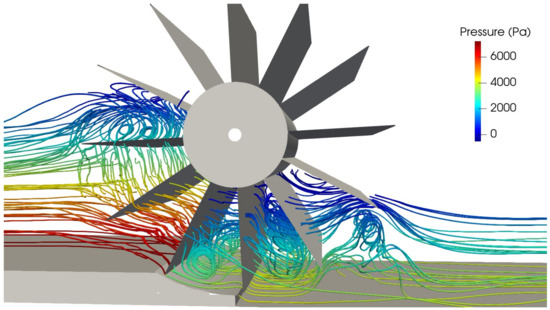
Figure 19.
Image of instantaneous streamlines through the HPM colored by pressure, L/s.
In both images, several eddies are observed inside the buckets downstream the bottom shroud, possibly due to the interaction of the main flow with the bottom flow coming from the gap between the channel bed and the HPM, which, as it can be seen in Figure 18 has a higher velocity with respect to the average flow. Another eddy formation can also be seen in the flow inside the bucket that has just entered the water, which could explain the presence of the air bubbles observed in Figure 20. For the analyzed operating point, there are no low pressure zones associated with the core of these eddy structures, so their presence does not seem to alter the normal operation of the HPM.
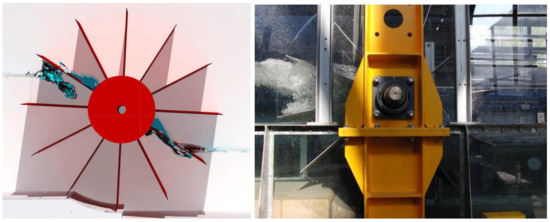
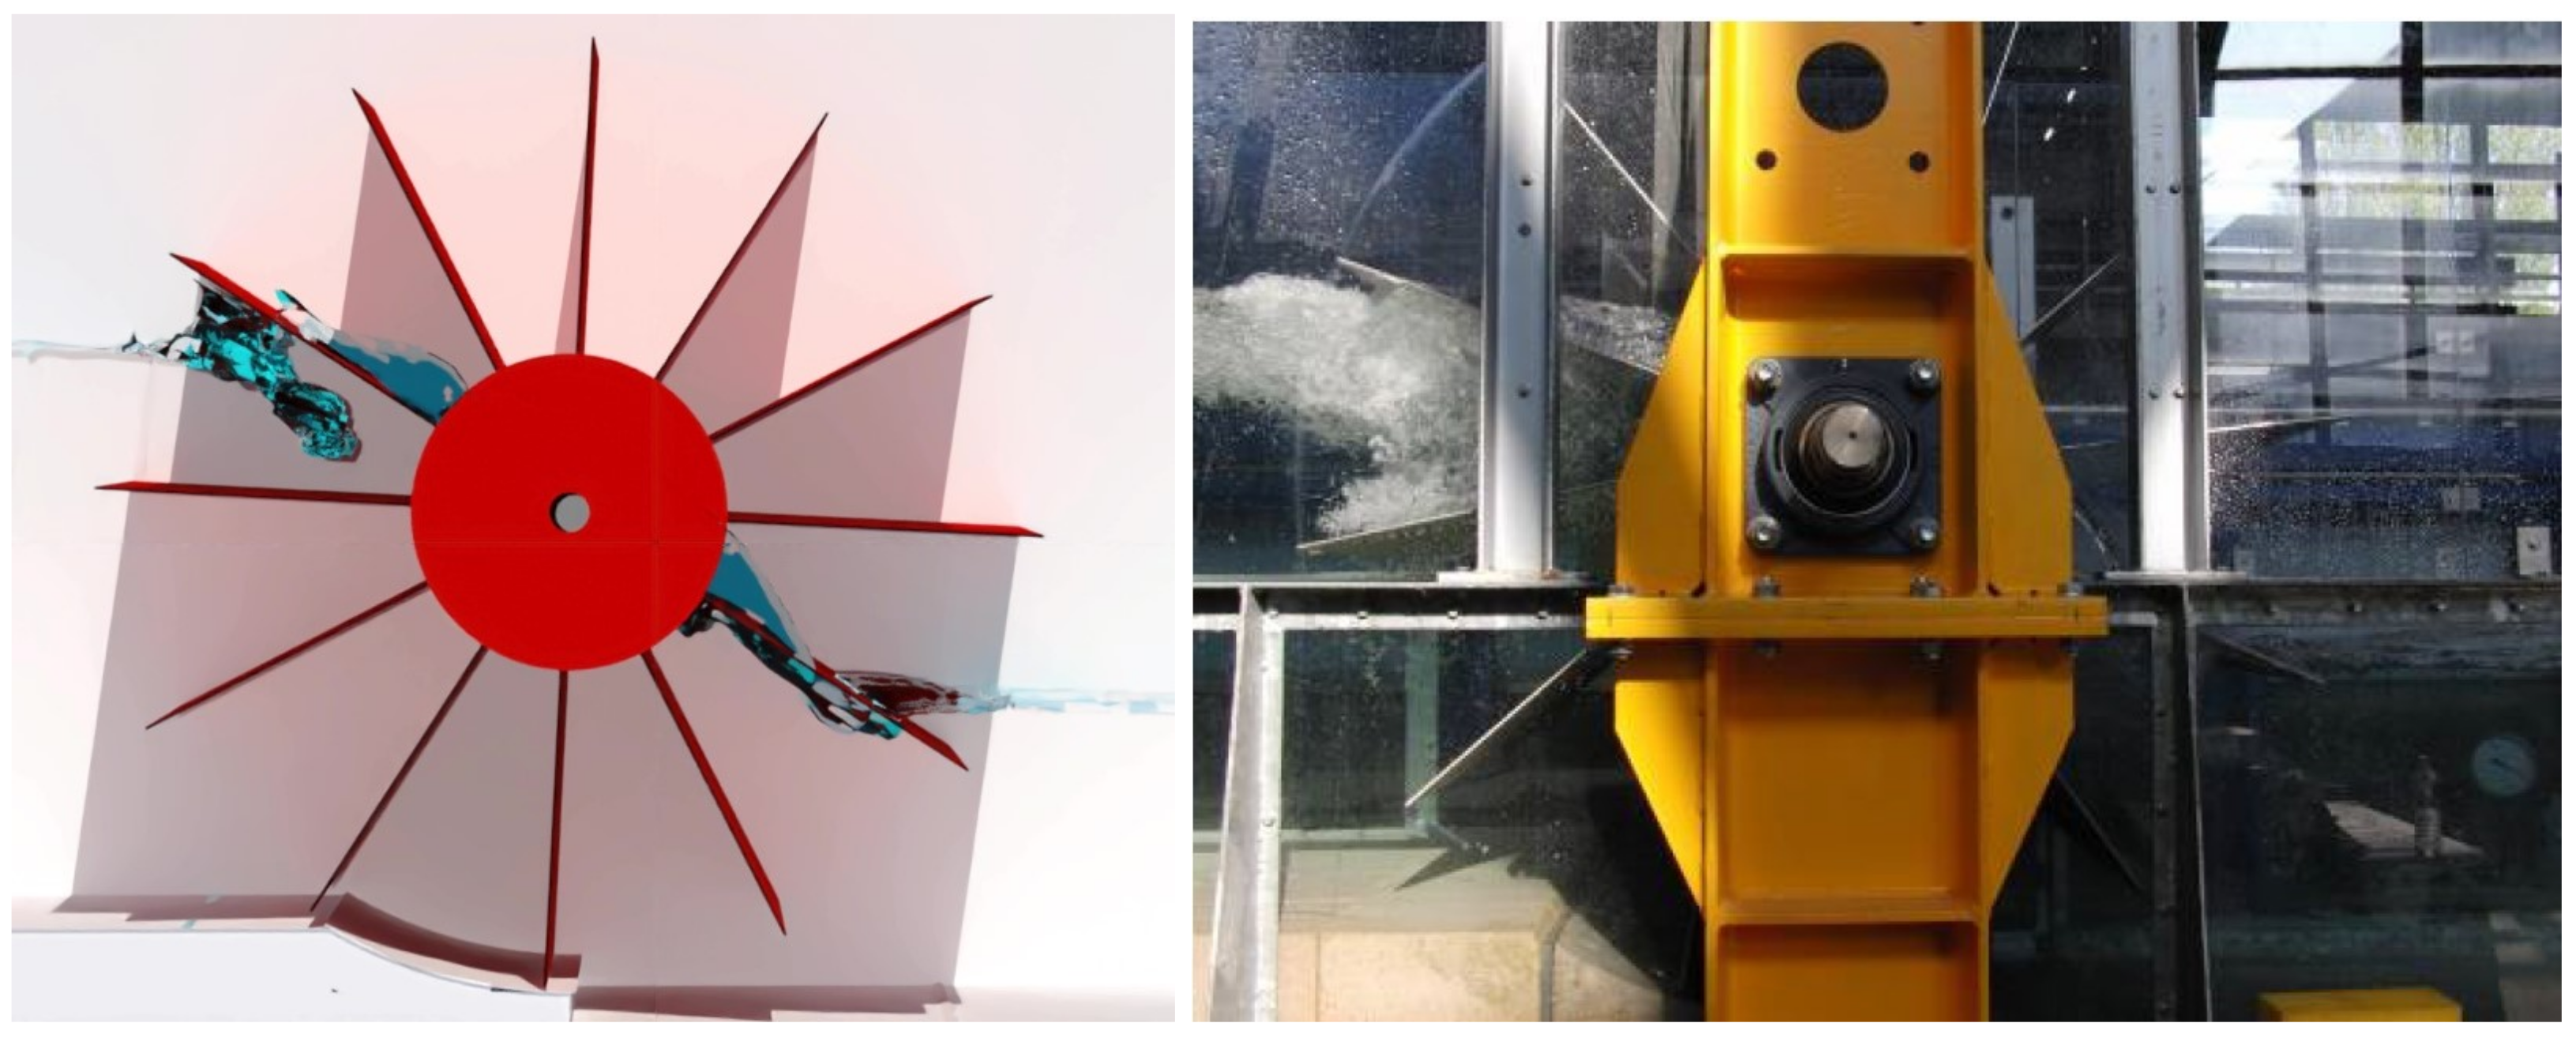
Figure 20.
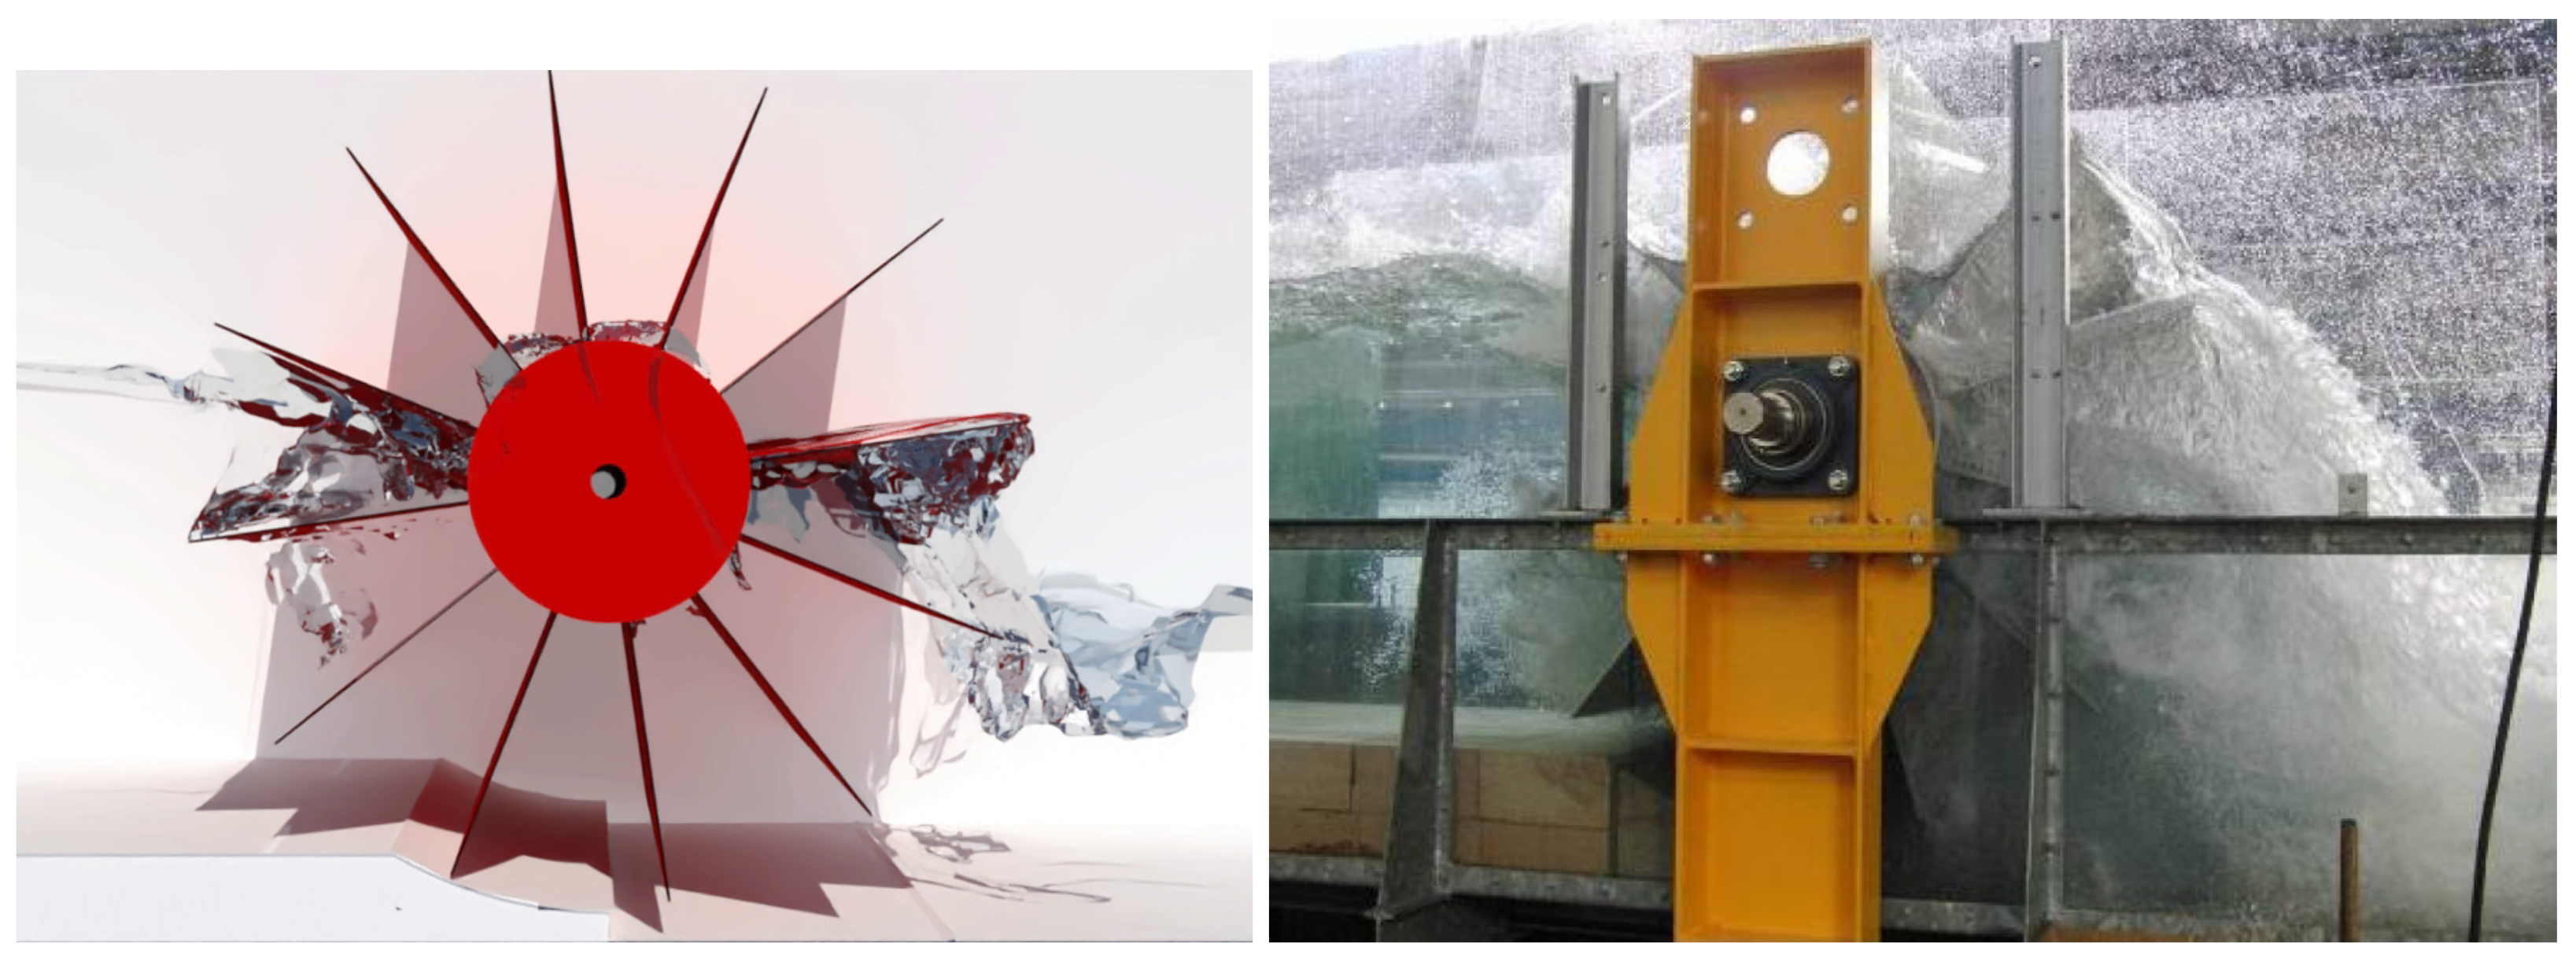
Lateral image of the instantaneous flow of water through the HPM for low discharge. Left image shows an instantant of simulations with caffa3d for L/s, while right image shows an instant of experimental tests for L/s [38].
Figure 20 shows an image of the flow of water through the HPM obtained by simulations in caffa3d (left) and presented in HYLOW reports of the experimental tests (right), for similar discharges. The section on Supplementary Material has the video of the simulation for a complete turn of the HPM.
The previous images show bubbles of air trapped inside the bucket that has just entered the water, which in this case manage to be expelled before the bucket passes through the bottom of the channel (at higher discharges, the air is transported downstream of the channel). Water recirculation is not appreciated, that is to say that all the water transported by the HPM manages to evacuate towards downstream of channel (a desirable situation in an optimal behavior of the machine).
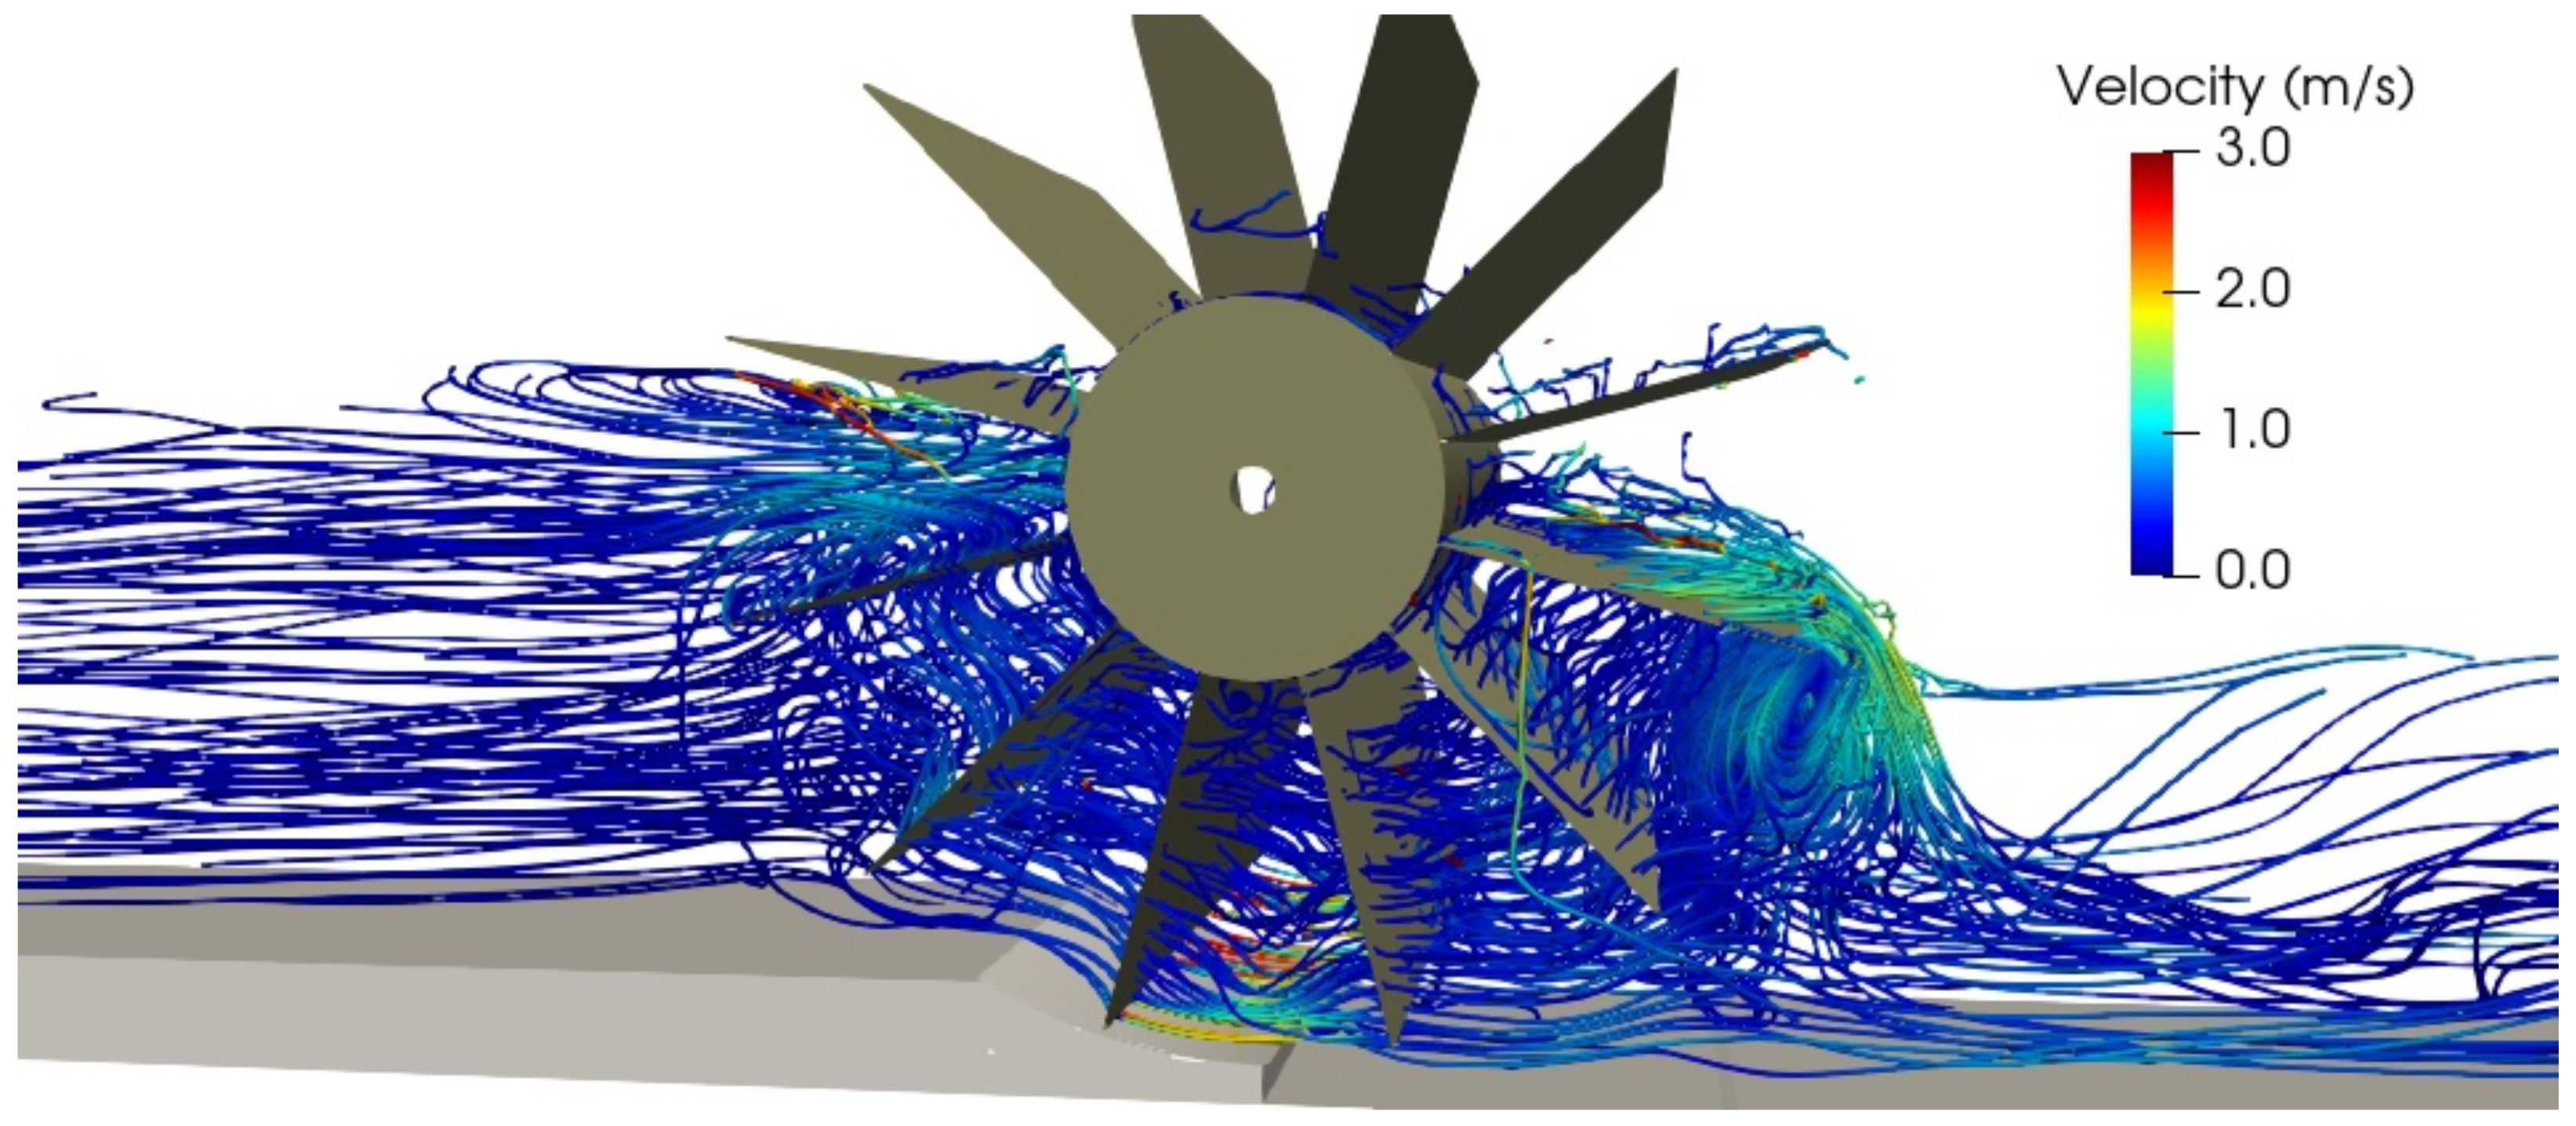
Next, the operation of the HPM with a high discharge is analyzed, specifically L/s and rpm, where abnormal phenomena begin to be observed that introduce inefficiencies reducing the absorbed power and the efficiency of the HPM. The following figures show the instantaneous streamlines through the HPM (the images correspond to the same instant of time). Figure 21 shows the streamlines colored by the magnitude of the velocity vector, while Figure 22 shows the streamlines colored by pressure.
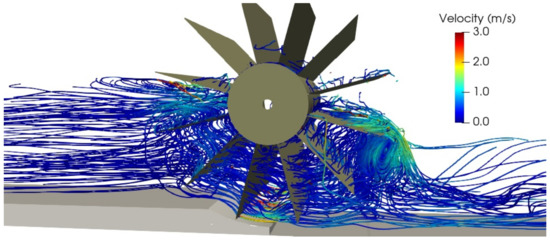
Figure 21.
Image of instantaneous streamlines through the HPM colored by velocity, L/s.
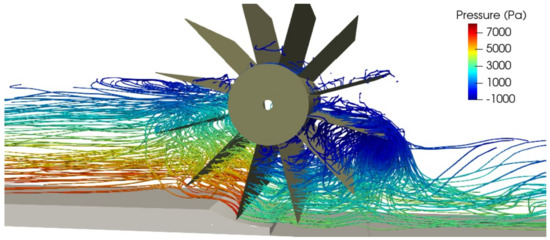
Figure 22.
Image of instantaneous streamlines through the HPM colored by pressure, L/s.
In the previous images, larger eddy structures can be observed than at the point of operation of maximum efficiency. Furthermore, in the bucket about to exit the water and on the pressure side of the blade, significant negative pressure values occur. This blade in particular is working with a negative torque with respect to the rotation of the HPM, reducing the net absorbed power. This depression together with the delay in the entry of air (and evacuation of water) are responsible for the recirculation of water towards the entrance of the channel.
Figure 23 shows an image of the flow of water through the HPM obtained by simulations in caffa3d (left) and presented in HYLOW reports of the experimental tests (right), for similar high discharges. The section on Supplementary Material has the video of the simulation for a complete turn of the HPM.
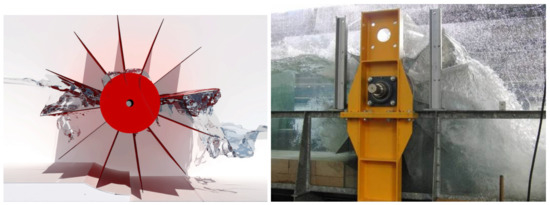
Figure 23.
Lateral image of the instantaneous flow of water through the HPM for low discharge. Left image shows an instantant of simulations with caffa3d for L/s, while right image shows an instant of experimental tests for L/s with the level downstream of the wheel 200 mm below the edge of the hub [38].
In particular, it can be seen how the buckets do not empty completely when they exit the water, taking with them some water towards the entrance, which generates a contrary torque that reduces the absorbed power. In addition, noteworthy is the high turbulence produced when the blades enter the water and the large amount of air trapped in the bucket that has just entered, which is not evacuated entirely, reducing the volume of water transported and the force exerted on the blades.
4. Conclusions
In this paper. the operation of a simple Hydrostatic Pressure Machine (a type of hydraulic turbine) with radial straight blades was analyzed by means of the use of caffa3d code, which is an open source and freely available flow solver for incompressible viscous fluid flow that implements the finite volume method in Fortran 90, and has been developed by academic researchers from the Computational Fluid Mechanic Group of the Faculty of Engineering of Universidad de la República (Uruguay). The solver implements the Large Eddy Simulation method to model the flow turbulence, the Volume of Fluid method to simulate open channel flows and the Sliding Mesh method to simulate rotating machinery.
A convergence study was performed in order to assess the adequacy of the total number of iterations used in the simulations. From this study, it was concluded that the actual number of iterations enable to reach a steady value of the residuals of the equations. In addition, a grid sensitivity analysis was conducted, comparing the results for three different total number of elements in the mesh.
The suitability of the simulations to model the turbulence characteristics of the flow was studied, highlighting the distribution of the power spectral density of the longitudinal velocity along the frequencies presented in the flow. For the inertial subrange, the spectrum quite follows the −5/3 decay law predicted by Kolmogorv. The longitudinal integral length scale in the channel downstream of the HPM resulted close to half the height of the water in that section. The high values obtained for the turbulence intensity suggest that the use of LES was adequate.
The time evolution of the absorbed power over a few turns of the wheel for various discharges were presented, showing oscillatory phenomena related to the blade pass frequency and the rotating frequency. The power–discharge and efficiency–discharge curves (both with fixed head and variable rotating speed) were plotted, presenting a good correspondence with the experimental curves previously found in the framework of a research project. This was true at least up to the discharge corresponding to the maximum power, after which the simulations yielded lower values than the experiments. The comparison error in power and efficiency remained below 6% for discharge lower than 97.8 L/s.
Instantaneous images of the streamlines near the blade that was about to exit the water showed eddy structures that increased in size with increasing discharge, resulting also in higher negative pressure (and torque) over the pressure side of the blade, reducing the absorbed power. In addition, short animations of the flow through the HPM were created with the numerical results for two distinct discharges, and a qualitative comparison with the experimental behaviour was performed, concluding that the simulation managed to reproduce the main features of the flow for increasing discharge. These features are the difficulty to expel the air inside the bucket of the HPM that was entering the water upstream, and the difficulty to drain the bucket that was getting out of the water downstream.
It is proposed as future work to carry out numerical simulations of the operation of other HPM models, which have been developed in order to increase the maximum power and efficiency. Likewise, the possibility of simulating the operation of other types of turbines is also proposed.
Supplementary Materials
The following supporting information can be downloaded at: https://www.mdpi.com/article/10.3390/fluids8010009/s1, Video S1: Three dimensional view of the water flow through the HPM for the maximum efficiency operating point; Video S2: Three dimensional view of the water flow through the HPM for discharge greater than that of maximum power operating point.
Author Contributions
Conceptualization, H.M.R.; methodology, R.P. and H.M.R.; software, R.P.; validation, R.P.; formal analysis, R.P., J.C. and H.M.R.; writing—original draft preparation, R.P.; writing—review and editing, R.P., J.C. and H.M.R.; supervision, J.C. and H.M.R.; project administration, H.M.R.; funding acquisition, R.P. and H.M.R. All authors have read and agreed to the published version of the manuscript.
Funding
This research was funded by the project REDAWN (Reducing Energy Dependency in Atlantic Area Water Networks) EAPA 198/2016 from INTERREG ATLANTIC AREA PROGRAMME 2014–2020 and Banco Santander (Spain), grant number: 37362332.
Institutional Review Board Statement
Not applicable.
Informed Consent Statement
Not applicable.
Data Availability Statement
Not applicable.
Acknowledgments
The simulations reported in this article were performed in ClusterUY, a newly installed platform for high performance scientific computing at the National Supercomputing Center, Uruguay. The authors thank the staff of the Computational Fluid Mechanics Group of the Faculty of Engineering—Universidad de la Respública, for their guidance during the use of caffa3d.
Conflicts of Interest
The authors declare no conflict of interest. The funders had no role in the design of the study; in the collection, analyses, or interpretation of data; in the writing of the manuscript; or in the decision to publish the results.
References
- Laghari, J.A.; Mokhlis, H.; Bakar, A.H.A.; Mohammad, H. A comprehensive overview of new designs in the hydraulic, electrical equipments and controllers of mini hydro power plants making it cost effective technology. Renew. Sustain. Energy Rev. 2013, 20, 279–293. [Google Scholar] [CrossRef]
- Elbatran, A.H.; Yaakob, O.B.; Ahmed, Y.M.; Shabara, H.M. Operation, performance and economic analysis of low head micro-hydropower turbines for rural and remote areas: A review. Renew. Sustain. Energy Rev. 2015, 43, 40–50. [Google Scholar] [CrossRef]
- Sachdev, H.S.; Kumar, A.; Kumar, N. Analysis and evaluation of small hydropower plants: A bibliographical survey. Renew. Sustain. Energy Rev. 2015, 51, 1013–1022. [Google Scholar] [CrossRef]
- Keck, H.; Sick, M. Thirty years of numerical flow simulation in hydraulic turbomachines. Acta Mech. 2008, 201, 211–229. [Google Scholar] [CrossRef]
- Pinto, R.; Afzal, A.; D’Souza, L. Computational Fluid Dynamics in Turbomachinery: A Review os State of the Art. Arch. Computat. Methods Eng. 2017, 24, 467–479. [Google Scholar] [CrossRef]
- Weller, H.G.; Tabor, G.; Jasak, H.; Fureby, C. A tensorial approach to computational continuum mechanics using object-oriented technique. Comput. Phys. 2015, 12, 620–631. [Google Scholar] [CrossRef]
- OpenFOAM Description. CFD Direct the Architects of OpenFOAM. Available online: https://cfd.direct/openfoam/about/ (accessed on August 2022).
- Usera, G.; Vernet, A.; Ferré, A. A parallel block-structured finite volume method for flows in complex geometry with sliding interfaces. Flow Turbul. Combust. 2008, 81, 471–495. [Google Scholar] [CrossRef]
- Mendina, M.; Draper, M.; Kelm Soares, A.P.; Narancio, G.; Usera, G. A general purpose parallel block structured open source incompressible flow solver. Clust. Comput. 2014, 17, 231–241. [Google Scholar] [CrossRef]
- Ferziger, J.; Peric, M. Computational Methods for Fluid Dynamics; Springer: Berlin/Heidelberg, Germany, 2002. [Google Scholar]
- Usera, G.; Mendina, M. CFD Challenge: Solutions using open source flow solver caffa3d.MBRi with immersed boundary condition. In Proceedings of the ASME 2012 Summer Bioengineering Conference, Farjardo, PR, USA, 20–23 June 2012; pp. 20–23. [Google Scholar]
- Berg, P.; Roloff, C.; Beuing, O.; Voss, S.; Sugiyama, S.-I.; Aristokleous, N.; Anayiotos, A.S.; Ashton, N.; Revell, A.; Bressloff, N.W.; et al. The Computational Fluid Dynamics Rupture Challenge 2013-Phase II: Variability of Hemodynamics Simulations in Two Intracranial Aneurysms. J. Biomech. Eng. 2015, 137, 121008. [Google Scholar] [CrossRef] [PubMed]
- Mühle, F.; Schottler, J.; Bartl, J.; Futrzynski, R.; Evans, S.; Bernini, L.; Schito, P.; Draper, M.; Guggeri, A.; Kleusberg, E.; et al. Blind test comparison on the wake behind a yawed wind turbine. Wind. Energy Sci. 2018, 3, 883–903. [Google Scholar] [CrossRef]
- López, B. Desarrollo de un Túnel de Viento Numérico. Master’s Thesis, Faculty of Engineering, Universidad de la República, Montevideo, Uruguay, 2018. Available online: https://hdl.handle.net/20.500.12008/22557 (accessed on August 2022).
- Senior, J.A. Hydrostatic Pressure Converters for the Exploitation of Very Low Head Hydropower Potential. Ph.D. Thesis, Faculty of Engineering and The Environment, University of Southampton, Southampton, UK, 2009. [Google Scholar]
- Senior, J.; Saenger, N.; Müller, G. New hydropower converters for very low head differences. J. Hydraul. Res. 2010, 48, 703–714. [Google Scholar] [CrossRef]
- Pienika, R.; Usera, G.; Ramos, H.M. Simulation of a Hydrostatic Pressure Machine with Caffa3d Solver: Numerical Model Characterization and Evaluation. Water 2020, 12, 2419. [Google Scholar] [CrossRef]
- Schilling, R. Application of CFD-Techniques in Fluid Machinery. In Modelling Fluid Flow; Vad, J., Lajos, T., Schilling, R., Eds.; Springer: Berlin/Heidelberg, Germany, 2004. [Google Scholar] [CrossRef]
- Tucker, P.G. Computation of unsteady turbomachinery flows: Part 2—LES and hybrids. Prog. Aerosp. Sci. 2011, 47, 546–569. [Google Scholar] [CrossRef]
- Remaki, l.; Ramezani, A.; Blanco, J.M.; García, I. New Simplified Algorithm for the Multiple Rotating Frame Approach in Computational Fluid Dynamics. J. Fluids Eng. 2017, 139, 081104. [Google Scholar] [CrossRef]
- Liao, C.C.; Chang, Y.W.; Lin, C.A.; McDonough, J.M. Simulating flows with moving rigid boundary using immersed-boundary method. Comput. Fluids 2010, 39, 152–167. [Google Scholar] [CrossRef]
- Monaghan, J.J. Simulating free surface flows with SPH. J. Comput. Phys. 1994, 110, 399–406. [Google Scholar] [CrossRef]
- Ferrari, A.; Dumbser, M.; Toro, E.F.; Armanini, A. A new 3D parallel SPH scheme for free surface flows. Comput. Fluids 2009, 38, 1203–1217. [Google Scholar] [CrossRef]
- Hirt, C.W.; Nichols, B.D. Volume of Fluid (VOF) Method for the Dynamics of Free Boundaries. J. Comput. Phys. 1981, 39, 201–225. [Google Scholar] [CrossRef]
- Narrain, A.G. Low Head Hydropower for Local Energy Solutions. Ph.D. Thesis, Delft University of Technology and UNESCO-IHE Institute for Water Education, Delft, The Netherlands, 2017. [Google Scholar]
- Nesmachnow, S.; Iturriaga, S. Cluster-UY: Collaborative Scientific High Performance Computing in Uruguay. In Supercomputing, Proceedings of the 10th International Conference on Supercomputing in Mexico, ISUM 2019, Monterrey, Mexico, 25–29 March 2019; Communications in Computer and Information Science. Torres, M., Klapp, J., Eds.; Springer: Cham, Switzerland, 2019; Volume 1151, pp. 188–202. [Google Scholar] [CrossRef]
- Smagorinsky, J. General circulation experiments with the primitive equations: I. The basic experiment. Mon. Weather. Rev. 1963, 91, 99–164. [Google Scholar] [CrossRef]
- Ferziger, J.H. Higher-Level Simulations of Turbulent Flows; Technical Report Number TF-16; Stanford University: Stanford, CA, USA, 1981. [Google Scholar]
- Pope, S. Turbulent Flows; Cambridge University Press: Cambridge, UK, 2000. [Google Scholar]
- Ketabdari, M.J. Chapter 15: Free Surface Flow Simulation Using VOF Method. In Numerical Simulation—From Brain Imaging to Turbulent Flows; Lopez-Ruiz, R., Ed.; IntechOpen: London, UK, 2016. [Google Scholar] [CrossRef]
- Ubbink, O.; Issa, R.I. A method for computing sharp fluid interfaces on arbitrary meshes. J. Comput. Phys. 1999, 153, 26–50. [Google Scholar] [CrossRef]
- Hogg, P.W.; Gu, X.J.; Emerson, D.R. An implicit algorithm for capturing sharp fluid interfaces in the volume of fluid advection method. In Proceedings of the European Conference on Computational Fluid Dynamics, Egmond aan Zee, The Netherlands, 5–8 September 2006. [Google Scholar]
- Brackbill, J.U.; Kothe, D.B.; Zemach, C. A continuum method for modeling surface tension. J. Comput. Phys. 1992, 100, 335–354. [Google Scholar] [CrossRef]
- Trivellato, F.; Raciti Castelli, M. On the Courant–Friedrichs–Lewy criterion of rotating grids in 2D vertical-axis wind turbine analysis. Renew. Energy 2014, 62, 53–62. [Google Scholar] [CrossRef]
- Gnedin, N.Y.; Semenov, V.A.; Kravtsov, A.V. Enforcing the Courant–Friedrichs–Lewy condition in explicitly conservative local time stepping schemes. J. Comput. Phys. 2018, 359, 93–105. [Google Scholar] [CrossRef]
- Rhie, C.M.; Chow, W.L. A numerical study of the turbulent flow past an isolated airfoil with trailing edge separation. AIAA J. 1983, 21, 1525–1532. [Google Scholar] [CrossRef]
- HYLOW: Development of Hydro Power Converter for Very Low Head Differences. Available online: http://www.hylow.eu/ (accessed on August 2022).
- Schneider, S.; Müller, G.; Saenger, N. HYLOW Project Report: Converter Technology Development—HPM and HPC. Internal Task Report 2.3. 2011; Not Published. [Google Scholar]
- Schneider, S.; Müller, G.; Saenger, N. HYLOW Project Report: Converter Technology Development—HPM and HPC. Internal Task Report 2.4. 2011; Not Published. [Google Scholar]
- Newland, D. An Introduction to Random Vibrations and Spectral Analysis; Longman Inc.: New York, NY, USA, 1984. [Google Scholar]
Disclaimer/Publisher’s Note: The statements, opinions and data contained in all publications are solely those of the individual author(s) and contributor(s) and not of MDPI and/or the editor(s). MDPI and/or the editor(s) disclaim responsibility for any injury to people or property resulting from any ideas, methods, instructions or products referred to in the content. |
© 2022 by the authors. Licensee MDPI, Basel, Switzerland. This article is an open access article distributed under the terms and conditions of the Creative Commons Attribution (CC BY) license (https://creativecommons.org/licenses/by/4.0/).

