Abstract
This paper presents the optimal conditions for fast transfer of solid particle with an airlift pump. The experimental examinations were carried out in an airlift pump with a length of 5.64 m and an inner diameter of 0.102 m in order to determine the impact of submergence ratio, air flow, and physical particle properties, such as shape, size, and density, on the vertical velocity of the particle in detail. The results showed that with the same air flow, the maximum particle velocity was achieved when the churn flow regime is established with a submergence ratio close to 0.89. However, in bubble and slug flow, it is not possible to carry a large particle in the dimensions of centimeters. Furthermore, in a churn flow, the velocity of the particle exceeds the velocity of pumped water; hence, water is not the only particle carrier in a vertical three-phase flow.
1. Introduction
Airlift pumps are used to transport liquids or slurries (liquid–solid) in different technologies, such as transporting different gravels and a drainage system in mining, treating urban wastewater, and transporting radioactive and corrosive solutions in the chemical industry [1]. Despite its low efficiency (only 10% to 30%) compared to other types of pumps (eccentric, screw piston, diaphragm etc.), an airlift is a simple device and offers a number of advantages, like lower initial coast, lower maintenance, easy installation, and small space requirements. Despite the very simple structure of the pump, particle movements in a three-phase flow has not yet been precisely described.
Most of the theoretical and practical research on this pump has been conducted in two-phase flow (air-water), and less attention has been paid to cover the various aspects of three-phase flow. Kato et al. [2] investigated the lifting of round glass particles with an airlift of 3.55 m height and 19 mm diameter. This study was limited in that slug flow region and other upflow regimes, such as churn and annular, were not investigated. Kirichenko et al. [3] developed the theory and calculation algorithms to use when airlift works in slug flow to transport manganese nodules from deep sea mining. Research conducted only on spherical particles is widely prevalent in the literature. Among them, Yoshinaga and Sato [4] established a triangular relationship between the amount of water flow, discharged particle rate and the amount of air flow based on experimental investigations of some round ceramic particles. Therefore, their model is established only for spherical particle size distribution. Another noteworthy point is that the particles transported by the airlift pump were small and had dimensions in the range of millimeters. Fujimoto et al. [5] considered the mechanism of sphere particle transportation in pulsating water flow by stereo videography and numerical simulations. The tested particles were 3 mm and 5 mm in diameter with two densities of 3600 kg/m3 and 2520 kg/m3. Berg [6] proposed a theoretical approach to estimate the output flow rates of airlifts for transporting small marine gravel with particle size distributions ranging between 2 mm and 15 mm. For the experimental tests, the author used an airlift of 3.05 m height with two pipe diameters of 40 mm and 90 mm.
Contrary to the principles of upward water flow due to reduced density and buoyant force, some researchers have conducted studies on three-phase flow, the results of which can also be used with appropriate approximation for the airlift pump. Erian and Pease [7] evaluated vertical transportation of sand particles in annular and dispersed flow. To create an annular flow, they added water to a mixture of compressed air and sand particles and then directed them to a vertical pipe. Deendarliantoa et al. [8] studied the behavior of sand and coal particles up to 0.81 mm in size with an image-processing technique. Unlike Erian and Pease [7], they added compressed air to a mixture of water and solids and tried to evaluate the transportation efficiency by changing the angle of the micro-bubble injectors.
In most theoretical studies, the authors mainly focused on establishing mathematical models for the specific operating condition of airlift pumps, and empirical research has not covered the different types of three-phase flow regimes. Moreover, there are no detailed instructions on using some equations in practice [9]. Hence, it is necessary to determine a number of experimentally derived factors, which requires time and is resource-intensive. One case that has not been studied yet is the movement of one particle in the vertical air–water flow. Most empirical tests were designed to estimate the amount of solid transportation over time, and the behavior of single particle in different flow regimes is still unknown.
In this study, the operating modes of the airlift pump for transporting three different particles with a lifting pipe of 0.102 m diameter and 5.64 m length at varied submergence ratios were investigated. Empirical studies were carried out for different flow regimes from bubble up to churn flow to accurately estimate the velocity of the solid phase. Considerable attention was paid on establishing critical boundaries so that the solid particle could be lifted in water (one-phase) and in the air–water (two-phase) flow. The average transporting velocity of a solid particle can be determined by using a simple calculation process related to two-phase flow theories. This makes it possible to develop recommendations for determining the optimum operating modes of the airlift pump, in particular for the submergence ratio and the air flow rate.
2. Materials and Methods
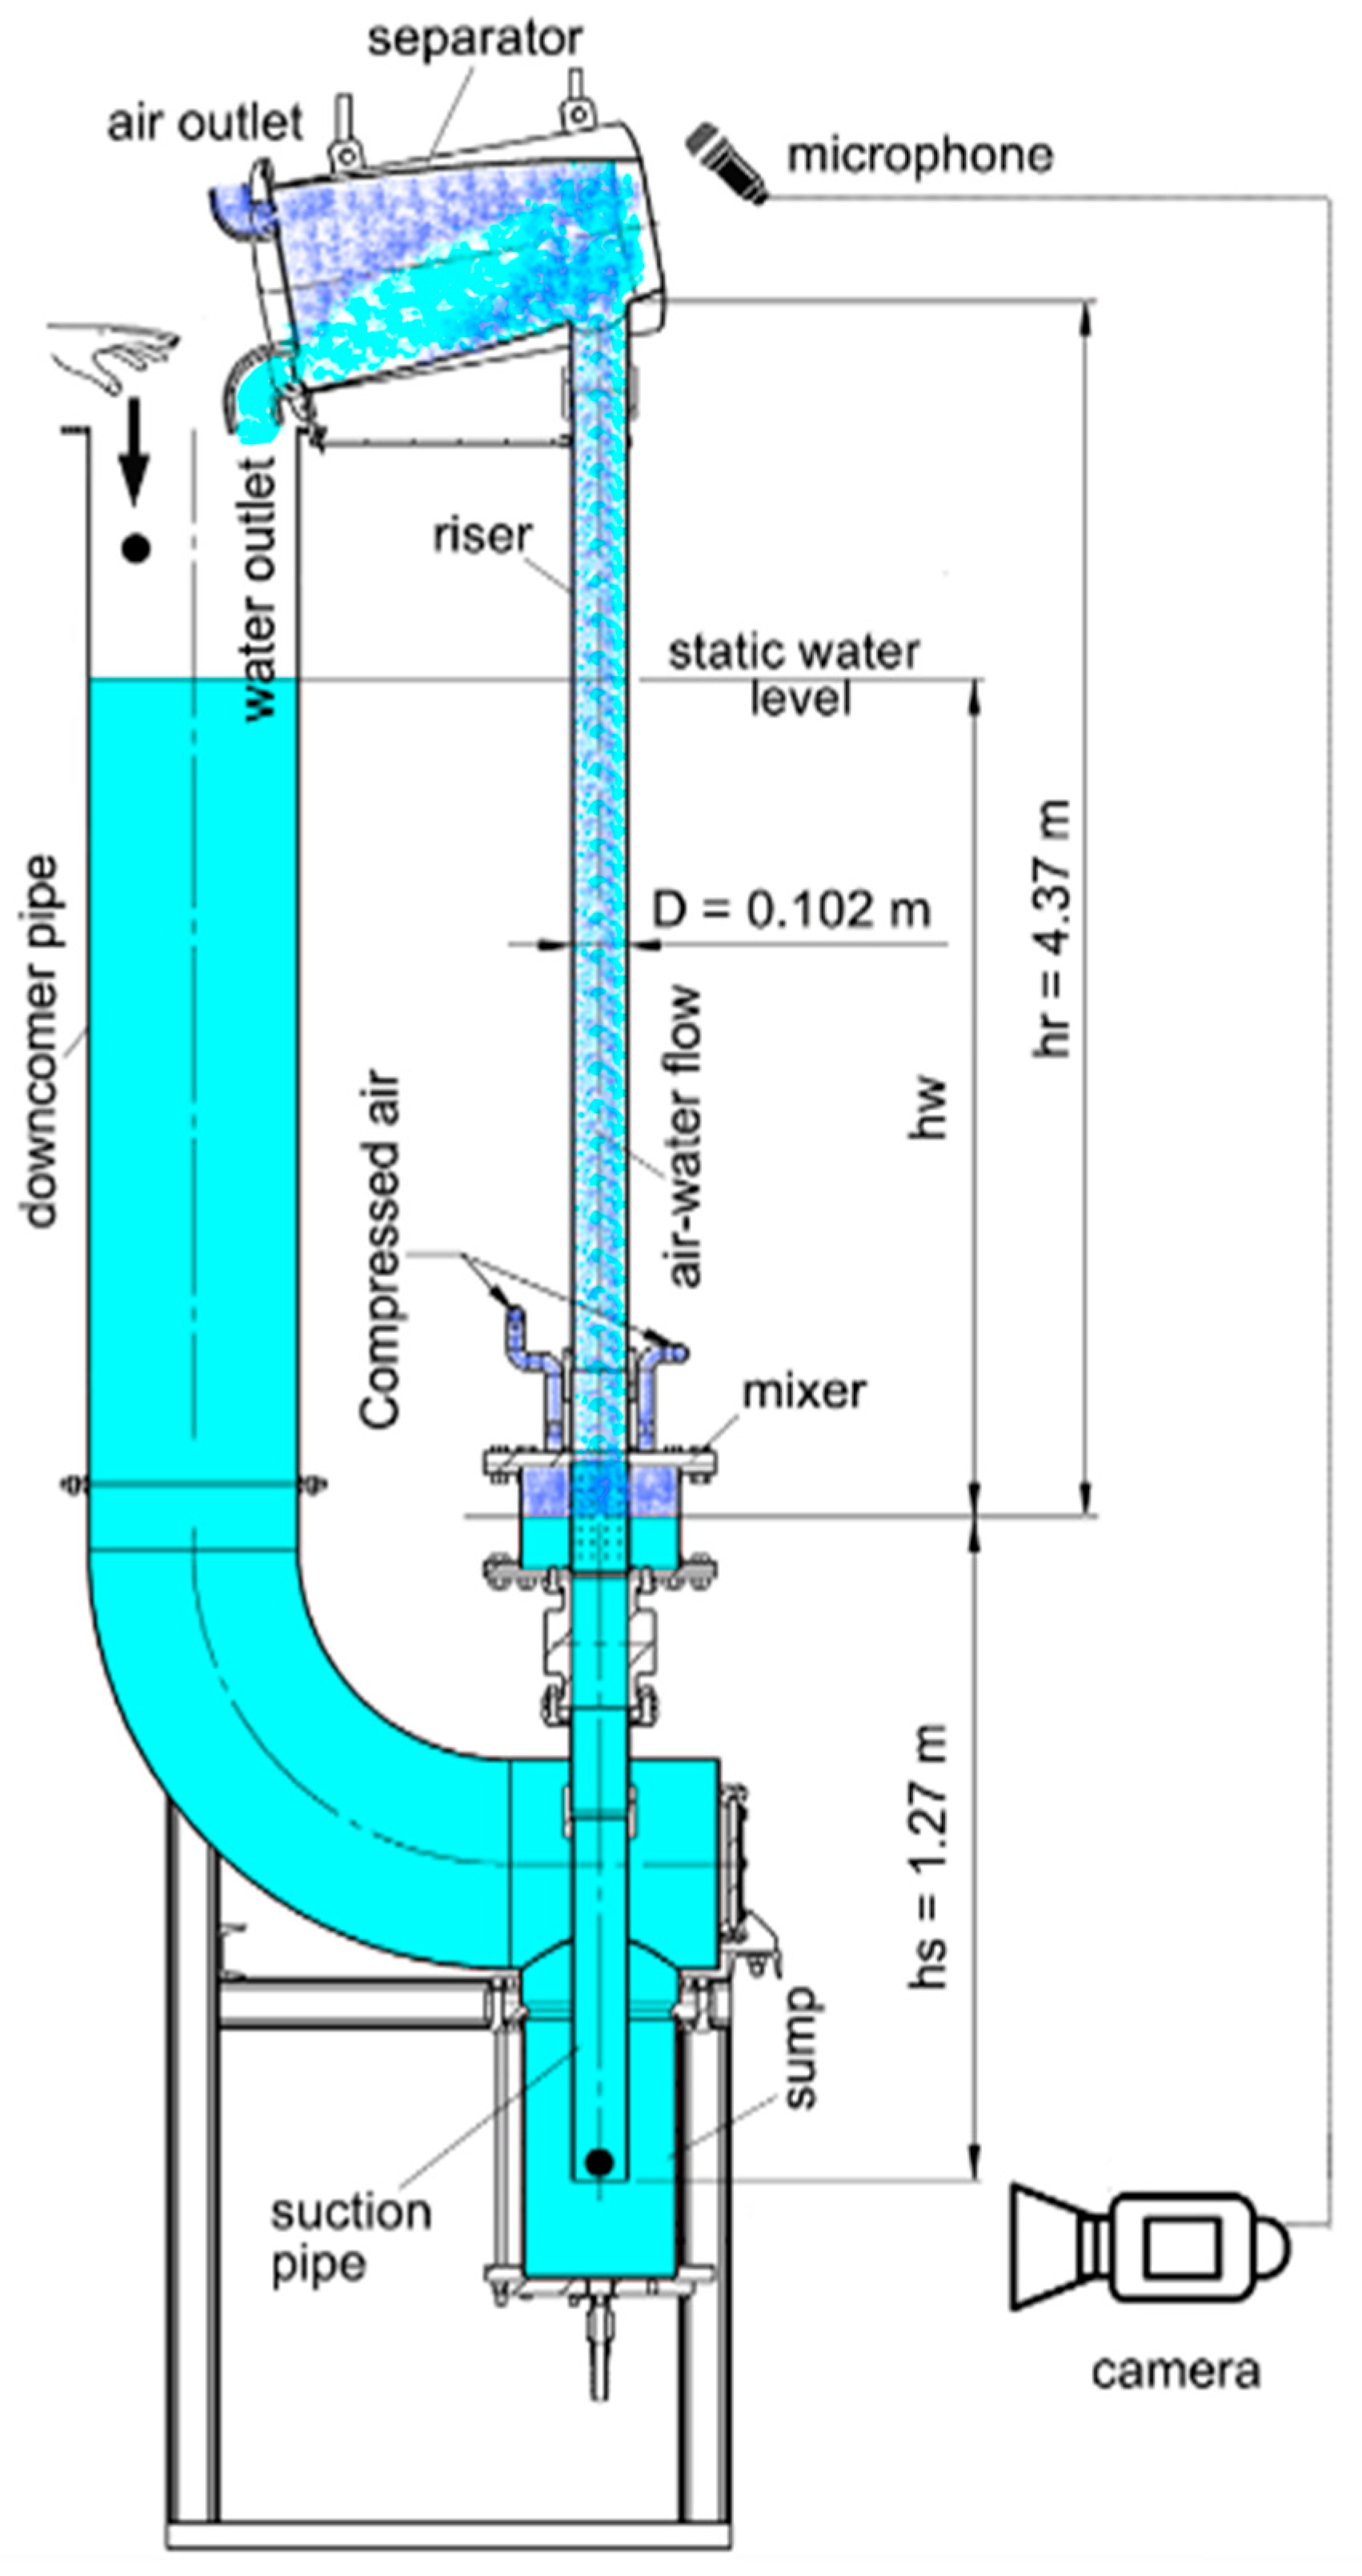
The outline of the airlift pump is shown in Figure 1, which was designed at the Technical University Bergakademie Freiberg under the framework of the HydroCoal Plus project, funded by the Research Fund for Coal and Steel (European Commission). The main parts of this pump are: (1) sump made of transparent hard plastic, (2) suction pipe, (3) air jacket, (4) riser pipe, (5) separator tank, and (6) downcomer pipe. We recommend that the reader refer to Enany et al. [9] for further details about the sensors, air jacket, and working conditions for water pumping.
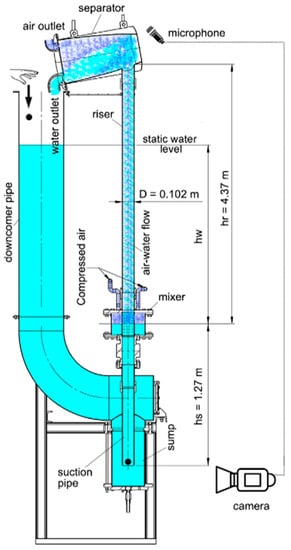
Figure 1.
Schematic of the working principle of the airlift pump.
At the beginning of the experiment, the airlift was filled with water up to the required level h. The compressed air was injected into the air jacket to induce circulation of the liquid. The air-jacket was a cylindrical stainless-steel pipe with 84 circular holes, 3 mm in diameter. The mixture of air and water was lifted to the separator tank, where air and water could be easily separated. The air was released to the atmosphere, and the water came back to the downcomer pipe. Therefore, the installation worked in a closed loop, which was useful for performing each experiment with the same condition several times.
The flow rate of air (Qa) and submergence ratio (Sr) could be changed independently during the experiment. The submergence ratio was determined as Sr = hr/hw, where hw is the air injection depth (m). Since the velocity of water transport by the airlift was strongly dependent on the submergence ratio, the minimum amount of air to move the particle vertically was varied at each submergence ratio. The two considered particles were made of glass and the third one was coal, the specifications of which are provided in Table 1. It should be noted that the dimensions of the coal particle are the longest three main axes in two perpendicular sections of it (L1, L2, L3: long, medium and short axes, respectively). For more information, please see Supplemental Figure S1.

Table 1.
Parameters of the investigated particles.
Practical examinations have always been performed on a single particle, and there have never been several particles moving inside the pump at the same time. Each experiment is initiated at the minimum amount of air velocity required to suck a particle into the suction tube, and it ends when the particle reaches the end of the riser tube where it is connected to the separator tank. The particle is then returned to the suction area by free-fall settling in the downcomer. A distance between the entrance of the suction pipe and the bottom of the sump was adjusted so that the particle has maximum suction possibility. The measurement of transportation time for one particle was repeated 30 times for each change in submergence ratio and inlet compressed air rate. The initial velocity of the particle falling into the downcomer had no impact on recording the values, because the time between particle entry into the suction pipe and it hitting the wall of the separator tank (5.97 m) was used in calculations.
Since the sump and suction pipe of the airlift installation are made of transparent hard plastic, the moment the particle transport began (introduced in suction pipe) was observed and recorded with one camera; the camera level was illustrated in Figure 1. Moreover, Supplemental Figures S2 and S3 show the position of the camera in actual set-up. At the end of the path, the transported particle hit the wall of the separator tank, and the resulting noise was loud and clearly audible. Nevertheless, to capture sound and video at the same time, a noise-canceling microphone was installed to record sound at the level of the separator tank. A part of the particle movement took place in the separator tank, the length of which could not be determined precisely because there was no possibility to see inside the separator. Thus, the particle could hit any part of the tank wall in a quadratic space. The motion of particle was recorded with 35 frames per second. This means that there is 0.028 s between each frame. We increased this value to 0.04 to cover the invisible small length in the separator tank. Therefore, from the analysis of video and audio data, the time intervals (ti) for the whole transportation time were determined with a precision of ±0.04 s.
3. Results and Discussion
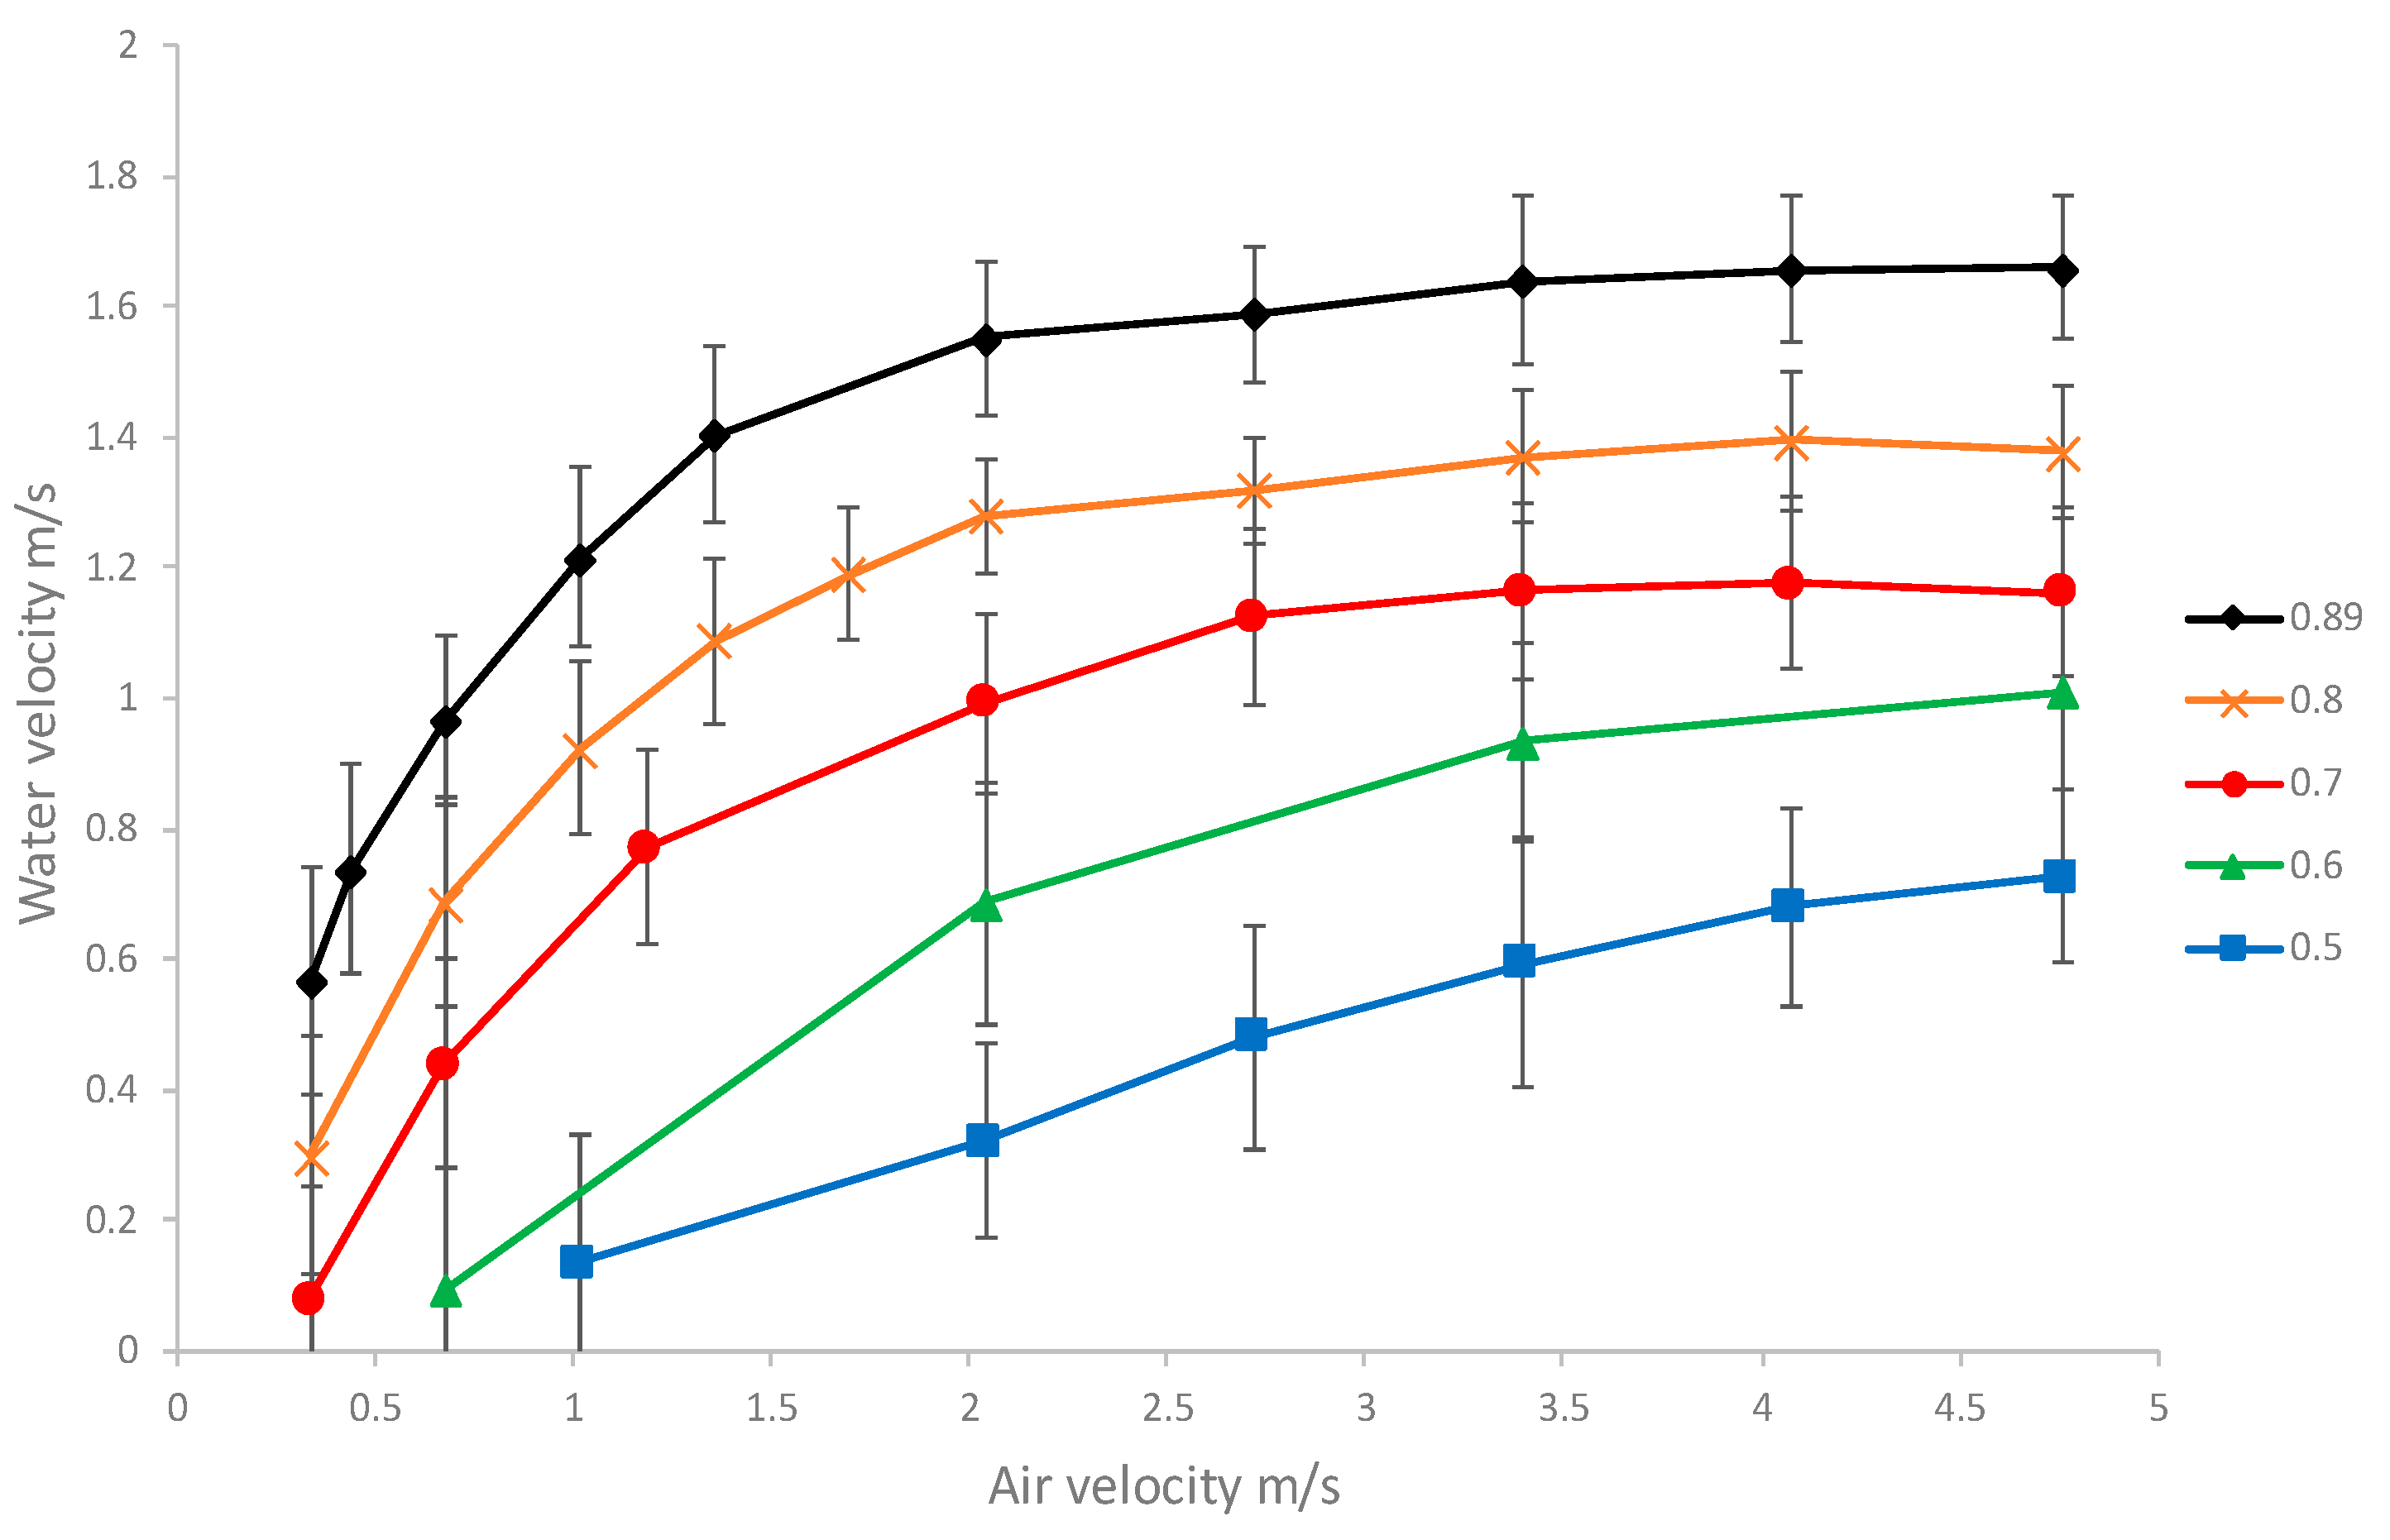
To determine the velocity of a particle during transportation by airlift pump, three variable parameters were considered: submergence ratio Sr, type of particle, and air flow rate Qa. According to the results of two-phase flow (see Figure 2), in this study, submergence ratios 0.7, 0.8, and 0.89 were considered to have more water velocity with the least amount of injecting air. Based on the data presented in Figure 2, it is obvious that the airlift worked, as the Reynolds number (Re) varied from 6 × 10³ to 1.4 × 10⁵. Therefore, the vertical transport of the solid particle was in accordance with the turbulent flow conditions (laminar flow Re-Number is lower than 2300).
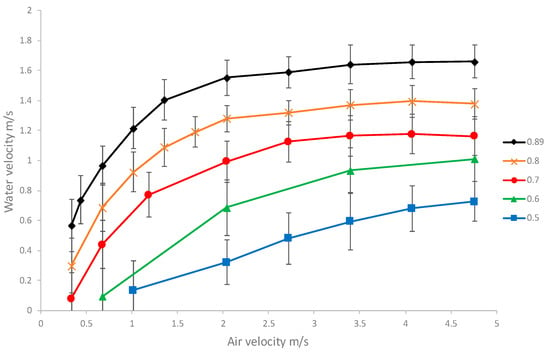
Figure 2.
Experimental two-phase flow characteristics with different submergence ratio.
3.1. Flow Regimes
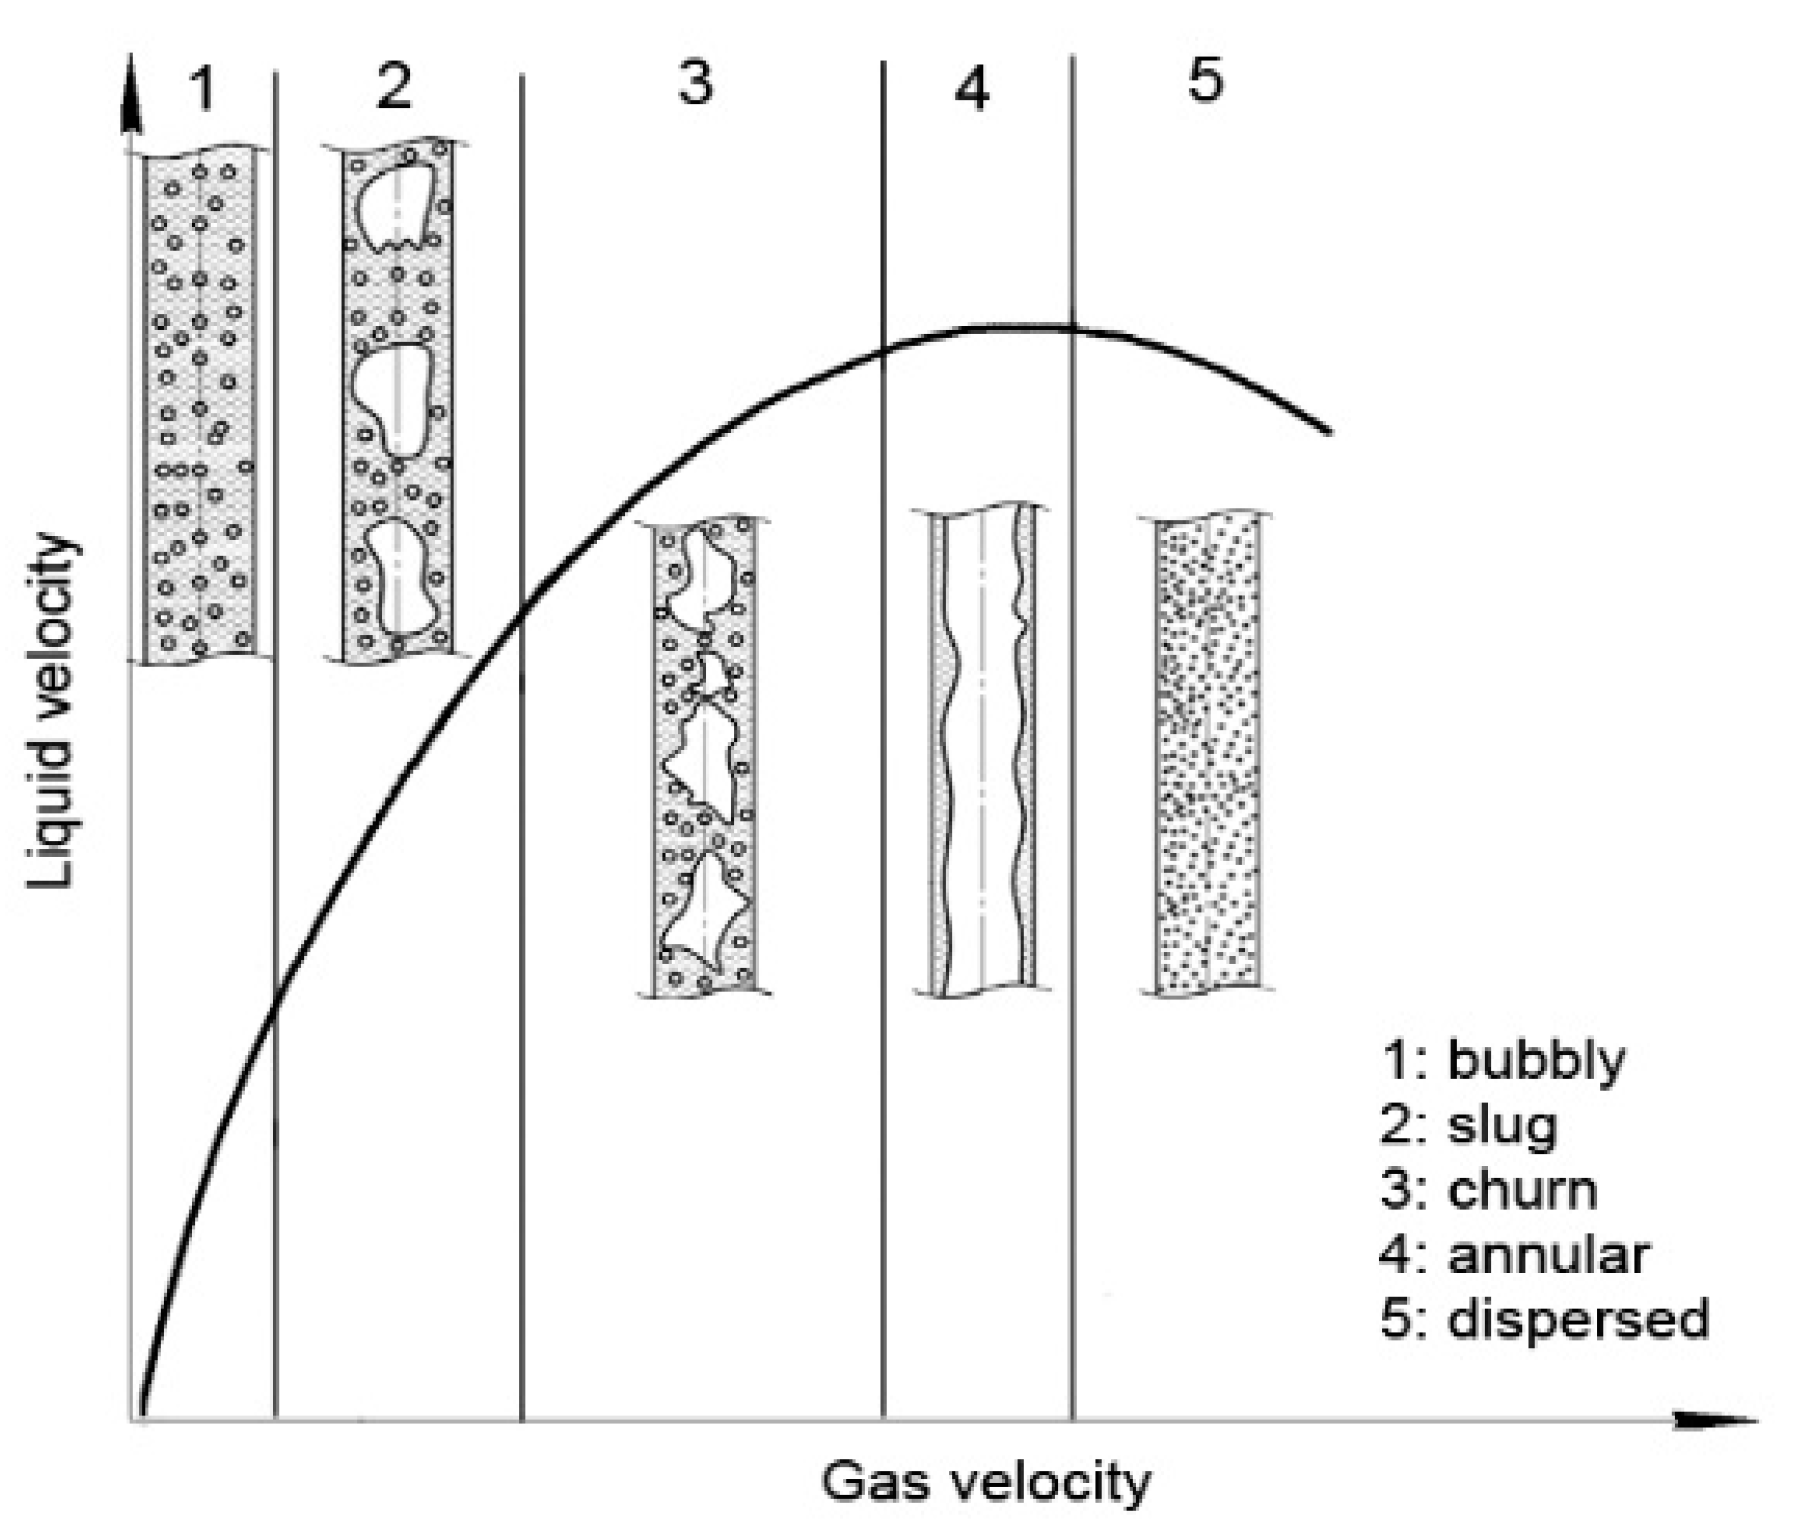
In terms of influent air flow rate (Qa), different regimes of two-phase flow (gas-liquid) may be distinguished in the following order (Figure 3): bubbly, slug, churn, annular, and dispersed flow regimes [10]. The lack of same criterion for interpreting the flow behavior and the diversity of empirical results on different pumps led to a non-uniform agreement on the classification and illustration of upward two-phase flow boundaries and exposure to different two-phase upflow maps by researchers. Miller and Cain [11] examined the influence of solid particles on vertical three-phase flow transitions. They concluded that solid particles accelerate the transitions of flow from bubble to slug flow and do not play an effective role in transitions of flow from the slug to churn flow. Therefore, the two-phase flow map presented by Taitel et al. [12] is applicable for our experimental conditions.
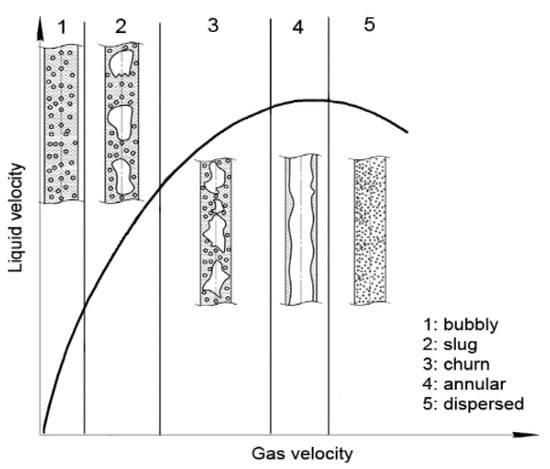
Figure 3.
Flow pattern transitions in vertical upward two-phase flow.
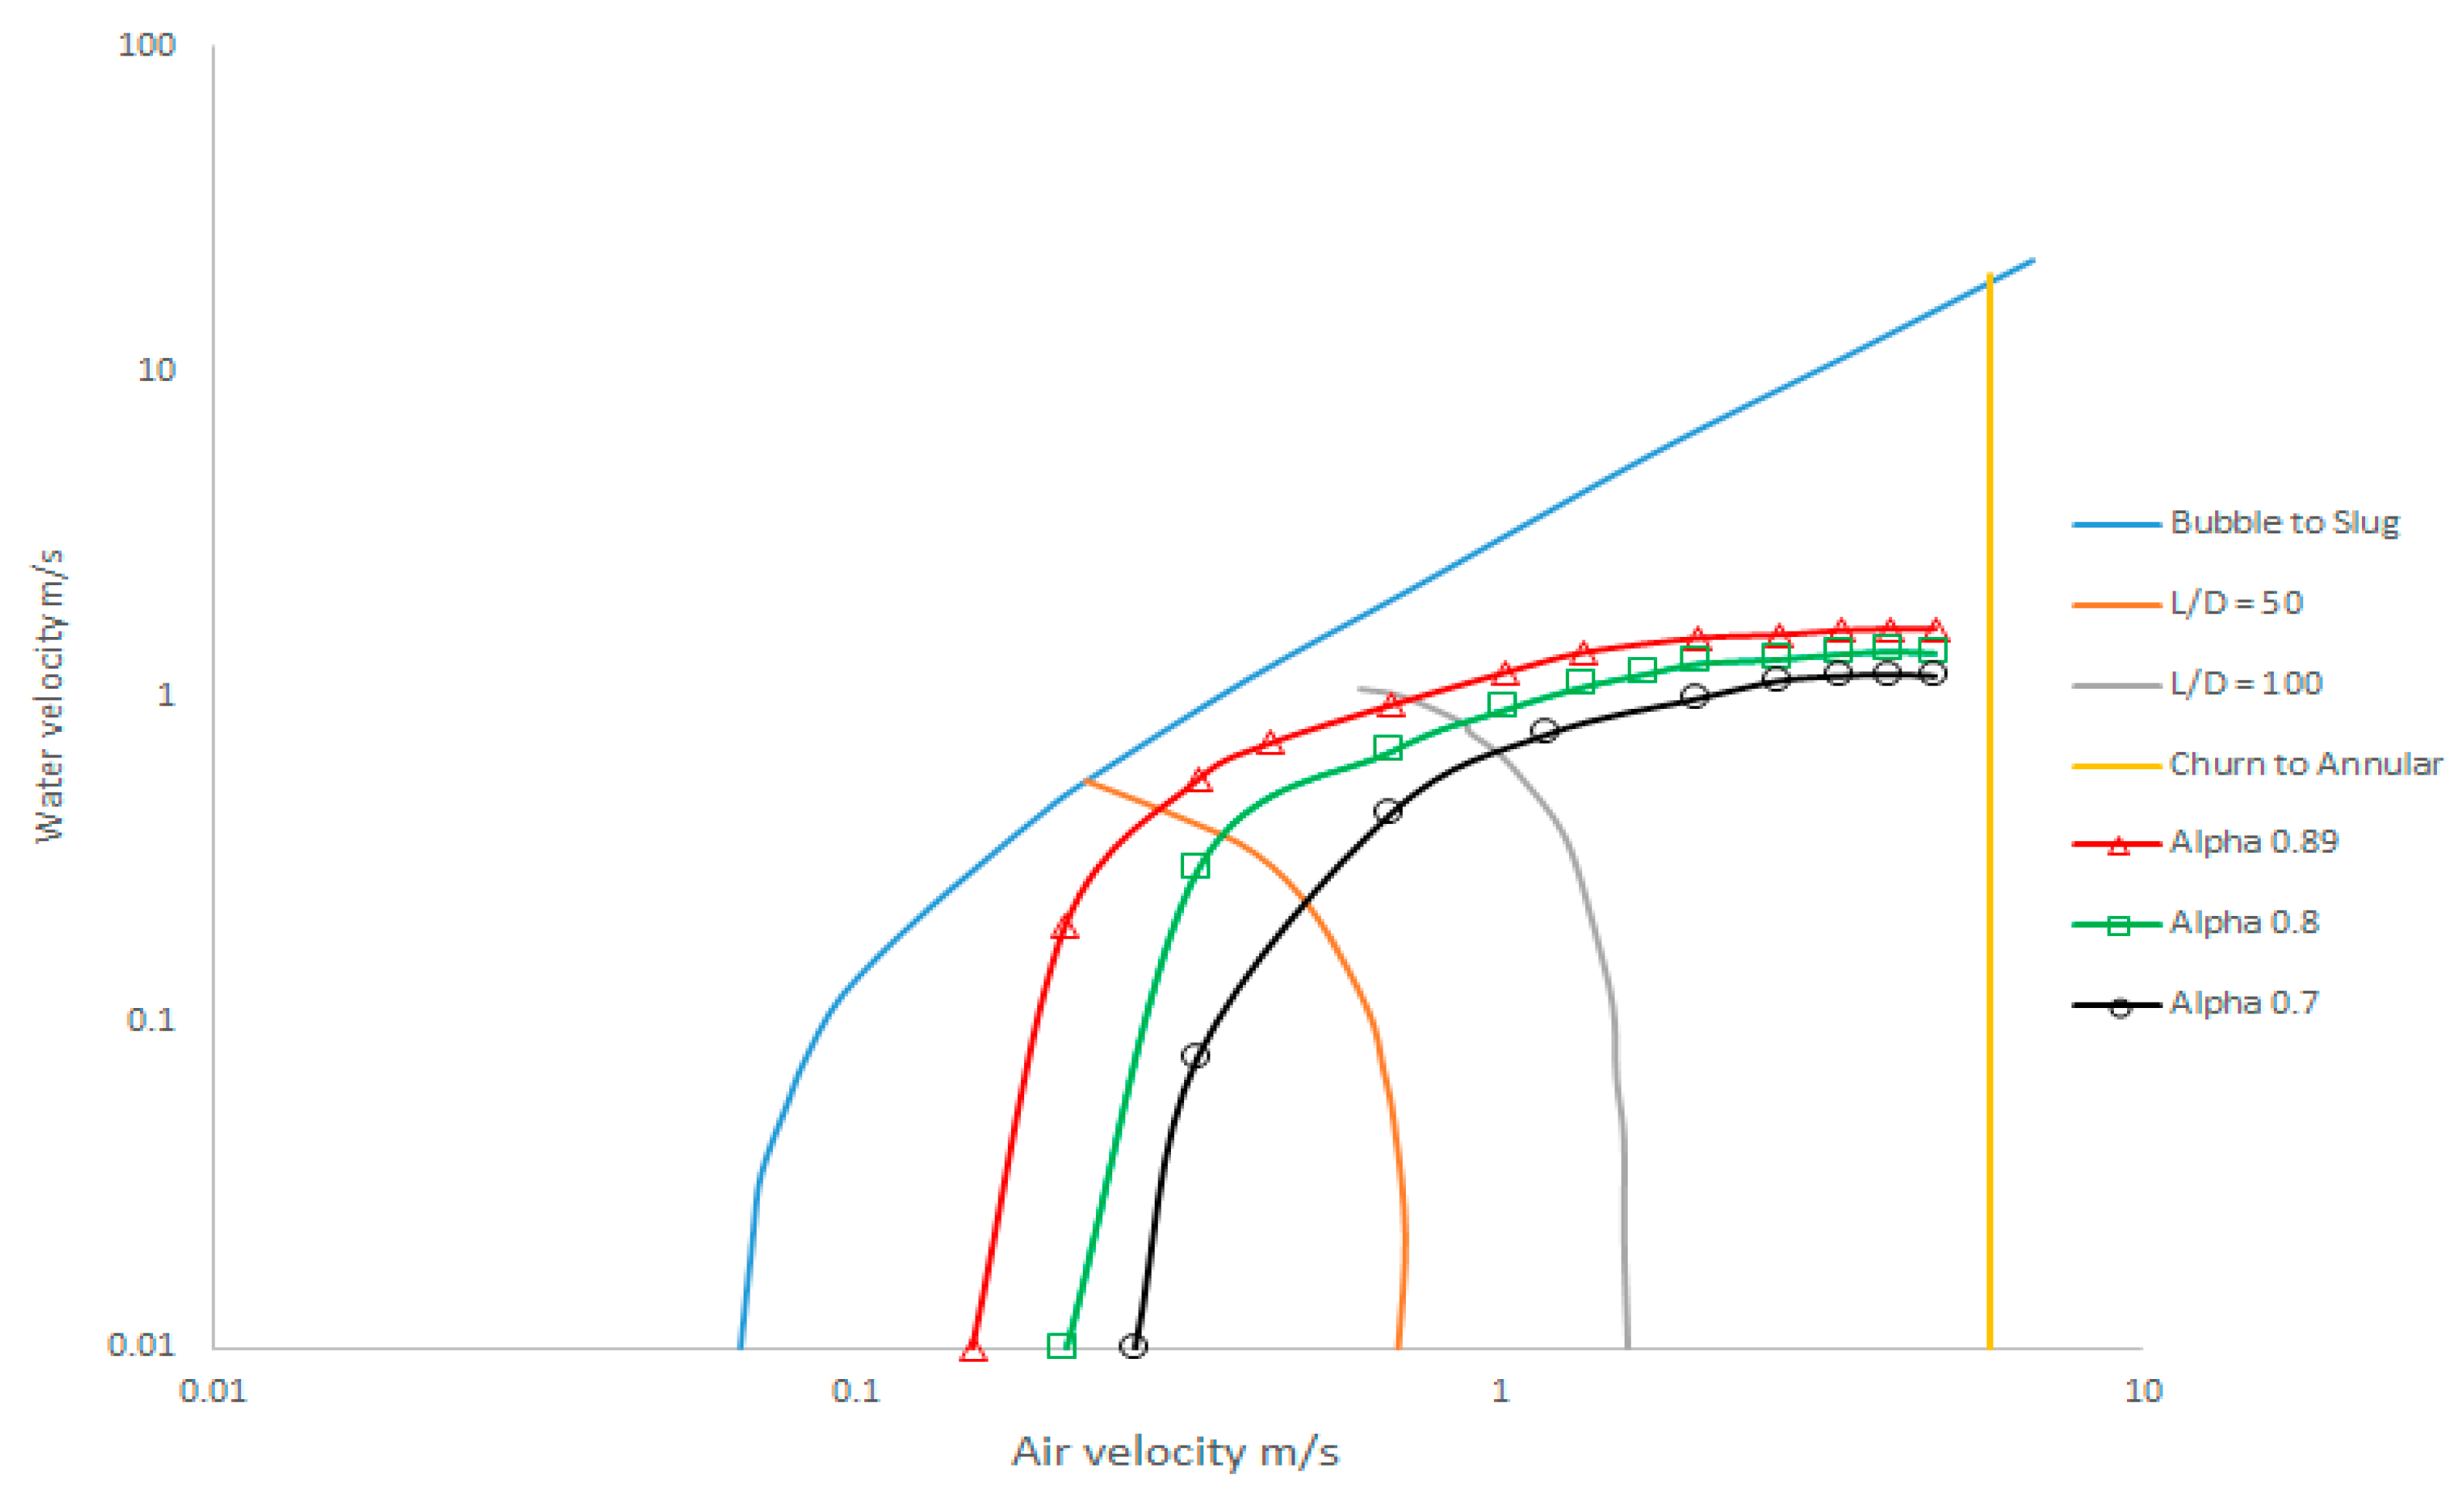
Figure 4 shows the boundaries for different two-phase flow transitions together with our two-phase experimental results. Unlike other researchers whose results cover only certain dimensions of the pump, Taitel et al. [12] presented a flow map based on the relationship between the pipe length and diameter (L/D). To find the transition zone from slug to churn, given the dimensions of the riser pipe in our test, this ratio is equal to 60, which stands between graph 50 and 100. It should be noted that in accordance with the environmental conditions of the experiments, the boundary of the transition flow from the churn to the annular is considered when the Kutateladze number is equal to 3.1 (Vair = 5.78 m/s). Therefore, from the observations in Figure 4, it is also evident that our experiments are done in bubble, slug, and churn flow regime.
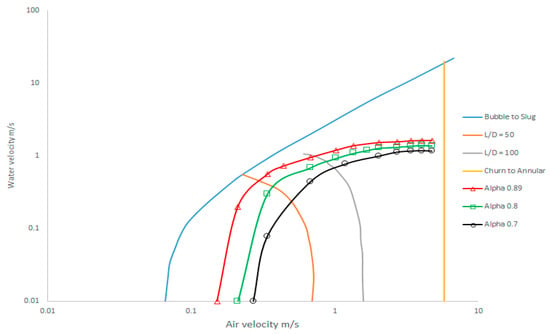
Figure 4.
Comparison of experimental two-phase results by Taitel’s flow-pattern map.
3.2. Particle Velocity
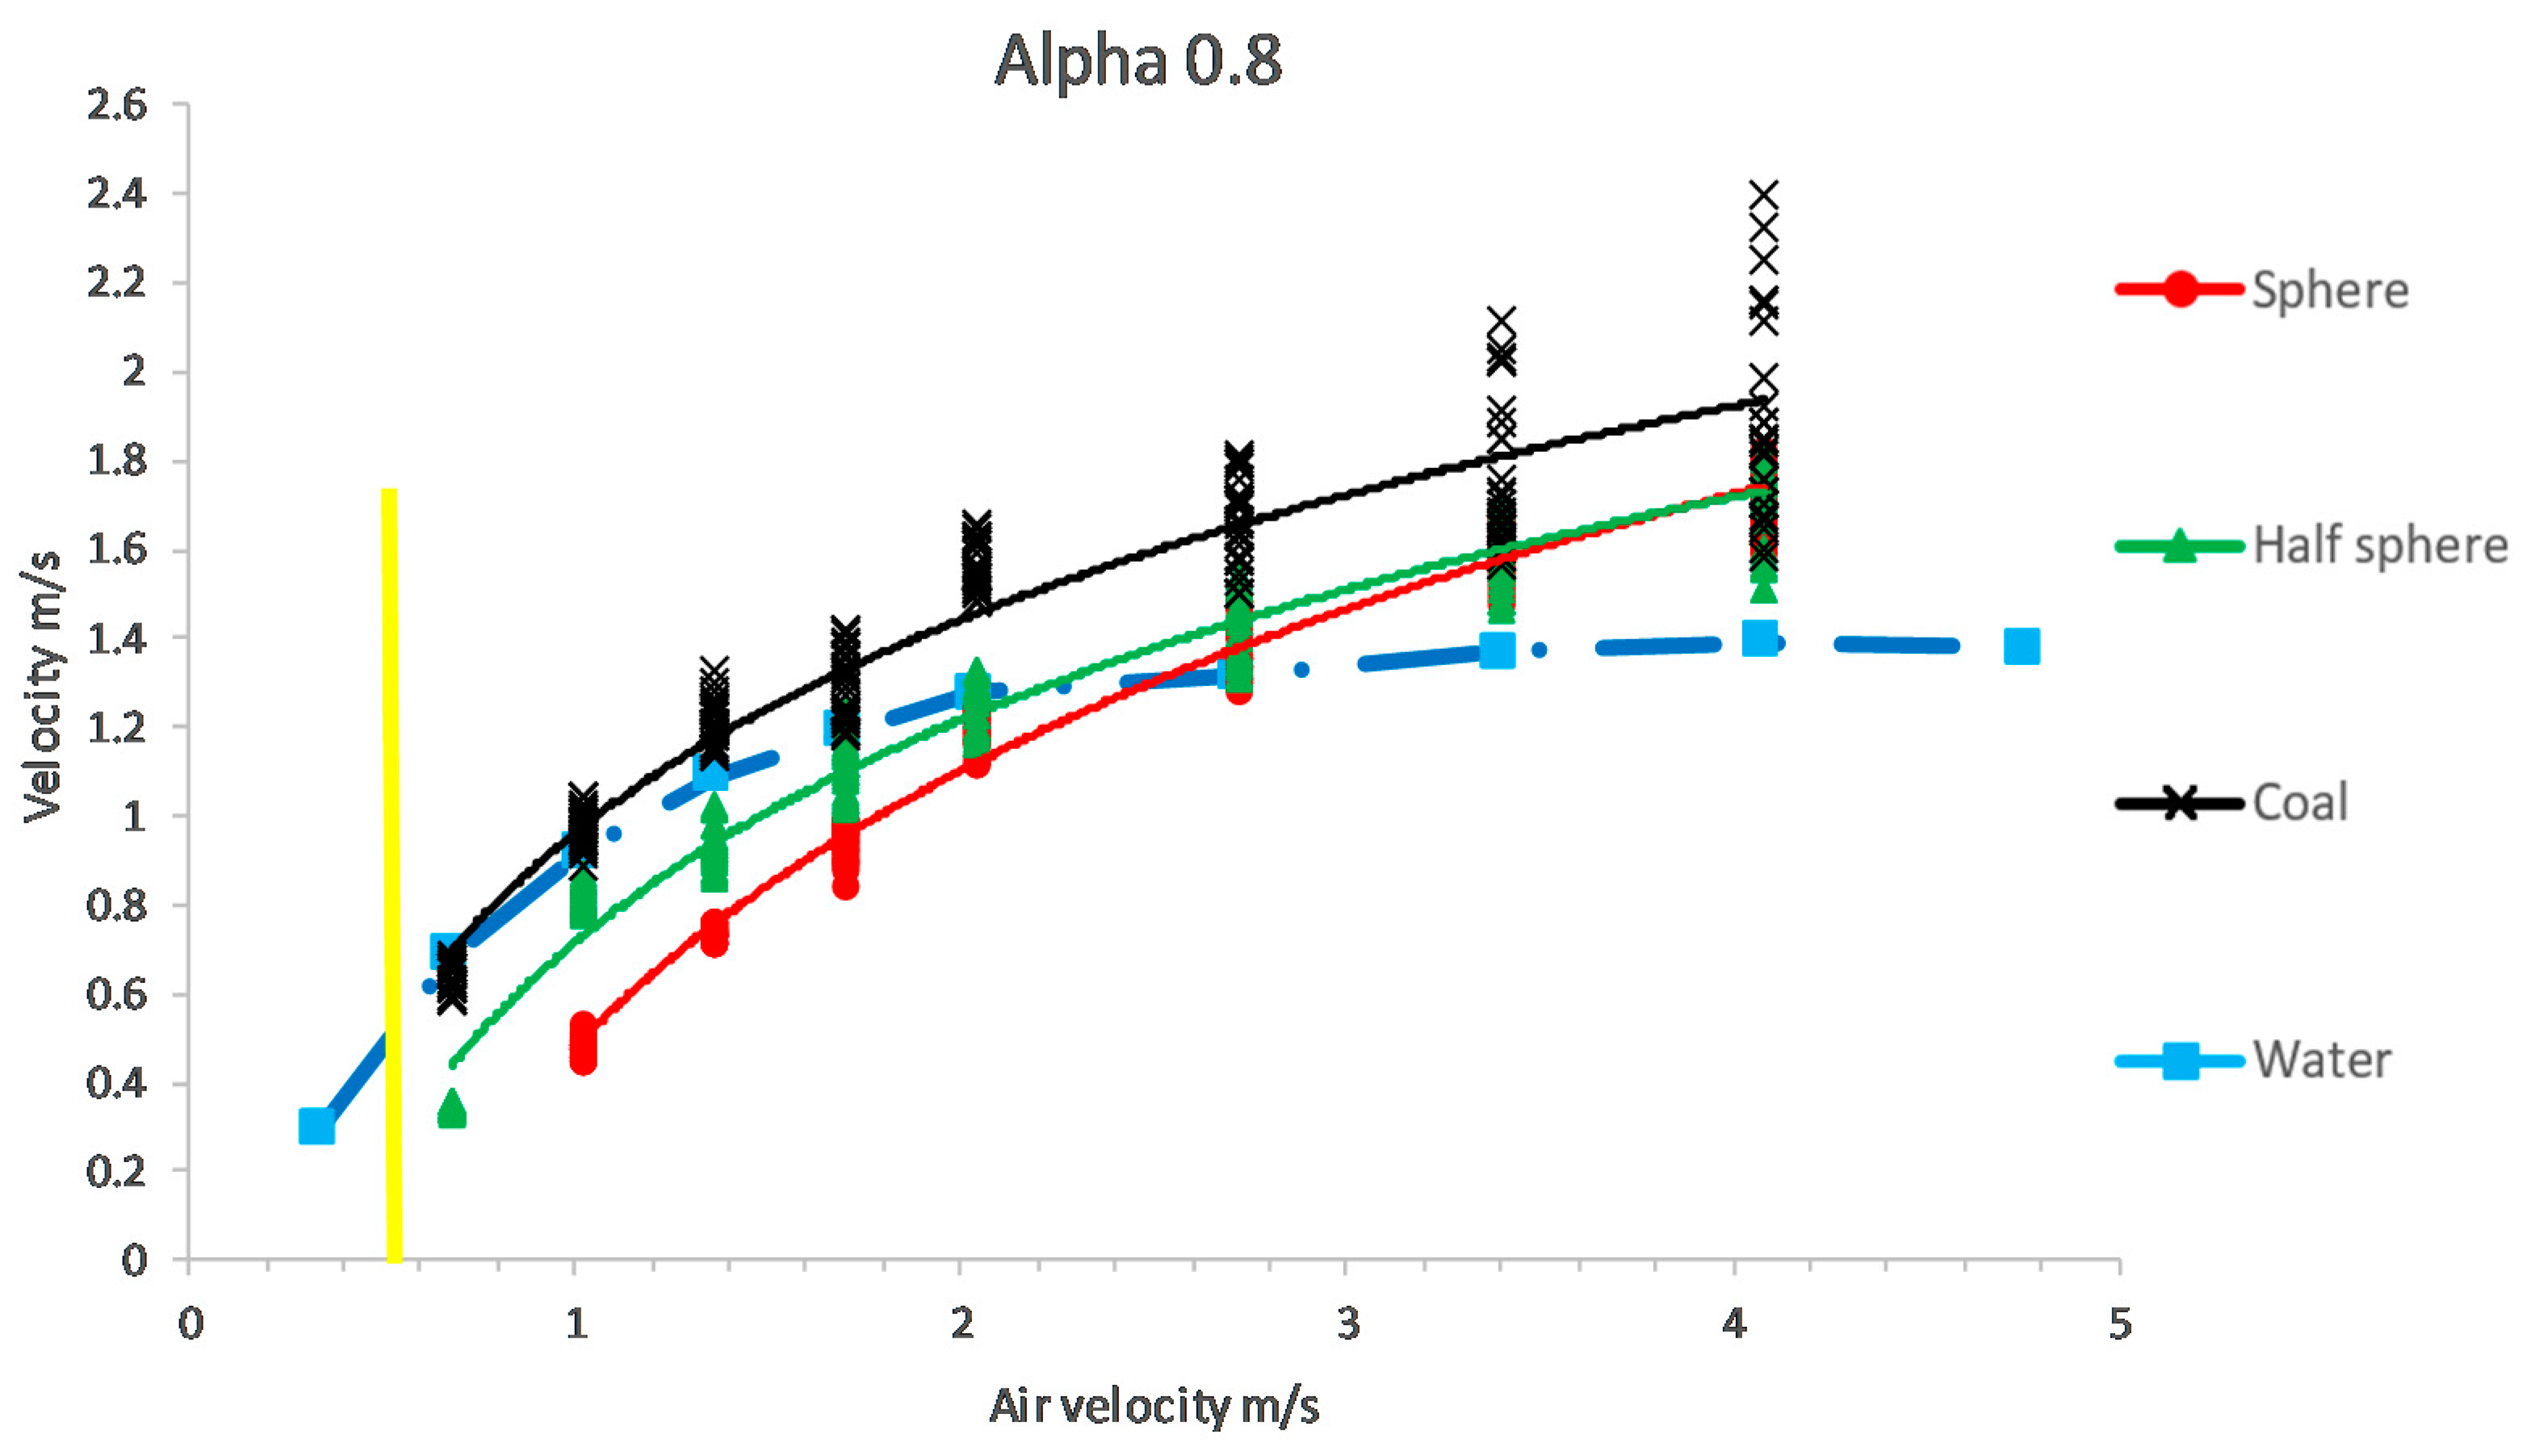
Since the focus of this work was on measuring the velocity of a particle pumped by an airlift, it was obtained by dividing the total length of the vertical tube through which the particle has travelled over time (Vp = (hs + hr)/ti). For different measurement conditions, the arithmetic mean of velocity was calculated. Figure 5 shows the correlation between the air velocity and solid lifting velocity for particles PS, PH, and PC at a submergence ratio of 0.8. In Figure 5, the starting point of each diagram corresponds to the amount of air required to reach the vertical velocity of the water, which is slightly higher than the settling velocity of the particle falling into the still water. Therefore, by injecting less compressed air than this amount, the particle cannot be sucked and pumped to a higher level. The vertical bold line in Figure 5 corresponds to the transition zone from slug to churn flow. Beyond the type of flow regime, the velocity of a particle was increased by raising the velocity of the inlet air. This stepwise increment was more significant for coal, as it has a higher volume and lower density than the other glass particles.
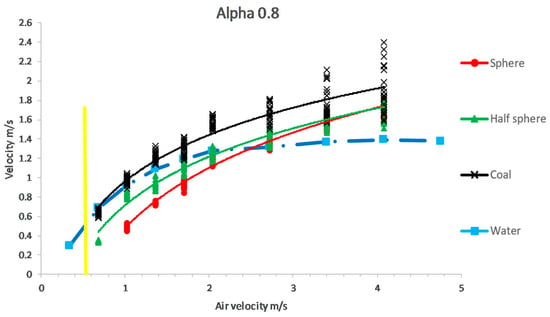
Figure 5.
Particle velocity transportation in relation to the velocity of inlet gas in the airlift.
Owing to the high speed of a transported particle and its severe impact on the separator tank wall, it was possible to destroy the particle and change its usual shape. Hence, the experiment could not be continued for annular flow regime. Figure 5 also depicts that with increasing compressed air injection, the amplitude of velocity oscillations (vertical particle transporting time) enhance until it reaches the highest in the churn flow regime. In terms of the position of each phase inside the tube, the churn flow regime is very similar to the annular flow, where the main liquid phase is close to the wall of the pipe and large cores of gas are located in the middle. This condition raises the collision of the solid particle with the pipe wall, in which the irregular particles have a less chance of rolling on the wall and the friction caused by the collisions will definitely cause fluctuations in the particle transporting time. It can be concluded that the more irregular the shape of the particle, the greater the transporting velocity oscillation.
Due to the significant difference between the density of the gas and the liquid, the particles in the gas settle much faster than the liquid. Therefore, some researchers have argued that the water phase carries the solid particle and air has no contribution in vertical transportation [5,13,14]. It should be noted that they monitored the state of small solid particles transportation in the range of bubble and slug flow. This point of view is in sharp contradiction with our empirical outcomes in the churn flow regime, which are displayed in Figure 5. As seen in this figure, by increasing the velocity of inlet air by more than 2.4 m/s, the velocity of the liquid phase is almost constant and does not change much, but all types of particles still show an increase in velocity. Therefore, the above assumption in the already mentioned study does not hold true, and air also participates in carrying the particle upwards in the churn flow regime.
In addition, simultaneous comparison of two glass particles (PS and PH) indicate that the drag coefficient in a low amount of incoming air in the churn flow regime is an effective parameter for faster particle transfer, while on increasing the amount of influent air, the effect of this case gradually minimizes and eventually the spherical and half-spherical particles are transported upwards at the same velocity. The cause of such an event still needs more research to better determine the orientation of the particles in high air flow and clarify the interaction between the three phases.
3.3. Effect of Submergence Ratio
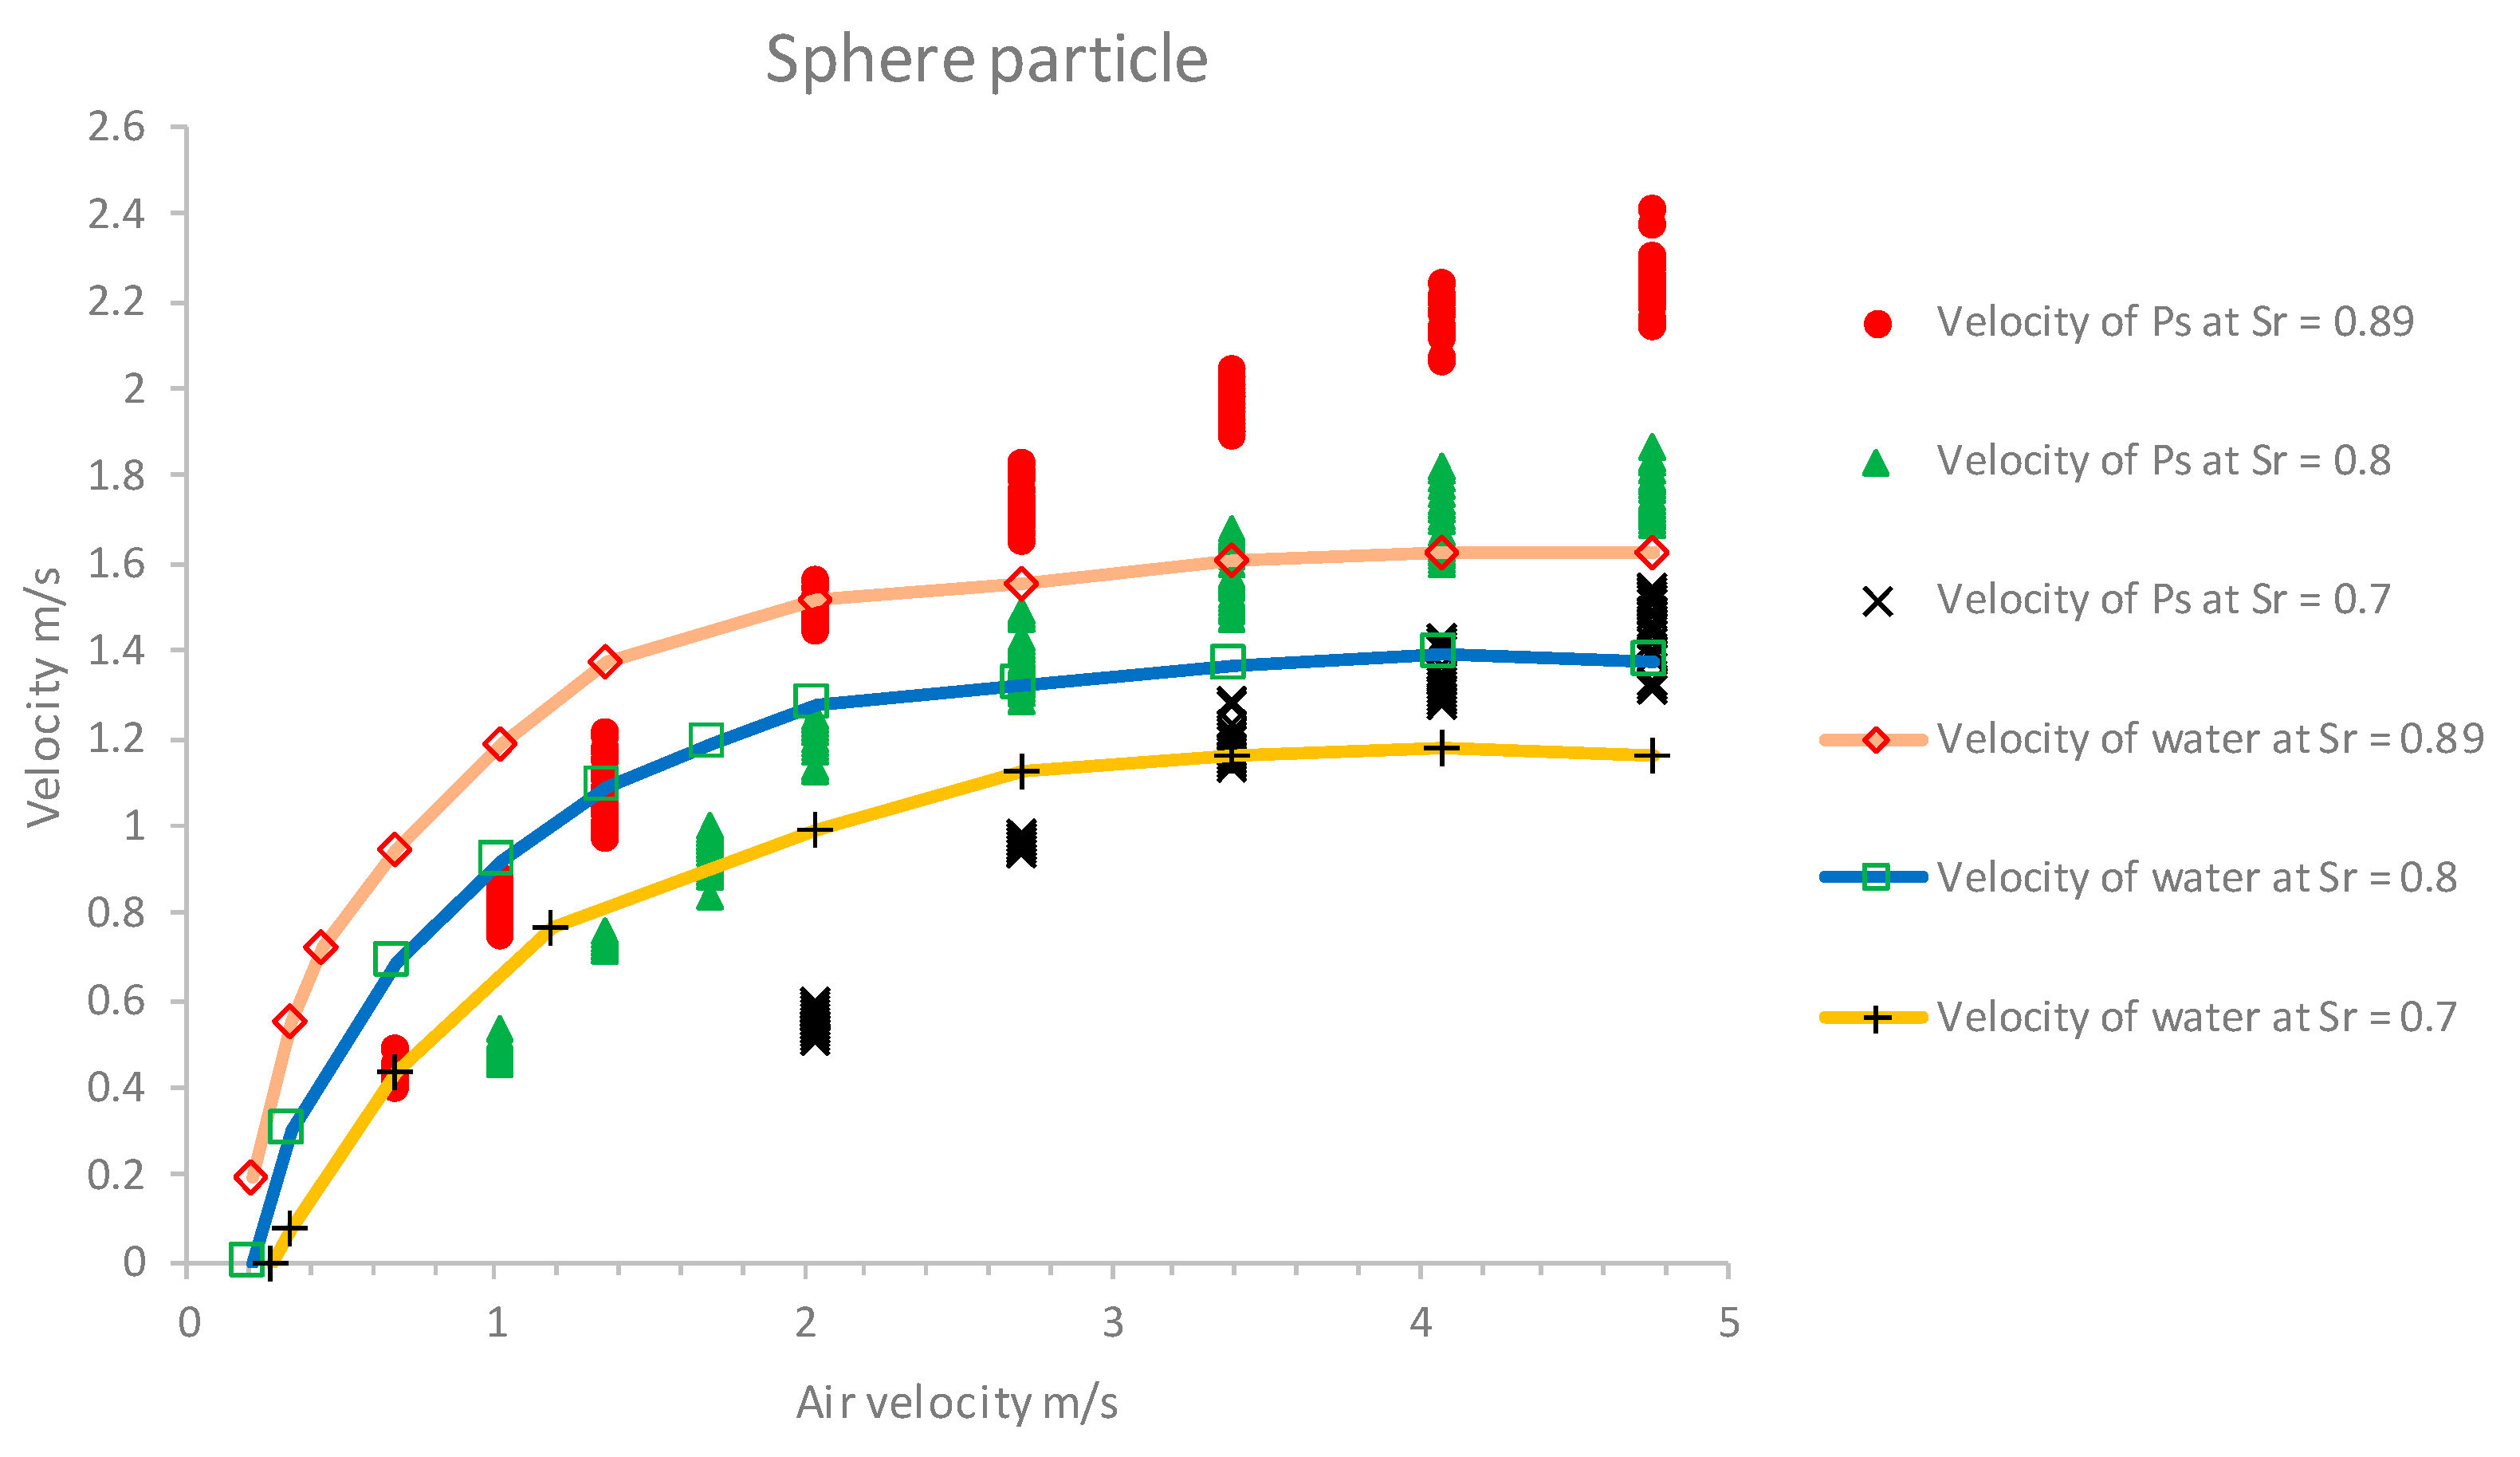
The results of practical experiments for spherical particle (Ps) with three submergences ratios (Sr) along with water velocity are presented in Figure 6. As can be seen from the three curves in Figure 6, the relation between solid particle velocity and submergence ratios has a similar trend for round glass particles. At a constant air rate, the vertical velocity of the solid transportation rises with an increase in the submergence ratio. The starting point of vertical pumping of the particle is found to be different for each submergence ratio, and it moves to the right of the horizontal coordinate as the submergence ratio decreases from 0.89 to 0.7. Regardless of submergence level, the PS particle always initiates movement whenever the velocity of water reaches around 1.4 m/s. It is quite clear that the maximum solid velocity does not belong to the time when we have the maximum velocity of displaced water.
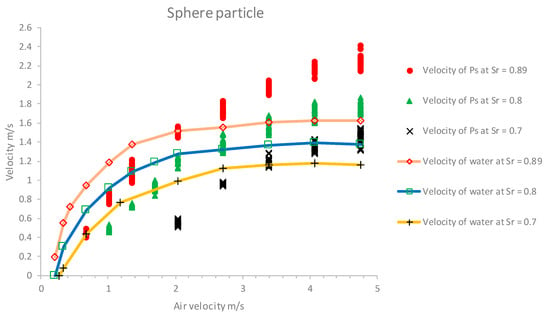
Figure 6.
Effect of the submergence ratio on the solid particle transportation.
At submergence ration equal to 0.7, in terms of particle velocity transfer, it can be inferred that in low incoming air velocity, 0.3–2.8 m/s, the most energy of compressed air is spent on vertical water pumping rather than on solid particles, which this role completely changes when the air velocity exceeds 2.8 m/s. Similar conditions are observed for the submergence ratios of 0.8 and 0.89 in Figure 6. The only difference is that at higher submergence ratios, the solid reaches considerable velocity, even with just a lower amount of compressed air. By increasing the submergence ratio from 0.7 to 0.89, while the amount of injected air is the same, the particle transfer velocity can be increased up to three times. These results emphasize that the solid particle can move upwards faster if the amount of incoming air or the submergence ratio is increased. In general, under certain air velocity conditions, it is necessary to have a suitable water height to achieve the highest particle transfer velocity with the least amount of compressed air.
3.4. Theoretical Background
Unfortunately, there is no information in the accessible scientific and technical literature related to one solid particle movement in a vertical multiphase flow. To validate our results, we used the existing empirical correlations together with theoretical equations related to multiphase flow. In airlifts that use the radial air injection method (air-jacket), the process of transporting one solid particle should be divided into two parts: (1) moving the particle in a liquid (suction pipe) and (2) the area after the injection of compressed air, where the solid phase moves with a mixture of air and water. To better distinguish these sections, index ‘i’ was defined as follows: i = 1, if the solid particle is ambient in the water (suction pipe); i = 2 if the particle stands in the air–water mixture (riser pipe).
Assuming that the density of solid and fluid particles is not the same, due to the action of gravity, the velocity of the particles in the carrier fluid is less than the velocity of the fluid [15]:
where VS is the velocity of solid phase (m/s), Vf is the average velocity of fluid phase (m/s), and VT is the terminal settling velocity of one solid particle falling in the center of the pipe with still water (m/s), determined by the following equation:
where vP is the volume of solid particle (m3), g is the free fall acceleration (m/s2), ρS and ρf are the densities (kg/m3) of solid and fluid phase, respectively. CD is drag coefficient of solid particle (-) and AC denotes the cross-section area of the particle in perpendicular to the direction of motion. In the literature, an ideal sphere is often assumed for calculating the volume and area of solid particles. Although the actual shapes of solids can be very different, there are several methods to estimate the geometry of non-spherical particles, such as equivalent volume diameter, angularity, and sphericity approaches; a detailed explanation of the procedure can be found in Reference [16].
It is worth noting that the density of the air–water mixture (ρ2) is strongly dependent on the ratio of each of the phases, which is known as the void fraction (α). It is highly unlikely that one correlation can estimate void fraction for the entire range of vertical flow regimes. For this aim, among the studies published in the literature, the equations proposed by Nicklin et al. [17] for range of slug flow [Equation (3)] and Hasan [18] for Churn flow [Equation (4)] are considered for vertical two-phase flow:
where, jg and jw are the superficial velocity of gas and water, respectively. D is the pipe diameter, ρG and ρw are the densities of gas and water, respectively. The density of the gas-phase at the level of gas-injection can be determined using the following relation as:
By ignoring the volume of one solid particle compared to the volume of air and water, the density of fluid in the raiser pipe can be determined according to the equation proposed by Fujimoto et al. [19] as:
in which αw denotes the volumetric fraction of water in the riser pipe. Assuming the motion of a particle and a fluid are in the same direction, the velocity of the solid for the individual phases, (i = 1, 2), derives from Equation (1):
where VS1 and VS2 (m/s) are the velocities of solid particle in water and air–water flow, respectively. Note that if the velocity of the particle falling into the fluid is greater than the velocity upward of the fluid, the result of the calculation will be a negative value. In this case, the solid velocity is considered zero. The average velocity of a solid particle in transporting an airlift pipe with a total length of h (see Figure 1) can be determined as:
where hs and hr (m) are the length of the suction and riser pipe, respectively. t1 denotes the time spent for transporting the particle from the entrance of the suction pipe to the height hs, t2 is the time needed for the particle to pass the riser pipe with a length of hr. Assuming the particle does not collide with the pipe wall, the following relationship is easily derived:
t1 = hs/Vs1 and t2 = hr/Vs2
By combining Equations (10) and (11), we can write:
By substituting Equations (2) and (7–9) in Equation (12), the final form can be written as follows:
3.5. Validity of Meagerd Data
Experimental data are now evaluating with the Equation (13). So far, different empirical equations have been proposed to estimate the drag coefficients of spherical and non-spherical isometric particles, and the final answer varies. A drag coefficient of the sphere particle was calculated from the equation provided by Ferguson and Church [20]. The obtained value was equal to 0.44. The drag coefficient, especially for non-spherical particles, can affect the accuracy of velocity evaluation. The lack of a comprehensive correlation and the variability of the experimental results led to inconsistent agreement among the researchers when calculating the drag coefficient for irregular-shaped particles. Based on the temperature and pressure of the test medium, the drag coefficients for particles PH and PC were determined experimentally. The settling time of the particles in the still water was measured 50 times in a tube with a diameter of 40 cm, and average drag coefficients are equal to 1.01 and 0.426, respectively.
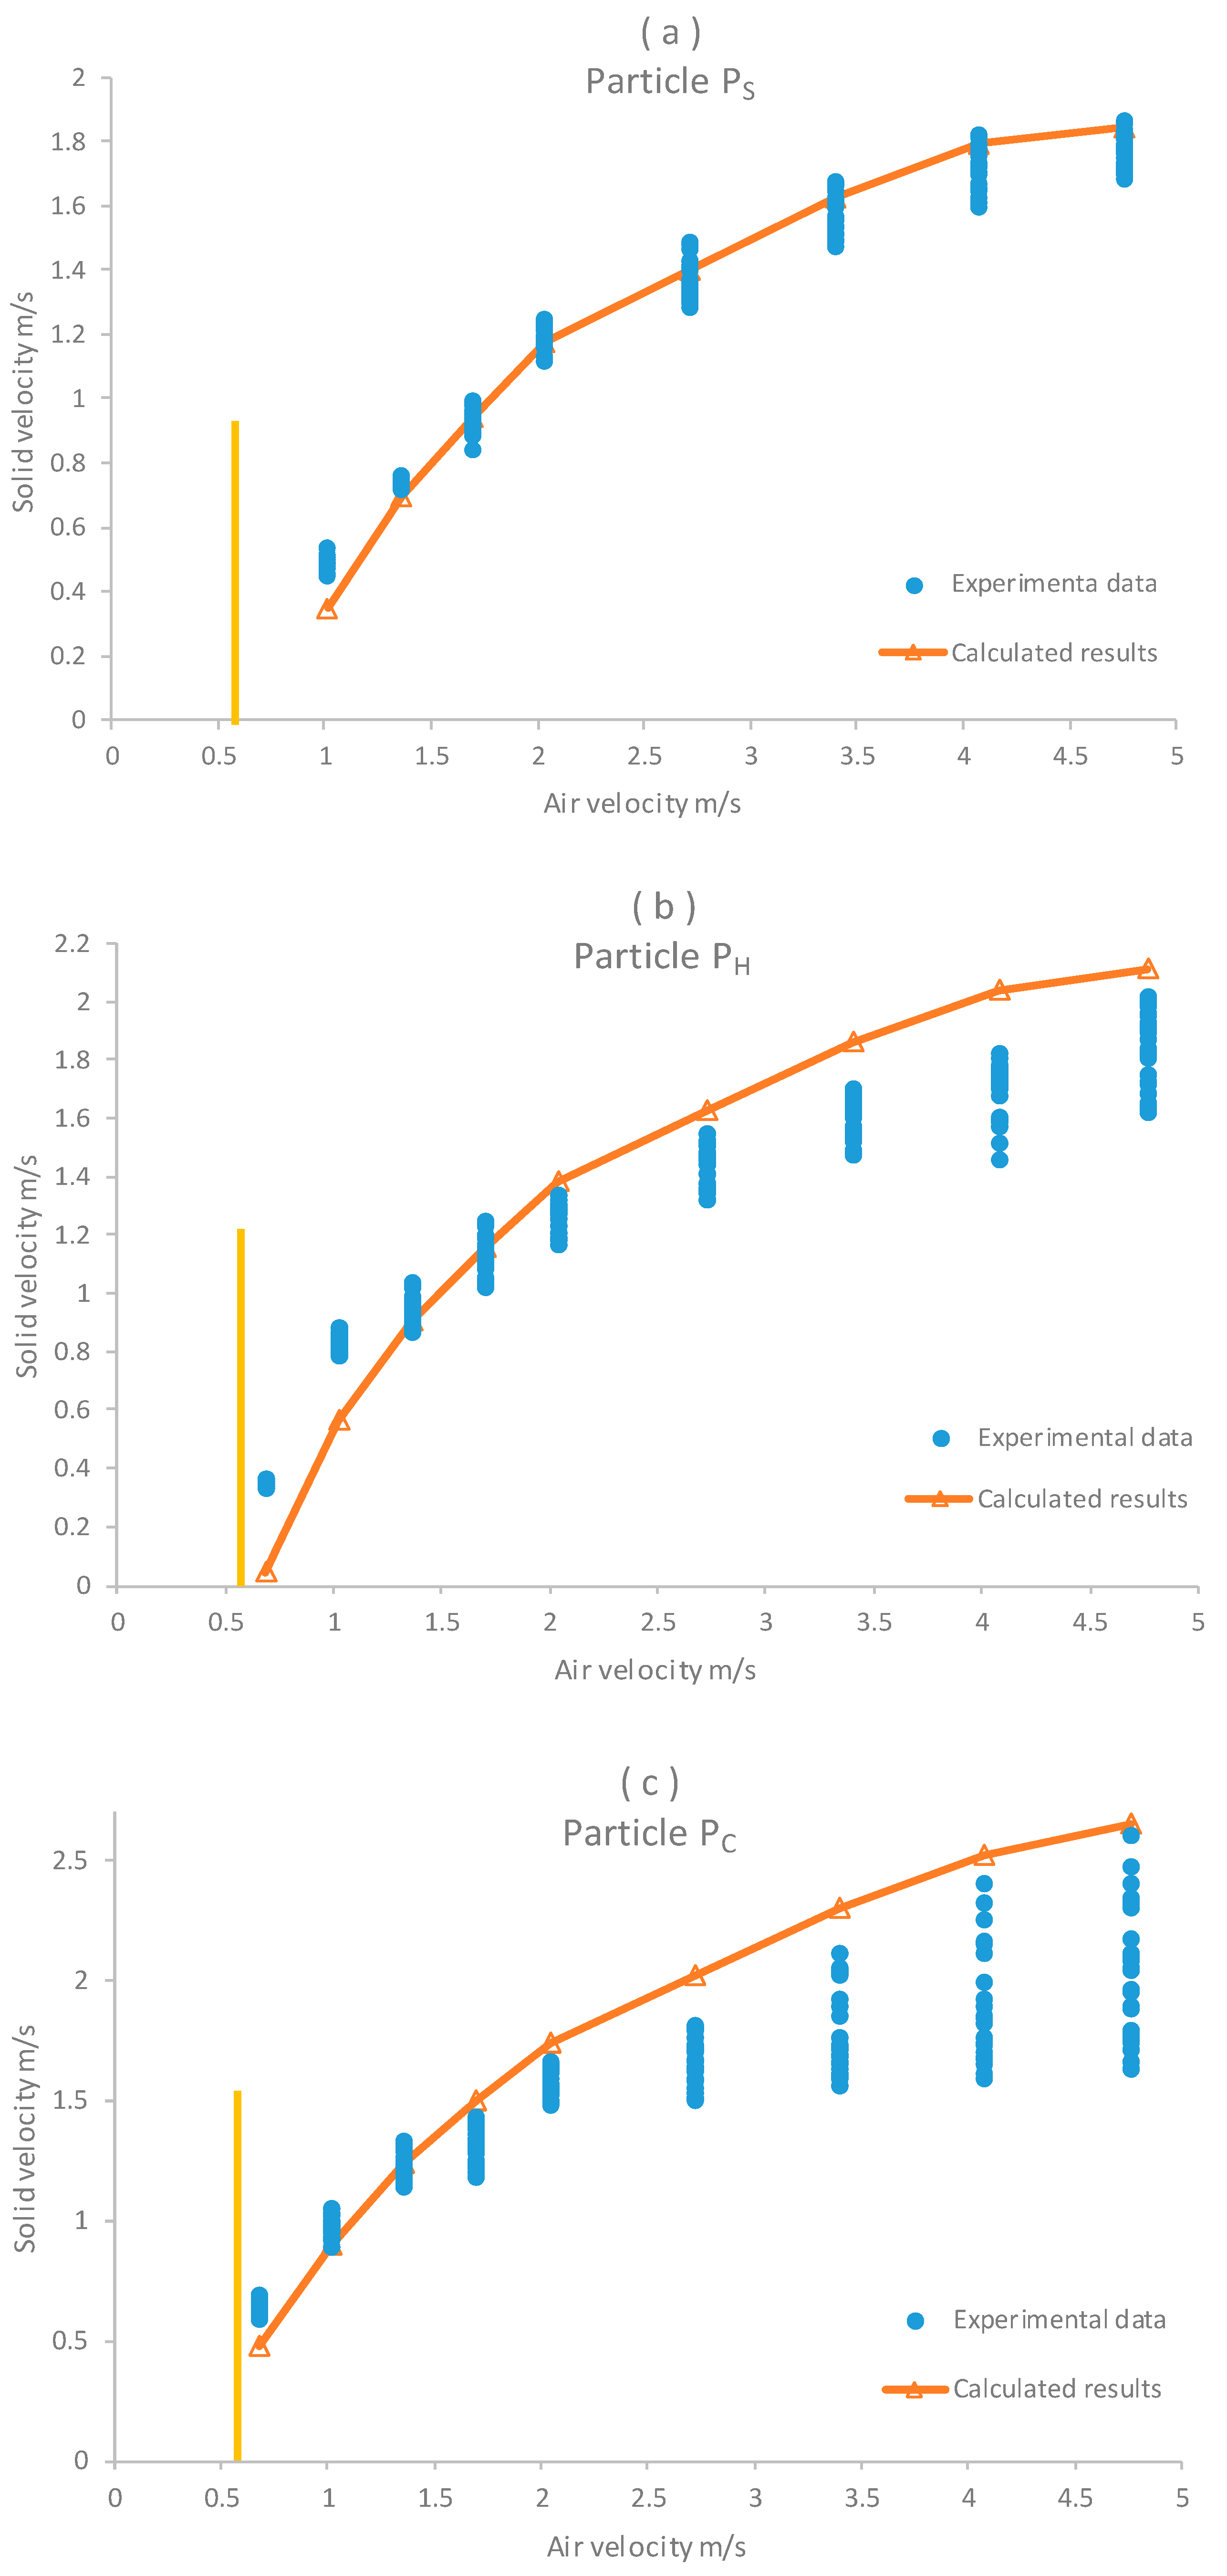
The values predicted by Equation (13), together with the experimental points for Sr equal to 0.8, are plotted in Figure 7a–c. The vertical bold line in Figure 7a–c indicate the point that the flow regime is transient from slug to churn flow. Many researchers have tried to offer the best and optimum working condition for an airlift that can be used for solid transportation. Deendarliantoa et al. [8] in a study on the transport of sand and coal with a maximum size of 0.8 mm concluded that the appropriate flow regime for pumping these particles is slug flow. The results of our study confirmed that when the slug flow is maintained in the airlift, the velocity of the water in the suction pipe is insufficient to suck even a particle in centimetres, let alone carry it to the end of the riser pipe. According to research by Pougatch and Salcudean [21], the transition in the type of flow can be delayed by breaking up large bubbles after they collide with solid particles. Therefore, the optimal flow regime is highly dependent on the operating conditions of this type of pump.
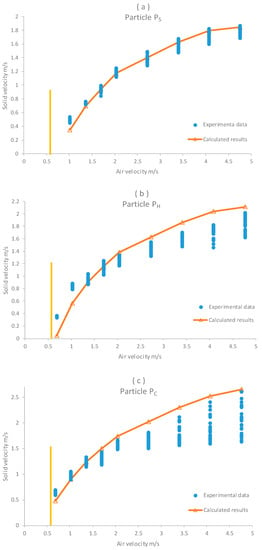
Figure 7.
(a–c) Comparisons of the particle velocity calculated by the present method with experimental data for Sr = 0.8.
Based on the data presented in Figure 7a, the computation result with Equation (13) had the same slope as the experimental data and was not too far off from the values for spherical particle (PS); hence, agreement between the experimental data and theoretical calculation is good, except in the early stage of churn flow, where trends in the calculating suggest a transporting velocity lower than is examined.
A lower velocity estimation was also observed for particles PH and PC. As is clear from the theory part, the density of the air–water mixture along with its velocity play an important role in estimating the vertical velocity of a particle. They can be well estimated when the ratio of air volume to water volume in the riser tube is correctly determined. The reason for small deviation between the predicted and average measured velocity for particles may be related to the accuracy of the equation, as developed by Hasan [18] to apprise the void fraction in the churn flow regime.
For particles PH and PC, the values calculated by the formula in the high air flow range often correspond to the maximum velocity obtained in practical experiments, which can be attributed to several factors. In vertical pumping, one particle moves in the center of the suction pipe, because this area has the highest vertical velocity compared to the surrounding, but in the lift tube, the velocity distribution does not always follow a same pattern so that with the onset of churn flow, the liquid phase is distributed axisymmetric around the perimeter of the tube, where the center of the pipe is occupied by a large gas core. We assumed that solid-free flow occurred without any collision with the pipe wall, but with the further development of churn flow due to increased air injection, this assumption is sometimes unrealistic, especially for large and irregular particles, which cause a deceleration. Moreover, the water flow in churn flow is not always upwards and sometimes moves in the opposite direction of main air flow [22]. Therefore, this may lead to irregular particle rotation and impair the estimation of the largest particle area during upward motion. Therefore, for irregularly shaped particles, it is highly recommended to use the average drag coefficient in the formula, which is obtained from the main faces of the particle.
The difference between theoretical and practical results can also be attributed to the indirect motion of the particle. In a study by Yoshinaga et al. [23], the zigzag motion of a particle was noted while it was moving upward in a mixture of air and water. Hence, the particle trajectories in the vertical plane may enhance the transportation time, which in turn diminishes the velocity of practical measurement.
4. Conclusions
In this study, we experimentally explored the vertical velocity of three different particles and compared the results to theoretical estimation, which confirmed a superior agreement with the measures for spherical particles. However, for irregularly shaped particles at high air injection velocity, it is necessary to consider the velocity drop owing to the particle colliding with the inner wall of the tube.
The interesting thing about the end stage of the churn flow regime is that the impact of the shape factor for spherical and half-spherical particles on the vertical transport velocity is almost negligible and both particles move at the same velocity.
As discussed in detail above, the velocity of the water pumped in the slug flow is incapable of lifting a particle a few centimeters in size, and the force is insufficient to transport it completely to the end of the riser pipe.
Since most researchers have investigated transportation particle by airlifts in slug flow, the outcomes of our study clarified that the assumption by previous researchers that the water phase carries solid particles in the annular regime is incorrect, because the velocity of all three types of particles exceeds more than the velocity of the transferred water and, therefore, air also participates in carrying the particle upwards.
From the performed tests, it appears that the particle has a maximum vertical velocity when the airlift works in the churn flow regime, especially in vicinity of the transition to the annular flow. Altogether, we recommend the correct choice between compressed air velocity and maximum submergence ratio with particles that have a higher drag coefficient so that the airlift pump performances in optimal economic conditions and particles transfer faster.
Supplementary Materials
The following supporting information can be downloaded at: https://www.mdpi.com/article/10.3390/fluids7030095/s1. Figure S1: The digital gray-scale image of a coal particle, which contains a large axis L1, medium axis L2, and small axis L3. The particle was tilted 90° with respect to the position in left, so that L2 is visible and L3 measurable. Figure S2: The lower part of the airlift pump. Figure S3: The location of the camera to record the moment of the particle is introduced into the suction pipe.
Author Contributions
Data curation, formal analysis, investigation, methodology, writing of the manuscript, P.E.; pump design, investigation, commentary, and revision, O.S.; funding acquisition, review and editing, C.D. All authors have read and agreed to the published version of the manuscript.
Funding
This work was supported by the European Research Council (Research Fund for Coal and Steel) under Grant Agreement number 800757.
Institutional Review Board Statement
Not applicable.
Informed Consent Statement
Not applicable.
Data Availability Statement
The data presented in this study are available on request from the corresponding author and also accessible after PhD defense via the central digital library of Technische Universität Bergakademie Freiberg.
Acknowledgments
Open Access Funding by the Publication Fund of the TU Bergakademie Freiberg.
Conflicts of Interest
The authors declare that they have no known competing financial interest or personal relationship that could have appeared to influence the work reported in this paper. The funders had no role in the design of the study; in the writing of the manuscript, or in the decision to publish the results.
References
- Catrawedarma, I.; Deendarlianto, A.; Indarto, I. The performance of airlift pump for the solid particles lifting during the transportation of gas-liquid-solid three-phase flow: A comprehensive research review. Proc. Inst. Mech. Eng. Part E J. Process Mech. Eng. 2020, 235, 606–628. [Google Scholar] [CrossRef]
- Kato, H.; Miyazawa, T.; Timaya, S.; Iwasaki, T. A study of an air-lift pump for solid particles. Bull. JSME 1975, 18, 286–294. [Google Scholar] [CrossRef] [Green Version]
- Kirichenko, E.A.; Kirichenko, V.E.; Evteev, V.V. Theory and Algorithms for Calculating the Slug Flow in the Airlift; NMU: Dnipro, Ukraine, 2013. (In Russian) [Google Scholar]
- Yoshinaga, T.; Sato, Y. Performance of an air-lift pump for conveying coarse particles. Int. J. Multiph. Flow 1996, 22, 223–238. [Google Scholar] [CrossRef]
- Fujimoto, H.; Kubo, M.; Hama, T.; Takuda, H. Transport phenomena of solid particles in pulsatile pipe flow. Adv. Mech. Eng. 2010, 2, 121326. [Google Scholar] [CrossRef] [Green Version]
- Berg, R.R. An Analytical and Experimental Investigation of Three-Phase Flow in Airlift Pumps Used for Diamondiferous Marine Gravel Reclamation. Ph.D. Thesis, University of Cape Town, Cape Town, South Africa, 1992. [Google Scholar]
- Erian, F.F.; Pease, L. Three phase upward flow in a vertical pipe. Int. J. Multiph. Flow 2007, 33, 498–509. [Google Scholar] [CrossRef]
- Deendarlianto, A.; Supraba, I.; Majid, A.I.; Pradecta, M.R.; Indarto, I.; Widyaparaga, A. Experimental investigation on the flow behaviour during the Solid particles lifting in a micro-bubble generator type airlift pump system. Case Stud. Therm. Eng. 2018, 13, 100386. [Google Scholar] [CrossRef]
- Enany, P.; Shevchenko, A.; Drebenstedt, C. Experimental evaluation of airlift performance for vertical pumping of water in underground mines. Mine Water Environ. 2021, 40, 970–979. [Google Scholar] [CrossRef] [PubMed]
- Ansari, A.; Sylvester, N.; Shoham, O.; Brill, J. A comprehensive mechanistic model for upward two-phase flow in wellbores. In Proceedings of the SPE Annual Technical Conference and Exhibition, New Orleans, Louisiana, 23–26 September 1990; Volume 9, pp. 143–151. [Google Scholar] [CrossRef] [Green Version]
- Miller, R.L.; Cain, B.M. Prediction of flow regime transitions in vertical upward three phase gas-liquid-solid flow. Chem. Eng. Commun. 1986, 43, 147–163. [Google Scholar] [CrossRef]
- Taitel, Y.; Bornea, D.; Dukler, A. Modelling flow pattern transitions for steady upward gas-liquid flow in vertical tubes. AIChE J. 1980, 26, 345–354. [Google Scholar] [CrossRef]
- Hu, D.; Tang, C.L.; Zhang, F.H. The effect of air injector on the performance of airlift. Adv. Mater. Res. 2012, 516–517, 1022–1027. [Google Scholar] [CrossRef]
- Margaris, D.P.; Papanikas, D.G. A generalized gas-liquid-solid three-phase flow analysis for airlift pump design. J. Fluids Eng. 1997, 119, 995–1002. [Google Scholar] [CrossRef]
- Wijk, J.M. Vertical Hydraulic Transport for Deep Sea Mining. Ph.D. Thesis, University of Delft, Delft, The Netherlands, 2016. [Google Scholar]
- King, P.R. Introduction to Practical Fluid Flow; Butterworth-Heinemann: Oxford, UK, 2002; pp. 55–75. ISBN 9780750648851. [Google Scholar]
- Nicklin, D.J.; Wilkes, J.C.; Davidson, J.F. Two-phase flow in vertical tubes. Trans. Inst. Chem. Eng. 1962, 40, 61–68. [Google Scholar]
- Hasan, A.R. void fraction in bubbly, slug and churn flow in vertical two-phase up-flow. Chem. Eng. Commun. 1998, 66, 101–111. [Google Scholar] [CrossRef]
- Fujimoto, H.; Ogawa, S.; Takuda, H.; Hatta, N. Operation Performance of a Small Air-Lift Pump for Conveying Solid Particles. J. Energy Resour. Technol.-Trans. Asme 2003, 125, 17–25. [Google Scholar] [CrossRef]
- Ferguson, R.I.; Church, M. A simple universal equation for grain settling velocity. J. Sediment. Res. 2004, 74, 933–937. [Google Scholar] [CrossRef]
- Pougatch, K.; Salcudean, M. Numerical modelling of deep sea air-lift. Ocean. Eng. 2008, 35, 1173–1182. [Google Scholar] [CrossRef]
- Pagan, E.; Williams, W.; Kam, S.; Waltrich, P. A simplified model for churn and annular flow regimes in small- and large-diameter pipes. Chem. Eng. Sci. 2017, 162, 309–321. [Google Scholar] [CrossRef]
- Yoshinaga, T.; Sato, Y.; Sadatomi, M.; Maeda, S.; Inagaki, K. Velocity of single coarse particle in two-phase gas-liquid flows in a vertical pipe. Jpn. J. Multiph. Flow 1989, 3, 131–144. (In Japanese) [Google Scholar] [CrossRef]
Publisher’s Note: MDPI stays neutral with regard to jurisdictional claims in published maps and institutional affiliations. |
© 2022 by the authors. Licensee MDPI, Basel, Switzerland. This article is an open access article distributed under the terms and conditions of the Creative Commons Attribution (CC BY) license (https://creativecommons.org/licenses/by/4.0/).

