Article

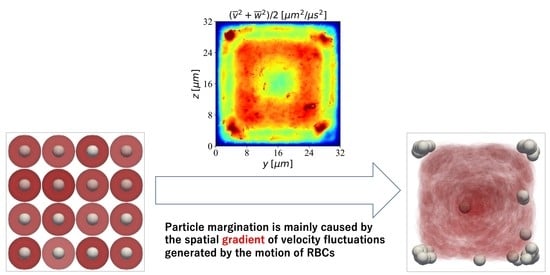
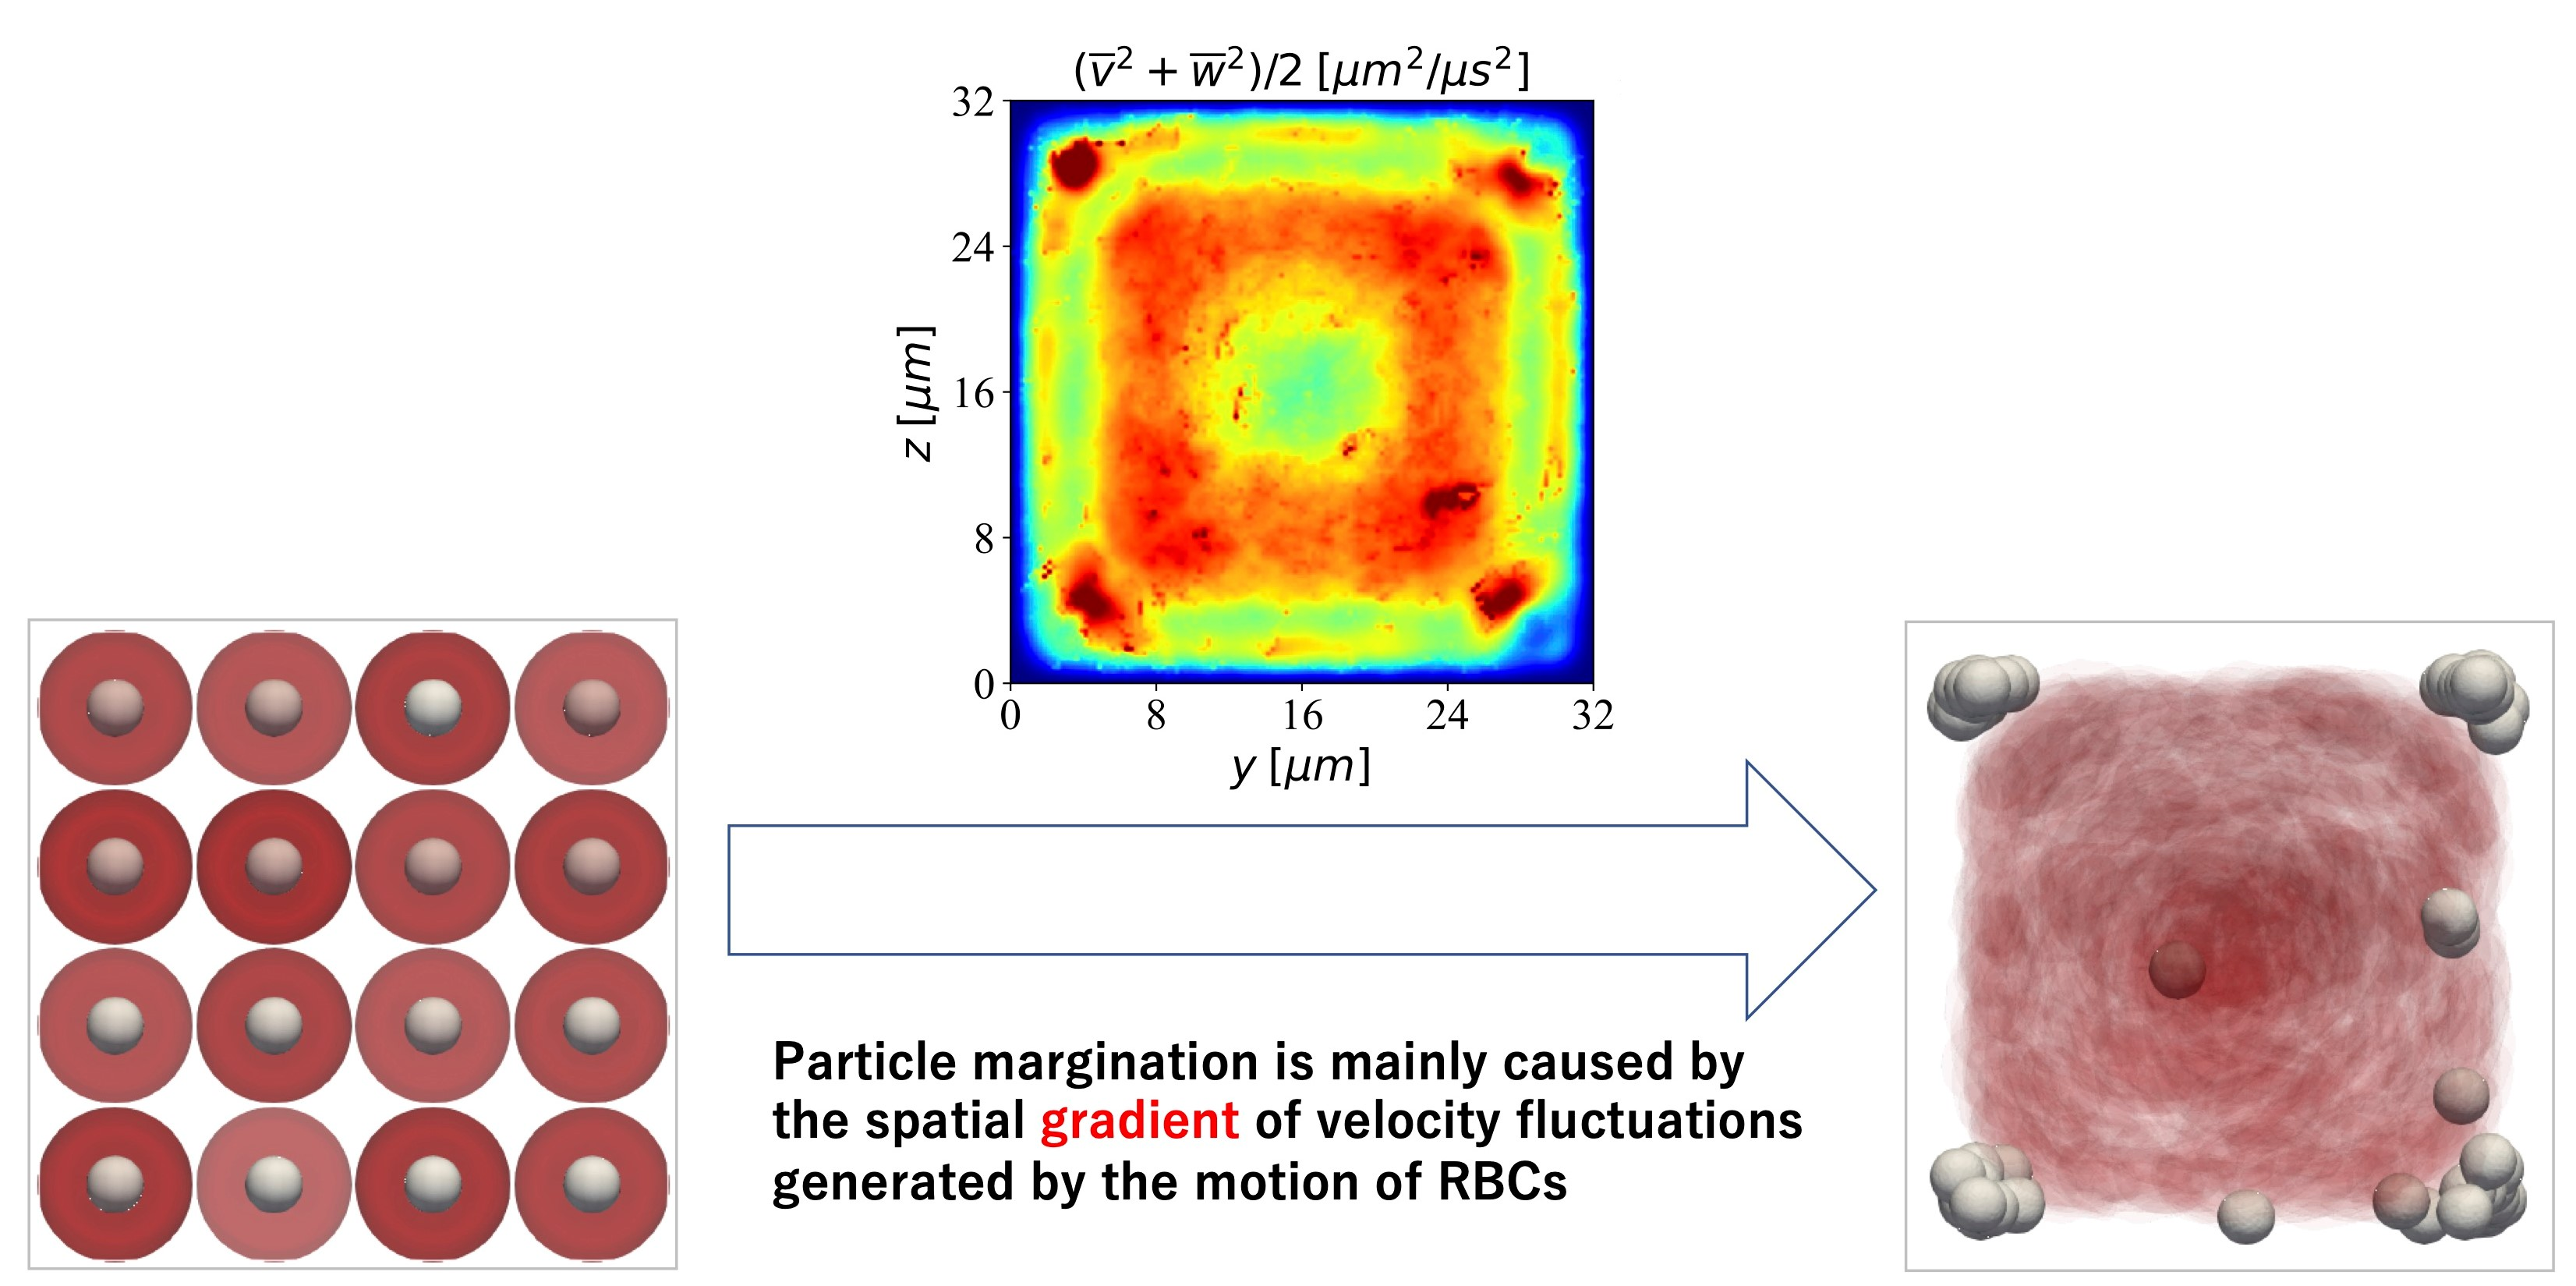
Numerical Study of Particle Margination in a Square Channel Flow with Red Blood Cells

1
Department of Mechanical Engineering, The University of Tokyo, 7-3-1 Hongo, Bunkyo-ku, Tokyo 113-8656, Japan
2
Graduate School of Systems Design, Tokyo Metropolitan University, 1-1 Minami-osawa, Hachioji-shi 192-0397, Japan
*
Author to whom correspondence should be addressed.
Fluids 2022, 7(3), 96; https://doi.org/10.3390/fluids7030096
Submission received: 29 November 2021 / Revised: 17 February 2022 / Accepted: 2 March 2022 / Published: 6 March 2022
(This article belongs to the Special Issue Computational Biofluiddynamics: Advances and Applications)

Abstract

:
Red blood cells flow near the axis in a small vessel, known as axial accumulation. This causes a region called the cell-free layer, which does not contain red blood cells near the wall. Then, small particles such as platelets come out to the cell-free layer. This phenomenon is called platelet margination. In this study, related to this phenomenon, direct numerical simulations were conducted using the immersed boundary method. The effects of the shear rate, channel size, and hematocrit value were investigated on the pressure-driven flow in a straight tube with a square cross-section. The simulation results indicated that the margination rate, which is the ratio of the distance traveled in the flow direction to the margination distance in the wall direction, is independent of the shear rate. The effect of the channel size on platelet margination was found to be well scaled by introducing a dimensionless parameter, which included the shear rate and effective area of the particle movement. It was also found that the margination rate varied nonlinearly with the tube hematocrit. This was due to the volume exclusion effect of red blood cells, which facilitated or hindered the motion of particles depending on the hematocrit. The relationship between the stable position of the particles near the corner and the width of the cell-free layer was also found. Furthermore, velocity fluctuations normalized by wall shear rate in a cross-section collapsed to one curve in the presented simulations. This indicates that the lateral force acting on the particles increases linearly with the shear rate.

Graphical Abstract

1. Introduction

Blood flow consists of approximately 55% plasma, 45% Red Blood Cells (RBCs), and less than 1% platelets or white blood cells. Plasma can be treated as a Newtonian flow, but the presence of the dispersed phase, especially red blood cells due to their high-volume concentration and easily deformable property, give blood flow non-Newtonian characteristics. One of the well-known characteristics of blood flow is the axial accumulation of RBCs in a small vessel. Unlike smooth spherical particles, deformable particles such as RBCs are pushed away from the wall due to hydrodynamic interaction [1], leading to a change of the apparent viscosity depending on the size of the vessel [2,3].
Radmacher et al. [4] measured the elastic modulus of platelets using atomic force microscopy and reported that it ranged from 1–50 kPa. In the case of spheroidal rigid particles [5] or platelets, which are much less deformable than RBCs, the lift force acting on platelets is much smaller in the shear flow, and the interaction between RBCs and platelets causes the lateral migration of platelets, resulting in a nonhomogeneous distribution of platelets. Platelets play an important role in hemostasis, and they are activated by direct contact with damaged vessel walls [6]. Therefore, a high platelet concentration near the vessel wall is important in that it increases the chance of platelets contacting the injured vessel [7,8].
Plenty of experimental and numerical studies have been reported about the near-wall excess of the platelet concentration. Tangelder et al. [9] conducted an in vivo experiment showing that the platelet concentration near the arteriovenous wall was higher than that in the central area using intravital microscopy. Subsequently, in vitro experiments were conducted to determine the dependence on rheological parameters such as the shear rate, hematocrit (Ht), and particle size. Tilles and Eckstein [10] examined the effects of Ht and the shear rate on platelet migration by platelet-sized particles and found that platelet migration only occurs when the volume concentration of red blood cells is greater than 7%. It has also been observed that platelet margination occurs when the shear rate is above 430 s 1 . Observations by the laser Doppler method [11] reported a similar trend to the previous results. They proposed the platelet transport theory based on convection–diffusion and calculated the platelet diffusivity from the power law function of hematocrit and the shear rate. Seki et al. [12] found that the lateral movement of platelet margination across the channel with Y-shaped bifurcated channels occurs in the Cell-Free Layer (CFL) region.
A number of numerical models and direct simulations have been conducted to elucidate the mechanism of platelet or platelet-sized particle margination. Eckstein and Belgacem [13] described the mathematical modeling of platelet transport as a combination of the diffusion and convection model, and a fundamental analogy was well reproduced by simple modeling. Almomani et al. [14] explored the interaction between RBCs and platelets by simulating the two particles as spherical particles. The results showed that the relative size of RBCs and platelets is one of the key factors that causes platelet margination. Crowl and Fogelson [15] performed a two-dimensional simulation using the lattice Boltzmann and immersed boundary method and calculated the lateral diffusion of platelets from their trajectories. They pointed out that the rate of diffusion was large in the core of the red blood cells and almost negligible in the area close to the wall. Mehrabadi et al. [16] simulated the flow of RBCs and platelets using the lattice-Boltzmann-spectrin-link (LB-SL) coupling method, drew a raw scaling for platelet margination in parallel plates, and reported that platelet diffusion is mainly enhanced by red blood cells. Several groups [17,18] have examined and reported the effects of erythrocyte size and deformability on platelet margination. Chang et al. [17] reported that when RBCs become less deformable due to diseases such as type 2 diabetes mellitus, there is less collision between red blood cells and platelets, resulting in less platelet margination. Similarly, Czara et al. [18] reported that the lesser deformability of RBCs leads to a decrease of the CFL, which in turn leads to a decrease of platelet margination.
Krüger [19] investigated the effect of tube diameter and capillary number on platelet margination and showed the reversibility of platelet trapping in the CFL, changing based on the capillary number 0.2 , resulting from the change of the motion of RBCs. There is also the aspect of the different deformability of the two types of capsules. Kumar and Graham [20] evaluated the effect of hydrodynamic forces and the collisions induced by the shear rate between particles of the same size, but with different deformability. Seki and Takinouchi [21] recently reported that in experiments using a 50 × 50 μm rectangular channel under Ht = 20% and H t = 40%, a non-uniform distribution of platelet-sized particles was observed. More particles were located near the corner of the channel, and this tendency was more pronounced at H t = 40%. Zhao et al. [22] reported that in a flow containing RBCs in a 10 × 15 μm rectangular channel, 3 μm beads were marginated to the corner of the wall. Coupling continuum mechanical simulation with the bio-chemical reaction of platelet has been reported. Ii et al. [23] presented the full Eulerian coupling method between the blood flow and hyperelastic capsule solving both the governing equation for the FSI problem and the stochastic differential equation for cell adhesion. In this present study, such a chemical reaction was not considered for the numerical simulation. For several years, platelet margination in pure shear flow [16,24] has been examined comprehensively. However, since blood vessels have a closed shape such as circular or rectangular, a detailed study of the motion of particles with RBCs in such a shape is necessary for practical purposes. As discussed by Seki and Takinouchi [21], understanding the migration behavior of particles in a square channel can be applicable, for example to cell sorting using microfluidic channels. They reported that in a square channel, more particles were located near the corner of the channel. In a circular tube [25], on the other hand, the particles are located along the circular walls, which shows the essential difference of their characteristics. Due to this difference, for example, in a flow with bifurcation, the particle distribution and margination behavior are different between circular and square channels. Unlike circular channels, few studies have been reported on platelet margination in a square channel.
In the present study, numerical simulations using the immersed boundary method were performed to reproduce the 3D hydrodynamic interaction between red blood cells and platelet-sized particles. The main objective of this study was to understand the effect of several parameters that affect the margination of particles in a square channel flow. Since most of the previous studies were based on pure shear flow, the present study focused on pressure-driven straight square channel flow with various shear rates, channel sizes, and hematocrit levels. The relationship between the hematocrit and the stable position of particles is also discussed.

2. Numerical Methods

In this section, we describe the numerical method employed in this study. Blood plasma was treated as a Newtonian fluid, and so can the fluid inside blood cells. The immersed boundary method [26] was used to solve the fluid–membrane interaction problem. RBCs and particles were modeled as vesicles having hyperelastic membranes.

2.1. Governing Equations for Fluid–Membrane Interaction Problems

The continuity and momentum equations of incompressible flow with the membrane force are given by:
· u = 0 ,
ρ u t + u · u = p + · η u + u T + f
where ρ is the constant density, η is the viscosity, p is the pressure, u is the velocity vectors, and f is the membrane force vectors applied from the elastic stress of the cell with the Immersed Boundary Method (IBM) [26]. The difference of the viscosity between the inside and the outside of the cells was treated in the same way as Tryggvason’s front-tracking method [27]. Let us denote by ϕ ( x , t ) a smoothed phase indicator function, and it assigns the fluid domain as 0, the inside domain as 1, and ( 0 , 1 ) for the transition layer. Then, the viscosity is calculated from:
η = ϕ η i + 1 ϕ η f
where η i and η f are the viscosities of the inside capsule domain and fluid. Note that we did not consider the nonlinear convection term ( u · ) u from (2). Since the Reynolds number ( R e ) was quite low ( R e < 1 ) in our simulation, the inertia effect was negligible.
RBC membranes are characterized by two major elastic contributions: in-plane shear and bending resistance. In this study, we adopted the Skalak model [28] as the in-plane stress T s of red blood cells:
T s = G s J s tr B s 1 B s + J s 2 C J s 2 1 1 P
where G s is the shear modulus, C is the area dilation modulus, B s is surface left Cauchy–Green tensor, J s is the surface Jacobian, the second invariant of B s , and P = I nn is the surface projection tensor. We employed the Pozrikidis model [29] for the bending modulus T b ,
T b = qn ,
q = s · m · P ,
m = E b ( κ κ 0 P )
where E b is the bending modulus and κ 0 is the spontaneous curvature. In this study, we employed the infinitesimal strain assumption, namely κ = κ P , where κ = s · n is the curvature. The static local equilibrium equation of the membrane is written as:
s · T s + T b + F = 0
The Finite-Element Method (FEM) [30] was used to solve (8) and obtain the elastic force vector F acting on the Lagrangian points of the membrane. The membrane force f from the exerted force on the Lagrangian points X  Γ is given by:
f x = X Γ D h ( 3 ) x X F X
where D h ( 3 ) ( x ) is the three-dimensional approximate Dirac delta function,
D h ( 3 ) x = 1 h 3 δ h x h δ h y h δ h z h
where h is the computational mesh size and δ h ( s ) is the continuous function,
δ h ( s ) = 1 8 3 + 2 | s | + 1 + 4 | s | 4 | s | 2 , for 0 | s | < 1 , 1 8 5 2 | s | + 7 + 12 | s | 4 | s | 2 , for 1 | s | < 2 , 0 , for 2 | s |
The location of Lagrangian points X was updated following the IBM,
d X d t = x Ω D h ( 3 ) x X u x

2.2. Discretization

The Simplified-Marker-And-Cell method (SMAC method) [31] was used to couple the velocity and pressure. In the prediction phase, the tentative velocity u p was updated by:
u p u n Δ t + p n ρ 1 ρ · η n u p + u p T + f n ρ = 0
where the superscript n represents a discrete time step and Δ t is a discrete time interval. The pressure term was decided to satisfy the continuity equation of n + 1 step, described as:
· u n + 1 = · u p Δ t ϕ = 0
where ϕ is the scalar potential. Equation (14) could be transformed in to a Poisson equation of ϕ :
2 ϕ = 1 Δ t · u p
Therefore, the pressure was determined by p n + 1 = p n + ρ ϕ , and in the projection phase, the velocity was updated as:
u n + 1 = u p Δ t ϕ
Note that the second-order central difference method was employed for the spatial discretization in (1) and (2), and a staggered grid was used for the numerical calculation. For a more detailed description and a numerical validation, see [32].

2.3. Simulation Conditions

Cellular flows consisting of plasma, RBCs, and platelets with hematocrit ( H t ) ranging from 0 % to 40 % were numerically solved in this study. The computational domain was a square channel that was periodic in the x-direction and wall-bounded in the y- and z-directions. The pressure-driven body force was exerted in the flow direction x. The height H and width W of the channel domain were the same, but the specific values were different depending on the simulation case. The length of the domain L was chosen to 7-times longer than the lateral direction. The shape of the undeformed RBC was biconcave with a diameter of 7.92 μm. The viscosity of the inner RBC was set to 5-times higher than that of the plasma, and this is similar to the physiological condition. The shear modulus and area dilation modulus of the RBC were G s = 5.0 μN/m and C = 50 , respectively. These values are almost identical to those of Takeishi’s numerical experiments [33], which successfully reproduced the deformation of red blood cells in shear flow. The bending modulus E b = 1.8 × 10 19 N·m was also considered. Note that all the mechanical properties of the RBC were obtained experimentally [34,35,36], except for C; the area dilation modulus C was adopted as a reasonable value to prevent the surface area of the RBC from changing. The particle was modeled as sphere-shaped with a diameter of 2.9 μm. To reproduce the less deformable property of platelets, the membrane shear elasticity and area dilation modulus of the particle were considered 10-times higher than those of the RBC. It is known that the volume fraction of platelets is 0.1–0.2% under physiological condition [37]. In the present simulation, the volume fraction of platelets was set to 0.5 % in order to have enough samples for statistical analysis. In the initial state, RBCs and particles were regularly arranged with little random variation. Here, we adopted time step size Δ t = 2.5 (μs) and mesh size Δ x = D / 32 , where D is the diameter of the RBC. See Appendix A for the effect of the grid size on platelet margination.

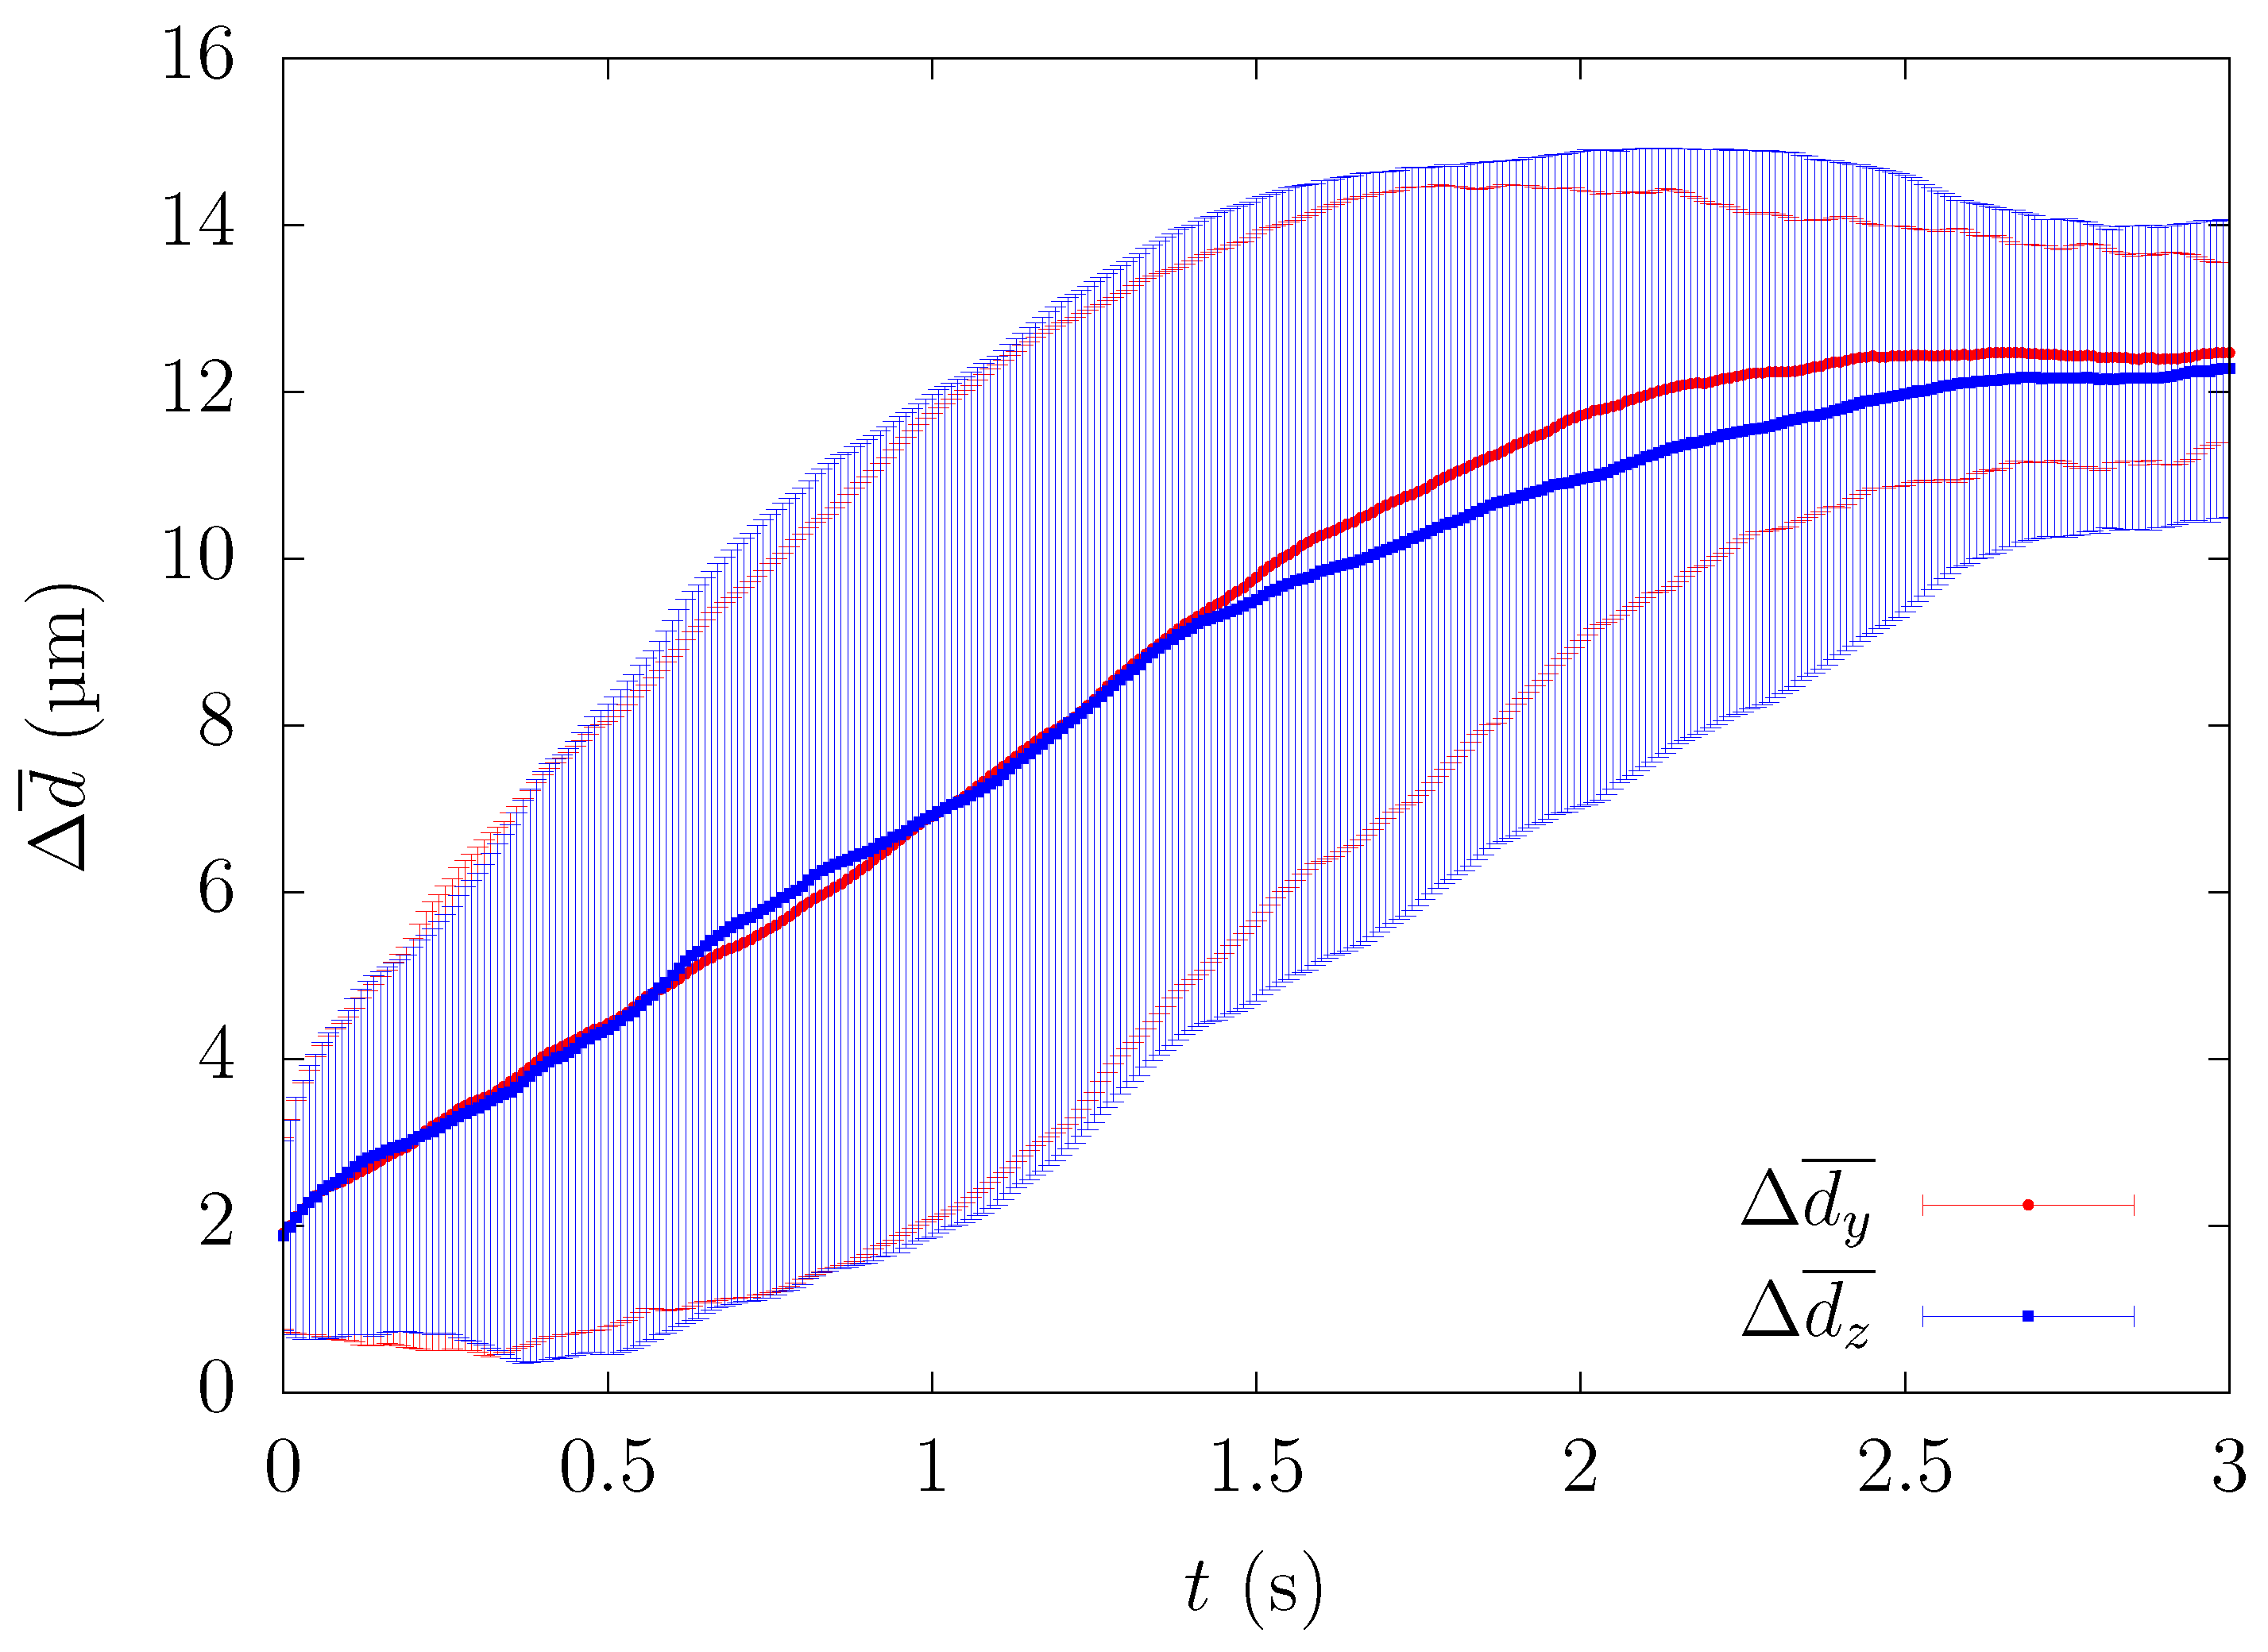
2.4. Evaluation of Particle Migration toward the Near-Wall Region

It is known that platelet or platelet-sized particles move toward the near-wall region with the hematocrit level over 7 % in blood flow [10]. In the current simulation, the initial shape of RBCs was modeled as biconcave. It took time to fully develop and move toward the center to produce the cell-free layer. Figure 1 illustrates how we analyzed the simulation results.
In order to minimize the influence of the initial configuration, we quantified the time history of particle motion and evaluated the change of the ensemble-averaged distance between the particle and the centerline of the computational domain. All particles that passed through a square region of width H / 4 and height H / 4 near the center were counted as samples for the ensemble average. Since platelets eventually migrate near the corners, the path of platelets from the central region to the channel wall can be investigated by calculating the trajectory of platelets passing through the center of the rectangular channel in each lateral direction. One example of comparing the time history of the path of platelets in each wall direction is shown in Figure 2.

3. Results

Several studies have been reported on how parameters such as the shear rate and channel size affect the platelet margination in parallel plates [16,22] or circular tubes [25]. As we mentioned in the Introduction, Zhao et al. [22] reported that 3 μm spherical beads exhibit a high concentration at the corner of a rectangular channel of 10 × 15 μm 2 in cross-section in RBC flow. In the present study, we investigated how parameters such as the shear rate, channel width, and hematocrit value affected the temporal evolution of particle migration in a square channel.

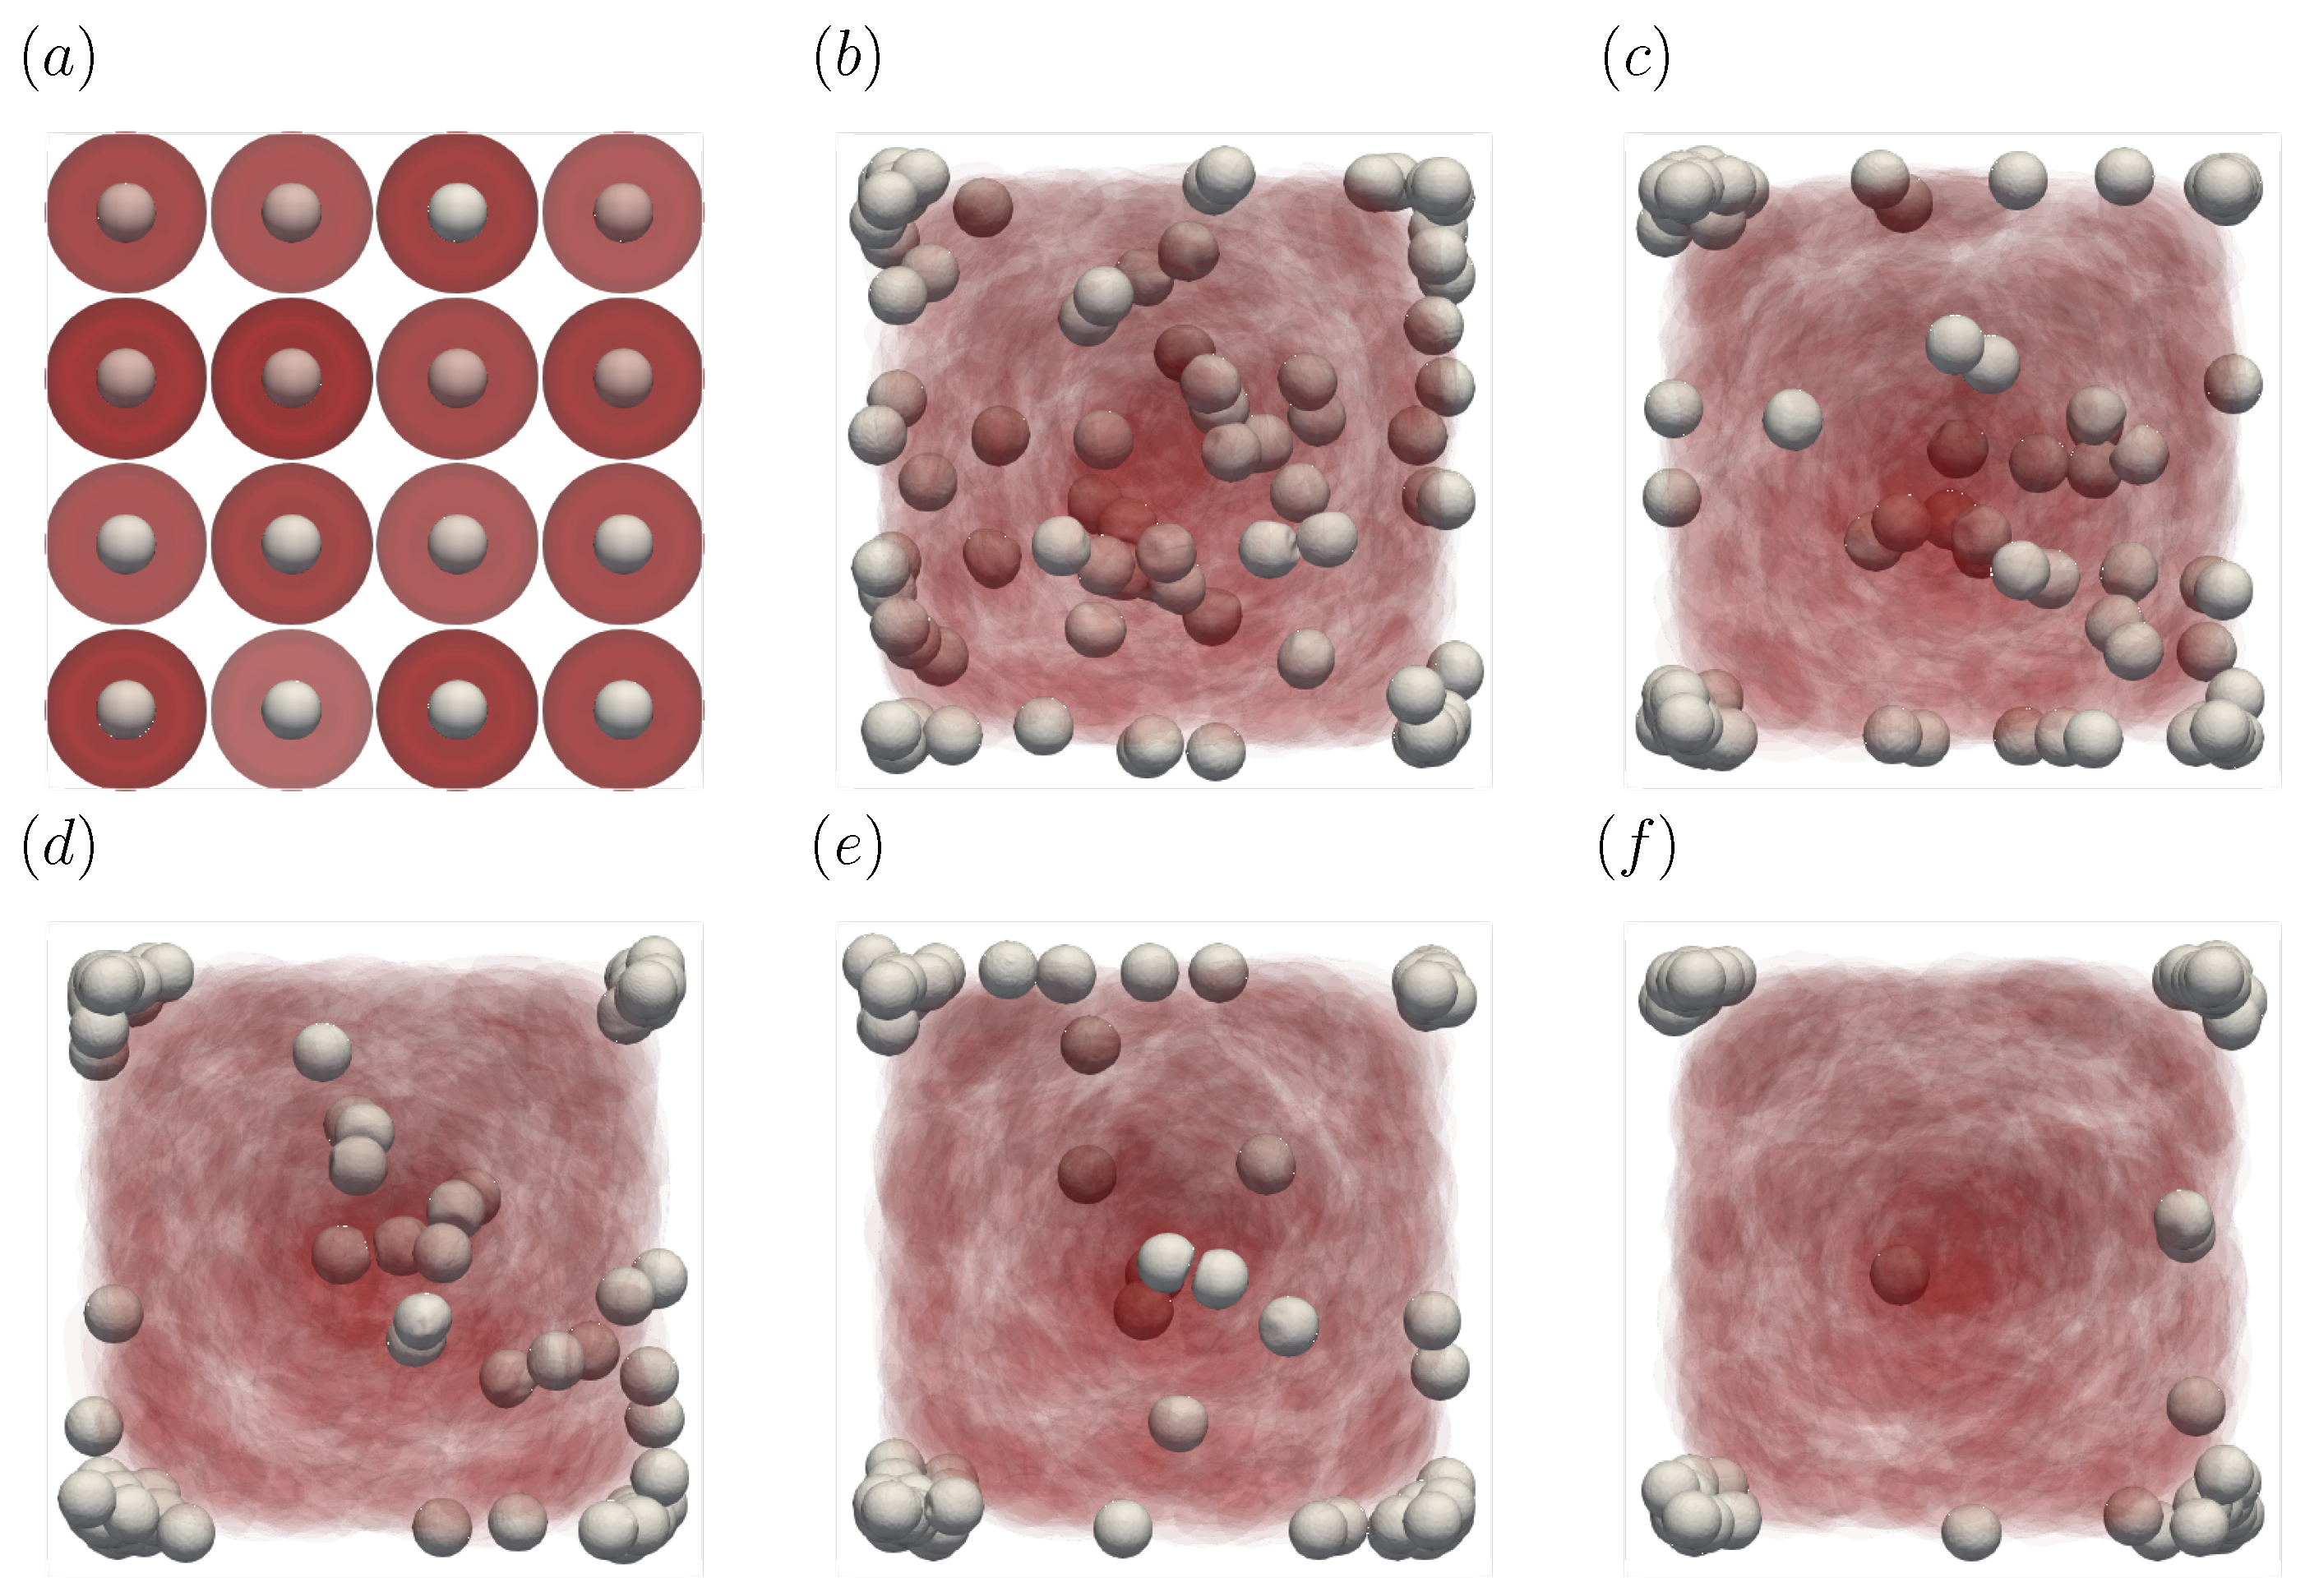
3.1. Direction Dependency of Particle Migration

Figure 2 shows the time history of the ensemble-averaged distance Δ d ¯ ( t ) between a particle and the centerline of the straight channel for H t = 20 % , γ w ˙ = 972 s 1 and L = 224 μm, H = 32 μm, along with the error bars indicating the standard deviation. Δ d y ¯ ( t ) and Δ d z ¯ ( t ) represent the ensemble-averaged distances in the height and width direction, respectively. For example, if particles are entering the central square region of width H/4 and height H/4 and their y-position at time t is d y ( t ) , the ensemble-averaged distances are described by the following equation,
Δ d y ¯ ( t ) = d y ¯ ( t ) H / 2
Although each case showed a large standard deviation, the time history of ensemble-averaged distances showed a similar pattern, suggesting that the overall path for how the particles migrate in the square duct was almost identical for each lateral direction. Hereafter, Δ d ¯ ( t ) was calculated from Δ d ¯ ( t ) = Δ d y ¯ ( t ) + Δ d z ¯ ( t ) / 2 . Since Figure 2 shows that the average path of platelets migrating in both wall directions was almost equal, we present the results such as the particle or RBC concentration profiles in one direction(y) to discuss the physical phenomenon from now on.
Figure 3 shows the snapshots of the present simulation results. In order to focus on the lateral movement of platelets and RBCs, the results of the 3D simulation were visualized by projecting them onto the yz plane (two-dimensional) using the volume fraction information of RBCs and platelets on a fixed grid. Therefore, the shape of the red circle at t = 0 corresponds to RBCs and the shape of the white sphere corresponds to platelets. The simulation conditions corresponded to RBCs and particles in a square channel flow under the conditions of H t = 20 % , γ w ˙ = 972 s 1 at different times of t = 0 , 0.5 s, 1.0 s, 1.5 s, 2.0 s, and 3.0 s. The red cloud near the center after t = 0.5 s corresponds to the RBCs. The intensity of the color means the probability of the presence of RBCs or platelets. RBCs gradually move toward the center from the initial position and generate the cell-free layer. All the particles move to the corner with a stochastic fluctuation. Figure 4 shows the change in the particle concentration profile, and each graph corresponds to the result of Figure 3. As we can confirm from Figure 4b–e, many particles did not move directly to the corner, rather migrating toward the wall first, then approached the corner while moving along the wall. After 3 s, most of the particles migrated to the corner while moving 11 mm on average in the flow direction, equivalent to about 340-times the channel width H. Figure 5 shows the change in RBCs’ concentration profile. The axial accumulation of RBCs occurred within 0.1 s, a much faster time-scale than platelet margination.

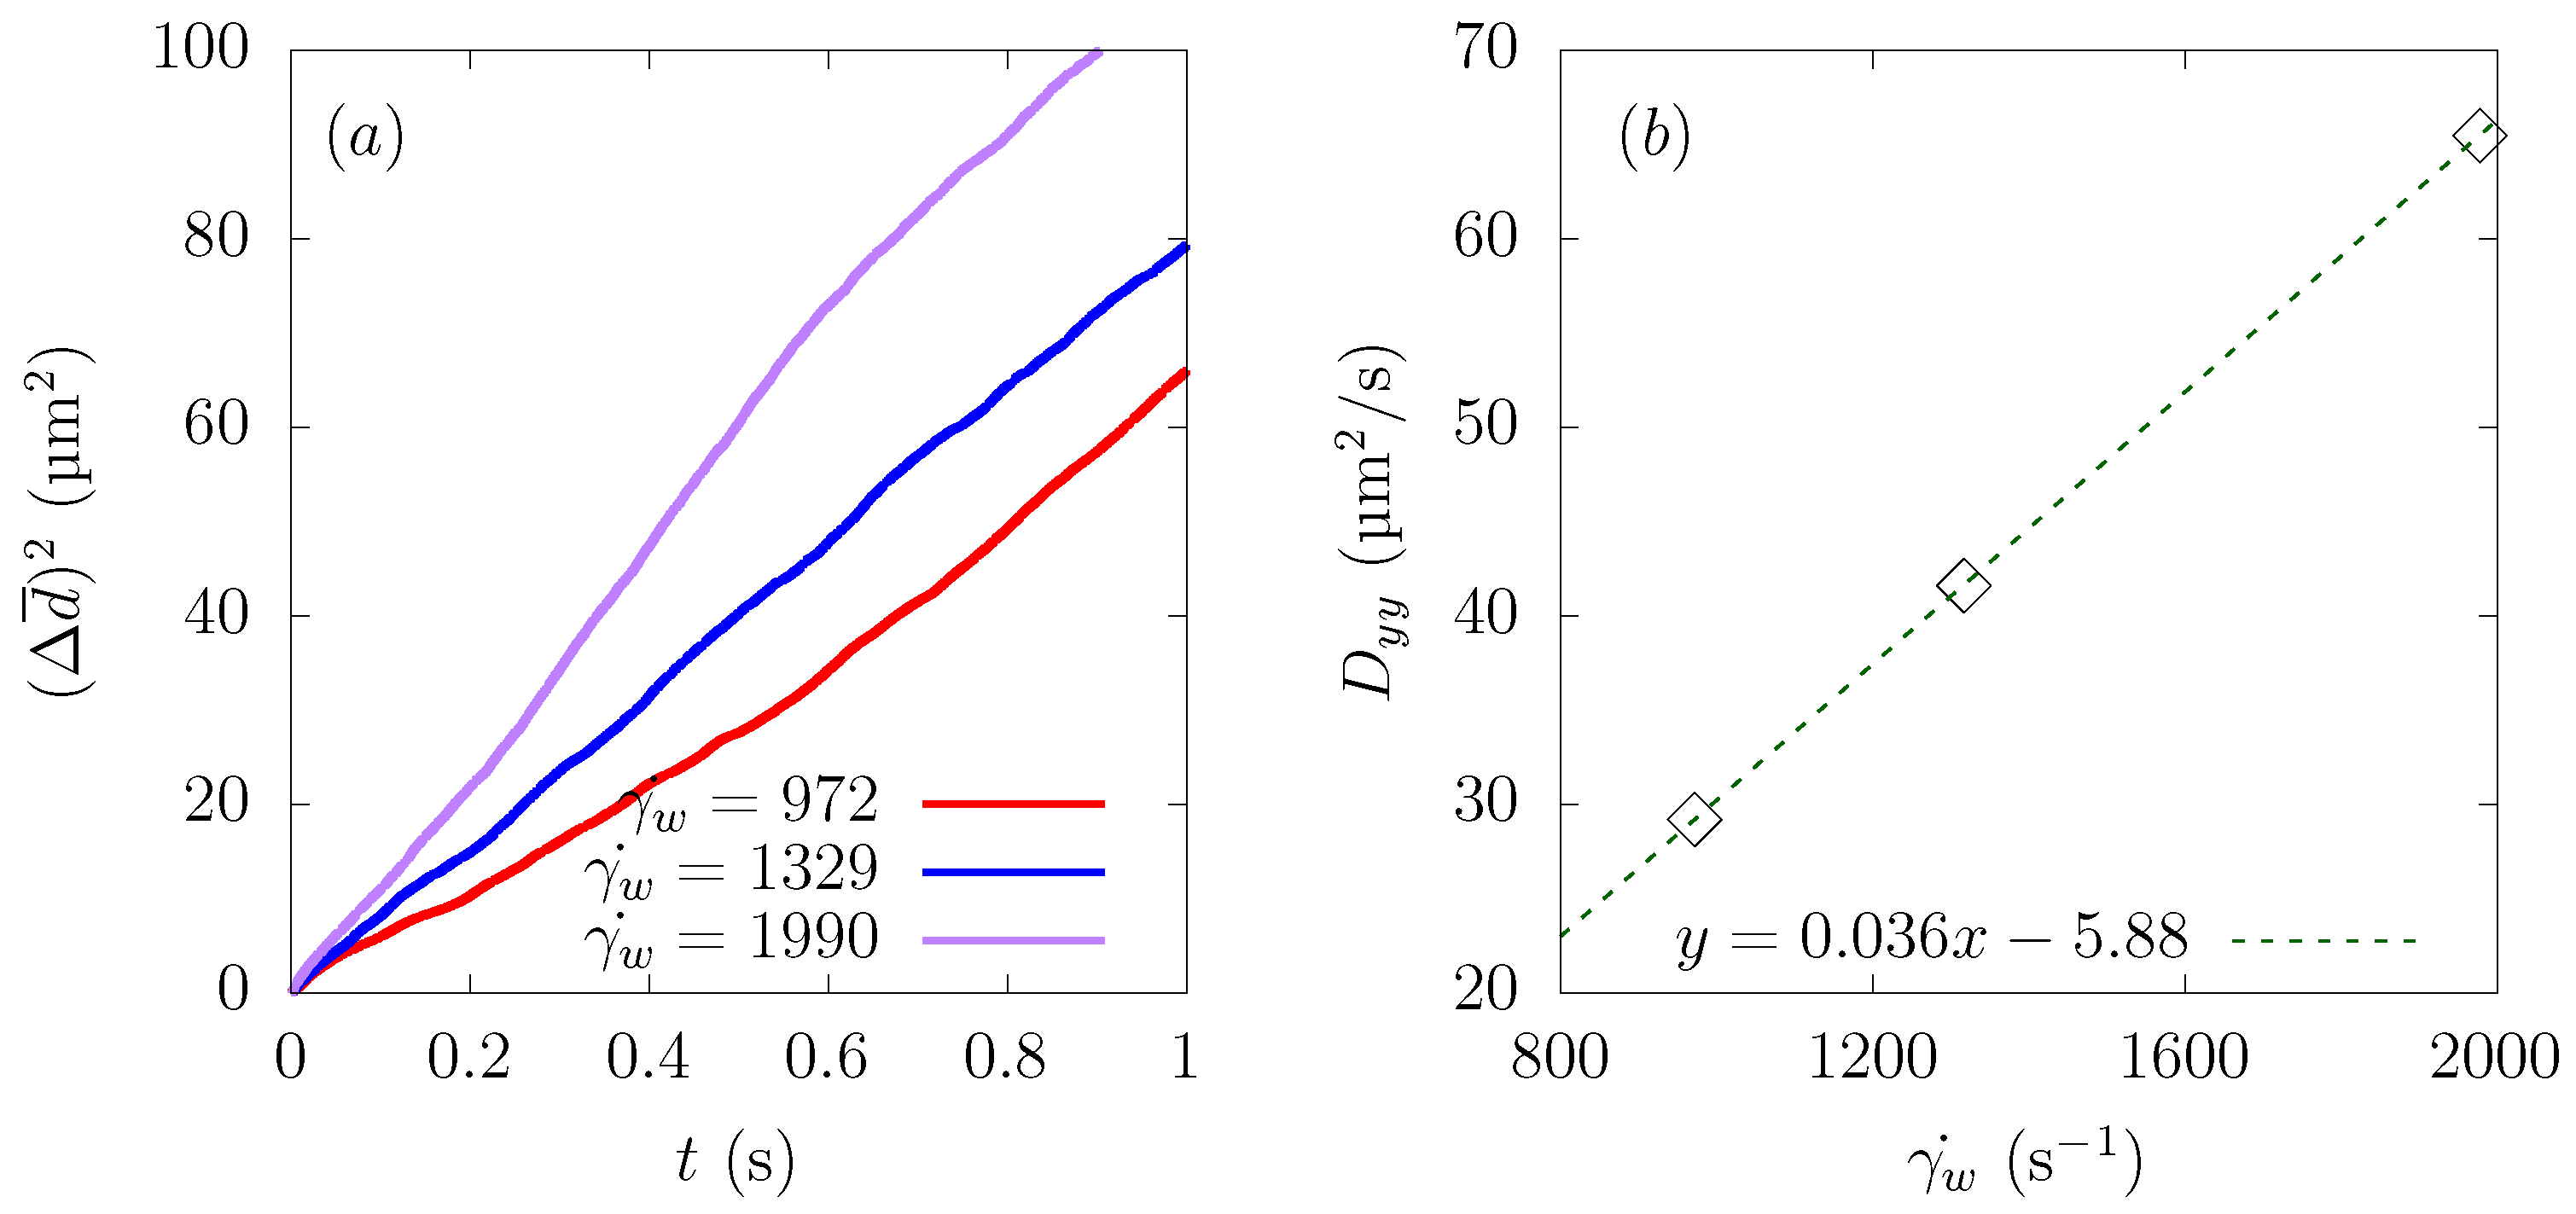
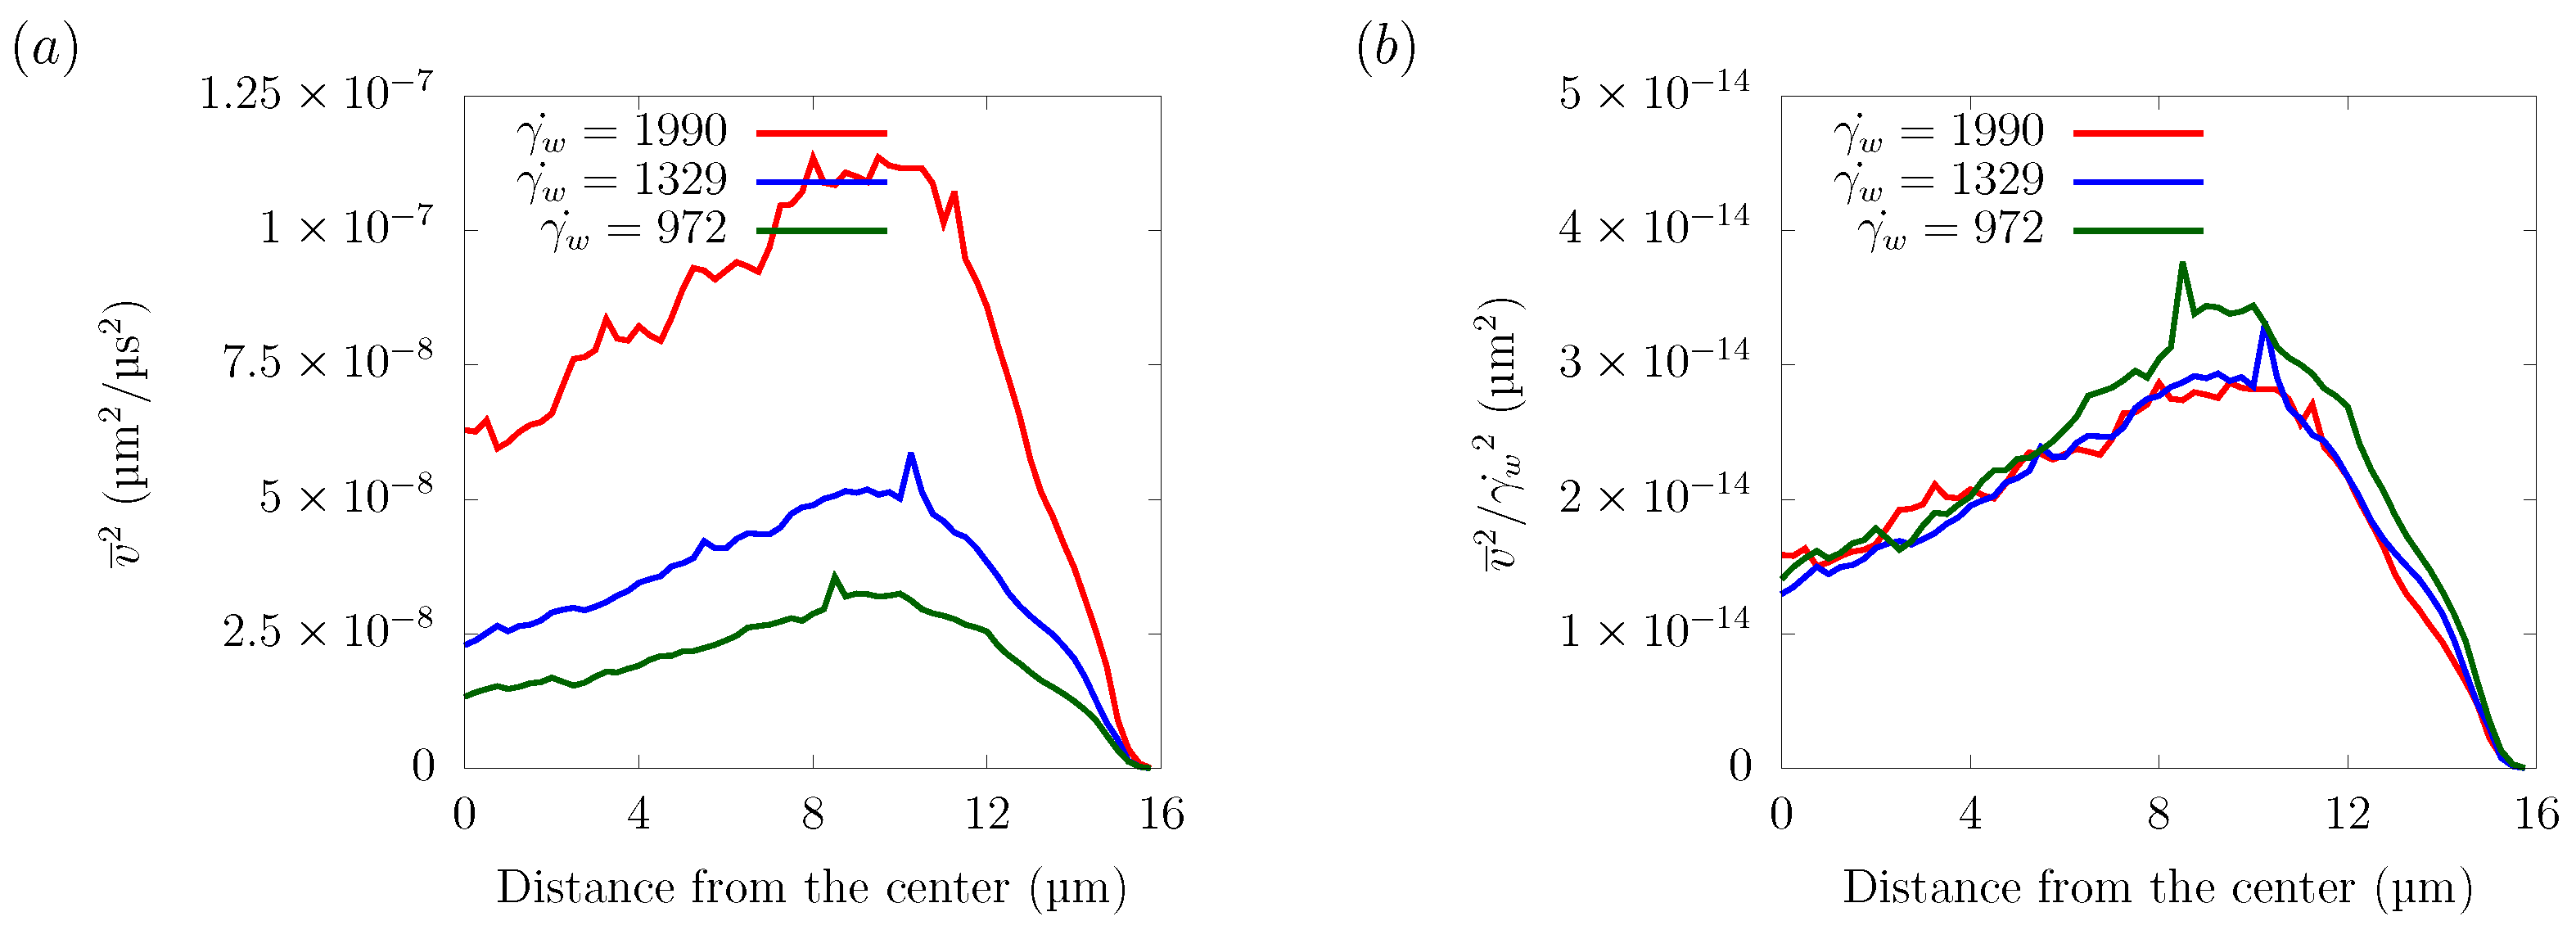
3.2. Shear Rate Dependency

We investigated the effect of the shear rate on particle margination. The computational domain was set to L = 224 μm, H = 32 μm, and hematocrit H t = 20 % . For a square duct, the average wall shear rate γ w ˙ was calculated from the following equation,
γ w ˙ = U λ 2 H
where U is the average velocity and λ is the shape factor, known as λ = 14.3 for a square channel of N e w t o n i a n fluid [38]. The simulation conditions are listed in Table 1. Note that the average velocity U was calculated from the simulation results. The Reynolds number R e and capillary number C a were calculated from R e = ρ U H / η and C a = η γ w ˙ a RBC / G s where a RBC = ( V 3 / 4 π ) 1 / 3 is the equivalent diameter of the RBC. In the present simulation, a R B C = 2.82 μm and V = 93.58 μm 3 were used as the volume of the RBC.
Figure 6a shows the time history of the average distance from the centerline Δ d ¯ , and Figure 6b represents the change of Δ d ¯ as a function of the distance traveled in the flow direction x ¯ . As can be seen from Figure 6a, particles moved faster toward the wall direction at a higher shear rate.
Comparing Δ d ¯ as a function of distance traveled toward the streamwise direction x ¯ , the path taken by the particles to approach the wall from the central region was almost the same at γ w ˙ = 972 s 1 , 1329 s 1 , and 1990 s 1 . This result is in good agreement with the reference results in parallel plates or bifurcations [12,16]. Usually, the CFL thickness increases as the shear rate increases [39]. However, with the parameter range of the current simulations, the CFL thickness was almost constant, and the value of Δ d ¯ was the same when they reached a stable position near the wall, as shown in Figure 6a.

3.3. Channel Size Dependency

We examined the dependency of particle margination on the channel size. We varied the size of the square channel H = 16 μm, 24 μm and 32 μm and adjusted the average velocity U for each case, so that the wall shear rate γ w ˙ was equal to 1329 s 1 , respectively. As we mentioned, in (21), the diffusion of particles depends on factors such as the hematocrit level, the wall shear rate, and the particle size. Since the simulation conditions were the same except the channel width H = 16 μm, 24 μm, and 32 μm, the time history of d ¯ overlapped in RBC-core region from 0 s to 0.5 s. With reference to the derivation of Mehrabadi et al. [16], we combined (18), (20), and (21) to derive the following equation.
Δ d ¯ d r 2 = k λ x ¯ a 2 H d r 2
Note that t is replaced by t = x ¯ / U and d r stands for the distance from the center of the channel to a stable position of the particle, which had different values in each case. As shown in Figure 7b, Δ d ¯ normalized by d r was well scaled by x ¯ normalized by a 2 / H d r 2 . The disagreement between the curves can be attributed to the fact that the aspect ratio of the platelet particles to the rectangular tube was different in each case, resulting in different hydrodynamic interactions with the wall and platelets, and also, the local distribution of hematocrit was not totally the same.

3.4. Hematocrit Dependency

Numerical simulations were performed for hematocrit H t = 0 % , 5 % , 10 % , 20 % , 30 % and 40 % to explore the relationship between hematocrit and its effect on particle margination. The wall shear rate γ w ˙ in the plasma was 1910 s 1 , and the same pressure gradient was applied in all cases. The simulated results were affected by many complicated factors, and it is not easy to discuss suitable dimensionless parameters. As shown in Figure 8c,d, the stable position d r for a particle, defined as the distance between the centerline and the center of the particle at equilibrium, varied with the hematocrit level. Another aspect is that rate of Δ d ¯ as a function of x ¯ was not constant because the margination rate of the particles varied with the distance from the centerline. This was because the local shear rate and local hematocrit were different from the location in the plane. If we focus on the case of hematocrit = 20 % , the margination rate of Δ d ¯ was nearly constant up to Δ d ¯ = 12 μm, after which the margination rate slowed down. We confirmed that this region of the constant margination rate of Δ d ¯ was consistent with the RBC-core region.
Despite the difficulties in the analysis described earlier, several points can be drawn. Figure 8a shows that in the absence of RBCs ( H t = 0 % ), particle margination did not occur. This result confirmed that the presence of RBCs was the main factor that caused the non-uniform particle concentration in the domain. We confirmed from the simulation result in the case of H t = 5 % that the particles did not reach the corners, but stayed in a circular shape near the boundary between the RBC-core region and the CFL. In other cases, over H t = 10 % , the particles gradually migrated toward the wall. Once they reached the wall, the particles moved along the wall to near the corner of the channel. Figure 8b shows the ratio of d ¯ normalized by the stable position d r for each case as a function of x ¯ . If we focus on the region where the ratio of d ¯ / d r was constant, we can see that the ratio of d ¯ / d r reached its peak at H t = 10 % and gradually decreased as the hematocrit increased. Figure 9, Figure 10 and Figure 11 show the results of platelet margination in a flow with H t = 40% for γ w ˙ = 712 s 1 . Figure 8c,d indicates the relationship between hematocrit and the width of the CFL and relationship between the width of the CFL and the stable position d r . There are several ways to define the thickness of the CFL [16,19]. In the present study, the width of the CFL δ C F L was defined as the distance at which the local hematocrit at equilibrium was less than 0.5% from the wall, following the definition from Mehrabadi et al. [16]. We confirmed that the distance of the stable position of the particles decreased in proportion to the width of the CFL. This can be understood if we consider that the margination of the particle was attributed to the presence of RBCs and the width of the CFL was determined by the hematocrit.
Figure 9f and Figure 10f indicate that many particles could not escape from the RBC-core region and stayed in the region in 5 s. Particles moved 12 mm on average in the flow direction during 5 s, almost the same distance as Figure 3f, but many more particles still remained in the RBC-core region. This can be explained by the fact that particle margination was caused not only by the spatial gradient of the velocity fluctuations resulting from the presence of the RBCs and their axial accumulations, but by the direct interaction between the RBCs and the particles, which pushed the particles in the wall direction. Due to their volume effect, RBCs that were excessively present in the RBC-core layer may act as an obstacle and prevent the particles from moving. Vahidkhah et al. [40] reported that the motion of platelets varies with the density of RBCs present near a platelet. For example, a platelet shows discontinuous and quick motion when very few RBCs are located around the platelet. Such a movement rarely occurs when the hematocrit value is high. Figure 11 shows that RBC concentration profiles in H t = 40 % . Similar to H t = 20%, the axial accumulation of RBCs took place on a much faster time scale than the particles’ margination, within 0.2 s. We can confirm the results of the present simulations through the comparison with the experimental data by Seki and Takinouchi [21]. As mentioned earlier, their experiments were conducted in a rectangular tube with a cross-section of 50 × 50 μm, n average wall shear rate of 950 s 1 , a particle size of 2.9 μm, and H t = 20% and H t = 40%, which are almost the same conditions as the current simulations except for the channel size. Compared to H t = 20%, platelet-sized particles moved closer to the corners, and more platelets were observed near the center region at H t = 40%, which is consistent with the results of the current simulations.

4. Discussion

As for the platelet margination, the platelets moved from the region with a large velocity fluctuation to the region with a small velocity fluctuation, which indicates the corner of the square channel. Here, we define the velocity fluctuations as the squared mean in-plane velocity in the lateral direction. The motion of platelets in the RBC-core region can be treated as a diffusion process. Many studies [8,41,42] compared how fast platelets move by calculating the diffusion coefficient. Among the components of the diffusion tensor, we calculated the diffusion coefficient D y y from the following equation,
( Δ d ¯ ) 2 = 2 D y y t
Since particles approached the wall direction and stayed in the corner of the square domain in the end, Δ d ¯ was not constant, so nor was ( Δ d ¯ ) 2 , as we can confirm from Figure 12a. Therefore, we determined D y y from the region where the change of ( Δ d ¯ ) 2 was constant. The result is plotted in Figure 12b, and the average wall shear rate γ w ˙ had a linear relationship with the diffusion coefficient D y y . This result was supported by finding that the particle diffusivity is expressed as:
D y y = k γ ˙ d 2
where k is a dimensionless parameter related to hematocrit, γ ˙ is the shear rate, and d is the particle diameter. Seki et al. [12] estimated the diffusivity of 2.9 μm-diameter particles to be 40 μm 2 /s at a shear rate of 1000 s 1 , and in the present simulation, the diffusivity of the particle D y y = 30.12 μm 2 /s at γ w ˙ = 1000 s 1 , which is a comparable value.
To explore the effect of velocity fluctuations on particle migration, velocity fluctuations were calculated from the time-averaged and spatially averaged velocity components of the plasma in H t = 20% at γ w ˙ = 1990 s 1 . The profile of the velocity fluctuations is shown in Figure 13. We confirmed that the lateral velocity component was largest near the boundary between the red blood cell layer and the CFL and smallest near the wall. It can also be confirmed that each velocity component in the transverse direction was high near the wall due to the fluctuations generated by the particle movement. In the present simulations, the Reynolds number was much smaller than one, which corresponds to laminar flow. However, it showed the so-call pseudo-turbulence effect caused by the motion of the disperse phase, which was RBCs in this study. Seeing Figure 3 and Figure 13, one can easily find that platelets gradually moved from a region of high velocity fluctuation to a region of low velocity fluctuation, that is the corners near the channel. This phenomenon is analogous to thermophoresis [43]: large molecules accumulate in a lower-temperature region, which corresponds to the lower molecular fluctuation. This is expressed by the so-called thermophoretic force, which depends on a temperature gradient. A similar example is turbophoresis [44,45], which is particle migration toward a lower-velocity-fluctuation region in turbulent flow. Therefore, platelet migration in the present simulations was considered as turbophoresis in pseudo-turbulence flow.
Figure 14 shows the velocity fluctuations for different shear rates in the z = 16 μm plane. The velocity distribution normalized by the wall shear rate collapsed into one curve, indicating that the amplitude of velocity fluctuation has a linear relationship with the shear rate. As explained in Section 3.2, the particle trajectories did not depend on the shear rate. Since the shear rate was proportional to the streamwise flow velocity, this indicates that the lateral force was proportional to the streamwise flow velocity. Overall, platelet margination was mainly caused by the spatial gradient of velocity fluctuations, which was generated by the motion of the RBCs and was proportional to the flow velocity.

5. Conclusions

In this study, we investigated numerically the effects of physical parameters such as the shear rate, channel size, and hematocrit level on platelet-sized particles’ migration toward the wall in a square channel. The simulation results showed that the migration of particles becomes faster as the shear rate increases. The results also showed that the margination rate—the ratio of the distance traveled in the flow direction to the margination distance in the wall direction—does not depend on the shear rate. This indicates that the lateral force acting on the particles increases linearly with the shear rate, directly related to the velocity in a square channel.
Particle margination is mainly caused by two effects: first, the force pushing the particles directly toward the wall because of the interaction between the RBCs and the particles; second, the velocity fluctuations generated by the flowing motion of the deformable red blood cells. The velocity fluctuations are the highest near the border between the red blood celllayer (RBC-layer) and the cell-free layer (CFL) and the lowest around the corner. Due to the velocity fluctuation differences, the particles gradually move from the RBC-layer, with large fluctuations, to the vicinity of the corner, with small fluctuations, and stay there. Moreover, the wall-shear-rate-normalized velocity fluctuations collapse into one curve as well, showing that the margination rate does not depend on the shear rate. This result implies that the particle margination is mainly dependent on the velocity fluctuation differences.
In a square channel flow, we investigated the relationship between the width of the square channel and the path of platelet migration. We found that the margination distance normalized by the particle size, shear rate, and effective area of the particle movement showed good agreement independent of the channel size.
We found that the margination distance normalized by the particle size, shear rate, and effective area of the particle movementshowed a similar trend regardless of the channel size.
Finally, we confirmed that the margination rate of particles varies nonlinearly with the hematocrit value. In this study, we observed that under 0–40% hematocrit, the margination rate was the highest at 10% of hematocrit and gradually decreased beyond 10% due to the presence of red blood cells, which inhibited the movement of the particles toward the wall.

Author Contributions

Conceptualization, data curation, formal analysis, validation, writing–original draft preparation, D.O.; Methodology, software, writing–review, S.I.; Supervision, project administration, funding acquisition, writing–review and editing, S.T. All authors have read and agreed to the published version of the manuscript.

Funding

This research was funded by JSPS KAKENHI Grant No. 20H00222 and the National Key Research and Development Program of China Grant No. 2017YFE0117100.

Data Availability Statement

The authors confirm that the data supporting the findings of this study are available within the article.

Acknowledgments

The authors are grateful to Masako SUGIHARA-SEKI, for fruitful discussions.

Conflicts of Interest

The authors declare no conflict of interest.

Appendix A. Grid Size Dependency

In this section, we explain how we determined the spatial resolution used in this simulation. Platelet migration in the channel is mainly caused by the interaction of multiple red blood cells and platelets. Therefore, when discussing the generality of the solution, it is necessary to focus on whether the same result can be obtained regardless of the grid size. We performed numerical simulations using a straight channel of 96 × 16 × 16 μm for γ w ˙ = 1228 s 1 , H t = 20 % , and platelet concentration = 0.5 % , with different spatial resolutions Δ x = D / 16 , D / 32 , and D / 64 . Note that D is the diameter of the red blood cell.
Figure A1 shows the snapshots of the simulation results at 1 s with different grid sizes. As can be seen from Figure A1a, Δ x = D / 16 was too coarse to fully resolve the deformation of the Red Blood Cells (RBCs) and to reproduce the axial concentration of the RBCs. On the other hand, Figure A1b,c indicates that the mesh size Δ x = D / 32 and D / 64 was sufficient to reproduce deformation and physical phenomena such as the axial concentration of RBCs. This suggests that the ability to capture the deformation of the capsule affects the axial concentration of RBCs, hence the migration of platelets.
Figure A2 shows the time history of the ensemble-averaged distance Δ d ¯ ( t ) between the particle and the centerline of the computational domain as described in (17). Comparing the results of Figure A1 and Figure A2, we can see that the trend for Δ x = D / 16 was different because the axial concentration of the red blood cells was not reproduced well. On the other hand, the trajectories of Δ x = D / 32 and Δ x = D / 64 collapsed well into one curve. This means that Δ x = D / 32 was a sufficient mesh size to resolve the average behavior of the physical phenomena targeted in this study. Therefore, we chose a mesh size Δ x = D / 32 in the current study.
Figure A1. Snapshots of the simulation results in a straight channel of 96 × 16 × 16 μm for γ w ˙ = 1228 s 1 , H t = 20 % , platelet concentration = 0.5 % at t = 1.0 s. (a) Spatial resolution Δ x = D / 16 , (b) Δ x = D / 32 , and (c) Δ x = D / 64 when D is the diameter of the red blood cell.
Fluids 07 00096 g0a1
Figure A2. Dependency of particle margination on the mesh size Δ x = D / 16 , D / 32 , and D / 64 . The graph shows the time history of ensemble-averaged distance Δ d ¯ ( t ) between the particle and the centerline of the computational domain.
Fluids 07 00096 g0a2

References

  1. Grandchamp, X.; Coupier, G.; Srivastav, A.; Minetti, C.; Podgorski, T. Lift and down-gradient shear-induced diffusion in red blood cell suspensions. Phys. Rev. Lett. 2013, 110, 108101. [Google Scholar] [CrossRef]
  2. Fåhræus, R.; Lindqvist, T. The viscosity of the blood in narrow capillary tubes. Am. J. Physiol.-Leg. Content 1931, 96, 562–568. [Google Scholar] [CrossRef]
  3. Pries, A.R.; Neuhaus, D.; Gaehtgens, P. Blood viscosity in tube flow: Dependence on diameter and hematocrit. Am. J. Physiol.-Heart Circ. Physiol. 1992, 263, H1770–H1778. [Google Scholar] [CrossRef]
  4. Radmacher, M.; Fritz, M.; Kacher, C.M.; Cleveland, J.P.; Hansma, P.K. Measuring the viscoelastic properties of human platelets with the atomic force microscope. Biophys. J. 1996, 70, 556–567. [Google Scholar] [CrossRef] [Green Version]
  5. Pozrikidis, C. Orbiting motion of a freely suspended spheroid near a plane wall. J. Fluid Mech. 2005, 541, 105–114. [Google Scholar] [CrossRef]
  6. Goto, S.; Hasebe, T.; Takagi, S. Platelets: Small in Size But Essential in the Regulation of Vascular Homeostasis. Circ. J. 2015, 79, 1871–1881. [Google Scholar] [CrossRef] [Green Version]
  7. Yeh, C.; Eckstein, E.C. Transient lateral transport of platelet-sized particles in flowing blood suspensions. Biophys. J. 1994, 66, 1706–1716. [Google Scholar] [CrossRef] [Green Version]
  8. Tokarev, A.A.; Butylin, A.A.; Ermakova, E.A.; Shnol, E.E.; Panasenko, G.P.; Ataullakhanov, F.I. Finite platelet size could be responsible for platelet margination effect. Biophys. J. 2011, 101, 1835–1843. [Google Scholar] [CrossRef] [Green Version]
  9. Tangelder, G.J.; Teirlinck, H.C.; Slaaf, D.W.; Reneman, R.S. Distribution of blood platelets flowing in arterioles. Am. J. Physiol.-Heart Circ. Physiol. 1985, 248, H318–H323. [Google Scholar] [CrossRef]
  10. Tilles, A.W.; Eckstein, E.C. The near-wall excess of platelet-sized particles in blood flow: Its dependence on hematocrit and wall shear rate. Microvasc. Res. 1987, 33, 211–223. [Google Scholar] [CrossRef]
  11. Aarts, P.A.; Steendijk, P.; Sixma, J.J.; Heethaar, R.M. Fluid shear as a possible mechanism for platelet diffusivity in flowing blood. J. Biomech. 1986, 19, 799–805. [Google Scholar] [CrossRef]
  12. Sugihara-Seki, M.; Onozawa, T.; Takinouchi, N.; Itano, T.; Seki, J. Development of margination of platelet-sized particles in red blood cell suspensions flowing through Y-shaped bifurcating microchannels. Biorheology 2020, 57, 101–116. [Google Scholar] [CrossRef]
  13. Eckstein, E.C.; Belgacem, F. Model of platelet transport in flowing blood with drift and diffusion terms. Biophys. J. 1991, 60, 53–69. [Google Scholar] [CrossRef] [Green Version]
  14. AlMomani, T.; Udaykumar, H.S.; Marshall, J.S.; Chandran, K.B. Micro-scale dynamic simulation of erythrocyte-platelet interaction in blood flow. Ann. Biomed. Eng. 2008, 36, 905–920. [Google Scholar] [CrossRef]
  15. Crowl, L.; Fogelson, A.L. Analysis of mechanisms for platelet near-wall excess under arterial blood flow conditions. J. Fluid Mech. 2011, 676, 348–375. [Google Scholar] [CrossRef]
  16. Mehrabadi, M.; Ku, D.N.; Aidun, C.K. Effects of shear rate, confinement, and particle parameters on margination in blood flow. Phys. Rev. E 2016, 93, 023109. [Google Scholar] [CrossRef] [Green Version]
  17. Chang, H.Y.; Yazdani, A.; Li, X.; Douglas, K.A.; Mantzoros, C.S.; Karniadakis, G.E. Quantifying Platelet Margination in Diabetic Blood Flow. Biophys. J. 2018, 115, 1371–1382. [Google Scholar] [CrossRef] [Green Version]
  18. Czaja, B.; Gutierrez, M.; Závodszky, G.; de Kanter, D.; Hoekstra, A.; Eniola-Adefeso, O. The influence of red blood cell deformability on hematocrit profiles and platelet margination. PLoS Comput. Biol. 2020, 16, e1007716. [Google Scholar] [CrossRef]
  19. Krüger, T. Effect of tube diameter and capillary number on platelet margination and near-wall dynamics. Rheol. Acta 2016, 55, 511–526. [Google Scholar] [CrossRef]
  20. Kumar, A.; Graham, M.D. Mechanism of margination in confined flows of blood and other multicomponent suspensions. Phys. Rev. Lett. 2012, 109, 108102. [Google Scholar] [CrossRef]
  21. Sugihara-Seki, M.; Takinouchi, N. Margination of platelet-sized particles in the red blood cell suspension flow through square microchannels. Micromachines 2021, 12, 1175. [Google Scholar] [CrossRef]
  22. Zhao, H.; Shaqfeh, E.S.; Narsimhan, V. Shear-induced particle migration and margination in a cellular suspension. Phys. Fluids 2012, 24, 011902. [Google Scholar] [CrossRef] [Green Version]
  23. Ii, S.; Shimizu, K.; Sugiyama, K.; Takagi, S. Continuum and stochastic approach for cell adhesion process based on Eulerian fluid-capsule coupling with Lagrangian markers. J. Comput. Phys. 2018, 374, 769–786. [Google Scholar] [CrossRef]
  24. Zhao, H.; Shaqfeh, E.S. Shear-induced platelet margination in a microchannel. Phys. Rev. E—Stat. Nonlinear Soft Matter Phys. 2011, 83, 061924. [Google Scholar] [CrossRef]
  25. Takeishi, N.; Imai, Y.; Wada, S. Capture event of platelets by bolus flow of red blood cells in capillaries. J. Biomech. Sci. Eng. 2019, 14, 18–00535. [Google Scholar] [CrossRef] [Green Version]
  26. Peskin, C.S. Flow patterns around heart valves: A numerical method. J. Comput. Phys. 1972, 10, 252–271. [Google Scholar] [CrossRef]
  27. Unverdi, S.O.; Tryggvason, G. A front-tracking method for viscous, incompressible, multi-fluid flows. J. Comput. Phys. 1992, 100, 25–37. [Google Scholar] [CrossRef] [Green Version]
  28. Skalak, R.; Tozeren, A.; Zarda, R.P.; Chien, S. Strain Energy Function of Red Blood Cell Membranes. Biophys. J. 1973, 13, 245–264. [Google Scholar] [CrossRef] [Green Version]
  29. Pozrikidis, C. Effect of membrane bending stiffness on the deformation of capsules in simple shear flow. J. Fluid Mech. 2001, 440, 269–291. [Google Scholar] [CrossRef]
  30. Walter, J.; Salsac, A.V.; Barthès-Biesel, D.; le Tallec, P. Coupling of finite element and boundary integral methods for a capsule in a Stokes flow. Int. J. Numer. Methods Eng. 2010, 83, 829–850. [Google Scholar] [CrossRef]
  31. Amsden, A.; Harlow, F. A simplified MAC technique for incompressible fluid flow calculations. J. Comput. Phys. 1970, 6, 322–325. [Google Scholar] [CrossRef]
  32. Jing, P.; Ii, S.; Wang, X.; Sugiyama, K.; Noda, S.; Gong, X. Effects of fluid-cell-vessel interactions on the membrane tensions of circulating tumor cells in capillary blood flows. Phys. Fluids 2022, 34, 031904. [Google Scholar] [CrossRef]
  33. Takeishi, N.; Imai, Y.; Nakaaki, K.; Yamaguchi, T.; Ishikawa, T. Leukocyte margination at arteriole shear rate. Physiol. Rep. 2014, 2, e12037. [Google Scholar] [CrossRef] [PubMed]
  34. Evans, E.A.; La Celle, P.L. Intrinsic material properties of the erythrocyte membrane indicated by mechanical analysis of deformation. Blood 1975, 45, 29–43. [Google Scholar] [CrossRef] [PubMed] [Green Version]
  35. Evans, E.A.; Waugh, R.; Melnik, L. Elastic area compressibility modulus of red cell membrane. Biophys. J. 1976, 16, 585–595. [Google Scholar] [CrossRef] [Green Version]
  36. Evans, E.A. Bending elastic modulus of red blood cell membrane derived from buckling instability in micropipet aspiration tests. Biophys. J. 1983, 43, 27–30. [Google Scholar] [CrossRef] [Green Version]
  37. Frojmovic, M.M.; Milton, J.G. Human platelet size, shape, and related functions in health and disease. Physiol. Rev. 1982, 62, 185–261. [Google Scholar] [CrossRef]
  38. Miller, C. Predicting Non-Newtonian Flow Behavior in Ducts of Unusual Cross Section. Ind. Eng. Chem. Fundam. 1972, 11, 524–528. [Google Scholar] [CrossRef]
  39. Katanov, D.; Gompper, G.; Fedosov, D.A. Microvascular blood flow resistance: Role of red blood cell migration and dispersion. Microvasc. Res. 2015, 99, 57–66. [Google Scholar] [CrossRef]
  40. Vahidkhah, K.; Diamond, S.L.; Bagchi, P. Platelet dynamics in three-dimensional simulation of whole blood. Biophys. J. 2014, 106, 2529–2540. [Google Scholar] [CrossRef] [Green Version]
  41. Leighton, D.; Acrivos, A. Measurement of shear induced self diffusion in concentrated suspensions of spheres. J. Fluid Mech. 1987, 177, 109–131. [Google Scholar] [CrossRef]
  42. Závodszky, G.; Van Rooij, B.; Czaja, B.; Azizi, V.; De Kanter, D.; Hoekstra, A.G. Red blood cell and platelet diffusivity and margination in the presence of cross-stream gradients in blood flows. Phys. Fluids 2019, 31, 031903. [Google Scholar] [CrossRef] [Green Version]
  43. Talbot, L.; Cheng, R.K.; Schefer, R.W.; Willis, D.R. Thermophoresis of particles in a heated boundary layer. J. Fluid Mech. 1980, 101, 737–758. [Google Scholar] [CrossRef] [Green Version]
  44. Reeks, M.W. The transport of discrete particles in inhomogeneous turbulence. J. Aerosol Sci. 1983, 14, 729–739. [Google Scholar] [CrossRef]
  45. Caporaloni, M.; Tampieri, F.; Trombetti, F.; Vittori, O. Transfer of particles in nonisotropic air turbulence. J. Atmos. Sci. 1975, 32, 565–568. [Google Scholar] [CrossRef] [Green Version]
Figure 1. Schematic view of the time history of the ensemble-averaged distance Δ d ¯ ( t ) between the particle and the centerline of the computational domain.
Fluids 07 00096 g001
Figure 2. Comparison of the time history of the ensemble-averaged distance Δ d ¯ between the height and width direction for H t = 20 % , γ w ˙ = 972 s 1 .
Fluids 07 00096 g002
Figure 3. Snapshots of the simulation results in a straight channel of 224 × 32 × 32 μm for γ w ˙ = 972 s 1 , H t = 20 % at (a) t = 0, (b) t = 0.5, (c) t = 1.0, (d) t = 1.5, (e) t = 2.0, and (f) 3.0 s. The particles move gradually toward the corners of the channels.
Fluids 07 00096 g003
Figure 4. Particle Concentration Profiles (PCPs) in a straight channel of 224 × 32 × 32 μm for γ w ˙ = 972 s 1 , H t = 20 % at (a) t = 0, (b) t = 0.5, (c) t = 1.0, (d) t = 1.5, (e) t = 2.0, and (f) 3.0 s. Each graph corresponds to the results in Figure 3.
Fluids 07 00096 g004
Figure 5. RBC Concentration Profiles (RCPs) in a straight channel of 224 × 32 × 32 μm for γ w ˙ = 972 s 1 , H t = 20 % at (a) t = 0, (b) t = 0.5, (c) t = 1.0, (d) t = 1.5, (e) t = 2.0, and (f) 3.0 s. Each graph corresponds to the results in Figure 3.
Fluids 07 00096 g005
Figure 6. Ensemble-averaged distance d ¯ from the centerline of the channel at average wall shear rates γ w ˙ = 972 s 1 , 1329 s 1 , and 1990 s 1 . (a) Time history of d ¯ . (b) Change of d ¯ as a function of distance traveled in the flow direction x ¯ .
Fluids 07 00096 g006
Figure 7. Dependency of particle margination on channel size H in H = 16 μm, 24 μm, and 32 μm. (a) Time history of Δ d ¯ and (b) Δ d ¯ normalized by half the channel height H and x ¯ normalized by a 2 / H d r 2 .
Fluids 07 00096 g007
Figure 8. Hematocrit dependency of platelet margination. (a) Change of d ¯ as a function of distance traveled toward the streamwise direction x ¯ . (b) Rate of d ¯ normalized by the stable position d r for each case as a function of x ¯ . (c) Relationship between the hematocrit level and the width of the CFL δ C F L calculated from the distance where the local hematocrit in the equilibrium state is under 0.5 % . (d) Relationship between the width of CFL δ C F L and the stable position of platelets d r .
Fluids 07 00096 g008
Figure 9. Snapshots of the simulation results in a straight channel of 224 × 32 × 32 μm for γ w ˙ = 712 s 1 , H t = 40 % at (a) t = 0, (b) t = 1.0, (c) t = 2.0, (d) t = 3.0, (e) t = 4.0, and (f) 5.0 s. The particles move gradually toward the corners of the channels.
Fluids 07 00096 g009
Figure 10. Particle Concentration Profiles (PCPs) in a straight channel of 224 × 32 × 32 μm for γ w ˙ = 712 s 1 , H t = 40 % at (a) t = 0, (b) t = 1.0, (c) t = 2.0, (d) t = 3.0, (e) t = 4.0, and (f) 5.0 s. Each graph corresponds to the results in Figure 9.
Fluids 07 00096 g010
Figure 11. RBC Concentration Profiles (RCPs) in a straight channel of 224 × 32 × 32 μm for γ w ˙ = 712 s 1 , H t = 40 % at (a) t = 0, (b) t = 1.0, (c) t = 2.0, (d) t = 3.0, (e) t = 4.0, and (f) 5.0 s. Each graph corresponds to the results in Figure 9.
Fluids 07 00096 g011
Figure 12. Calculation of the diffusion coefficient from the mean-squared displacement. (a) Time history of ( Δ d ¯ ) 2 based on the result of Figure 6. (b) Relationship between wall shear rate γ ˙ w and the diffusion coefficient D y y determined from (20).
Fluids 07 00096 g012
Figure 13. Velocity fluctuation calculated from time-averaged and spatially averaged velocity components from plasma in H t = 20% at γ w ˙ = 1990 s 1 . (a) Velocity fluctuation from both the transverse y- and z-direction. (b) Velocity fluctuation of the y-direction. (c) Velocity fluctuation of the z-direction.
Fluids 07 00096 g013
Figure 14. Velocity fluctuation in the z = 16 μm plane. (a) Velocity fluctuation time-averaged and spatially averaged velocity components γ w ˙ = 972 s 1 , 1329 s 1 , and 1990 s 1 . (b) Velocity fluctuation normalized by the wall shear rate γ w ˙ .
Fluids 07 00096 g014
Table 1. Conditions for numerical simulation to compare the effect of the shear rate.
U (m/s) Ca Re γ w ˙ (s 1 )
0.00440.660.116972
0.00590.900.1591329
0.00891.350.2381990
Publisher’s Note: MDPI stays neutral with regard to jurisdictional claims in published maps and institutional affiliations.

