Abstract
Wheels and wheel houses contribute up to 25% of the total aerodynamic drag of passenger cars and interact in a complex way with their surroundings. Rims and tires induce complex flow separation mechanisms in a highly unsteady regime and the proximity to the ground enhances these phenomena. To have a clearer understanding of the flow mechanisms that develop around wheels and inside wheel houses, the effect of tire deformation and vehicle ride height on the aerodynamics of passenger cars has been investigated with unsteady CFD simulations. Tire deformation is modelled with an empirical formulation that provides close-to-real deformed shapes, while vehicle ride height changes are made by applying vertical translations the vehicle body. Slick tire geometries and closed rims have been analysed and their rotation has been modelled with a tangential velocity component applied to their surface. The investigation has been conducted in three steps: different car heights and tire deformation levels have been investigated separately and then combined, classifying the results on the basis of the drag of the vehicle. Results show that even small tire deformation levels can significantly affect the aerodynamic drag, thus deformation should be included in simulations and treated with caution.
Keywords:
aerodynamics; wheels; tire; rim; deformation; road vehicles; numerical simulation; experiments; DrivAer; AeroSUV 1. Introduction
Aerodynamic efficiency for passenger cars is a topical point of interest in recent years. Car manufacturers are forced to rapidly improve their designs by more and more stringent homologation procedures such as WLTP [1], which has been applied since September 2017 in Europe. Compared to previous regulations (i.e., NEDC), WLTP cycles better represent realistic driving scenarios, thus requiring a high level of optimisation for most of vehicle components. With respect to the past, new tests are characterised by a higher average velocity and longer distances (longer test time).
Due to the differences between NEDC and WLTP test cycles, vehicle parameters such as car weight, tire rolling resistance and aerodynamic drag have different relative weights. For WLTP, vehicle weight and aerodynamics are the most influencing parameters due to longer and stronger acceleration phases and a higher average velocity [2]. This is why aerodynamics offers a significant room for improvement and it currently is one of the most investigated car properties.
Typically, modifications to the shape of the car are the most rewarding because the shape contributes with the largest share to the total drag. However, the shape is usually constrained by several exterior design considerations and limited modifications can be accepted. The second largest share is due to wheels and wheel houses. They contribute up to 25% of the total aerodynamic drag of passenger cars [3]. Thus, even a small improvement in wheel design could lead to appreciable gains in vehicle energy efficiency. However, investigating wheel aerodynamics is a complex activity due to the nature of the flow structures that are generated around wheels and the way in which they interact with their surroundings. This is why a growing interest in wheel aerodynamics has been registered lately, both in academia and in industry, strongly supported by the increasing availability of computational resources. Although it would be ideal to test several tire and wheel configurations with experimental activities (wind tunnel tests), the excessive manufacturing cost required to produce custom tire models always limits the experimental activity to a limited number of configurations. This limitation is not present when doing simulations. A large number of tire geometries can be tested, even with small or very small modifications. The latter motivation justifies the recent increase in interest for accurate CFD modelling applied to wheel aerodynamics.
The topic of wheel aerodynamics has been investigated with many and different approaches. The first research activities were experimental investigations. At the beginning, the wheel rotated on a stationary ground board with a recess to allow for rotation [4], demonstrating that it was already clear that wheel rotation could not be neglected for accurate flow predictions. The research on wheel aerodynamics continued with sophisticated methods to instrument the wheel for collecting surface pressure and force measurements [5,6]. Recently, detailed studies have described the flow structures around static and rotating wheels both for isolated wheels and wheels inserted in the wheel house of a complete car [7], trying to reproduce the flow structures also with CFD.
From the numerical point of view, there are several challenges related to rotation modelling. Usually, the first approach to wheel aerodynamics consists in studying the flow past a lifted and isolated wheel. The outcome cannot be transferred directly to production cars, but this setup is convenient for developing and comparing CFD methodologies (i.e., rotation models, numerical setups). Then, they can be applied to complete car setups for reproducing a wind tunnel test scenario [8,9]. The current state of the art for wheel rotation modelling [10] allows for studying highly complex wheels with open rims and generic tire tread designs. The methodology consists in the combination of sliding mesh (SM), rotating wall boundary condition (RWBC) and moving reference frame (MRF). SM is applied to open rims, RWBC to tire shoulder and longitudinal grooves, MRF for the flow inside lateral grooves. All the models are generally available in the vast majority of CFD packages, but the implementation of a robust and reliable workflow is not trivial.
The research described in this work does not require the full implementation of the State of the Art for wheel rotation modeling because only closed rims and slick tires have been simulated. RWBC is enough to include an accurate modelling of tire and rim rotation, considering that for the purpose of this preliminary investigation, closed rims and slick tires are not a limitation. The work focuses on understanding the role of tire deformation and vehicle ride height and how they contribute to the drag of passenger cars, with the purpose of underlining the importance of a detailed treatment of both the effects combined. A better understanding of how these two parameters affect aerodynamic drag would promote best practices for the pre-processing phase (i.e., geometry preparation and positioning), resulting in improved results obtained from simulations. This study investigates the effect of tire deformation and vehicle ride height changes by testing them separately in order to distinguish their effect when acting alone. Successively, they are combined and the global effect is discussed.
The investigation has been conducted with unsteady simulations. They are the standard in the automotive industry for predicting the aerodynamic loads acting on road vehicles. The same setup has been applied to study all the configurations and perform meaningful comparisons. Simulations have been done with the open-source CFD tool OpenFOAM®. The flexibility of this tool allows for developing a baseline model that can be easily extended to the analysis of several configurations and the use of a hybrid model for turbulence, such as the Spalart-Allmaras DDES, guarantees that results for configuration changes are reliable [11,12].
2. Case Study
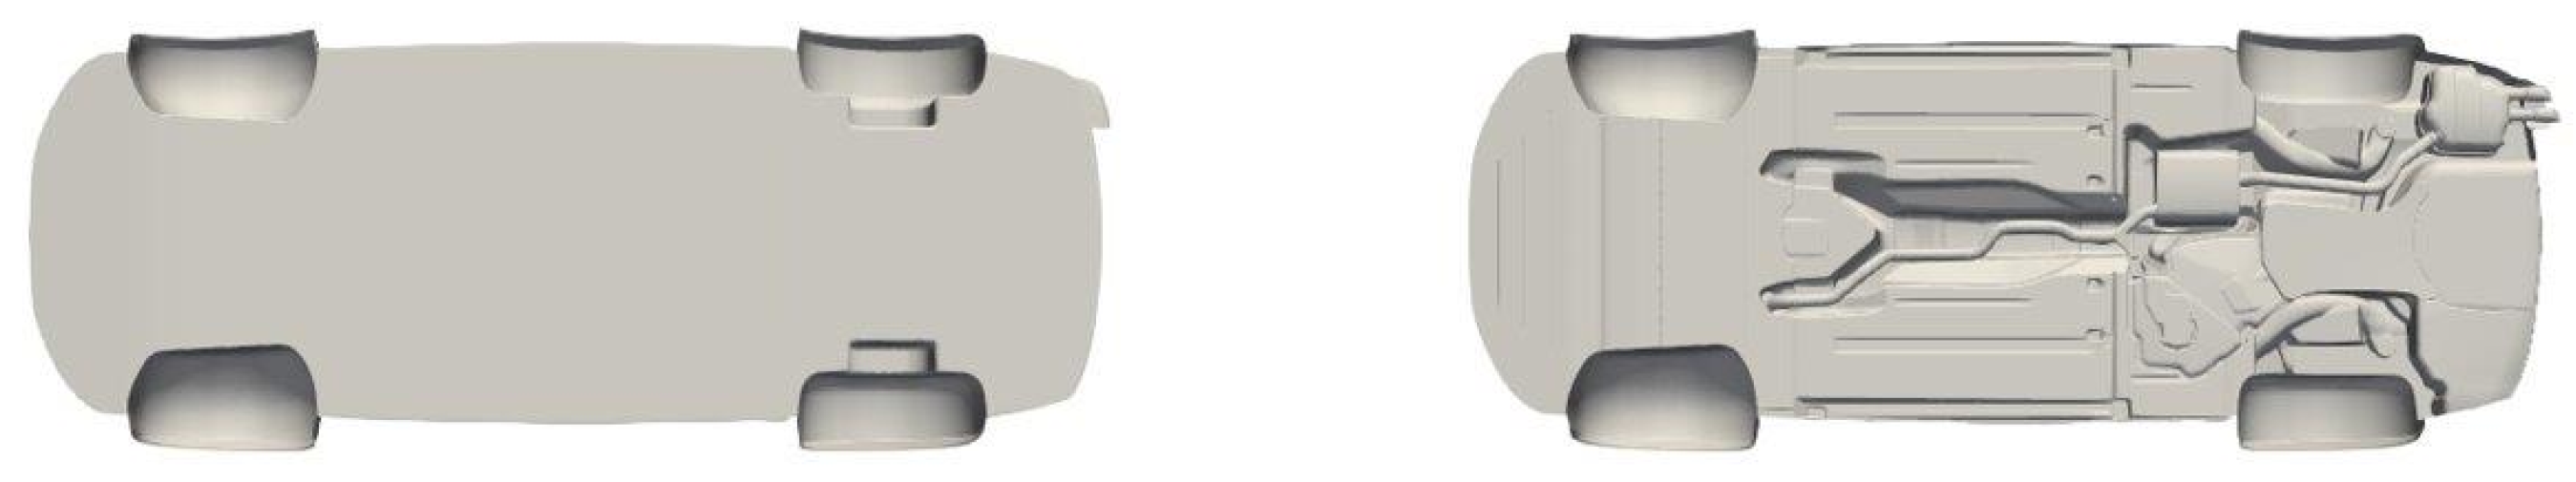
This section presents the vehicle models and the configurations that have been prepared to assess the contribution of tire deformation and ride height to aerodynamic drag. The two parameters are tested on two different car models (open road simulations) travelling at a constant speed of 140 km/h. The investigation has been conducted on two vehicles with different characteristics because the performance of wheels has been found to be changing depending on the vehicle [13], i.e., it could happen that an optimal tire for a sedan would instead increase the drag of a different vehicle model. Thus, two models have been studied to see if there is any dependence on the vehicle geometry on the parameters analysed. The selected models are the DrivAer [14] in its Notchback configuration and the Estate AeroSUV [15]. Their geometry is provided in Figure 1.
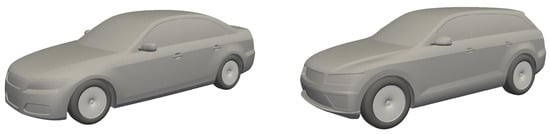
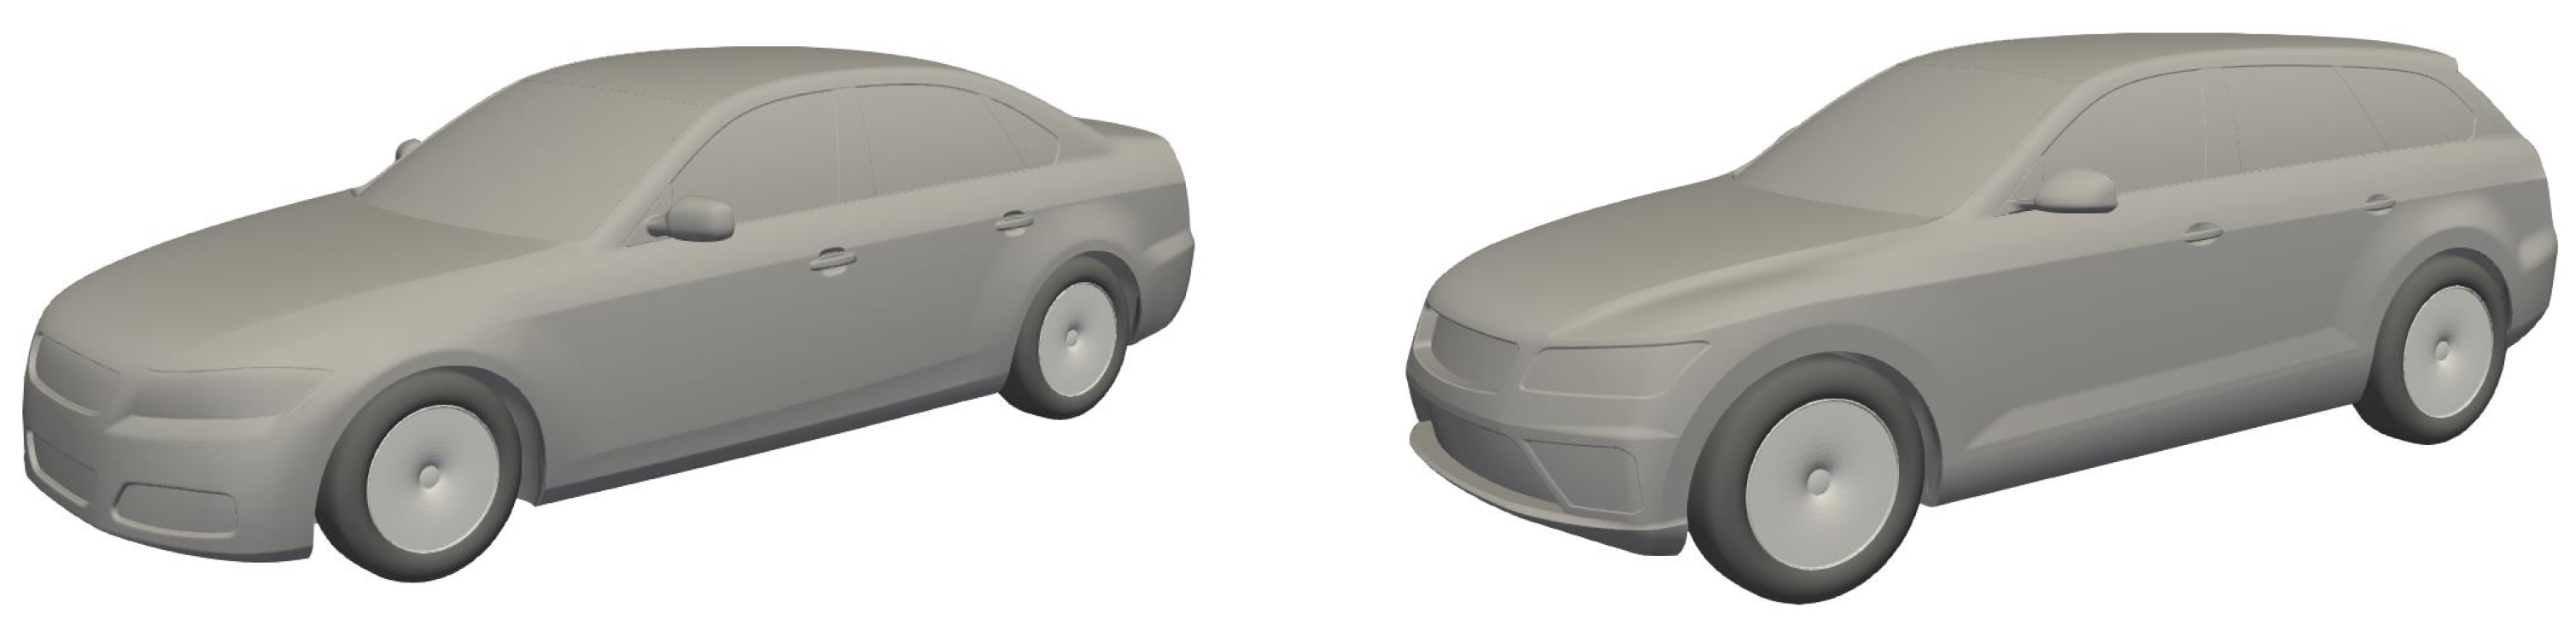
Figure 1.
Vehicle models: Notchback DrivAer (left), Estate AeroSUV (right).
The reference dimensions for the vehicles are provided in Table 1. The ride height is measured between the ground and the underbody in the rear part of the front wheel house and in the front part of the rear wheel house.

Table 1.
Vehicle reference dimensions.
These models allow for a more direct transfer of results to production vehicles, differently from other simplified vehicles (i.e., Ahmed body [16], SAE reference bodies [17], Windsor body [18]). The success of the DrivAer and the AeroSUV in the automotive field can be attributed to their characteristics: they are sufficiently detailed car geometries that resume most of the features of common vehicles found in the market, without small details that would over-complicate the simulations. In the following sections, details on tire deformation levels and vehicle ride heights are provided. Some configurations have been simulated with different underbody geometries to investigate their differences. A smooth and detailed underbody have been tested, as shown in Figure 2.
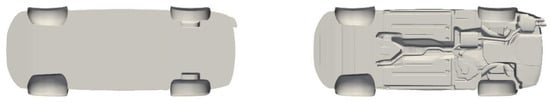
Figure 2.
Underbody geometries: smooth (left), detailed (right).
It is relevant to test two different underbody configurations. At first, the necessity of adding the maximum level of geometrical detail in simulations will be discussed, comparing results and differences. Trends are expected to differ depending on the underbody condiguation and this study wants to highlight them, also because including a detailed underbody entails a non negligible increase in computational cost. Secondly, Battery Electric Vehicles (BEVs) are continuously growing in popularity, with rapidly increasing sell figures [19]. They typically feature an underbody that is close to the smooth configuration analysed in this work. Especially for BEVs, aerodynamic efficiency is a major concern as one of the most important design goals is an extension in the driving range. This investigation will describe how the underbody geometry and the wheels interact in the total aerodynamic drag of passenger cars.
2.1. Tire Deformation
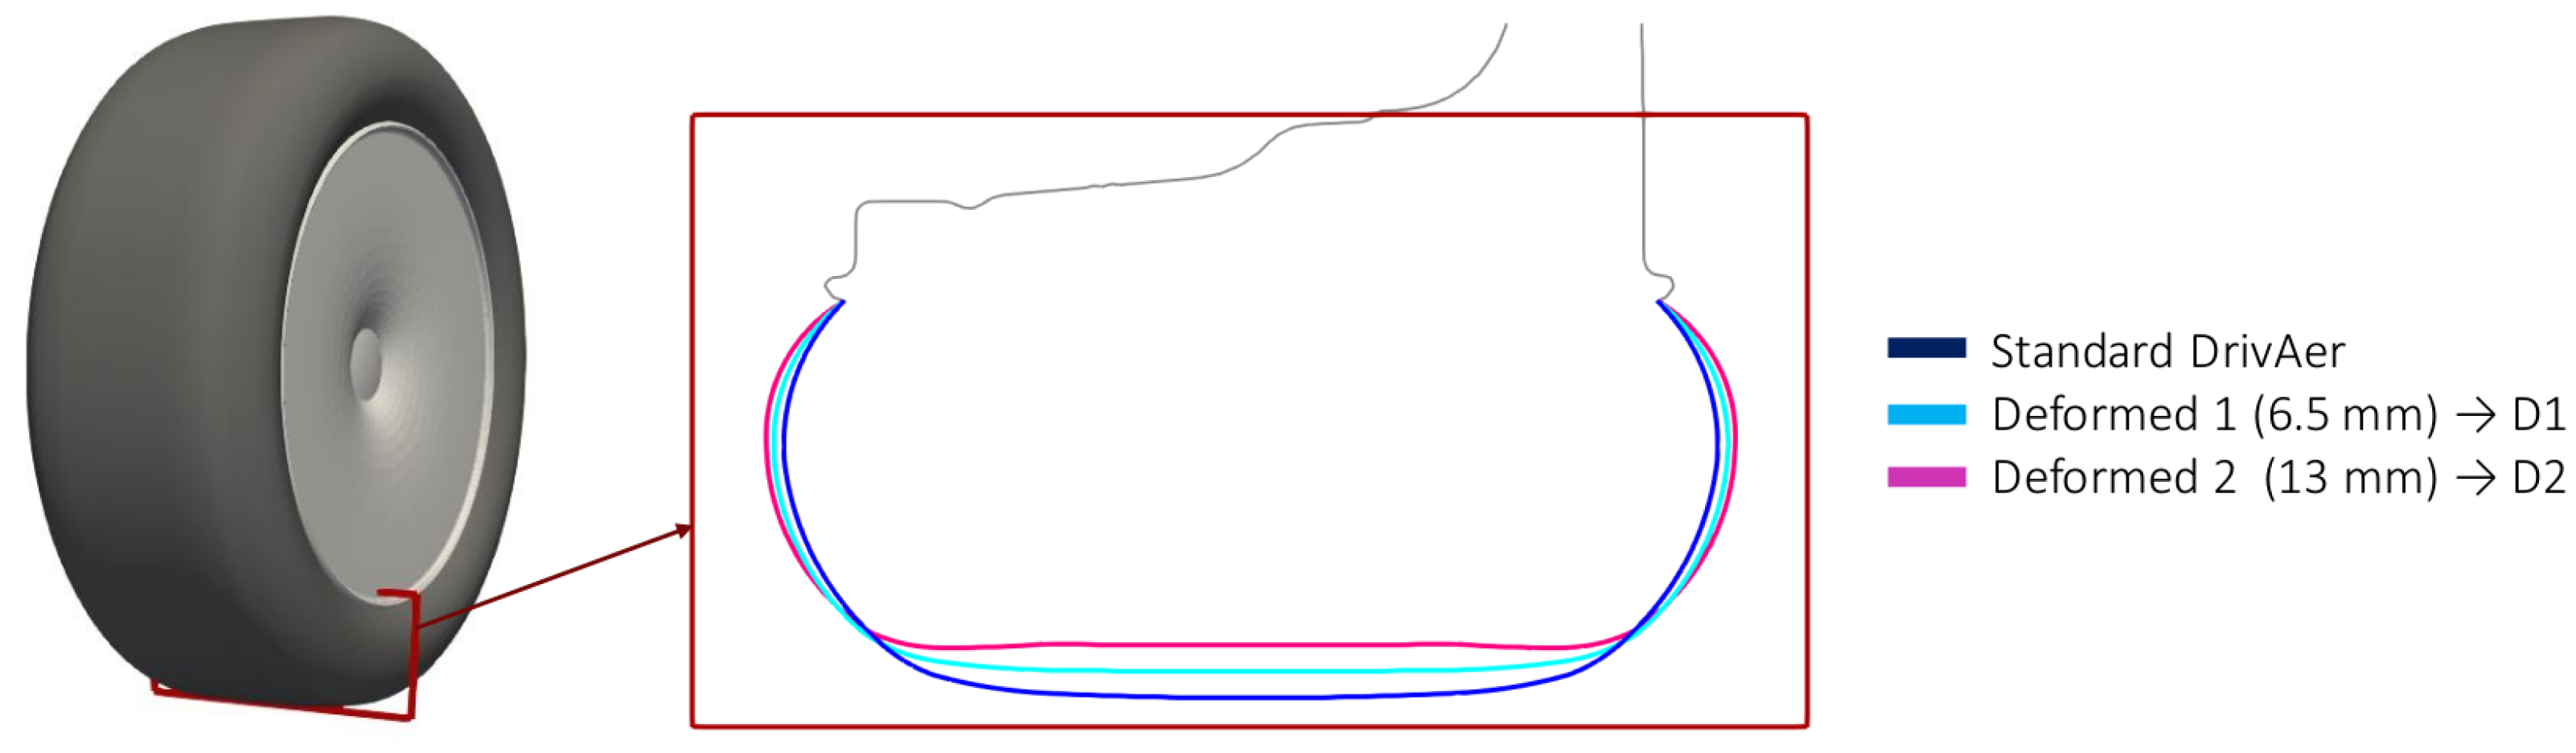
The effect of tire deformation is investigated with three deformation levels. The standard tire is the reference model with zero deformation (B). Then a medium (D1) and a high deformation (D2) have been applied, corresponding to a maximum deformation of 6.5 and 13 mm for the DrivAer tires and of 7.5 and 15 mm for the AeroSUV tires. The resulting tire profiles for the DrivAer are provided in Figure 3.
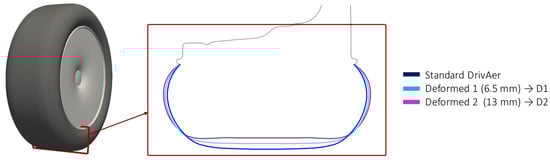
Figure 3.
Tire deformation levels for DrivAer tires.
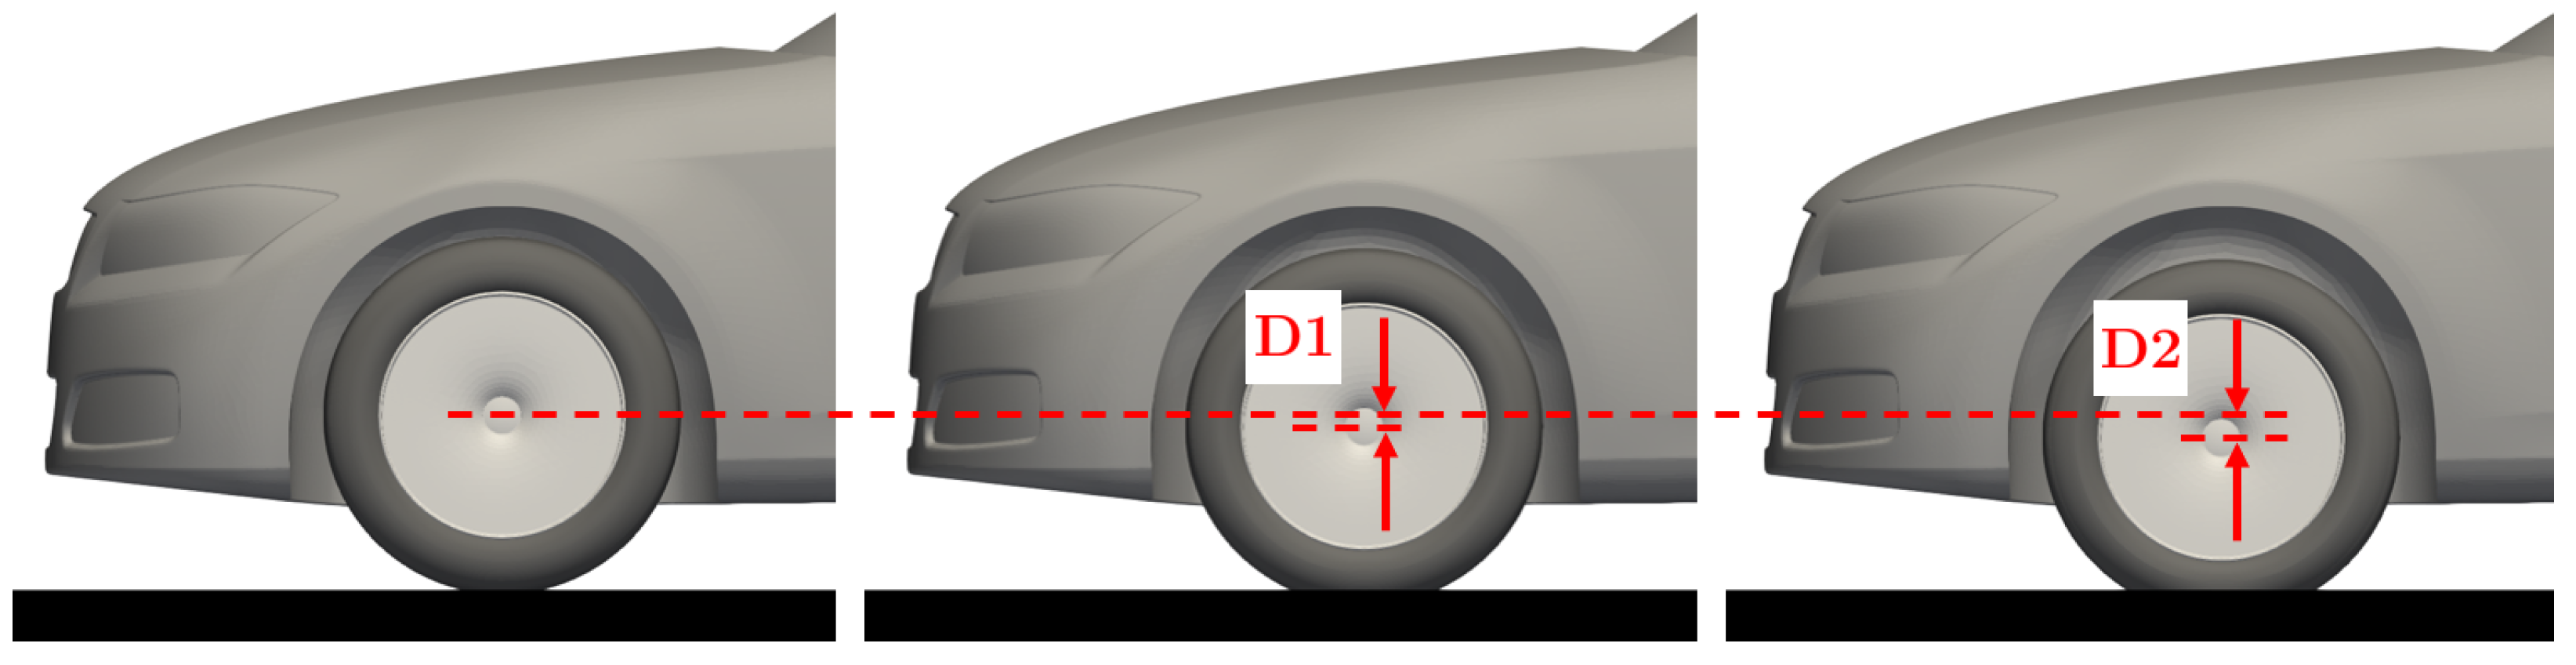
To try and isolate the effect of tire deformation from the corresponding vehicle ride height change, the aforementioned three levels of deformation have been tested while keeping the car height fixed (standard DrivAer height). To do so, both front and rear wheel axes move towards the ground with increasing levels of deformation.
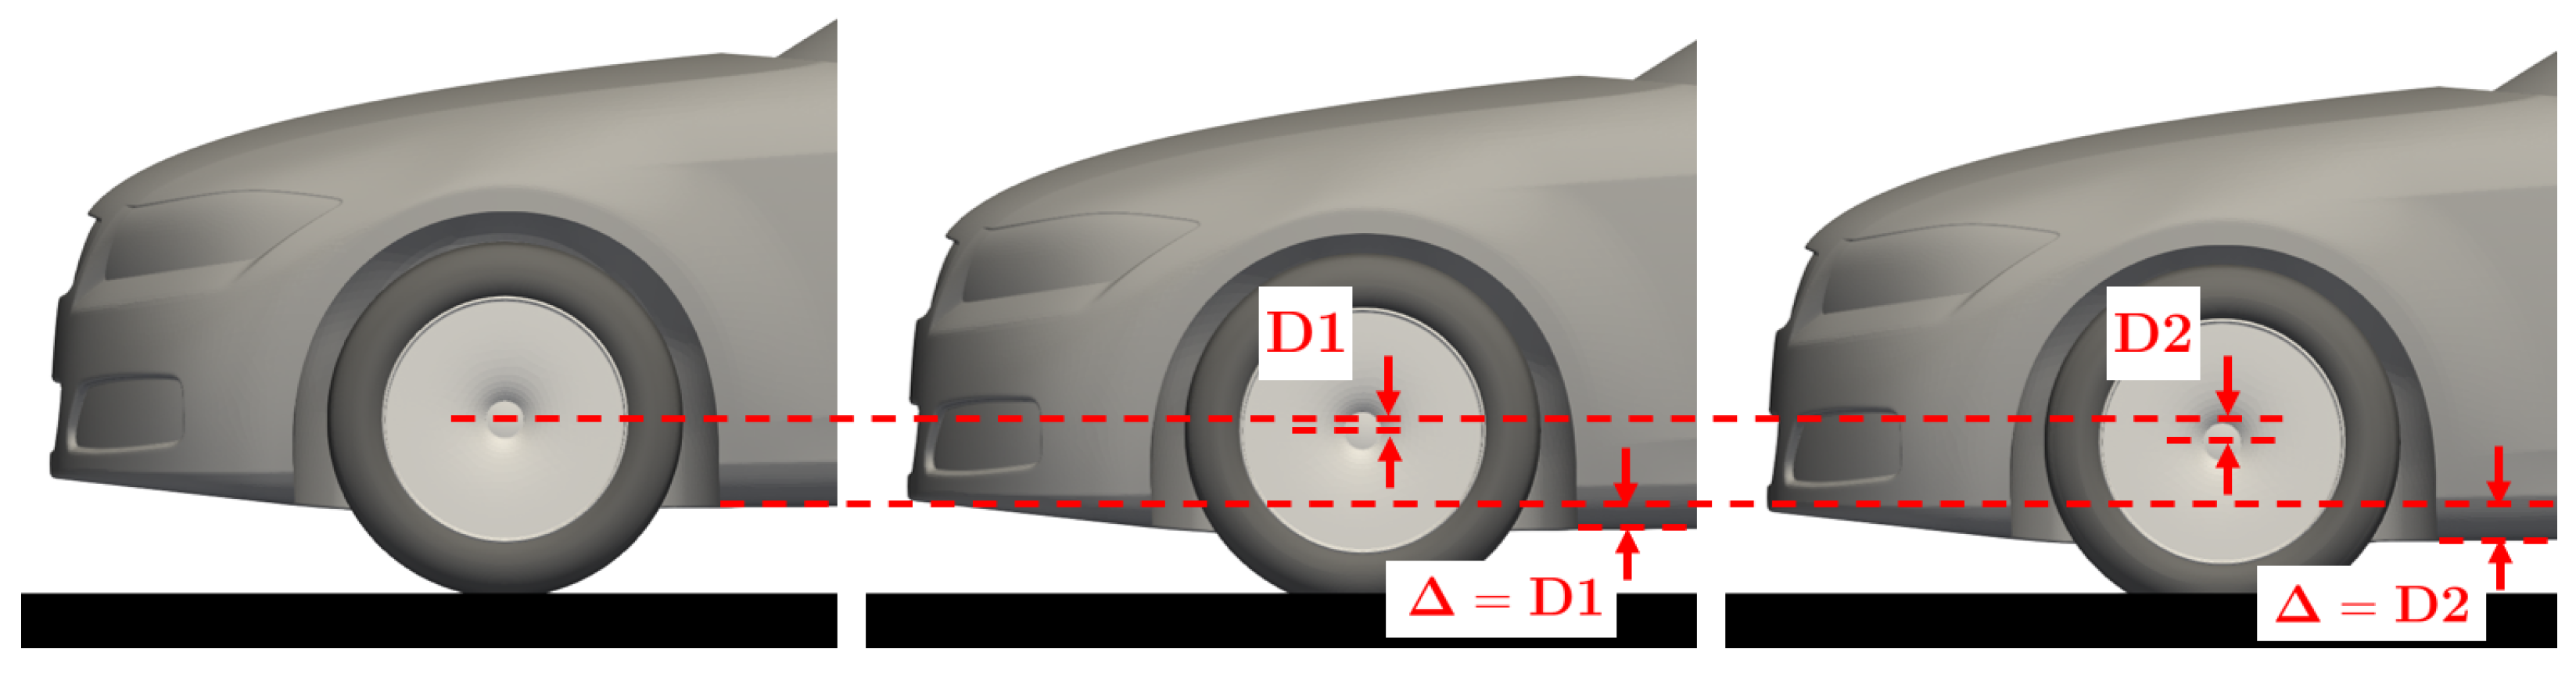
Figure 4 shows the process of tire deformation. The height of the centre of the wheel decreases with increasing tire deformation levels, going from baseline B to the maximum deformation level D2. The intermediate deformation level is D1.

Figure 4.
Tire deformation levels: Baseline (left), Deformed D1 (centre), Deformed D2 (right).
2.2. Vehicle Ride Height
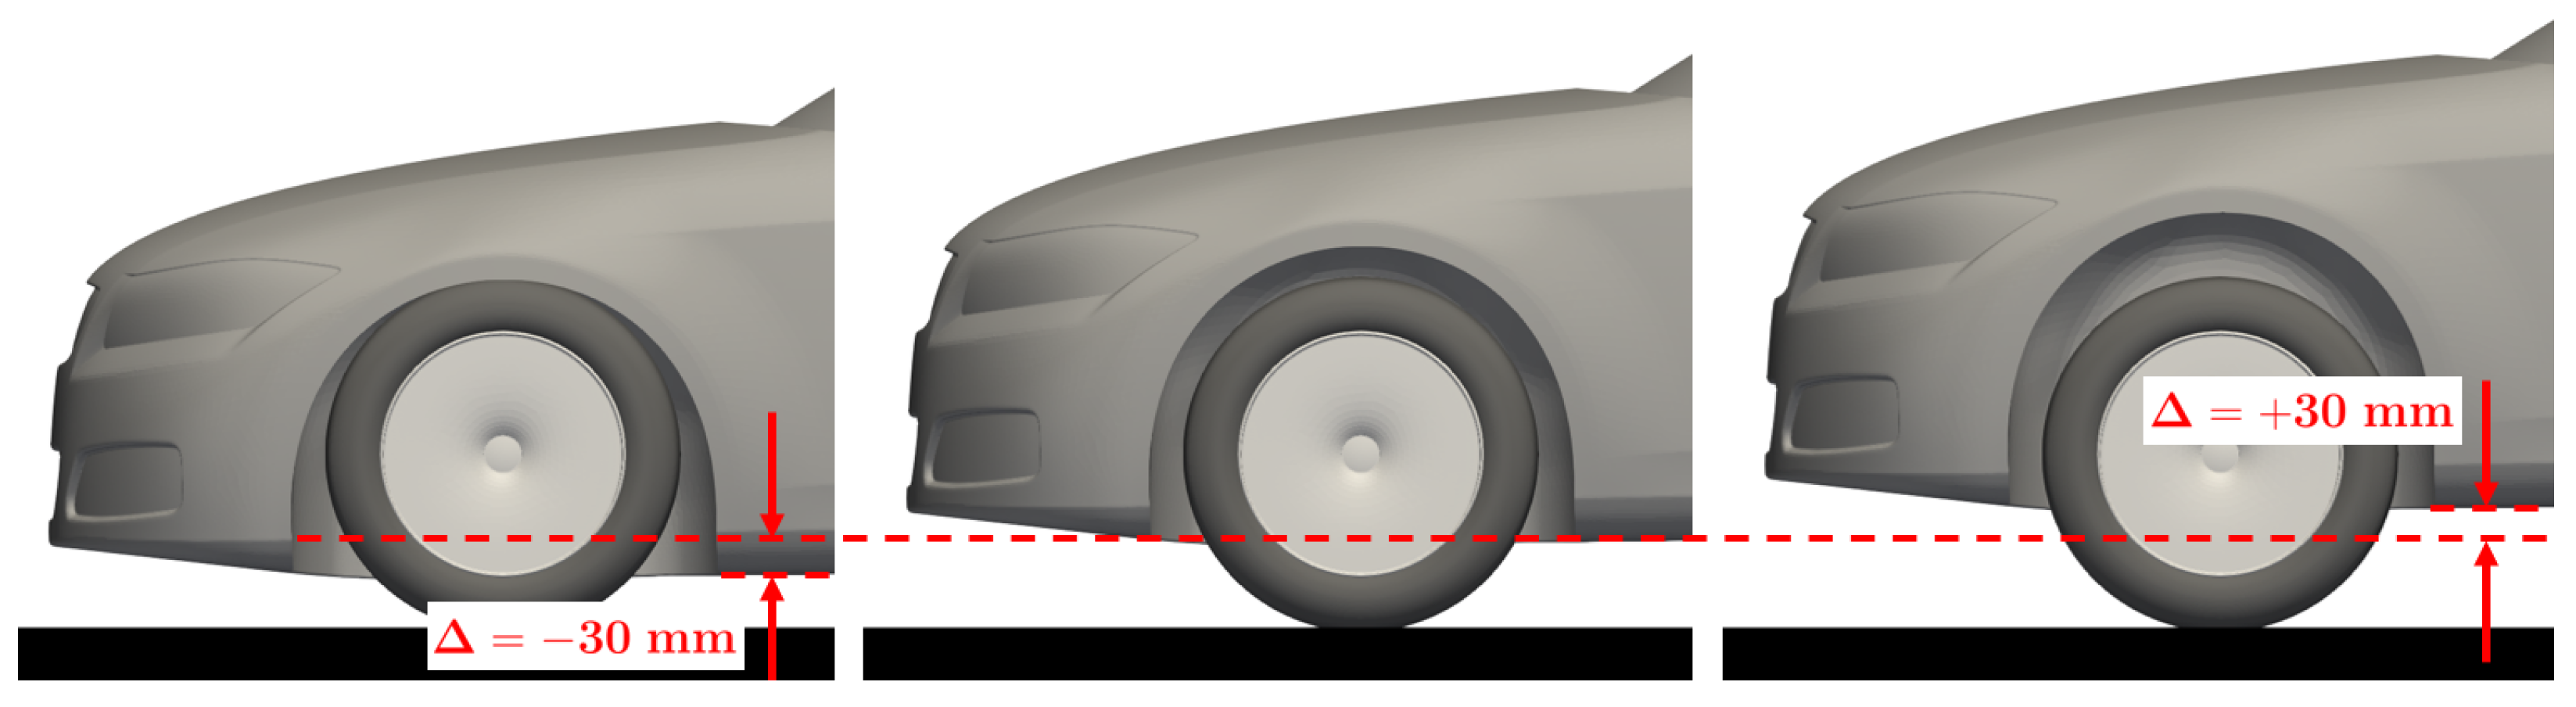
Vehicle ride height effects have been investigated with three levels. The ride height is typically measured between the top part of the front and rear wheelhouses and the ground. Usually, ride heights differ for the front and the rear part. In this work, no pitch variations are considered, thus a single value for ride height changes is enough to describe the position of the vehicle, starting from a reference configuration (Table 1).
Changes in vehicle ride height are applied vertically translating the entire vehicle body. For this study, values of +30 mm (lifted or p3) and −30 mm (lowered or m3) are used for the vertical translation. Three groups of simulations have been generated with these ride height variations and they differ in their starting (or baseline) configuration. The three starting configurations are: vehicle with standard ride height and standard undeformed tires, vehicle with standard ride height and deformed tires, vehicle with lowered height resulting from deformed tires with deformation level D2. The whole process of changes in ride height is represented in Figure 5.
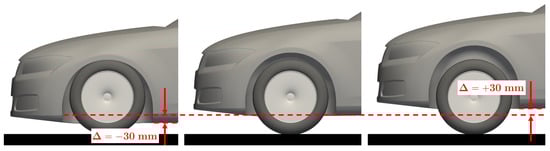
Figure 5.
Ride height levels: lowered (left), baseline (centre), lifted (right).
2.3. Combined Effect
The last set of configurations consists in combining tire deformation and the resulting change in vehicle ride height. The assumption is that the suspensions are not affected by this modification, thus the exact amount of deformation of the tire is applied to the vehicle body (resulting in an equivalent ride height change). A schematics of this geometry modification is provided in Figure 6.
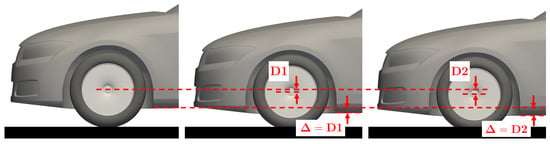
Figure 6.
Tire deformation and vehicle ride height combined: baseline (left), deformed and lowered with D1 (centre), deformed and lowered with D2 (right).
Results are always compared for configurations that belong to the same group (only one parameter variation or both) because in this way consistent comparisons could be made. Thus, all the plots and charts provided use the names B, p3, m3, D1 and D2 to refer to Baseline, lifted by 30 mm, lowered by 30 mm, deformed with level D1 and deformed with level D2. In the cases with tire deformation and ride height variations combined, D1 and D2 include also the effect on the car height.
A subset of the initial simulations has also been tested with the detailed underbody and those configurations are presented in the results section, when available.
All the tests are performed with slick tires and closed rims. This choice is related to the intention of trying to reduce the impact of the ventilation effect from the rim or the modifications in the flow induced by tire features (longitudinal and lateral grooves). Those features would certainly increase the level of detail in the simulations, but also the complexity of the phenomena under analysis, possibly hiding some of the characteristics of the mutual interaction between tire deformation and vehicle ride height. For the scope of this investigation, the choice of slick tires and closed rims is enough and detailed tire geometries and open rims could be considered in future investigations.
3. Numerical Setup
The simulations presented in this work have been run with the open source CFD software OpenFOAM v2106 developed by ESI. It is based on the Finite Volume Method to solve the Navier Stokes equations and the incompressible Delayed Detached Eddy Simulation (DDES) [20] approach has been used. This is an hybrid approach that combines a Reynolds-Averaged Navier Stokes (RANS) formulation near the walls and a Large Eddy Simulation (LES) far from the walls.
3.1. Governing Equations
Starting from the Navier Stokes equations, the RANS formulation results from the application of the Reynolds decomposition into the momentum equations. As a consequence, a time averaged mean and a fluctuating part are used to describe a generic quantity . A time averaging is then applied, yielding:
The term represents the Reynolds Stresses, namely the additional unknowns resulting from the averaging process. Through the Boussinesq hypothesis, the Reynolds Stresses are linearly dependent on the mean shear rate :
Thus, the turbulence contribution is modelled through , an artificial viscosity evaluated with turbulence models. The LES counterpart does not rely on averaging but on filtering. In whis way, a generic quantity is split into a smoothed part and an undresolved part , modelled with a subgrid-scale (SGS) model. The LES equations resulting from the filtering of Navier Stokes equations are:
The term containes additional unknowns, namely the influence of the subgrid-scale turbulence on the part of the flow field that is resolved. They are named SGS stresses. As for Reynolds stresses, a linear dependency on the filtered shear rate is assumed and to calculate the eddy viscosity , a SGS model is required.
Equations (1) and (3) are coupled when a DES model (or a derived one such as DDES) is used. The choice of a hybrid approach is due to the need of a LES description in separated regions for higher accuracy, while limiting the computational cost near walls thanks to the RANS formulation that requires a lower wall resolution. The Spalart-Allmaras [21] turbulence model has been used to close the system. The advantages of a hybrid RANS-LES approach are a more precise absolute prediction and more reliable relative predictions when comparing different configurations (deltas) [11,12,22,23]. For the numerics, pure second order schemes for both spatial and time discretizations are used. The reasons for using slick tires and closed rims have been discussed in previous sections. From the computational setup point of view, this choice brings some simplifications from the boundary conditions point of view, described in the next section.
3.2. Grid and Boundary Conditions
The meshing procedure has been automated using snappyHexMesh (from the OpenFOAM toolbox) after several checks on quality and robustness of the resulting grid.
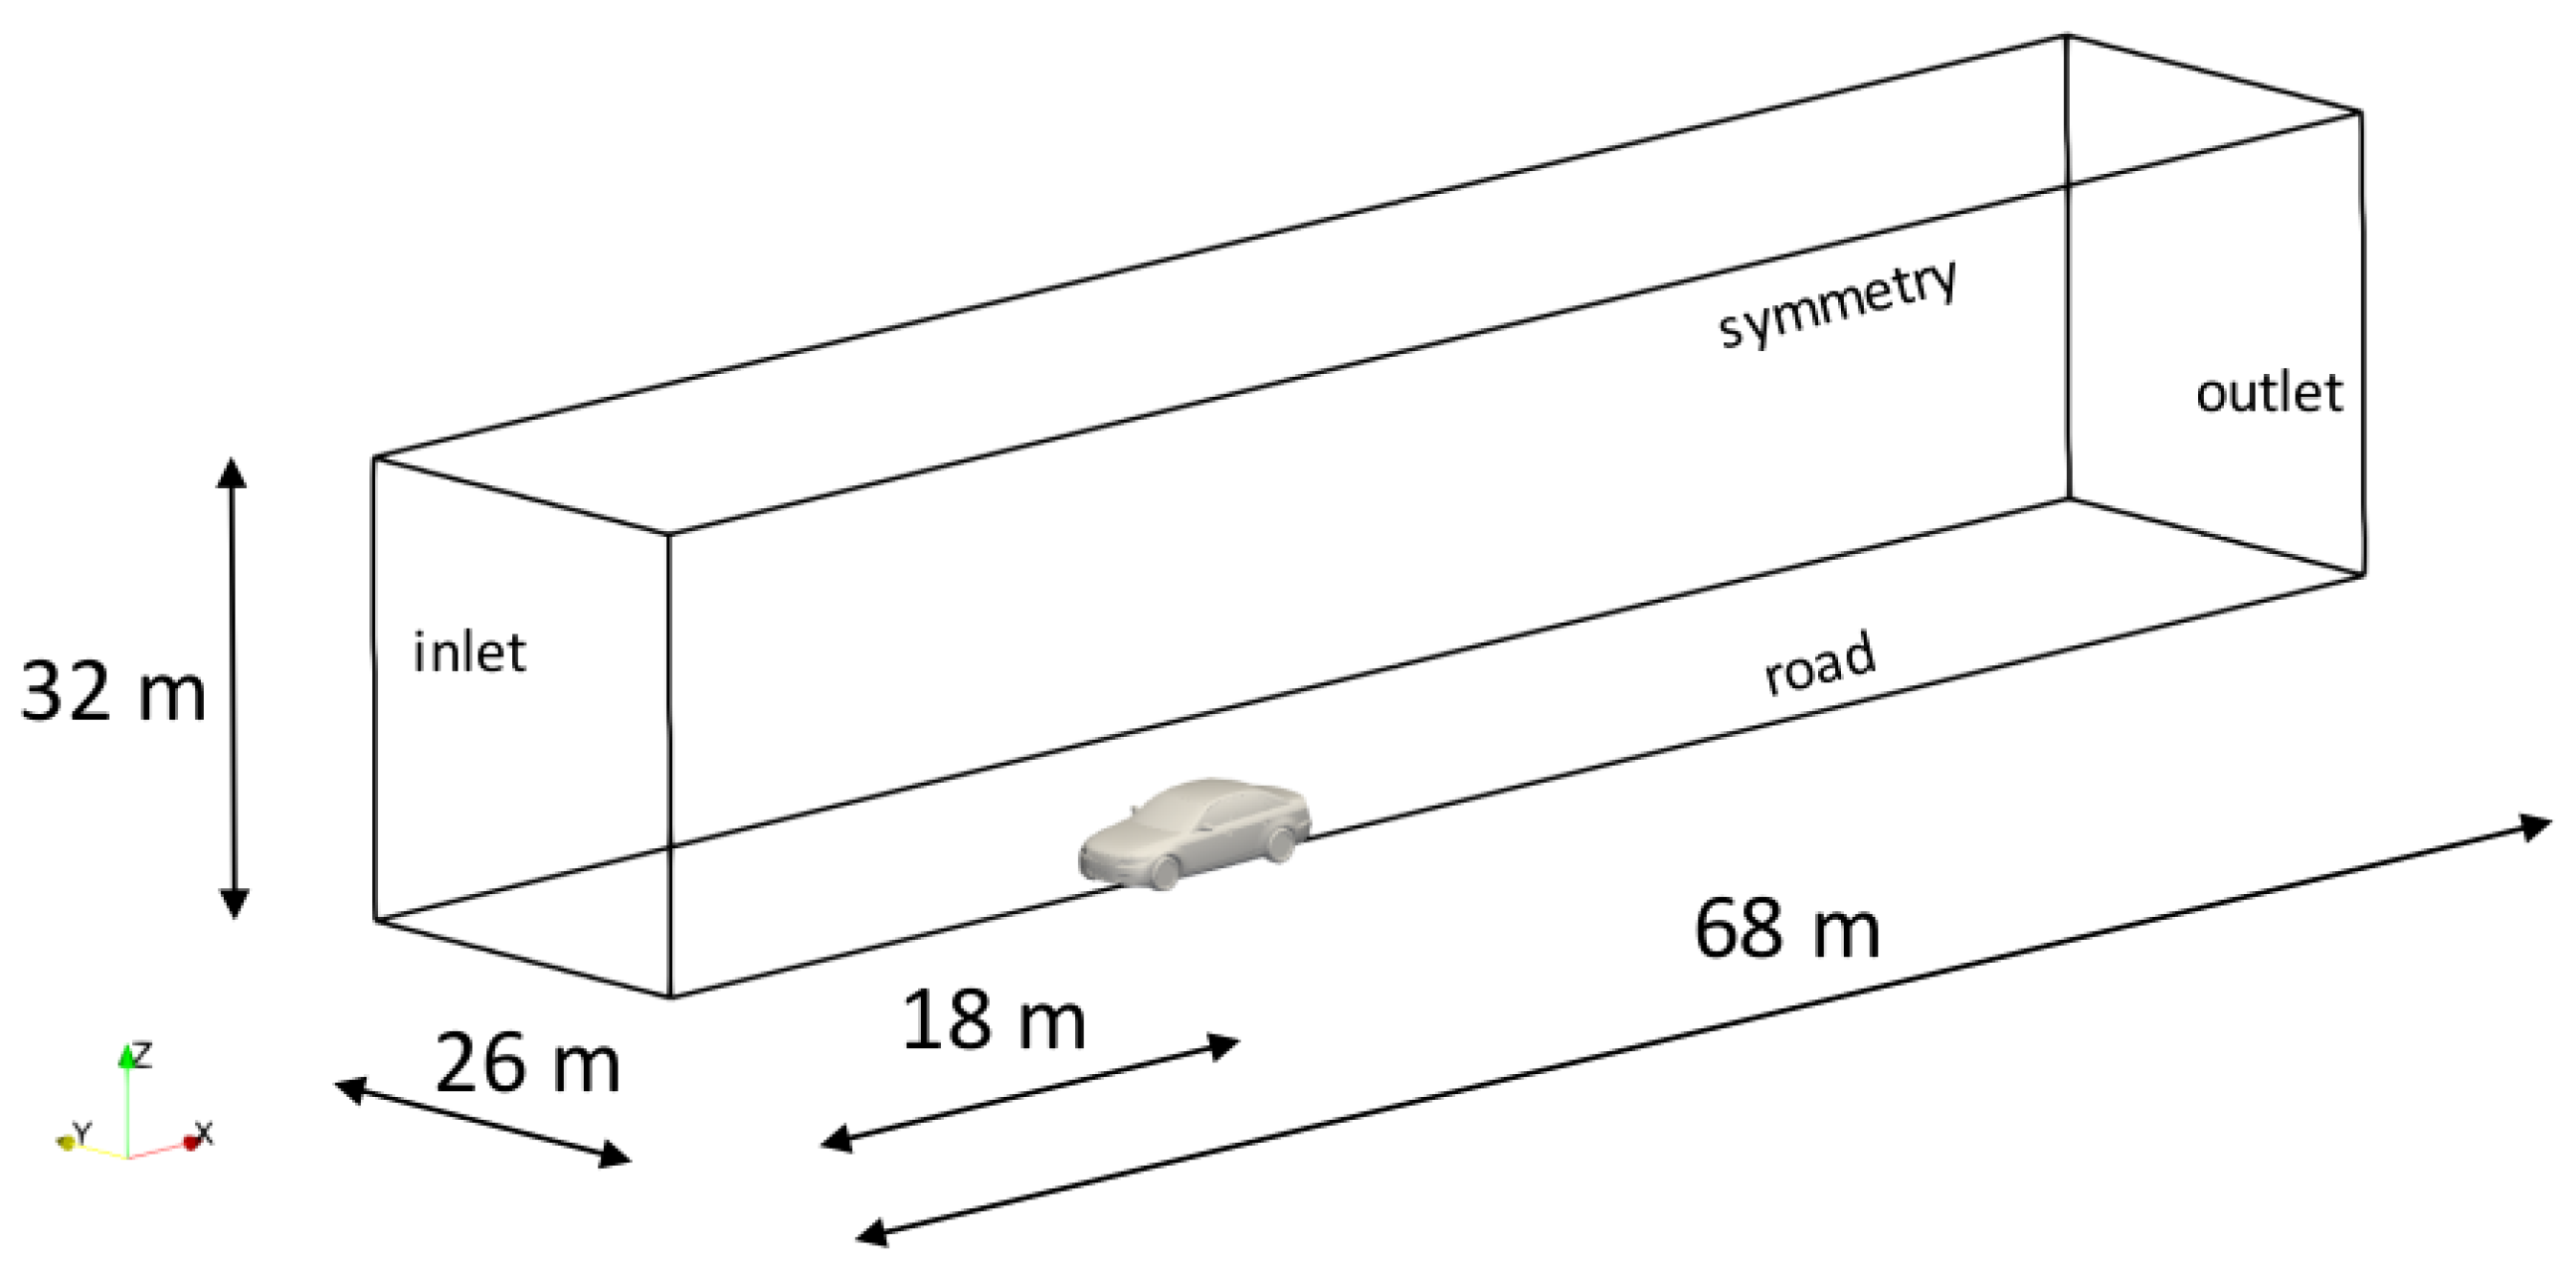
The schematics of the computational domain is presented in Figure 7 together with the boundary conditions used. The domain size is: 68 m × 26 m × 32 m, corresponding to 15 L × 6 L × 7 L, with L the length of the DrivAer. This allows for a low blockage ratio (e < 0.5 for the AeroSUV, namely the vehicle with the bigger frontal area). The vehicle is positioned at 18m from the inlet (approximately 4 L) and the tests are done at U = 38.889 m/s, resulting in a Reynolds number L.
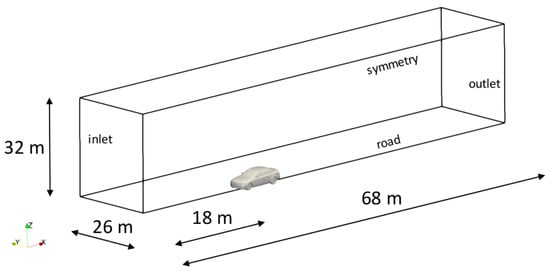
Figure 7.
Schematics of the computational domain (symmetry). Size and boundary conditions.
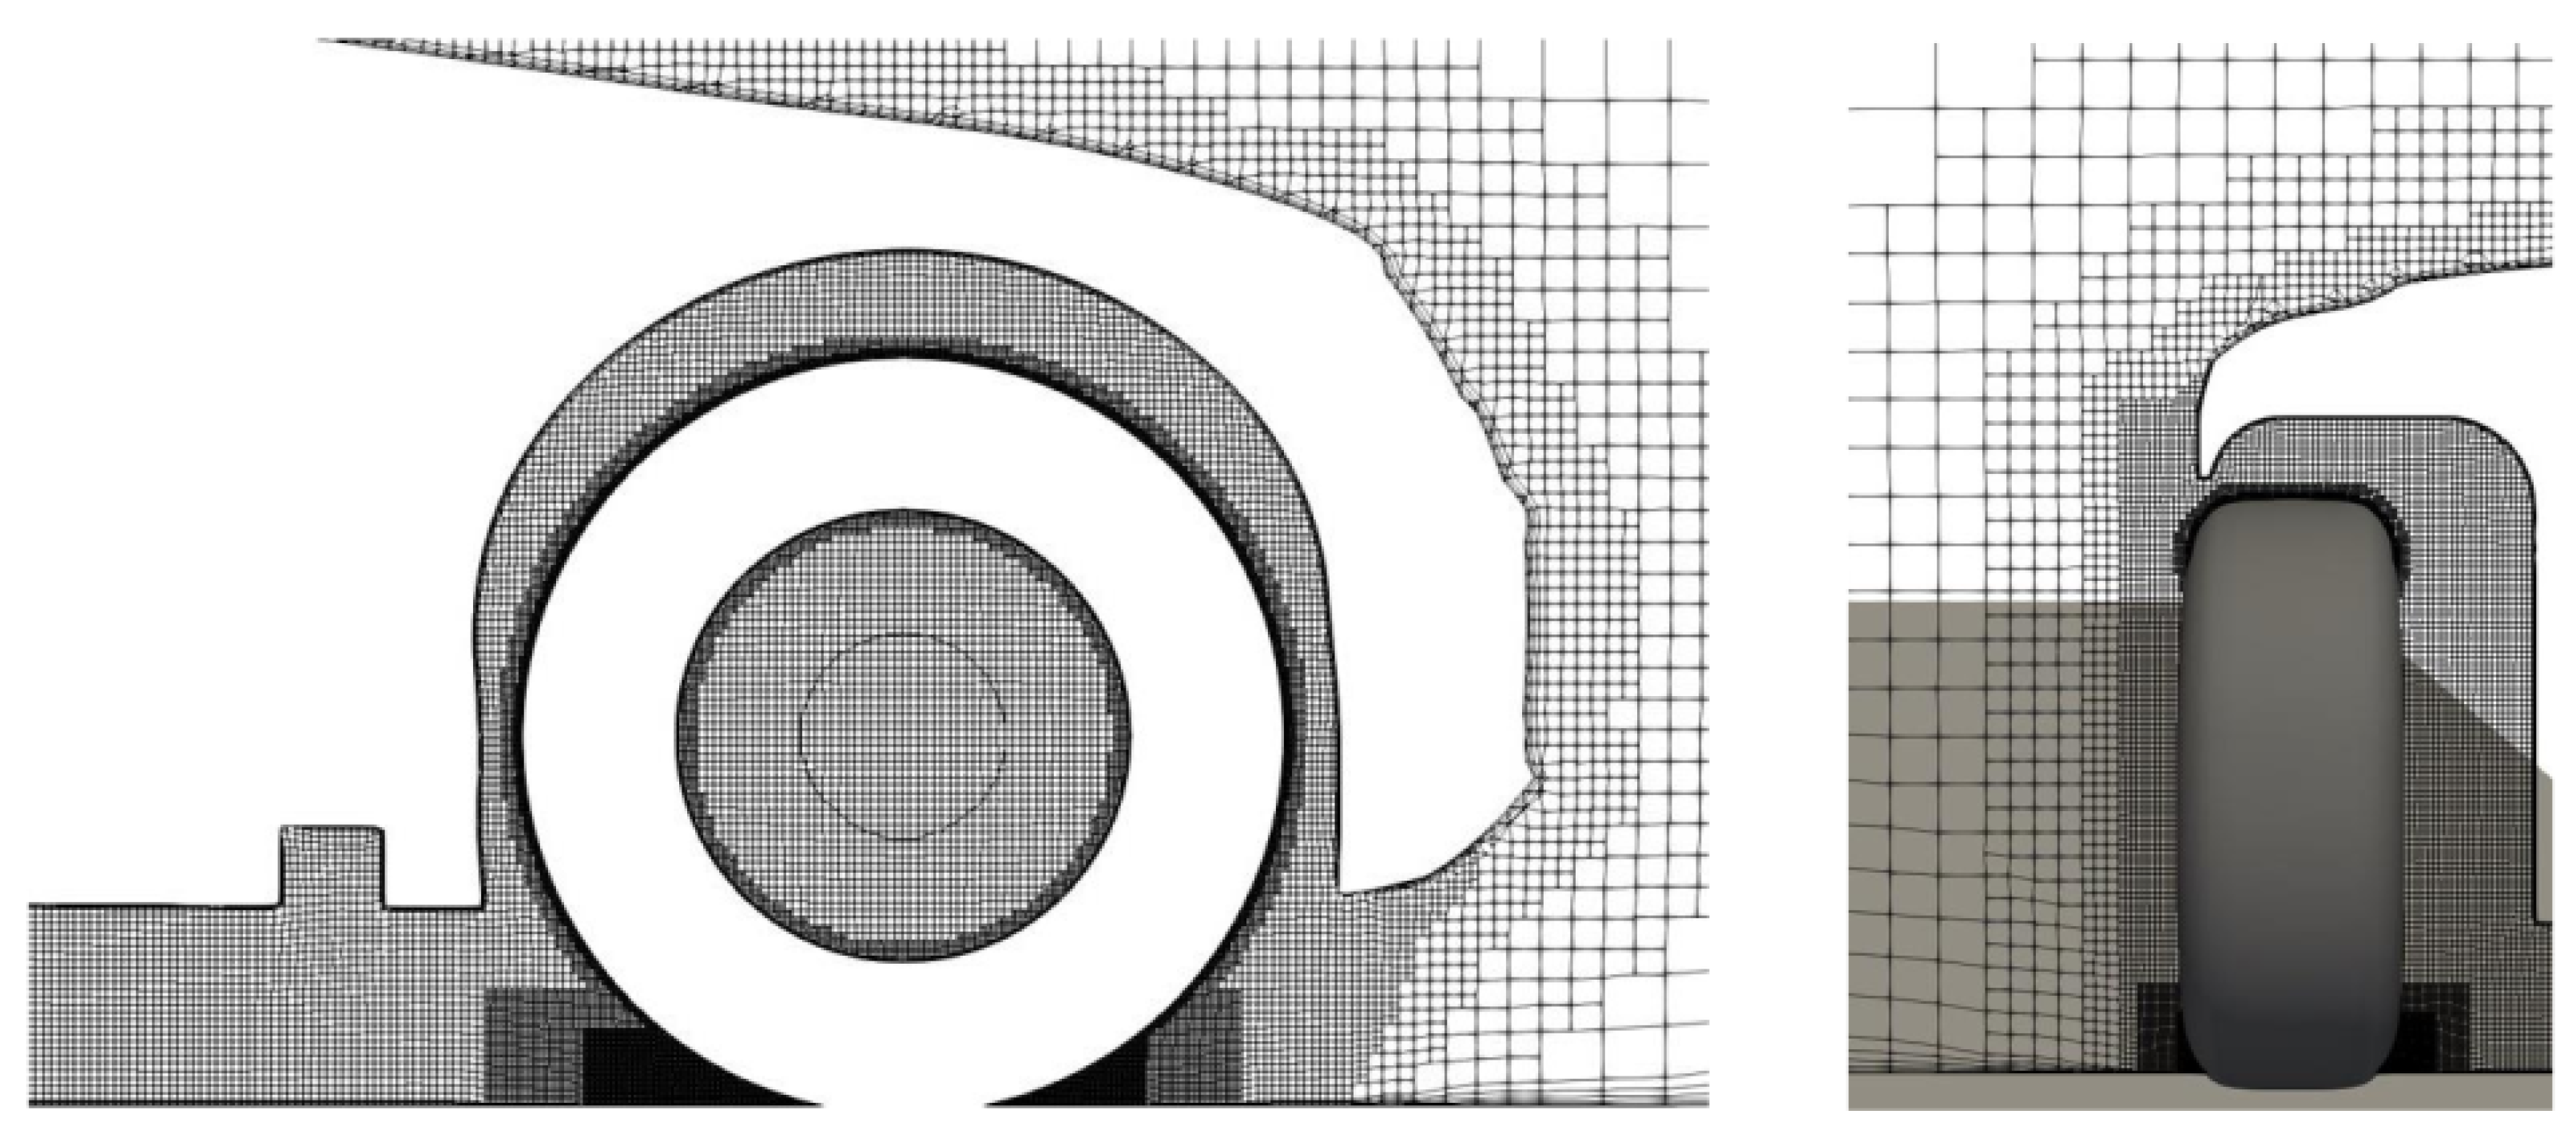
The computational grid captures the car surface and all its features, with a surface resolution up to 4 mm and y in the range [30, 100]. Additional parts treated with specific attention are the wheels, wheel houses and the wake. As for the wheels, the surface resolution goes up to 2 mm and y< 10. Wheel house regions have been highly refined, as well as the regions affected by wheel wake. Refinement regions have been placed to accurately capture all the main flow structures that develop around a wheel [7,13]. The maximum refinement level has been applied to the contact patch region. Figure 8 shows where the refinements for the wheel region have been applied.

Figure 8.
AeroSUV wheel mesh details: side view (left), front view (right).
The contact patch region is critical for the simulation because it is where low quality cells typically form. They may impair both solution convergence and accuracy. By putting special attention to the contact patch, the mesh quality remains high, the simulation runs properly and solutions such as a plinth are not necessary. A plinth is an additional flat geometry to be positioned around the contact patch to remove the sharp angle with the ground. Anyway, it introduces modifications to the flow. Without the plinth, the contact region is treated in a realistic way. This is important for slick tires, but fundamental for grooved tires, where the flow inside the grooves should be simulated.
Table 2.
Boundary conditions used in the simulations.
At the inlet, velocity is fixed as well as nuTilda. The turbulence intensity is I = 0.25% and the turbulence length scale is l = 5 m. At the outlet, the pressure is fixed and all the other quantities are treated with the zeroGradient condition that sets on the boundary the internal field value. The boundary named sides includes the lateral boundaries and the top boundary. They have been described with the symmetry condition. The cases with smooth underbody has a symmetry plane, but in OpenFOAM this condition also works as free shear for sufficiently far boundaries.
Wheel rotation is modelled with the addition of a tangential velocity component to the surface of the wheel, namely a rotating wall boundary condition. A rotational speed and the axis of rotation should be provided. The rotational speed depends on the diameter of the wheel and is evaluated as:
where is the free stream velocity and is the deformed wheel radius. To keep the relative motion between wheels and ground, the latter is treated as a translating wall moving with the free stream velocity. On the car surface, the adherence condition holds for velocity (noSlip in OpenFOAM) and a zero gradient has been applied to the other quantities. On the walls (wheels, ground and car), wall functions have been applied, as reported in Table 2. The y condition has been checked to ensure the correct application of wall functions.
3.3. Data Extraction and Validation
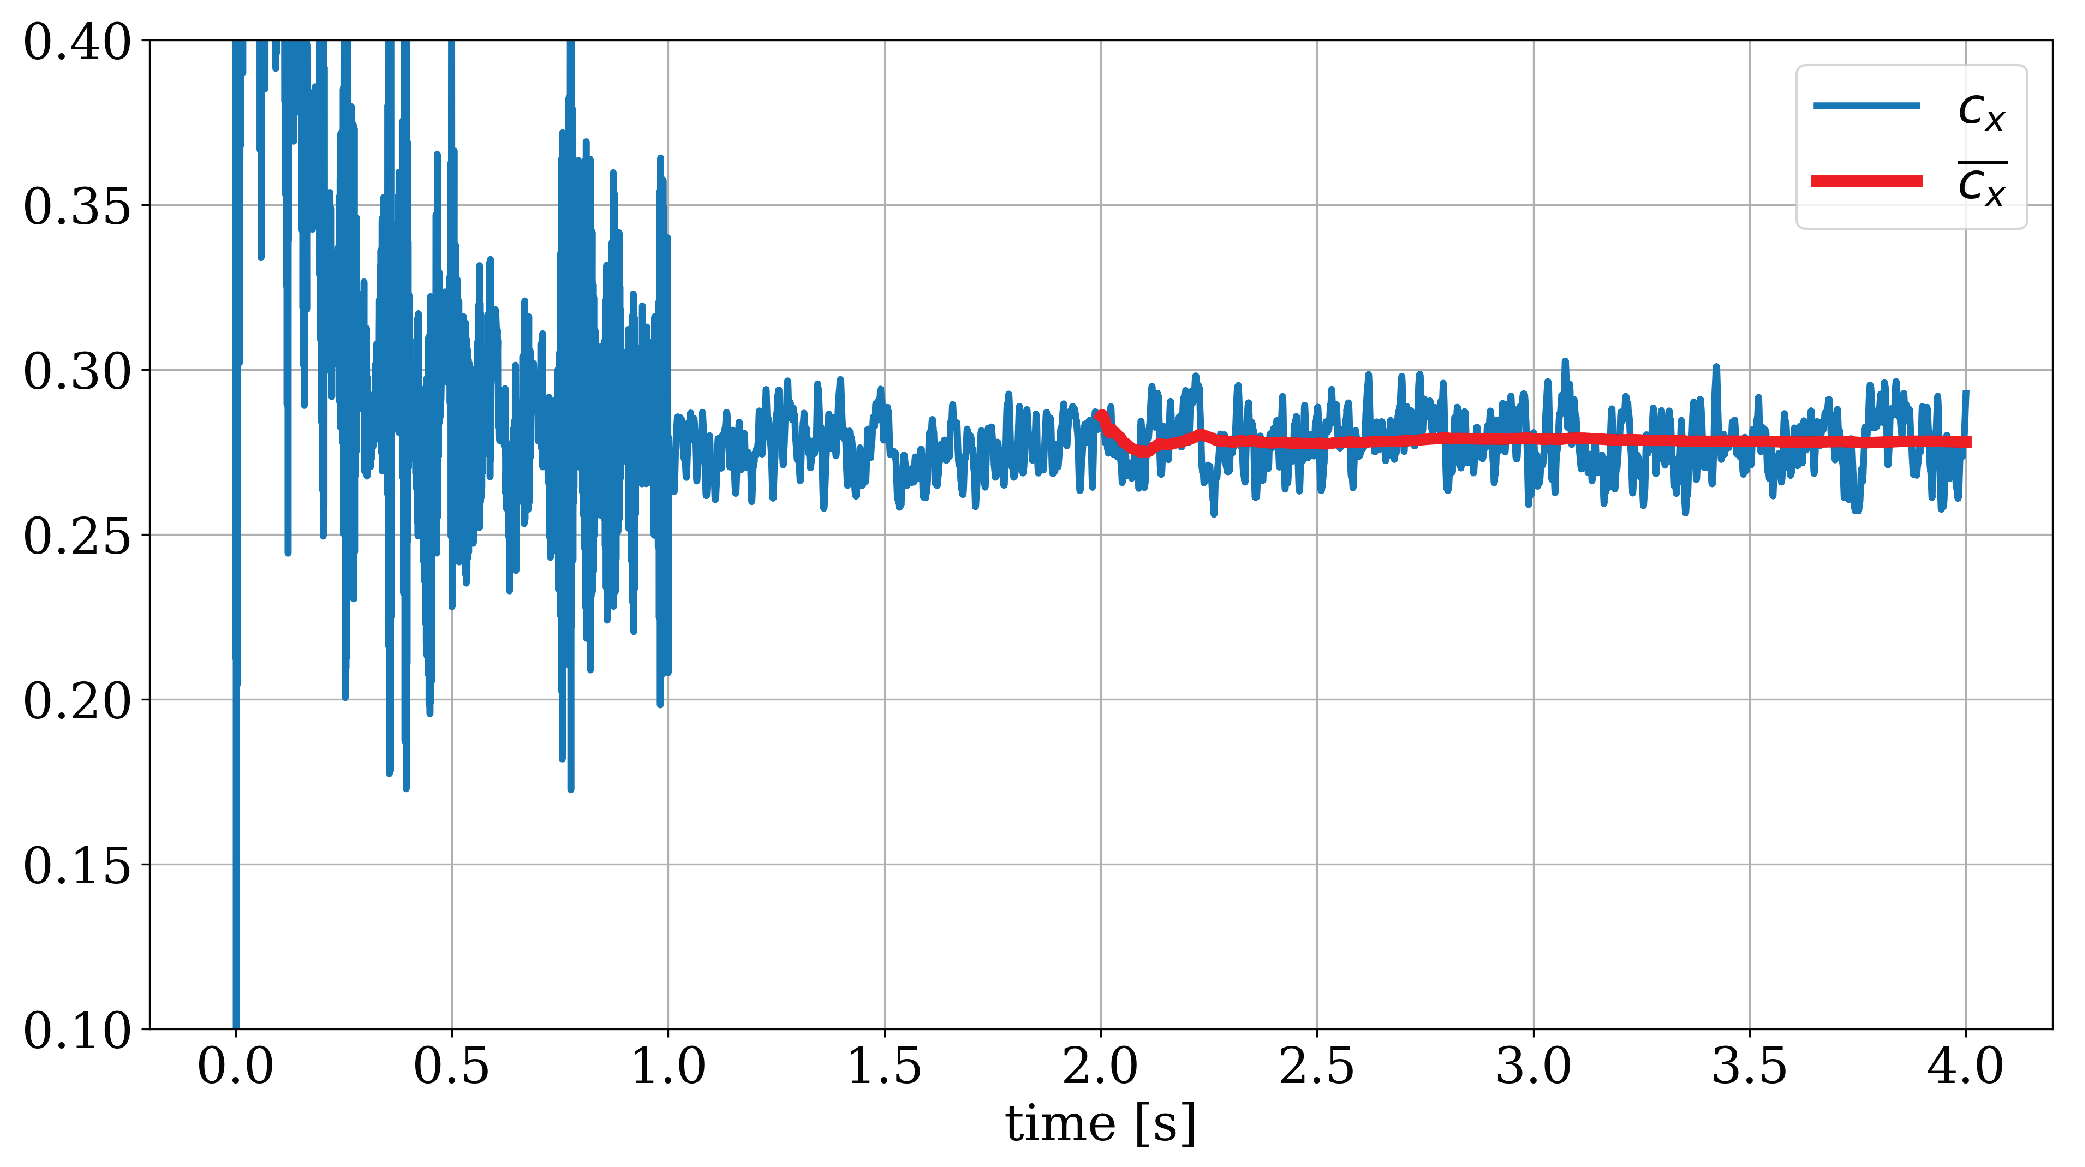
The flow has been simulated for four seconds, with averages performed on the last two seconds. The solution is always initialized with a potential solver and a velocity damper helps stabilizing the computation when large time steps are used, namely in the first part of the simulation. All the results presented in this work are based on an average process performed by sampling flow data in the last two seconds of the simulation. Figure 9 shows how the mean drag coefficient is extracted and demonstrates that the solution has converged, reaching a stable mean drag value ( count).
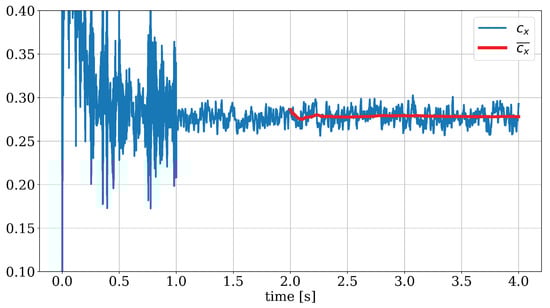
Figure 9.
Time history of and extraction of the average value .
The aerodynamic coefficients have been computed according to the relations:
where , are the aerodynamic forces, the aerodynamic moments, is the air density, U is the relative wind speed, the wheelbase of the vehicle and is the projected frontal area. Its value is reported in Table 1 for both DrivAer and AeroSUV.
To validate the simulation methodology, results for the baseline configurations of the DrivAer and the AeroSUV have been compared with experimental tests (or simulations) available in literature. Table 3 collects the validation data for the DrivAer, while Table 4 for the AeroSUV.
Table 3.
DrivAer validation data.
Table 4.
AeroSUV validation data.
4. Results
The results for all the cases are presented and discussed in this section. At first, the single effects are described, comparing smooth and detailed underbody, when available. Then, the effect of the parameters combined is presented. The flow field is investigated to understand where the most interesting flow modifications are located and how they affect the aerodynamic drag. The comparison is based on drag area values and not on the drag coefficient to remove the dependency on the frontal area that is continuously changing. Using instead of allows to directly compare the longitudinal force on the vehicle. The results are compared for configurations that belong to the same group (only one parameter variation or both) because the variation applied to ride height when this parameter is treated alone is more than the ride height change when tire deformation is also considered. To consistently compare configurations for the three sets of parameters with the available data, a linear relationship between ride height changes and drag changes should be assumed, but there is no data to support this.
4.1. Vehicle Ride Height
At first, the effects of ride height changes are analysed. Previous studies [13] have shown that reducing the ground clearance of a vehicle brings a decrease in drag and the opposite is obtained when ground clearance is increased, at least around common values for passenger cars. This behaviour has been consistently predicted by simulations.
Figure 10 and Figure 11 show the effect of ride height changes on the drag area. In the plots, the columns are always referenced to the baseline vehicle configuration (DrivAer or AeroSUV with baseline ride height, baseline wheels) with smooth underbody. Among the configurations, the best solution is always the setup with the lowest ground clearance. The starting point (reference vehicle height to which the delta in ride height is applied) does not affect the direction of the trend and seems not to affect much its intensity as well. All the configurations with deformed wheels show more drag than those with undeformed wheels. This finding will be investigated with more detail in the next section. About ±15 drag counts can be expected when changing the ride height of the vehicle by ±30 mm. The delta in drag seems to be almost linear with the change in vehicle ride height, but there are not enough points to support this. For the DrivAer with detailed underbody, from the lowered (m3) to the lifted (p3) configuration, it seems that the trend flattens out, providing a minor drag increase between the baseline and the lifted configuration (approximately only 5 counts). The reasons for this are not clear, but could be related to the aerodynamic behaviour of the detailed underbody, that reaches a certain insensitivity with respect to ground distance.
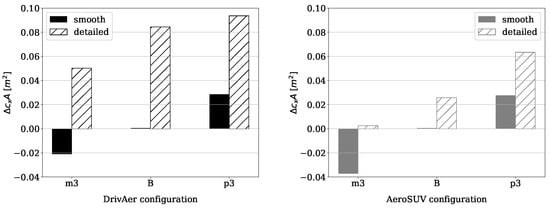
Figure 10.
Ride height effect on the total drag area. Baseline configuration as starting point.
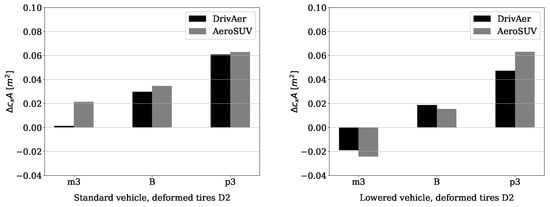
Figure 11.
Ride height effect on the total drag area. Starting configurations: standard vehicle and deformed tires D2 (left), lowered vehicle and deformed tires D2 (right).
Results in Figure 10 (left) show that the DrivAer is quite sensitive to the introduction of a detailed underbody geometry, with the drag increasing by more than 30 counts for all the configurations. This increase was expected: for the baseline configuration it was already present in literature, with values obtained from wind tunnel tests [14]. By comparing the two bar plots in Figure 10, the AeroSUV shows less sensitivity to the underbody with less than 15 counts difference in the worst case.
In Figure 11, different starting configurations are analysed, applying the same ride height change. The plot on the left is obtained with ride height changes applied to a vehicle in its standard height, but with deformed wheels. The plot on the right is obtained with ride height changes applied to a vehicle lowered by the same amount of tire deformation D2, equipped with deformed wheels. It is interesting that the deltas between DrivAer and AeroSUV configurations are similar, even if the car configurations are quite different (especially in ground clearance and wheel size). Figure 11 suggests an almost linear correlation between drag and ground clearance.
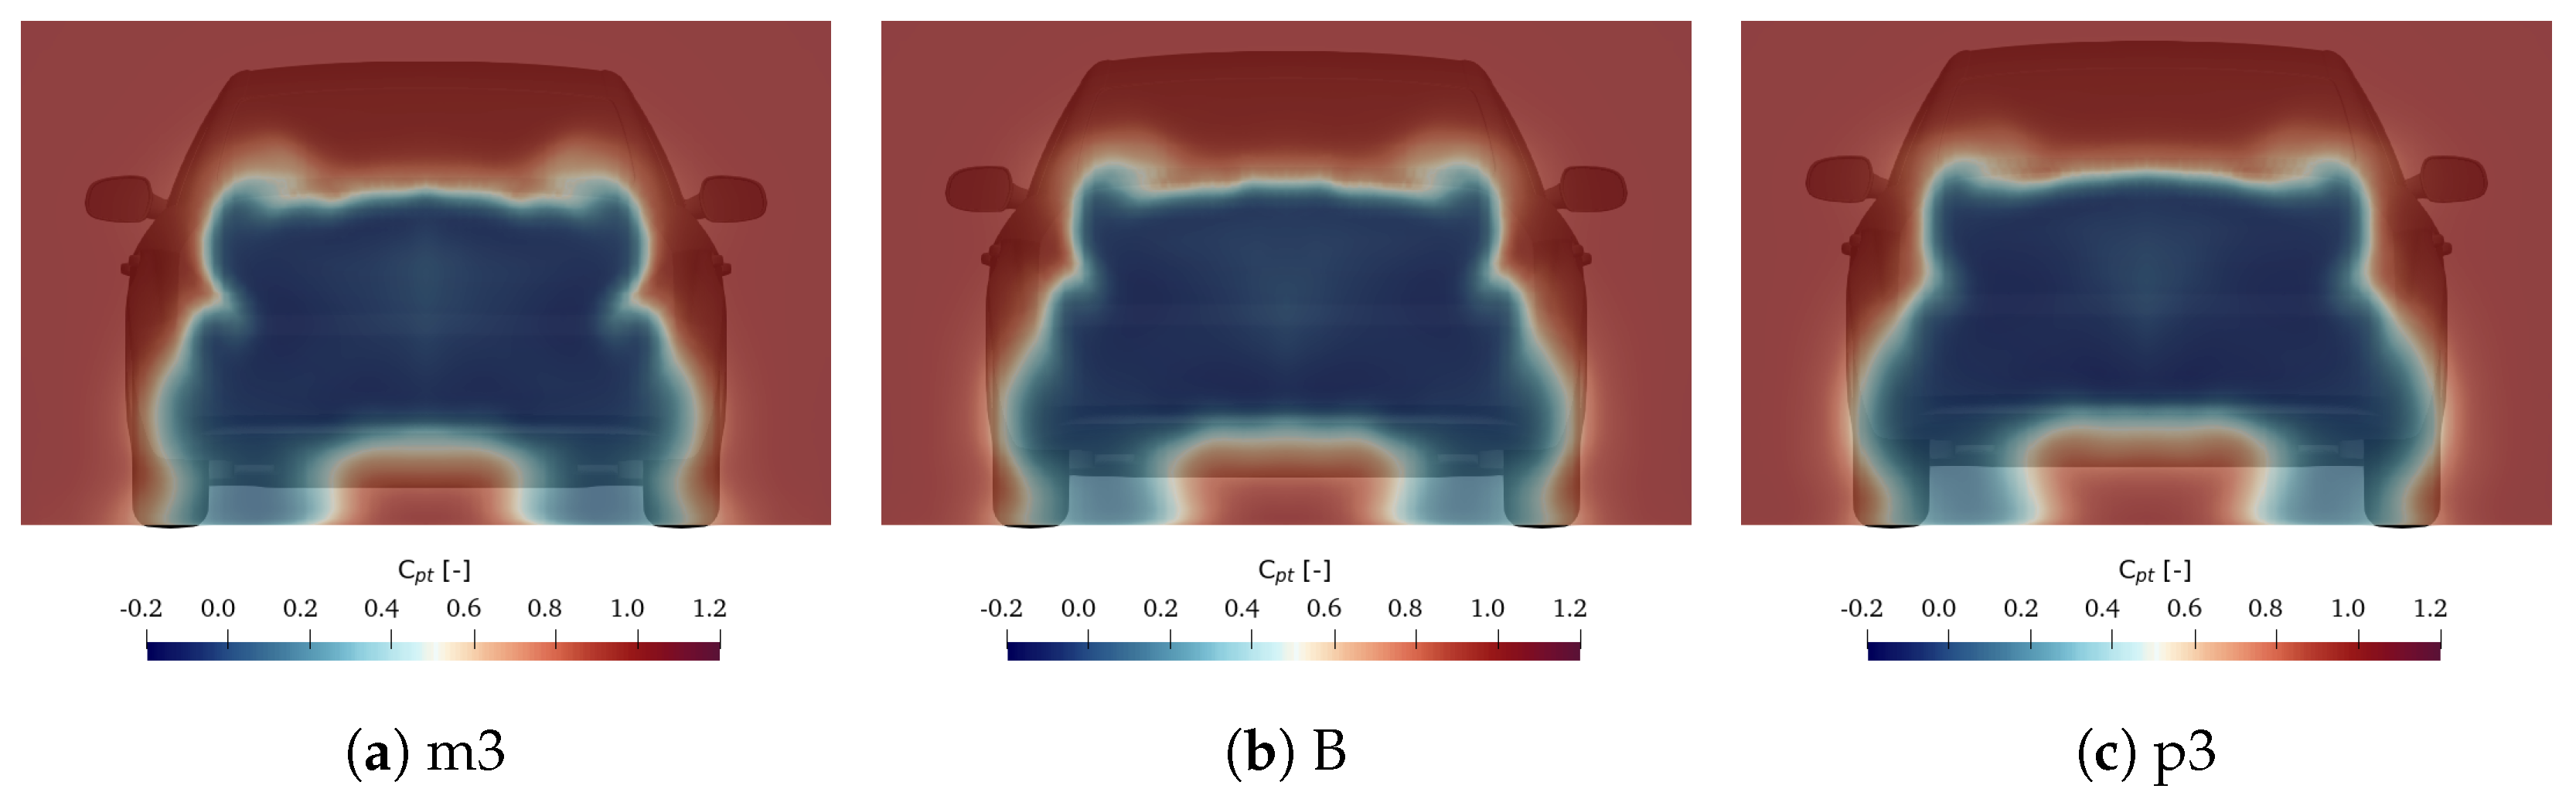
The flow field has been investigated to find the effects of ride height changes. Figure 12 provides the total pressure coefficient in the wake of the DrivAer on a plane located at x = 4.0 m (origin in the middle of the front wheel axis). The upper and central parts of the wake are topologically similar for the three ride heights, but the low energy region increases in size when the vehicle is lifted. In this plane there is no footprint of potential flow separation extending from the rear window. The differences are mainly located in the bottom part of the plots. The underbody flow seems to keep a constant energy, but its footprint keeps shrinking while reducing the vehicle height. The positive effect of a large high energy region seems to be counteracted by a larger low region for the lifted configuration. The other difference is located in the wake of rear wheels. For the lowered model, the wake is more inboard deflected, ensuring less drag for rear wheels but also for the entire vehicle. Increasing the ride height, the wake region is slightly outboard deflected, especially in the central part.
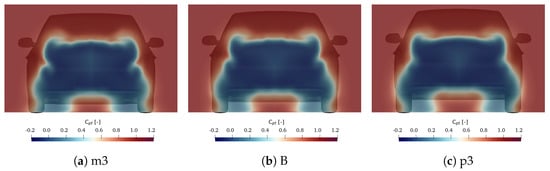
Figure 12.
Total pressure coefficient in the wake of the Notchback DrivAer. Plane at x = 4.0 m.
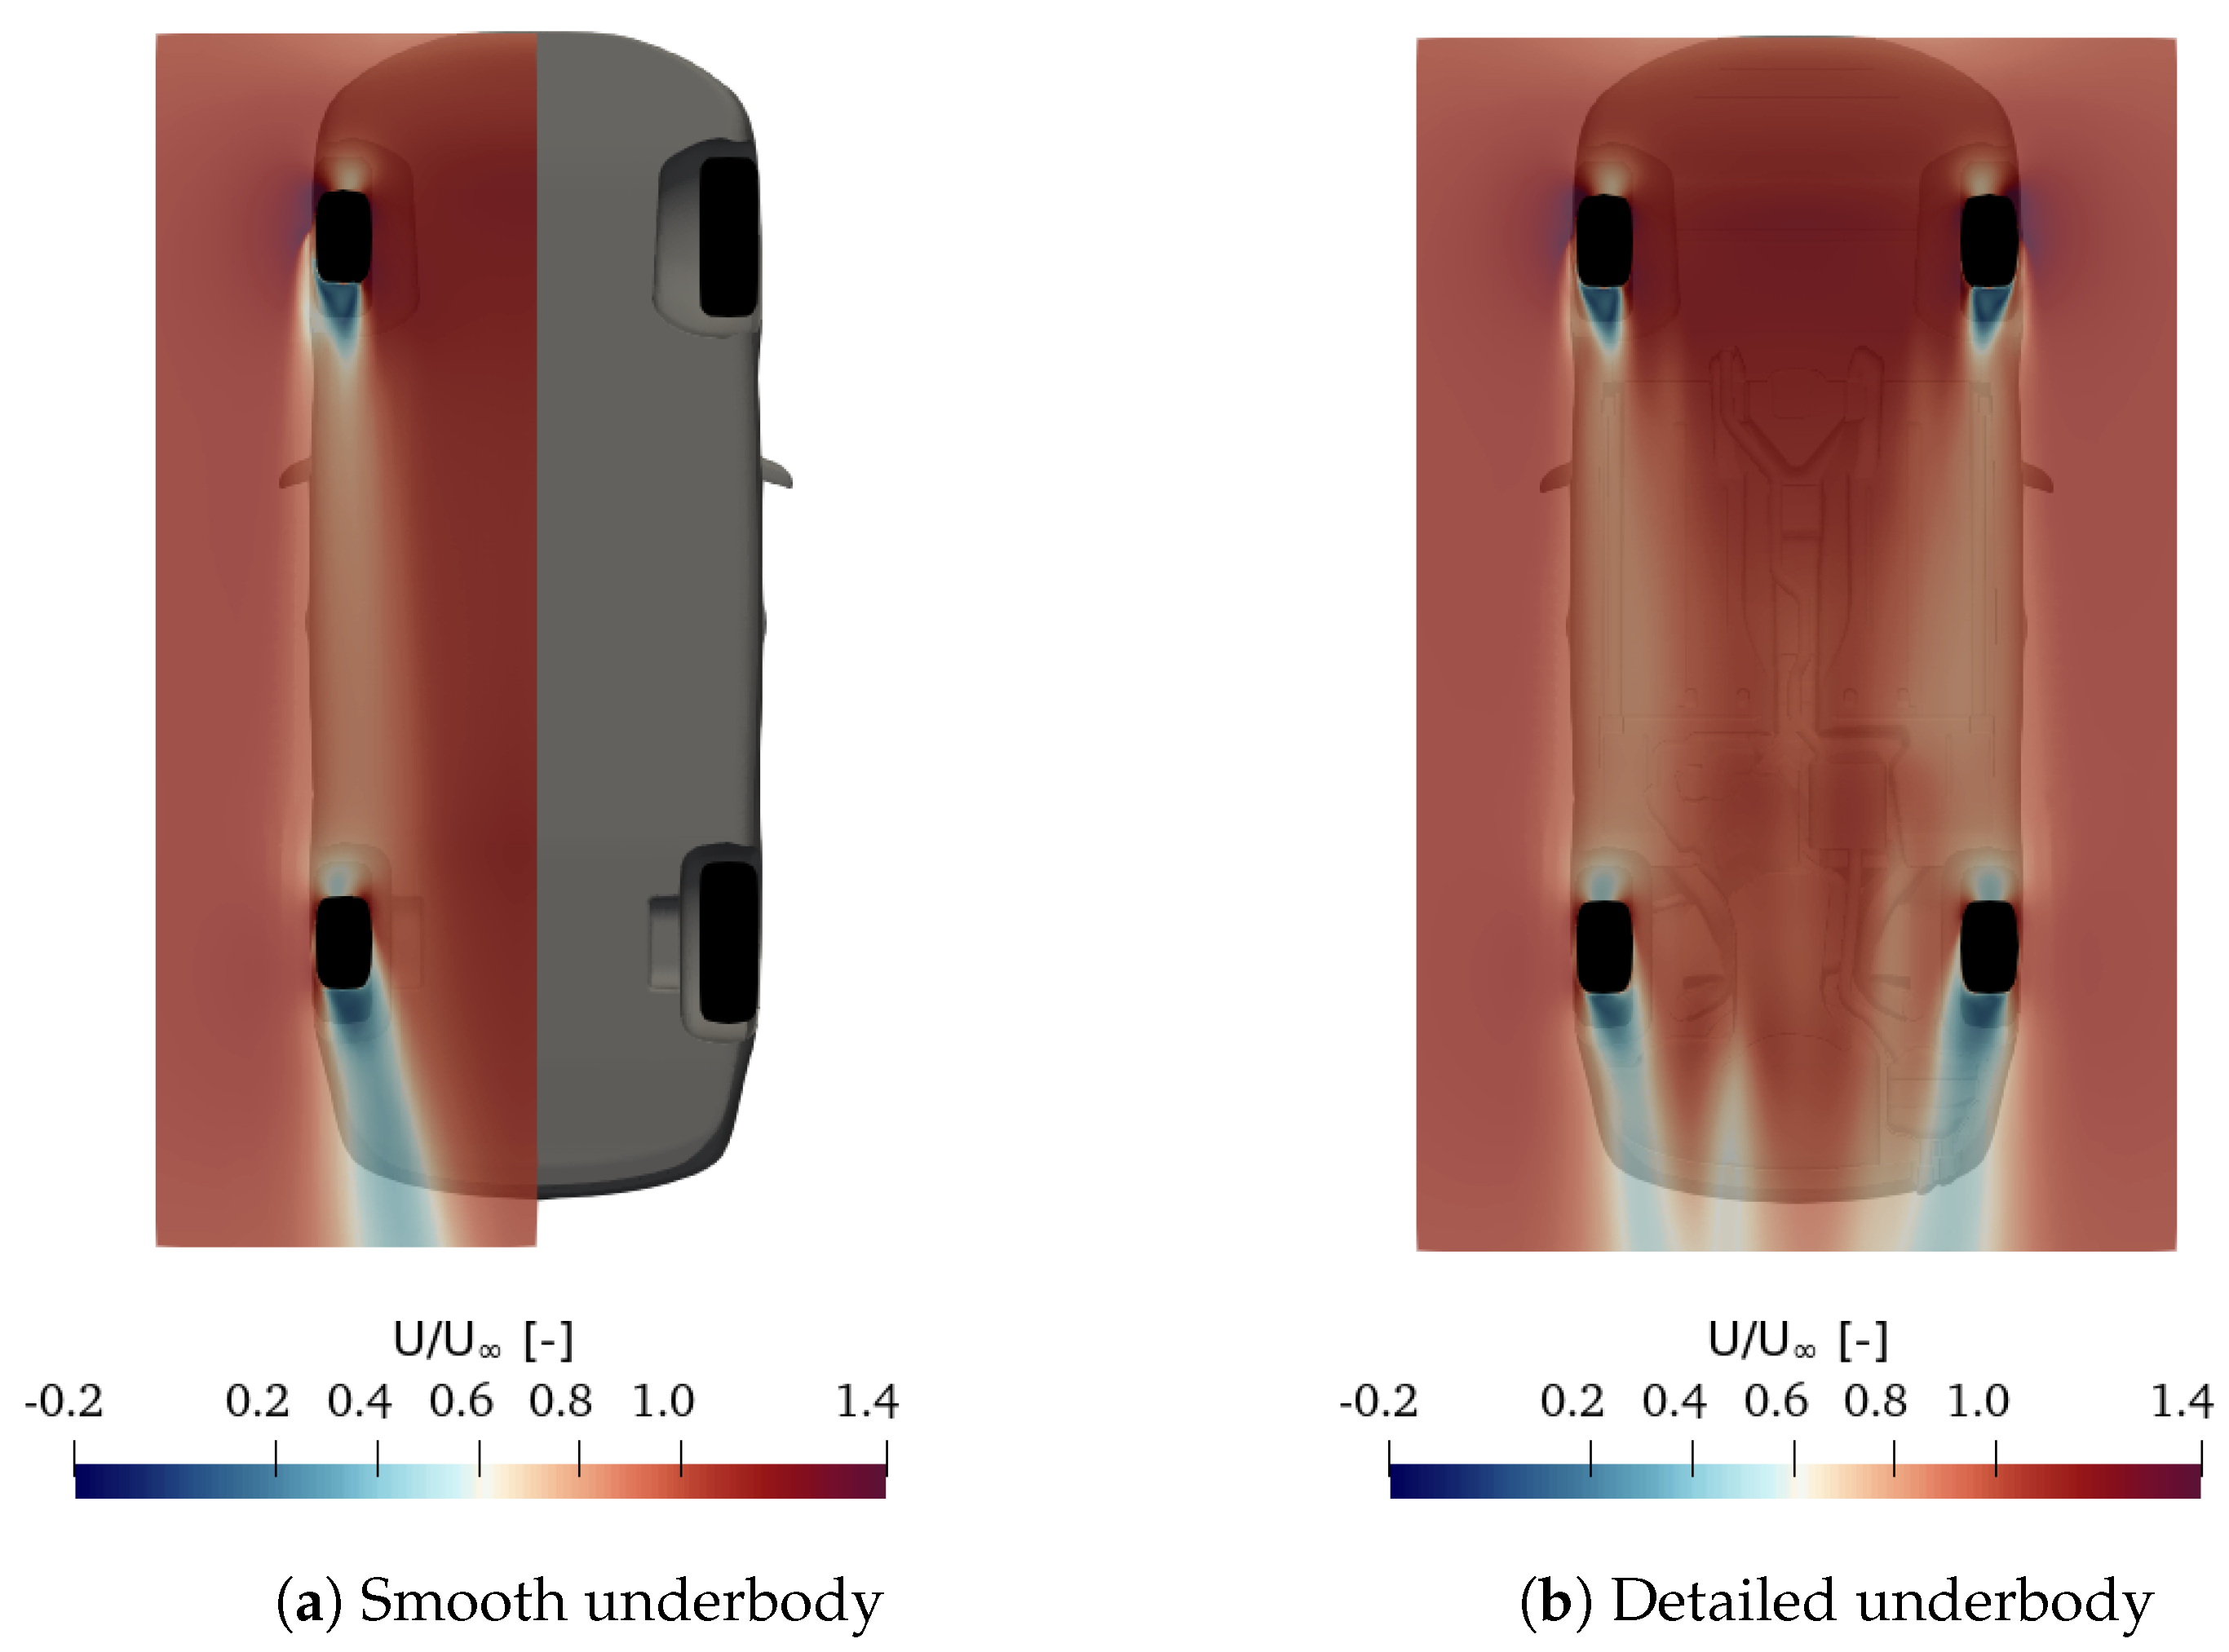
In Figure 13, smooth and detailed underbody are compared for the DrivAer through the normalised velocity magnitude U/U. For the smooth underbody, the wake of the front wheels reaches the rear wheels sharply contoured by regions with higher momentum. For the detailed underbody, the wake of the front wheels shows similar properties, but its surroundings are characterised by lower momentum, probably due to separated flow triggered by the geometrical irregularities. Especially towards the end of the car, a massive separated region is detected. This would explain the high increase in drag for the detailed underbody configuration. As a last note, it should be pointed out that the detailed underbody geometry is asymmetric.
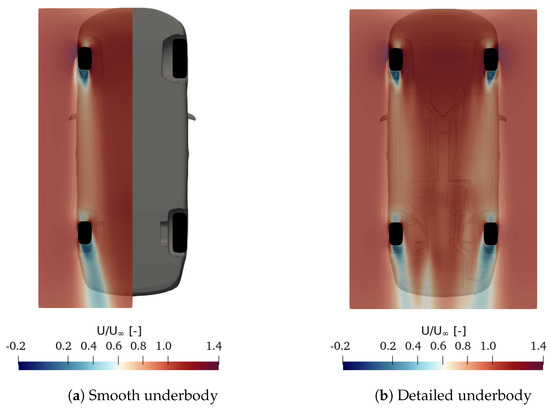
Figure 13.
Normalised velocity magnitude. Plane at Z = 0.05 m. Notchback DrivAer.
When the ride height variation is applied, some aspects of the car change significantly: tire exposed frontal area, interaction between underbody and ground, wheel house volume. These setup modifications then influence the flow field and produce the gains or losses in aerodynamic performance that have been observed. In this work, only the first two are investigated.
4.1.1. Tire Exposed Area
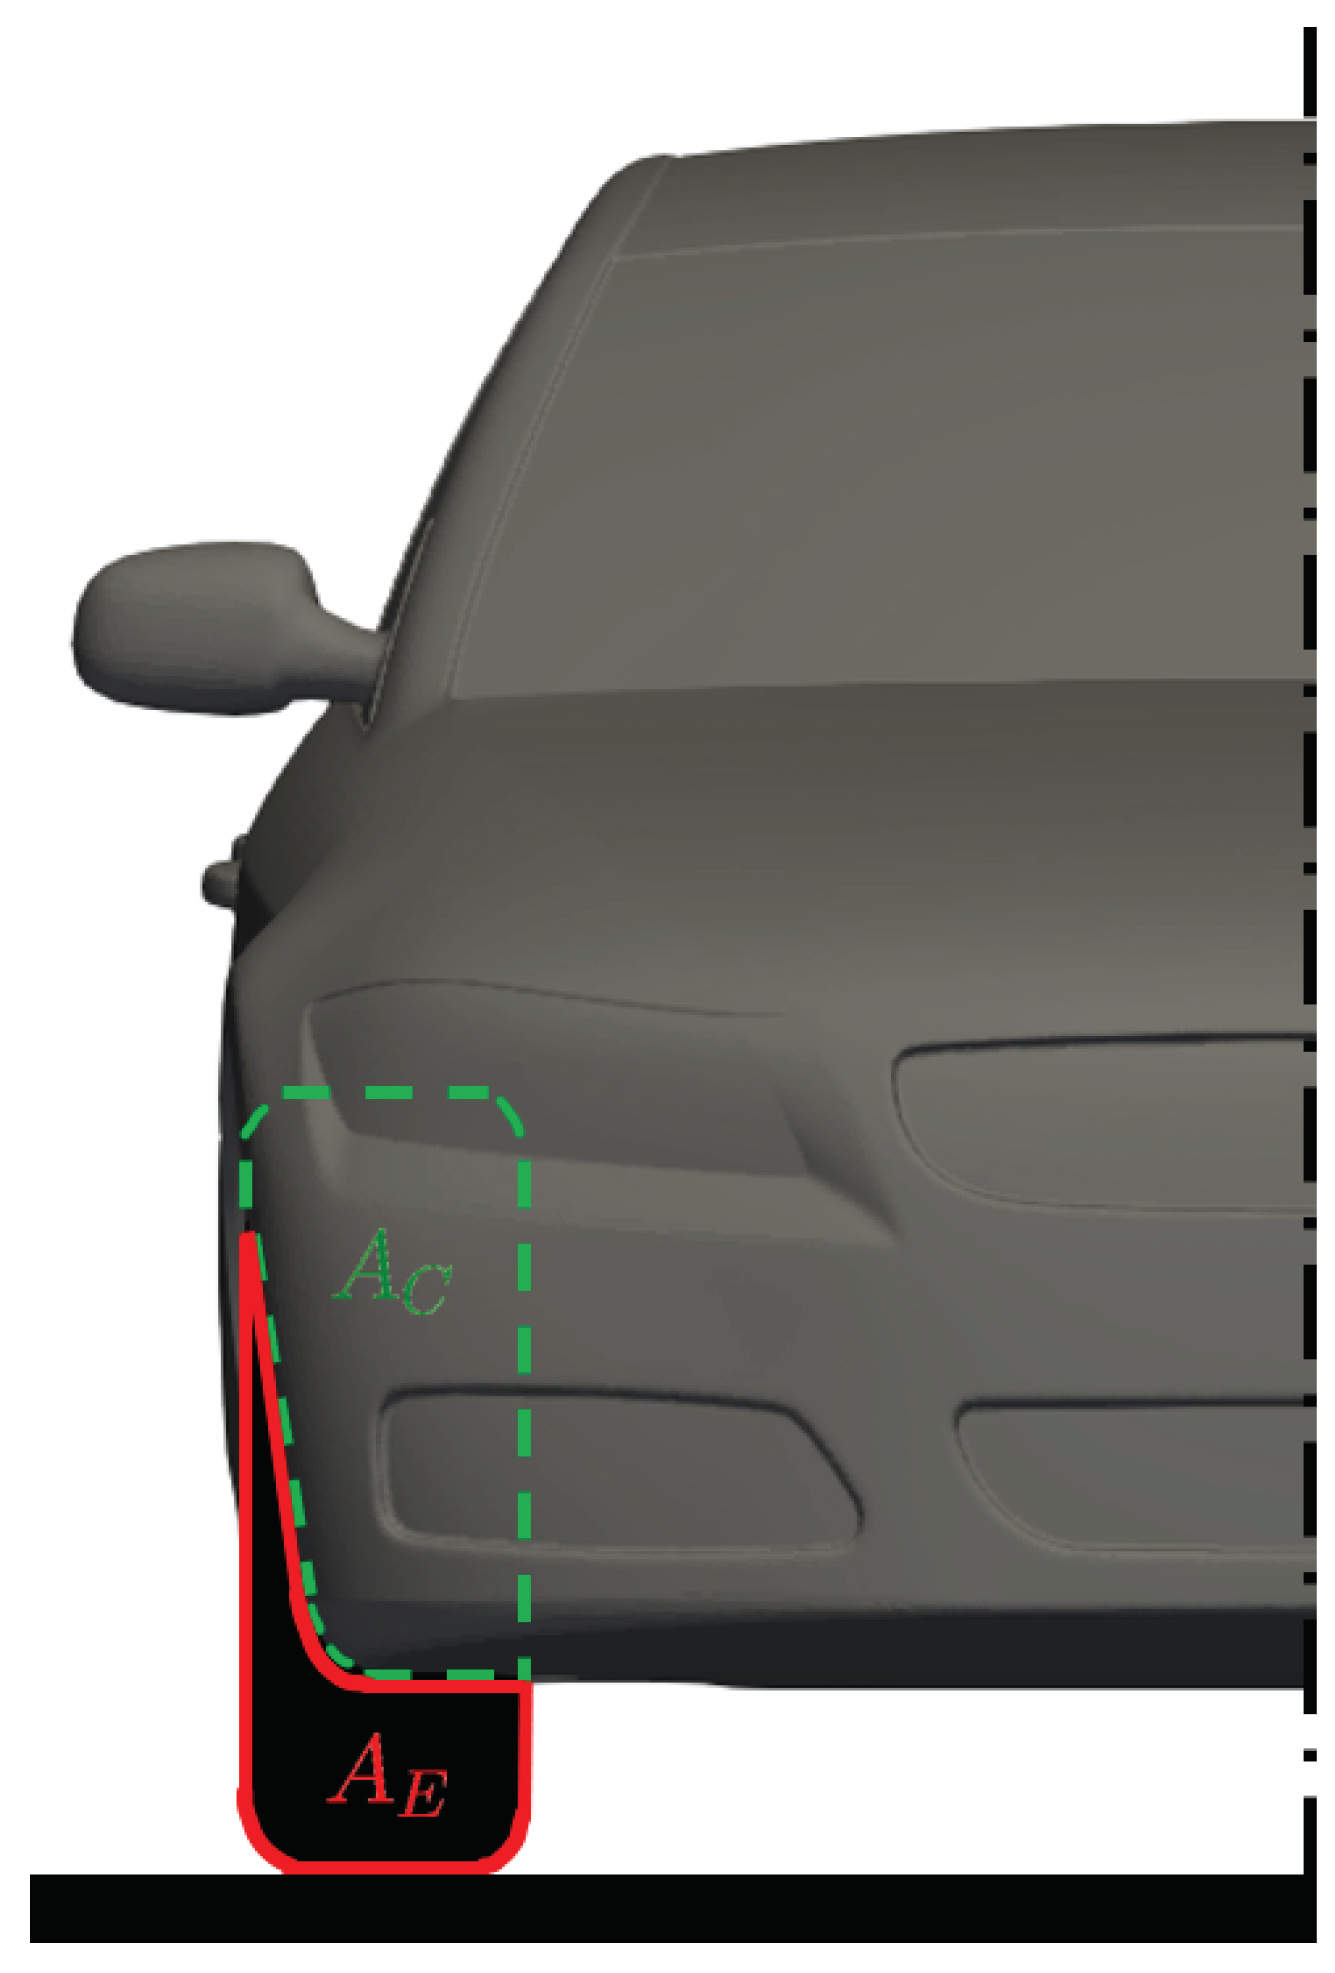
The lower the car, the more covered the wheels. The amount of area change of the front tires has been quantified by introducing the coefficient of exposure , which compares the wheel exposed frontal area to the total wheel frontal area. It is defined as follows:
where is the area of the exposed part of the wheel (mainly the bottom part of the tire) and is the area of the wheel covered by the wheel house. Both of them are measured through a projection (following the same procedure for measuring the frontal area of the vehicle). A schematics for the wheel exposed area is shown in Figure 14, where is highlighted in red and in green.
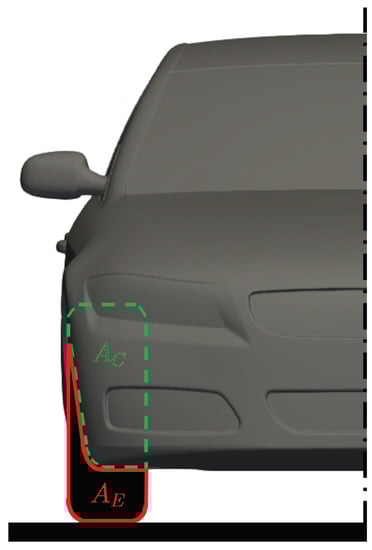
Figure 14.
Wheel exposed area and wheel covered area .
values are provided for the different configurations of the DrivAer and AeroSUV in Table 5. The opinion of the authors is that the value for the baseline DrivAer is quite high and does not match the values for common sedan cars present in the market nowadays (the DrivAer has been introduced in 2012 [14]).
Table 5.
Coefficient of exposure for front wheels.
4.1.2. Interaction between Underbody and Ground
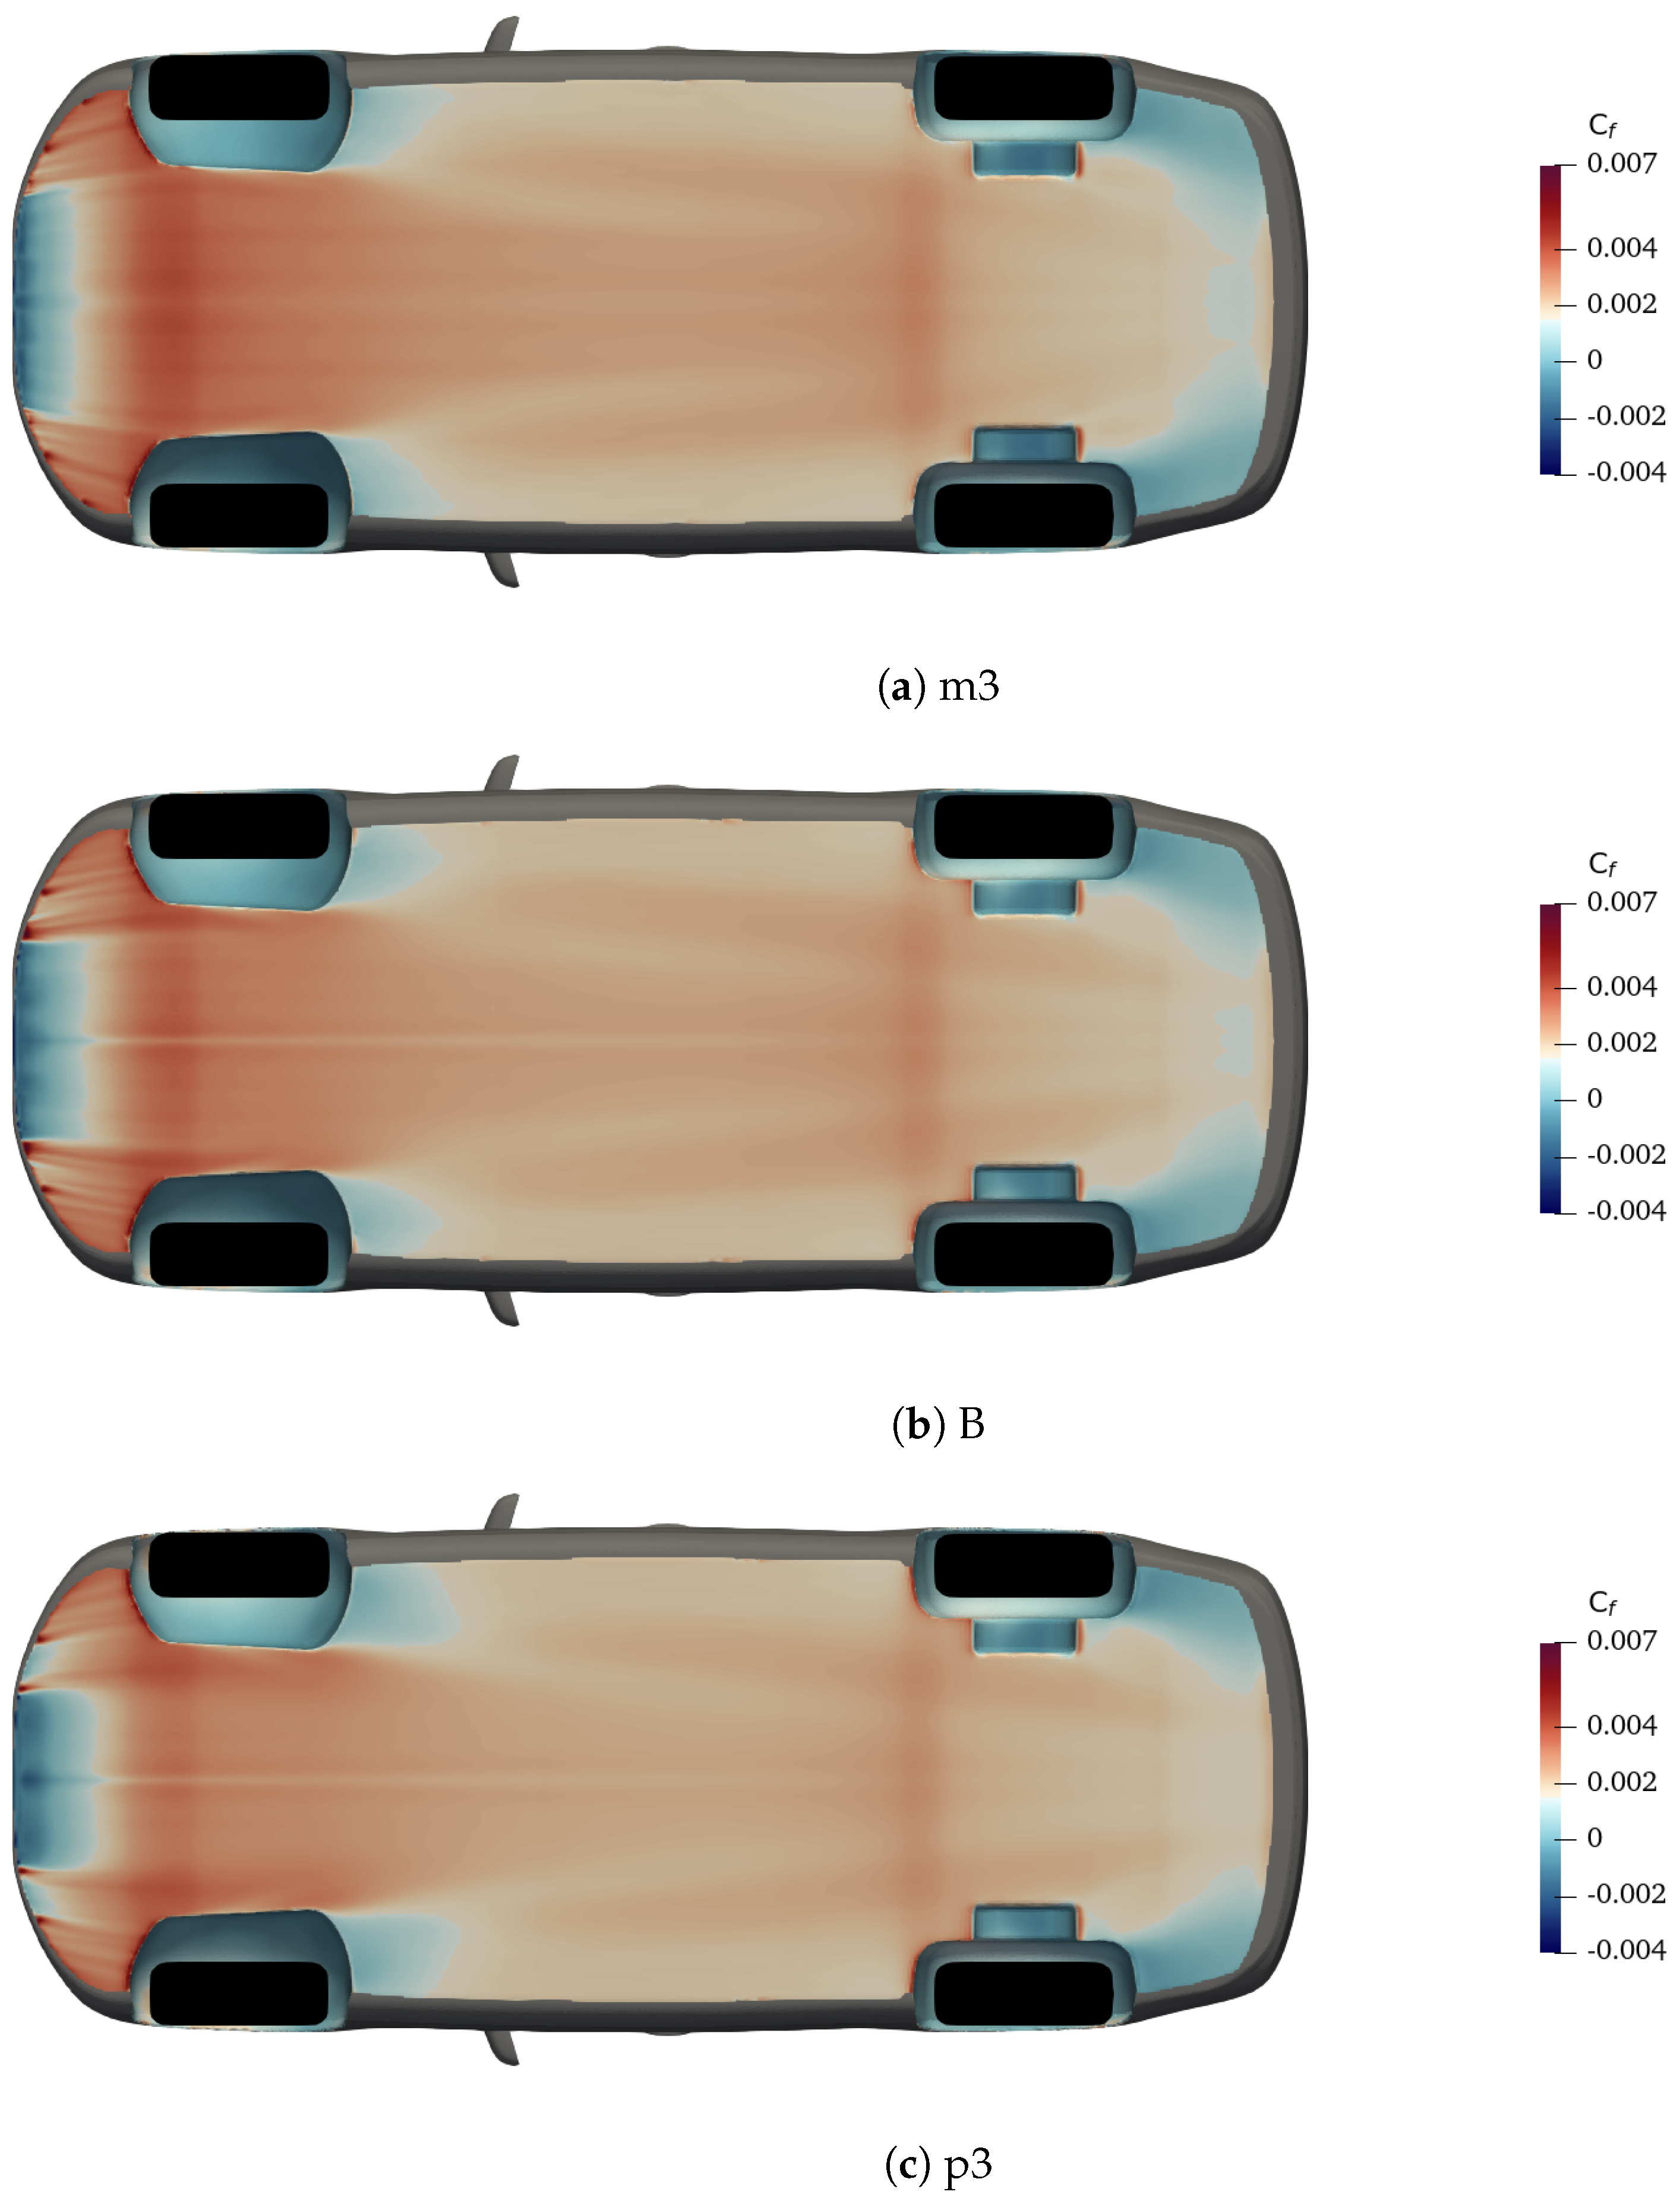
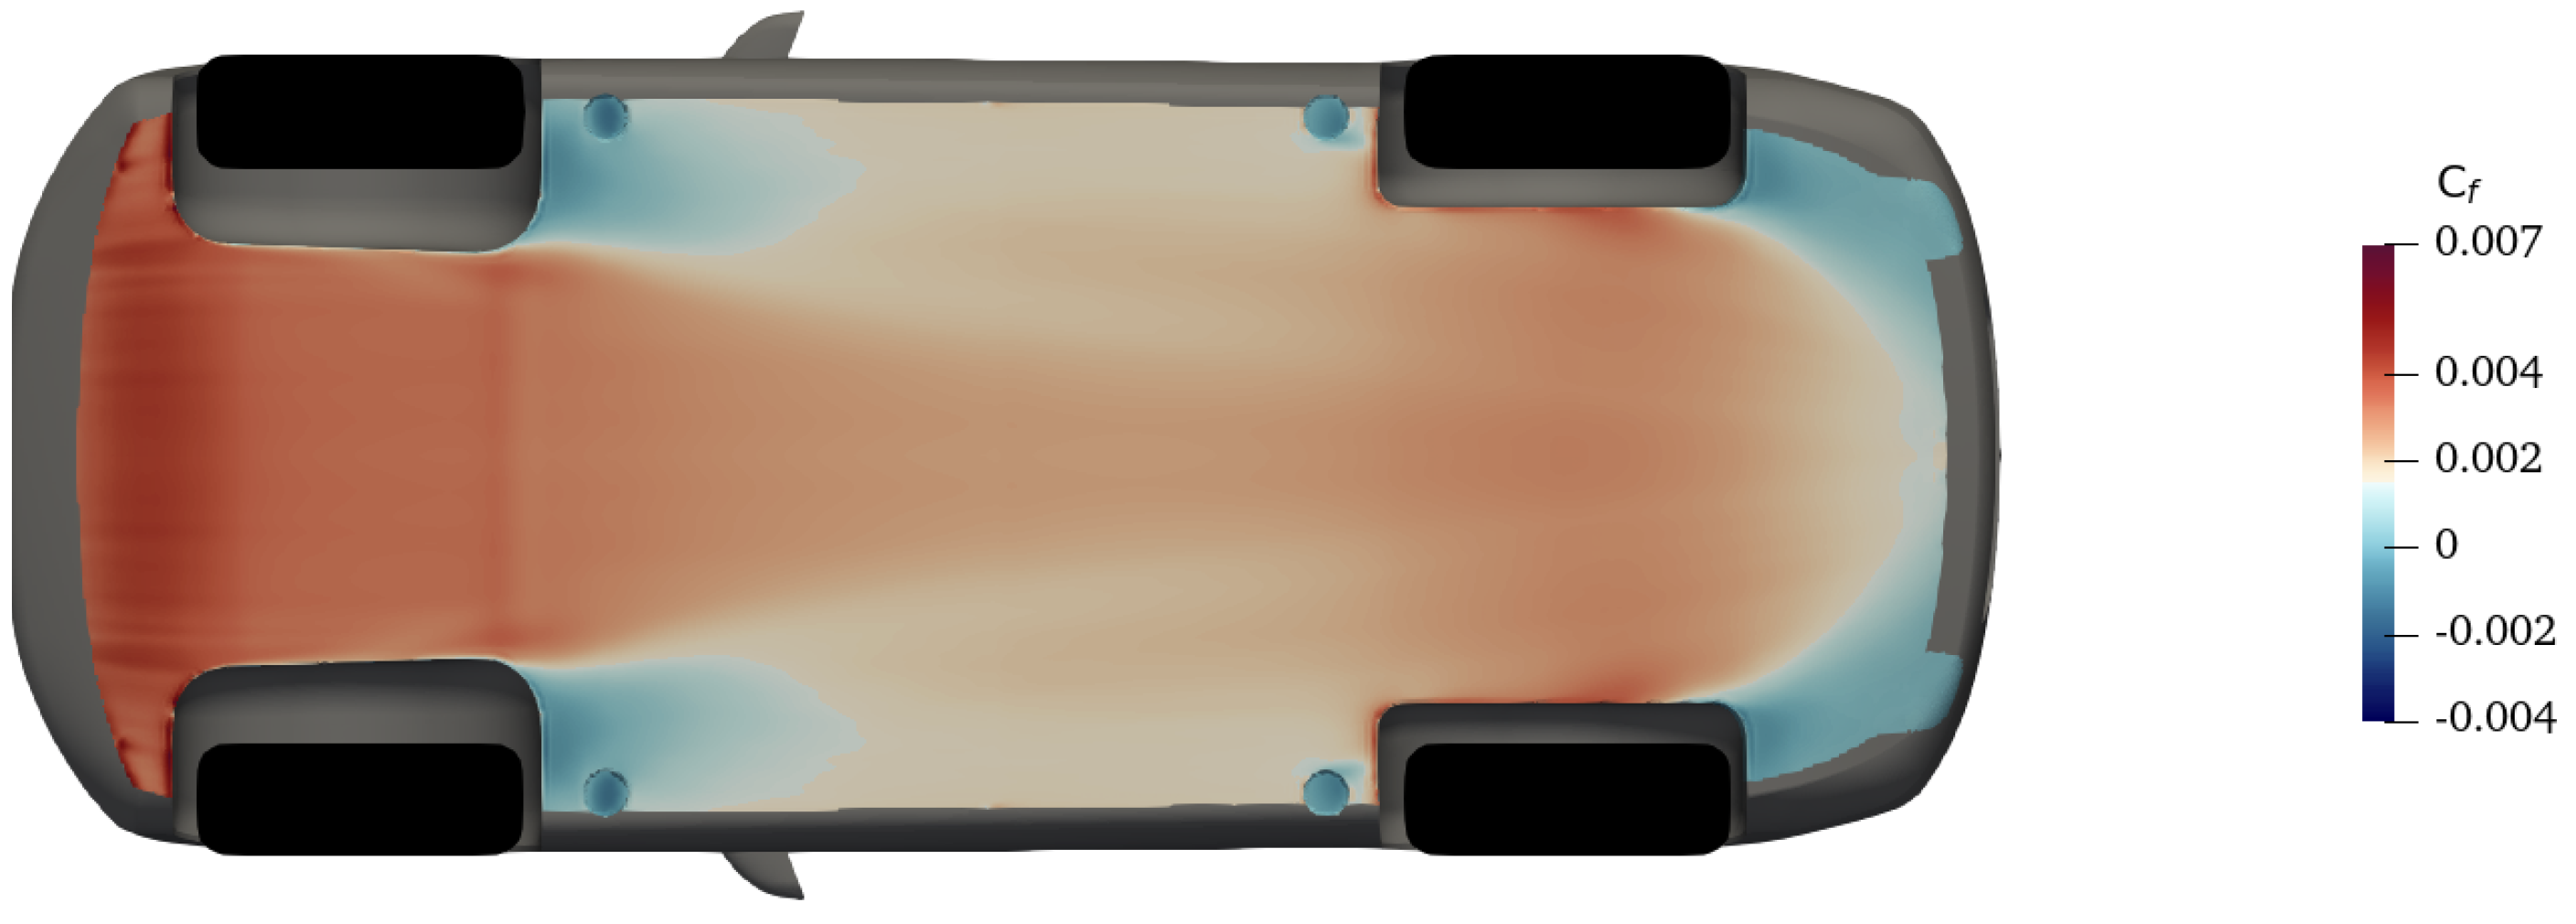
By lowering the car, the interaction between the underbody and the ground changes. In this section, the underbody is investigated. In Figure 15, the time-averaged skin friction coefficient on the smooth underbody surface of the DrivAer is presented. The differences are mainly located in three regions: at the front, where the skin friction coefficient decreases with higher ground clearance; behind the front wheels, where low friction regions are located; behind the rear wheels, where topologically the skin friction coefficient has the same distribution, but mildly increases for increased ride height.
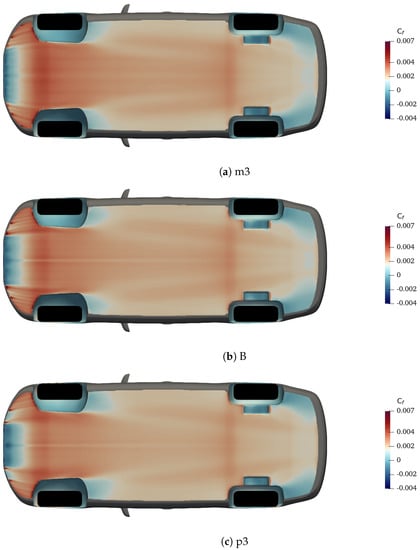
Figure 15.
Skin friction coefficient for the DrivAer with smooth underbody.
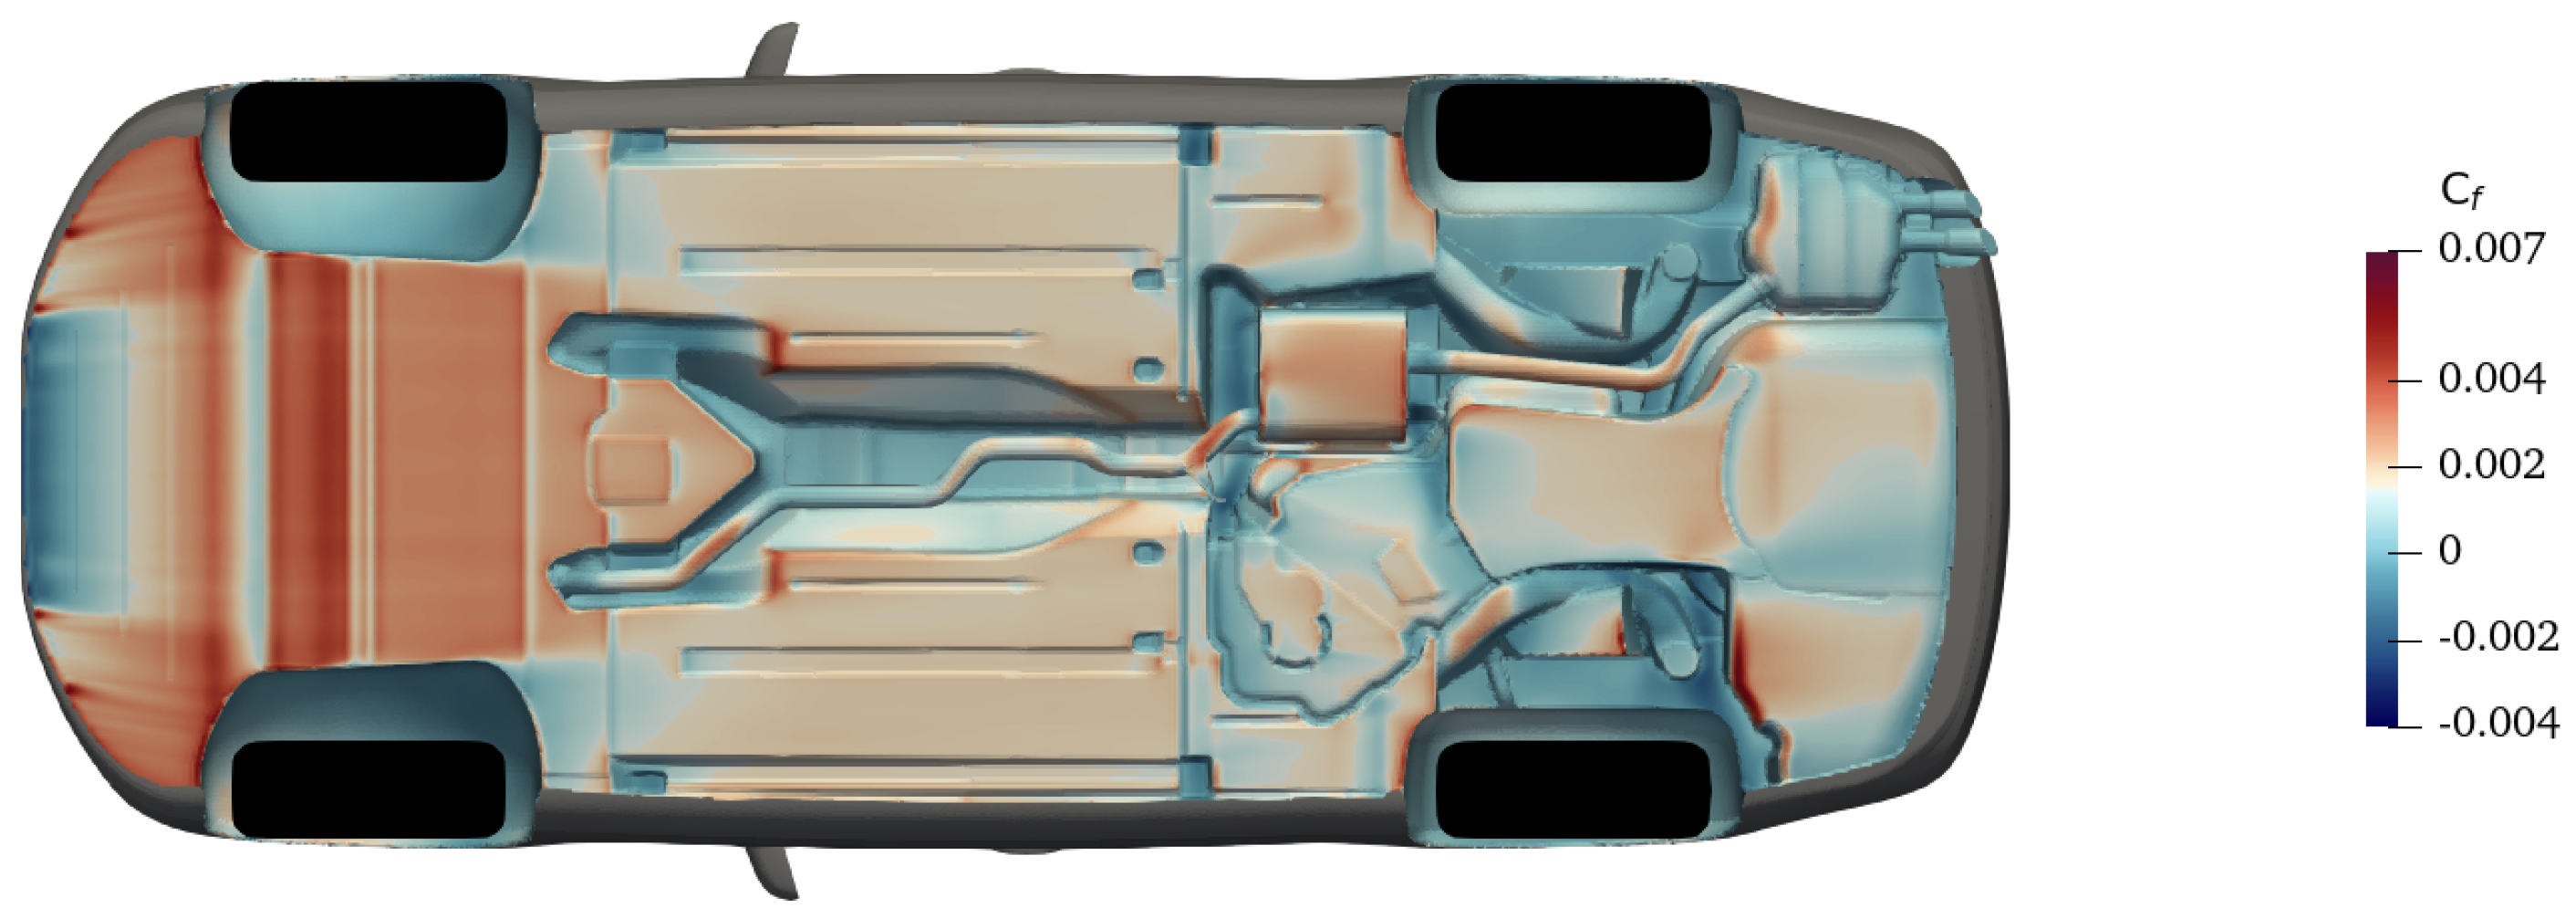
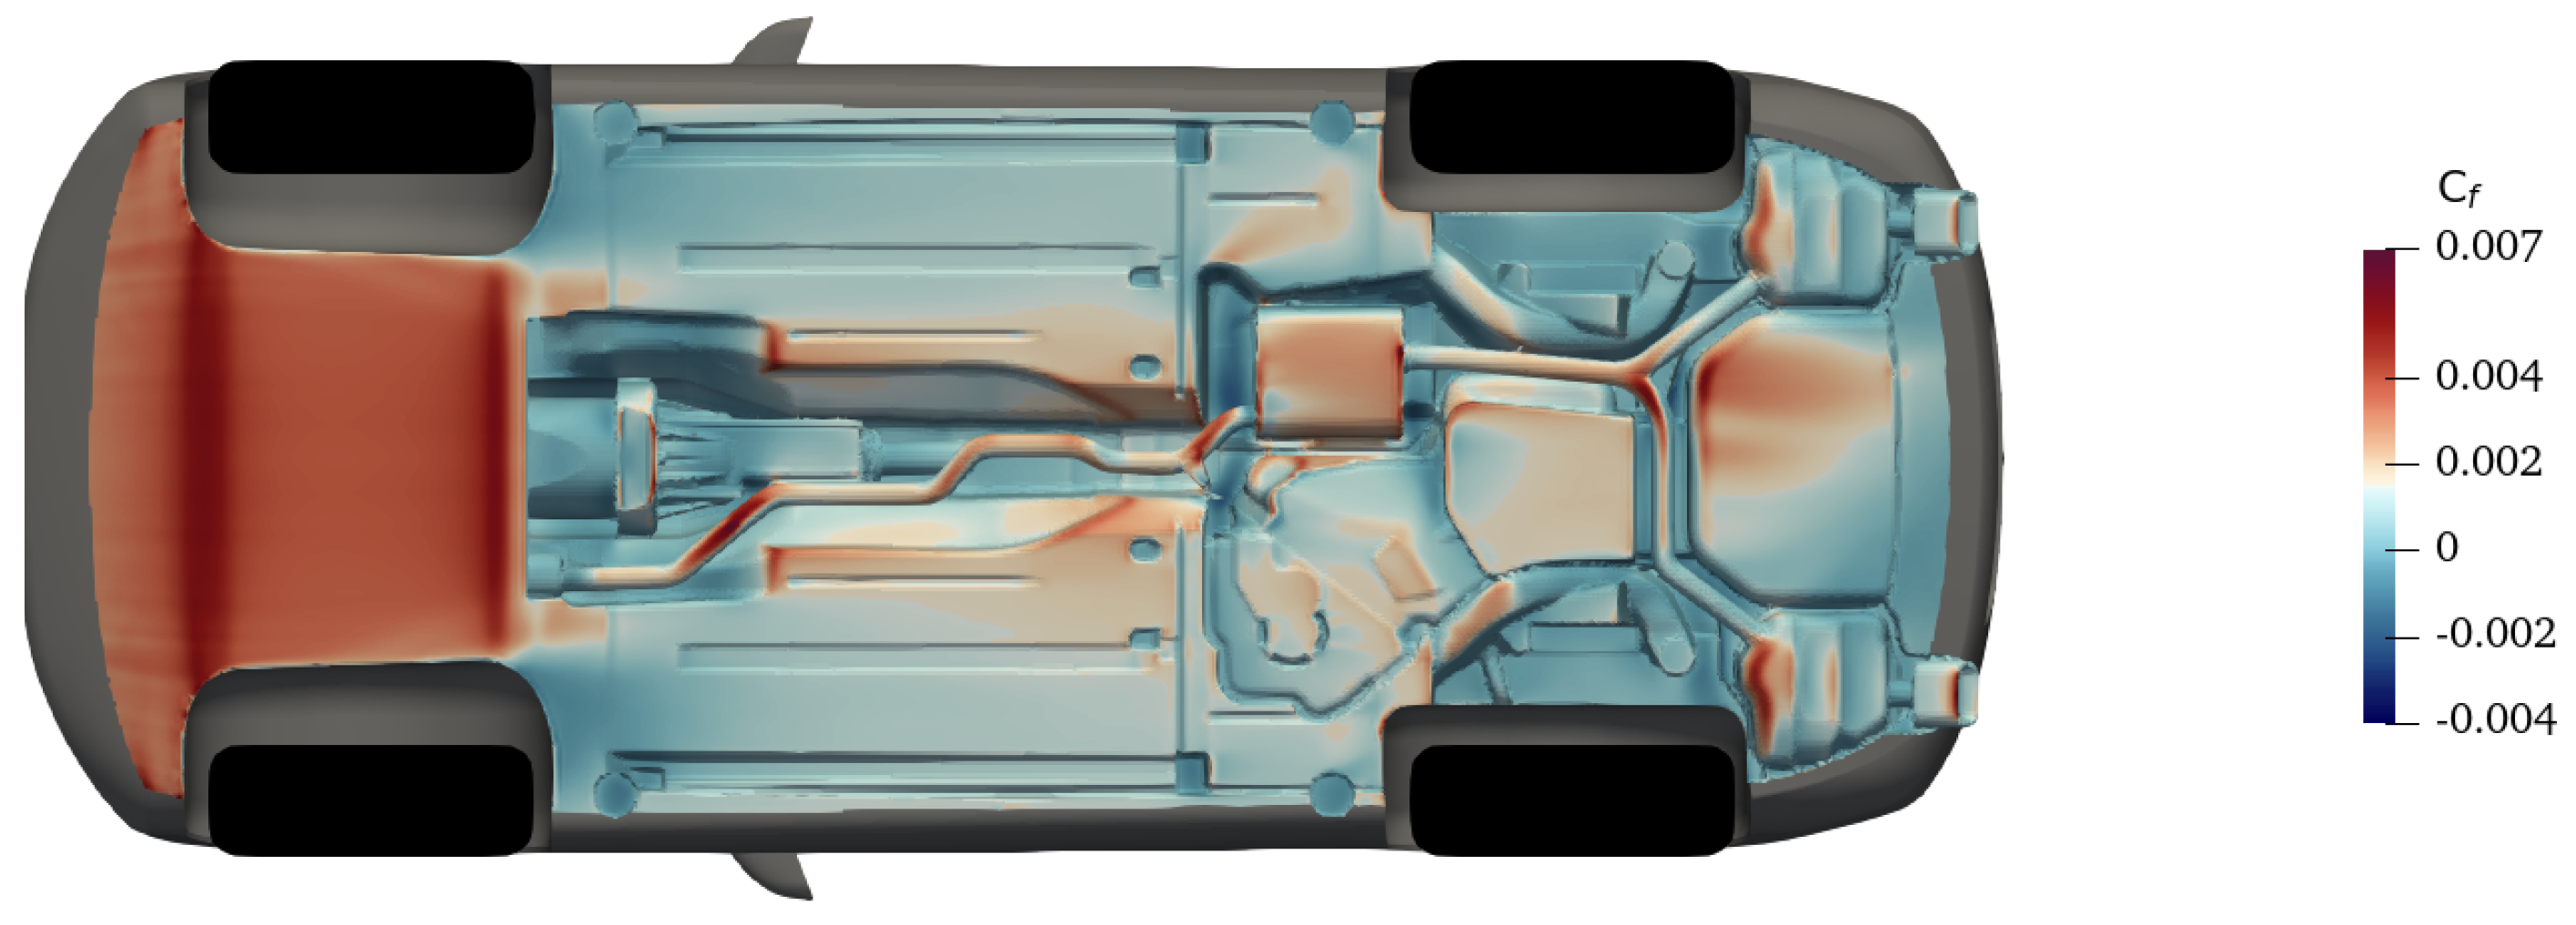
The same visualization is proposed in Figure 16 for the DrivAer with detailed underbody. The contribution of the skin friction is much higher in confined regions, in particular around the edges of the underbody components. There are several regions in the geometry where . In all these regions, the flow is not attached and a small pressure drag contribution starts to build up. Overall, higher drag than the smooth underbody must be expected.

Figure 16.
Skin friction coefficient for the Baseline DrivAer with detailed underbody.
Figure 17 shows the skin friction coefficient on the smooth underbody of the AeroSUV. Compared to the DrivAer with smooth underbody, there is no flow separation in the front part of the underbody and there are similar separated regions after front and rear wheels, altought for the AeroSUV they are extended in size.

Figure 17.
Skin friction coefficient for the Baseline AeroSUV with smooth underbody.
Figure 18 depicts the skin friction coefficient for the detailed underbody of the AeroSUV. The results are quite different and they suggest a high friction region in the front part, with no separations. After the front wheels, it seems that the flow over the underbody is mostly separated, with the condition .
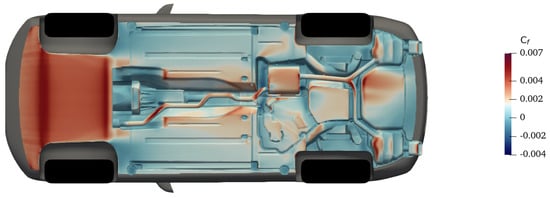
Figure 18.
Skin friction coefficient for the Baseline AeroSUV with detailed underbody.
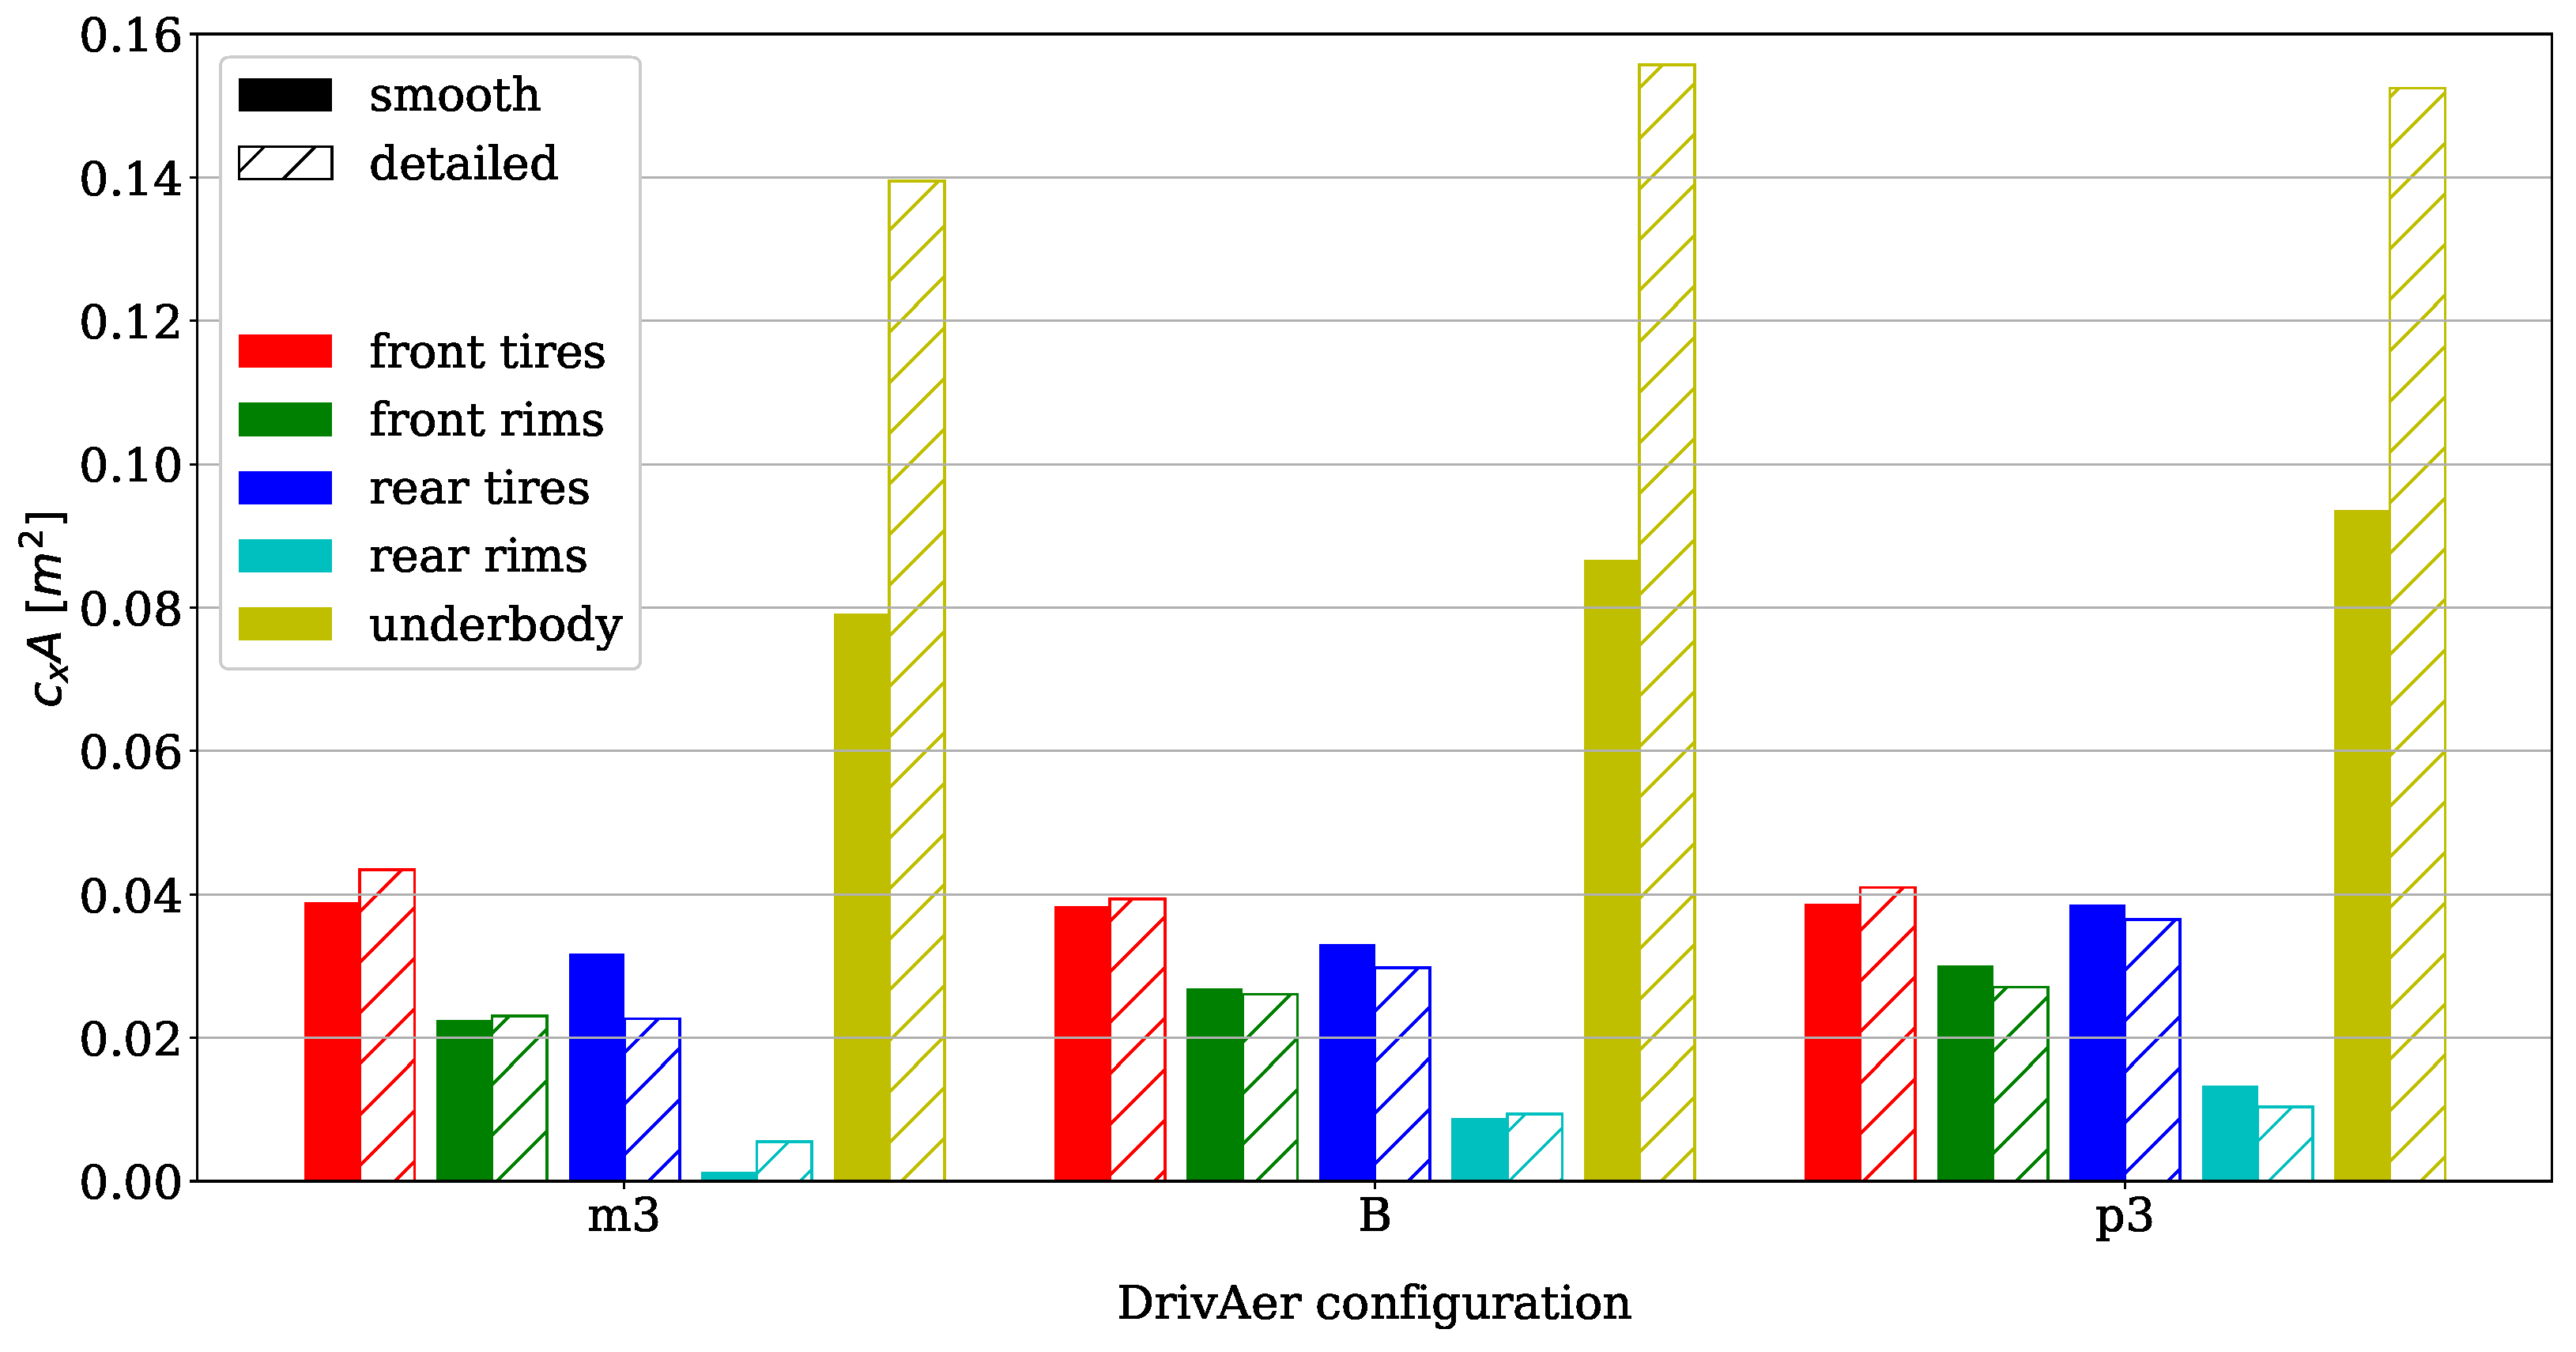
Figure 19 and Figure 20 provide detailed information about the forces on the main vehicle components for the DrivAer and AeroSUV models respectively. The plots are only for three configurations, namely the baseline (standard ride height, standard wheels) always in the centre and a lowered ( mm) and a lifted ( mm) configuration respectively on the left and on the right. It is interesting to notice that in contrast to what would seem trivial, front tires seem to be insensitive to ride height changes for the DrivAer, with less than 1% changes in drag area among the three configurations analysed. This happens both for the smooth and the detailed underbody, but the contribution of front wheels (tires and rims) is always increasing with increasing ride heights. The wheels that seem to be affected the most are the rear wheels. They show relevant relative changes in their drag area values. The other part of the car provided in Figure 19 is the underbody geometry. Between smooth and detailed, the contribution to the drag area is almost doubled, but they behave in a different way when compared to ride height changes. The smooth underbody seems to be correlated to ground clearance with a linear dependency. Instead, the detailed underbody does not show a clear trend, with decreasing drag for the lifted configuration compared to the baseline one.
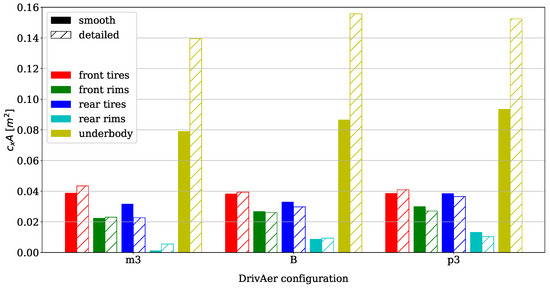
Figure 19.
Forces acting on vehicle components. DrivAer.
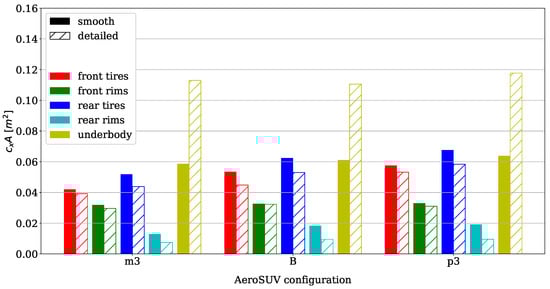
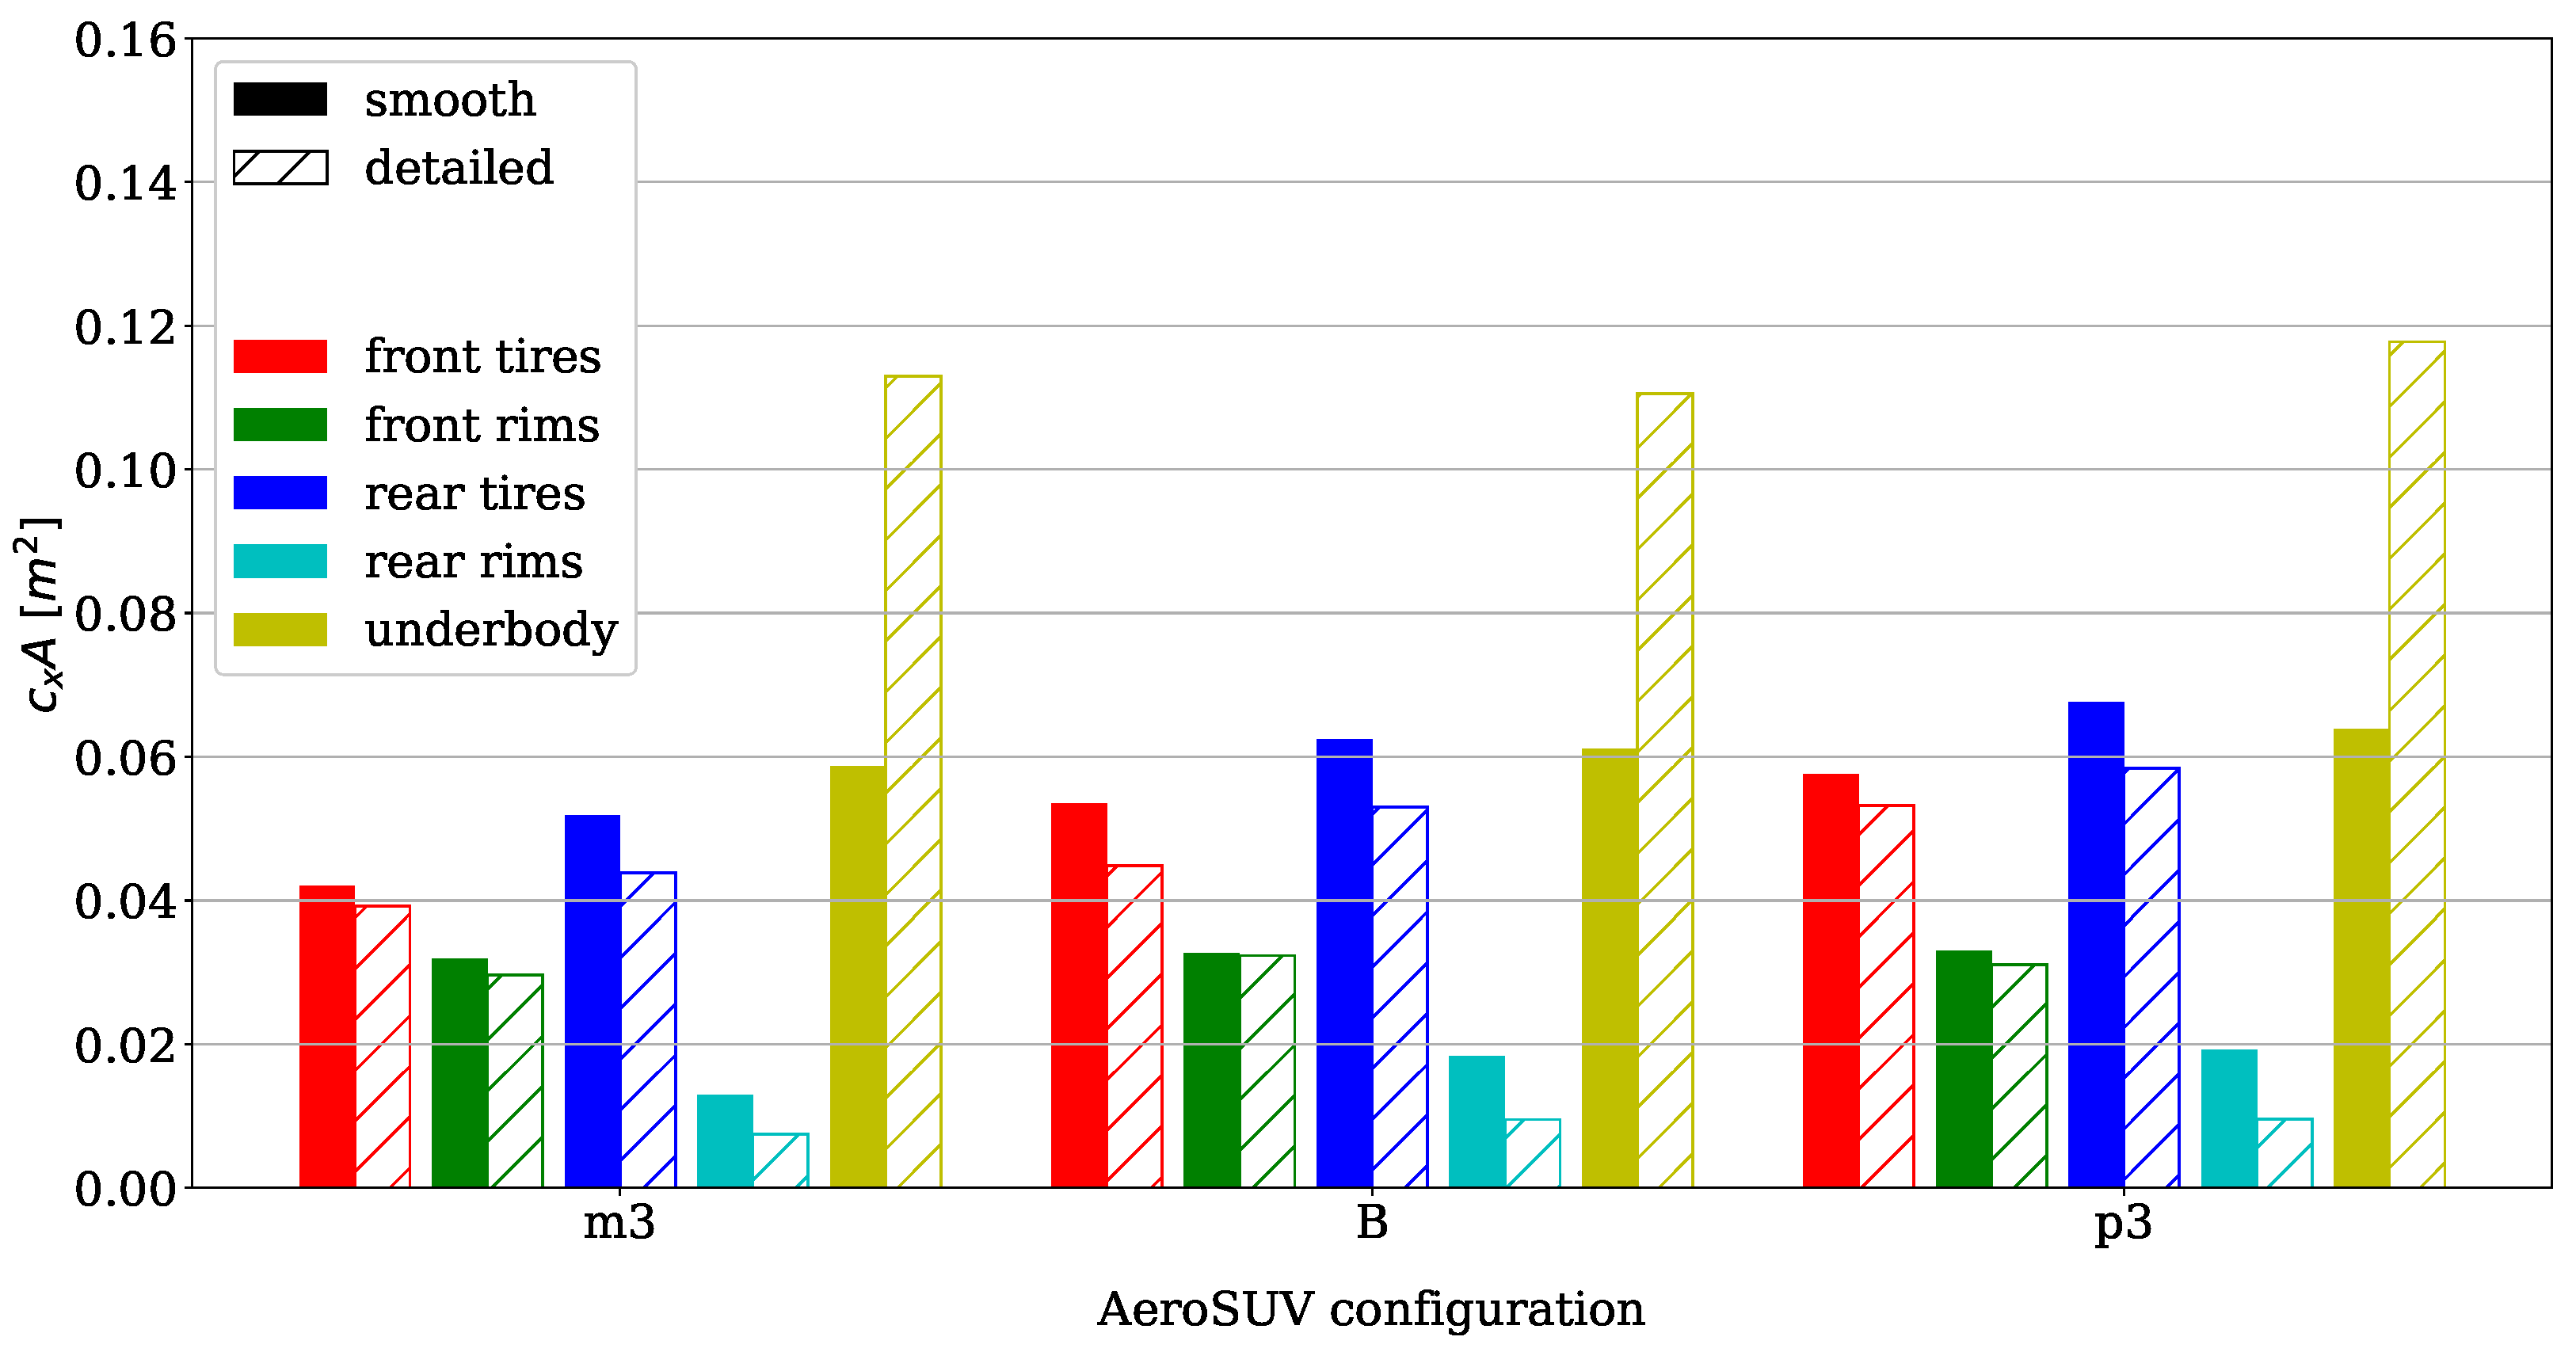
Figure 20.
Forces acting on vehicle components. AeroSUV.
The forces acting on the main components of the AeroSUV are provided in Figure 20. As expected, the contribution for tires and rims is bigger for this vehicle, being them much bigger in size (16″ vs. 19″). The contribution from the underbody is almost doubled going from the smooth to the detailed configuration.
4.2. Tire Deformation Effect
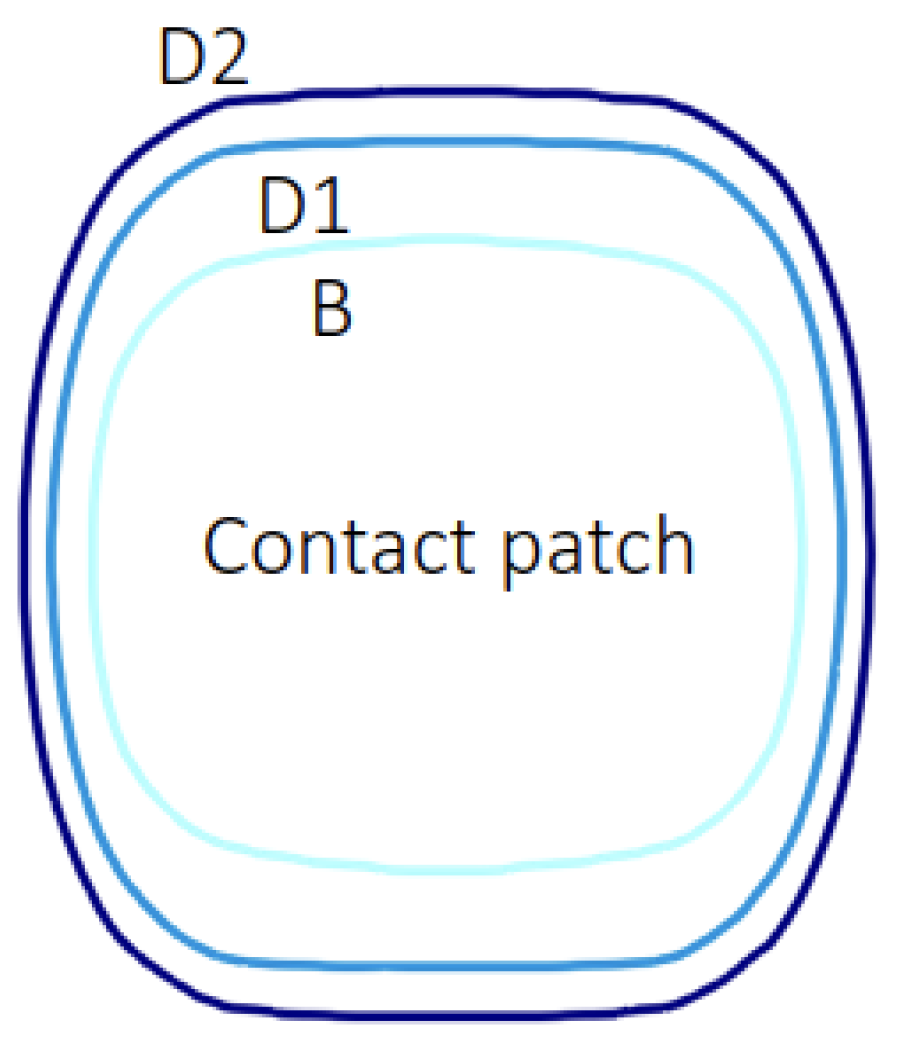
The standard DrivAer and AeroSUV slick tires have been modified by applying two increasing levels of deformation. The first level is labelled D1 and the second level is labelled D2. They correspond to a maximum deformation of 6.5 and 13 mm for the DrivAer, while for the AeroSUV they are 7.5 and 15 mm. The deformed tire profiles are described in Figure 3 and the top view of the resulting contact patch is provided in Figure 21 (the velocity is directed from top to bottom).
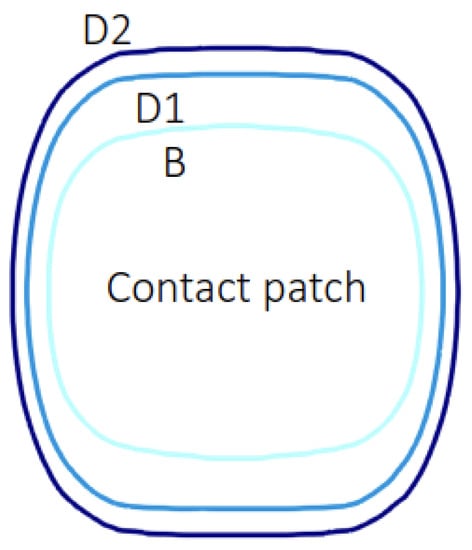
Figure 21.
Tire deformation levels: contact patch shape.
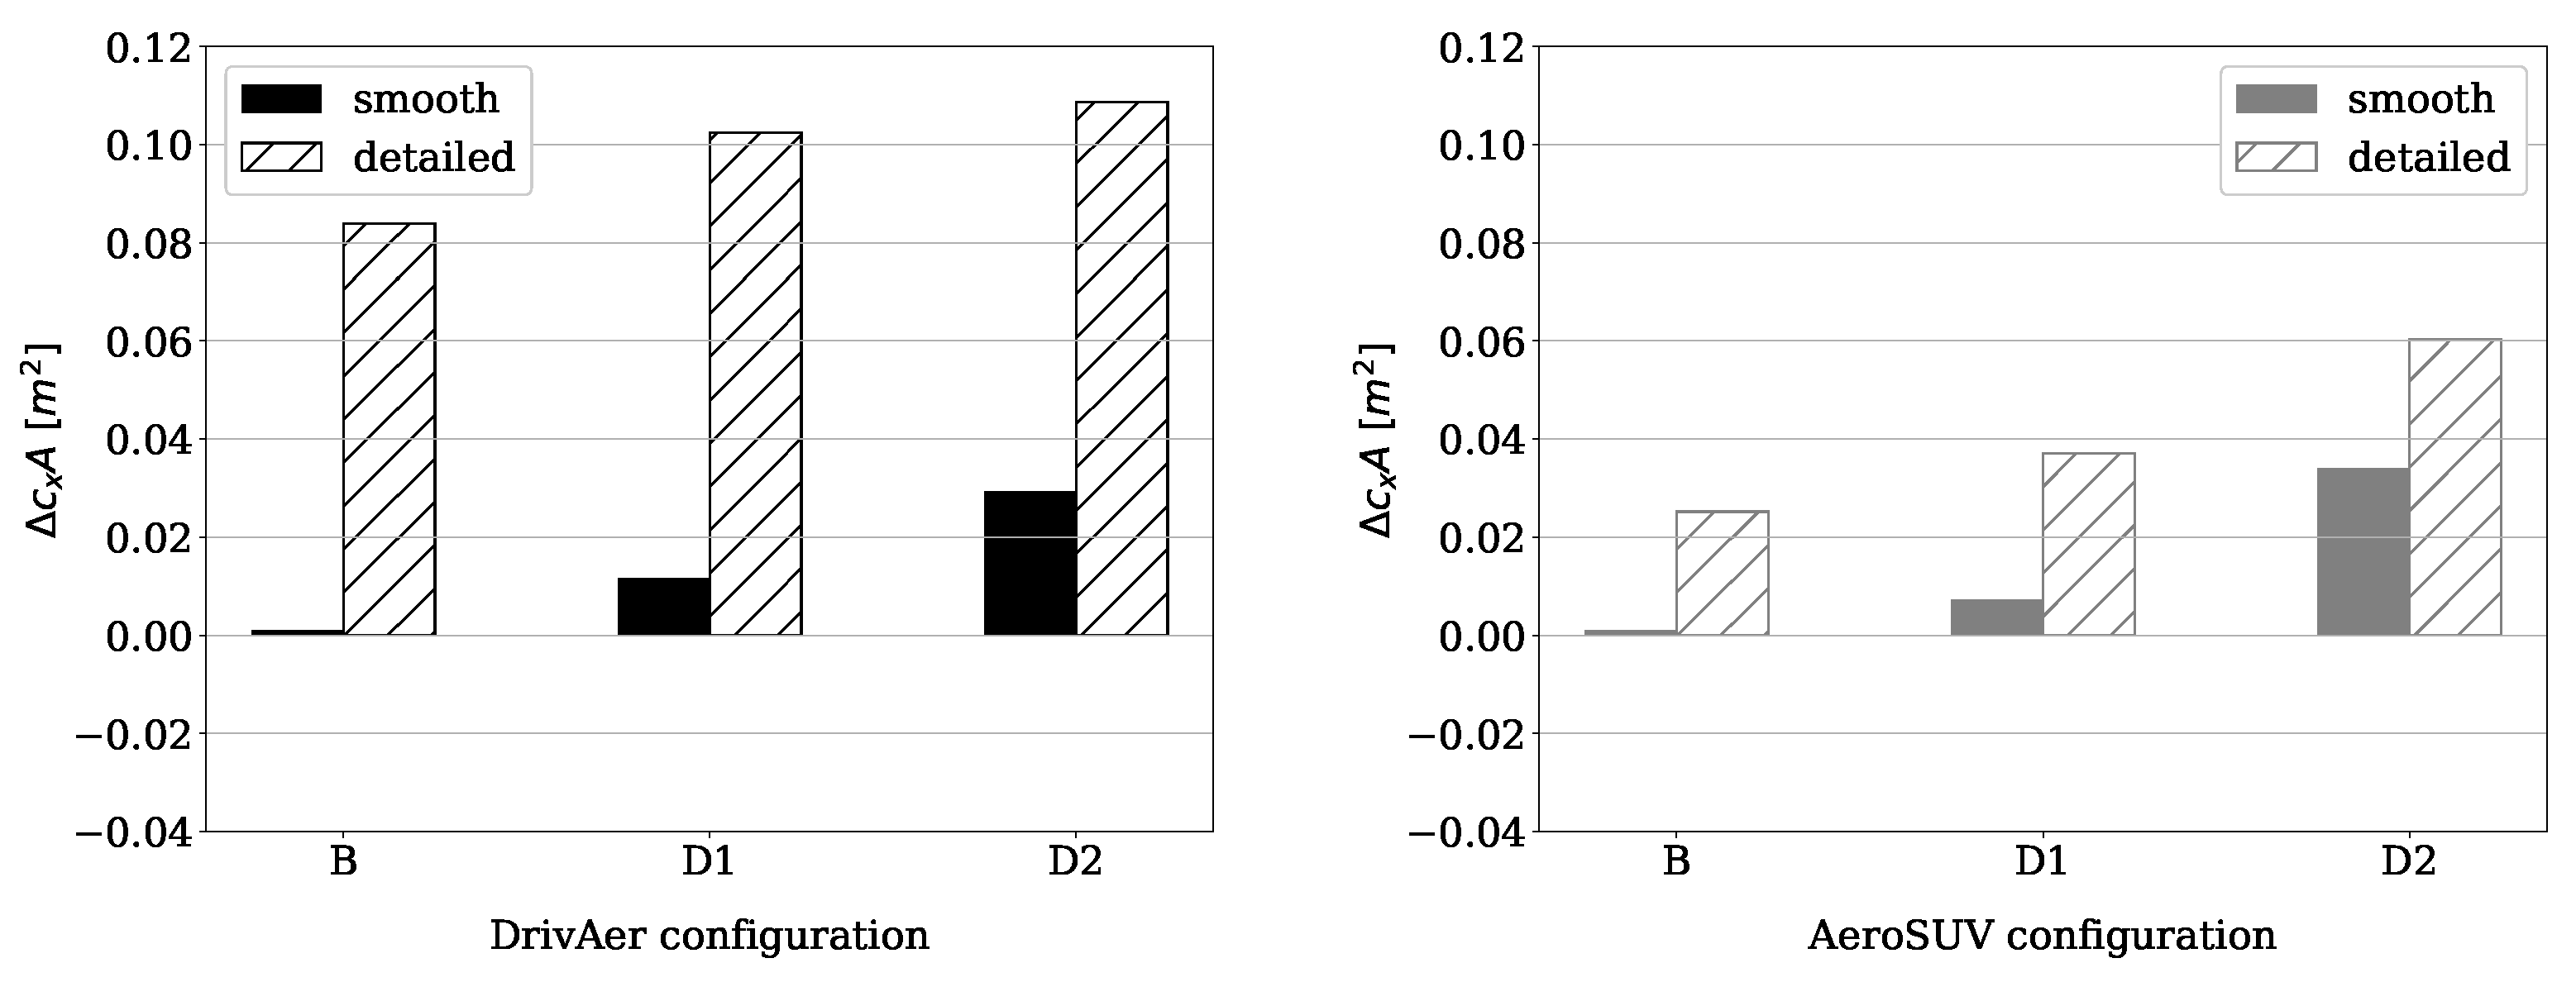
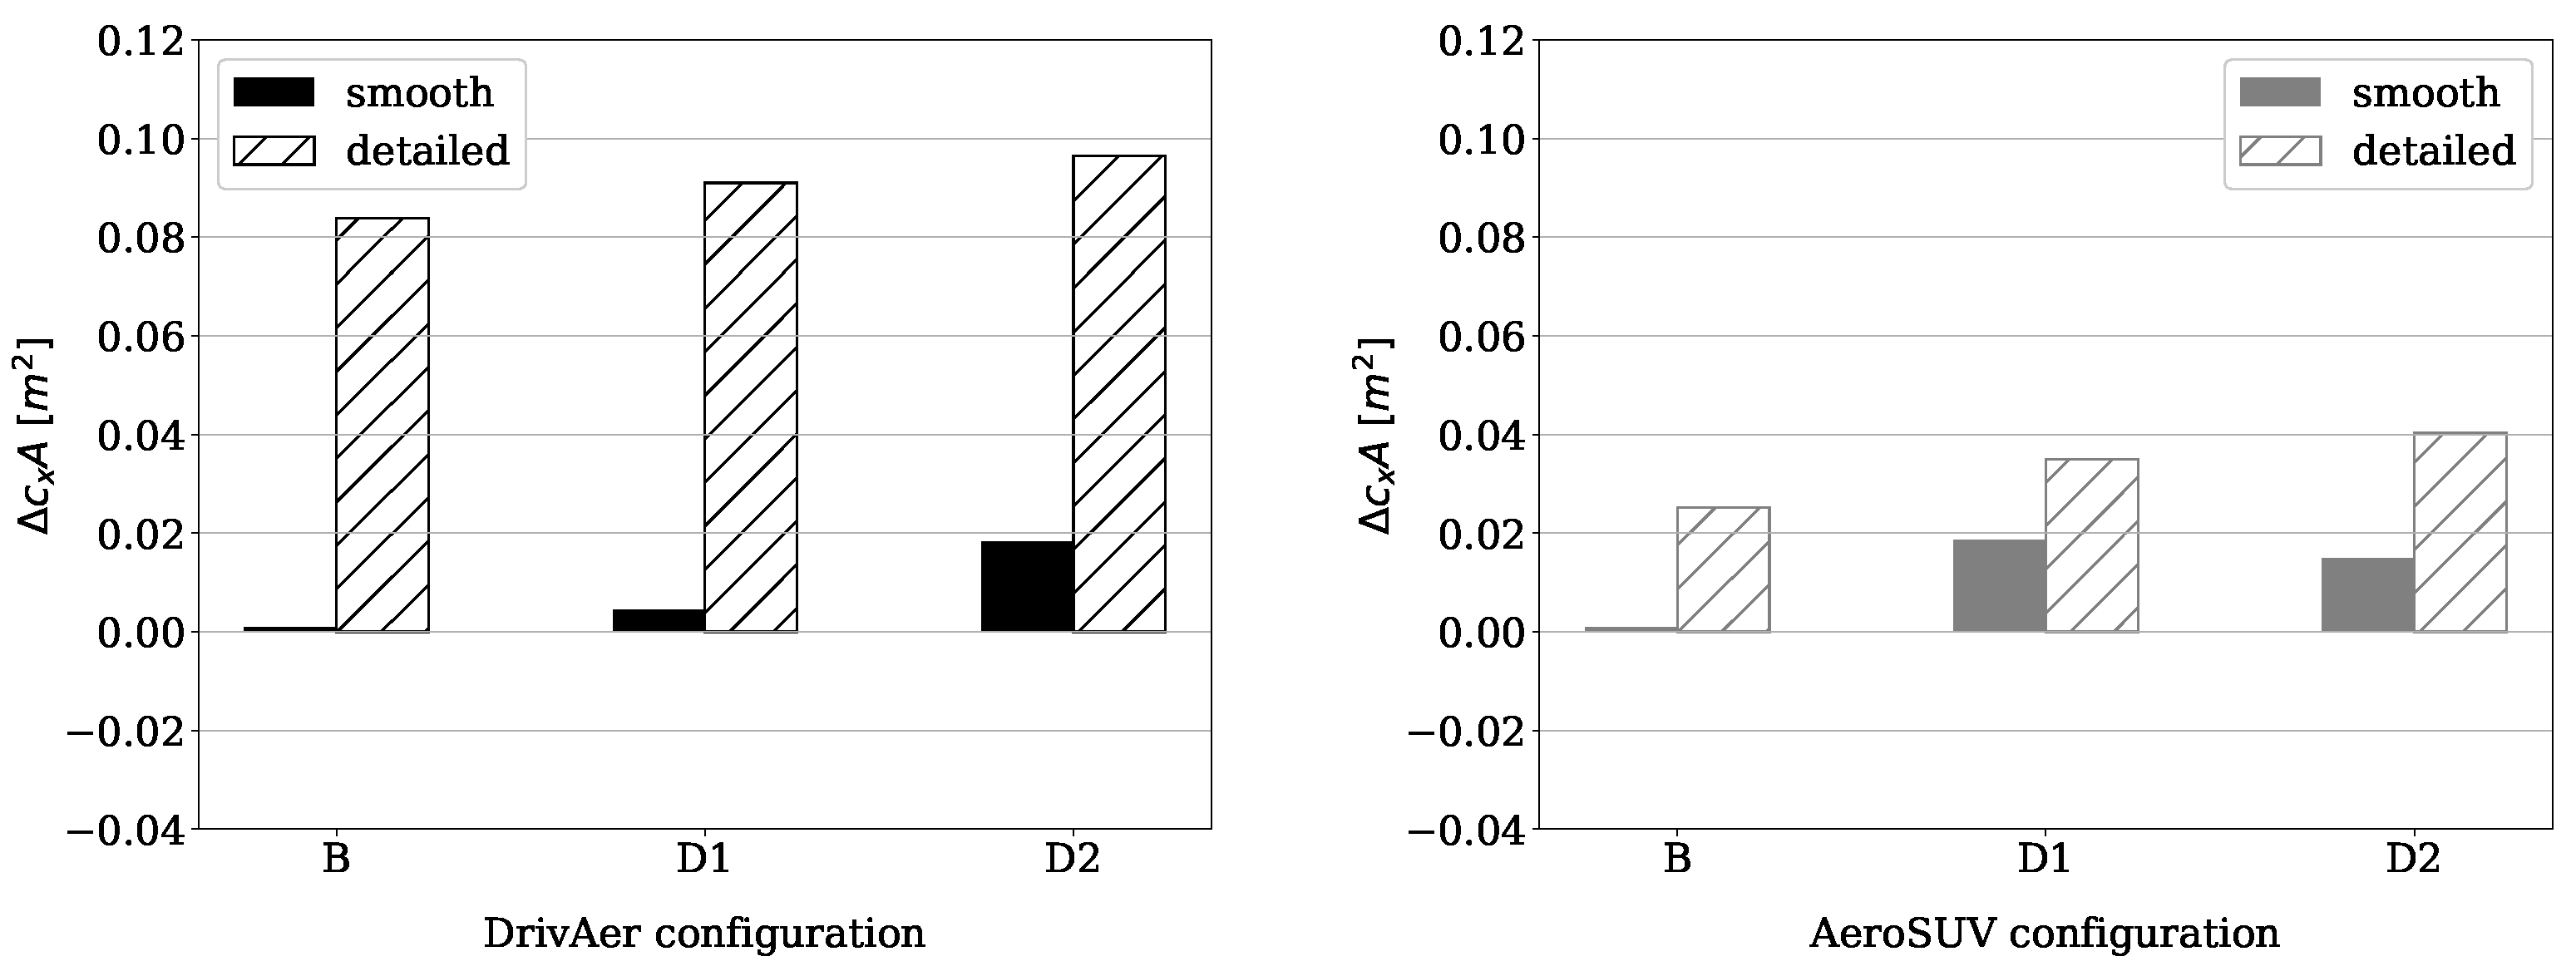
The results in terms of drag area changes for the DrivAer (left) and AeroSUV (right) are provided in Figure 22. With increasing tire deformation, an increase in drag is consistently predicted. Deltas in drag area grow more than linearly with the amount of deformation for this tire, except for the DrivAer with detailed underbody that seems to show a less than linear increase in drag between D1 and D2 deformation levels.
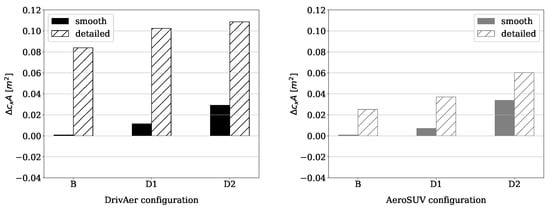
Figure 22.
Vehicle ride height effect. Baseline configuration as starting point.
Also in this case, the DrivAer is more sensitive to the introduction of the detailed underbody geometry, while the AeroSUV shows a smaller increase in drag. To give more insight, Figure 23 resumes the forces acting on the main vehicle, provided for both the DrivAer and the AeroSUV.

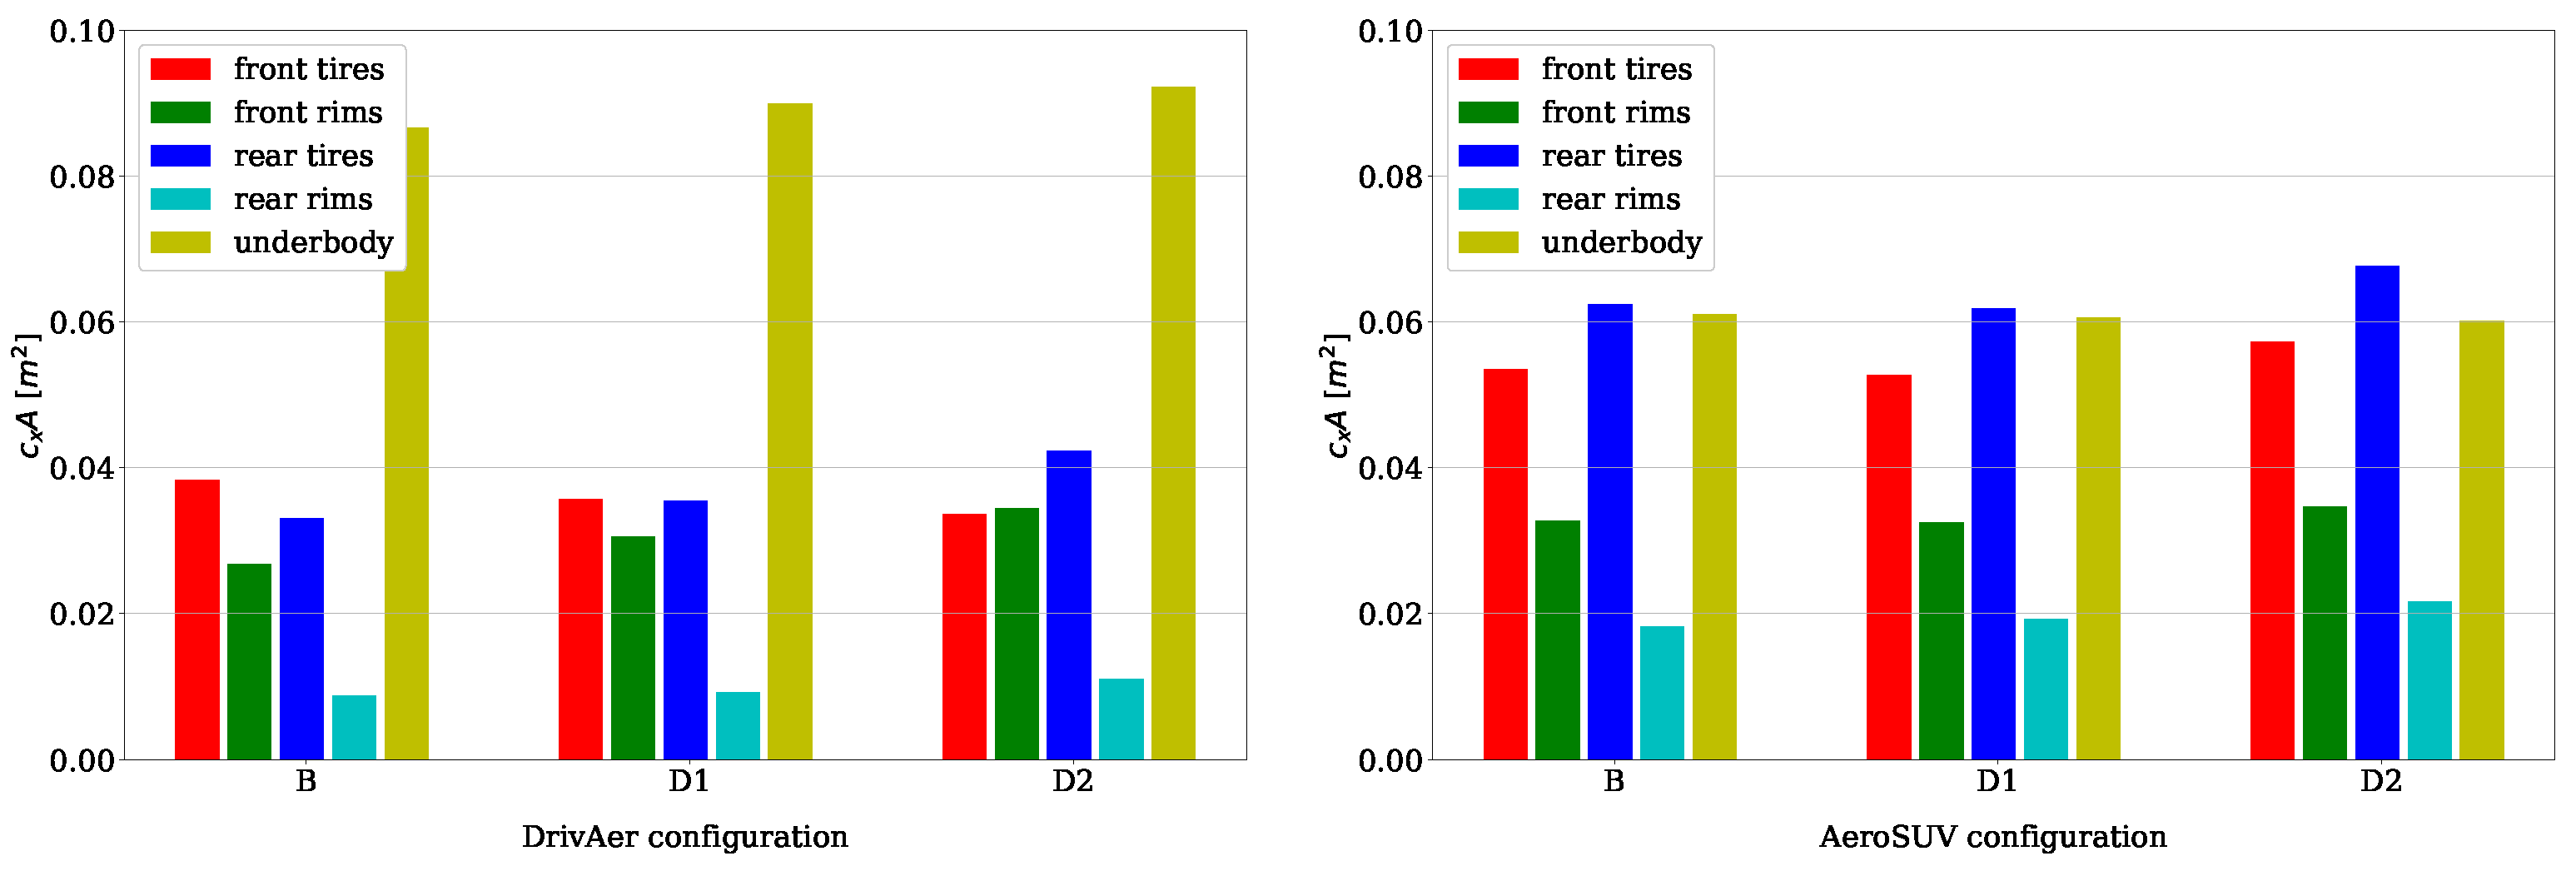
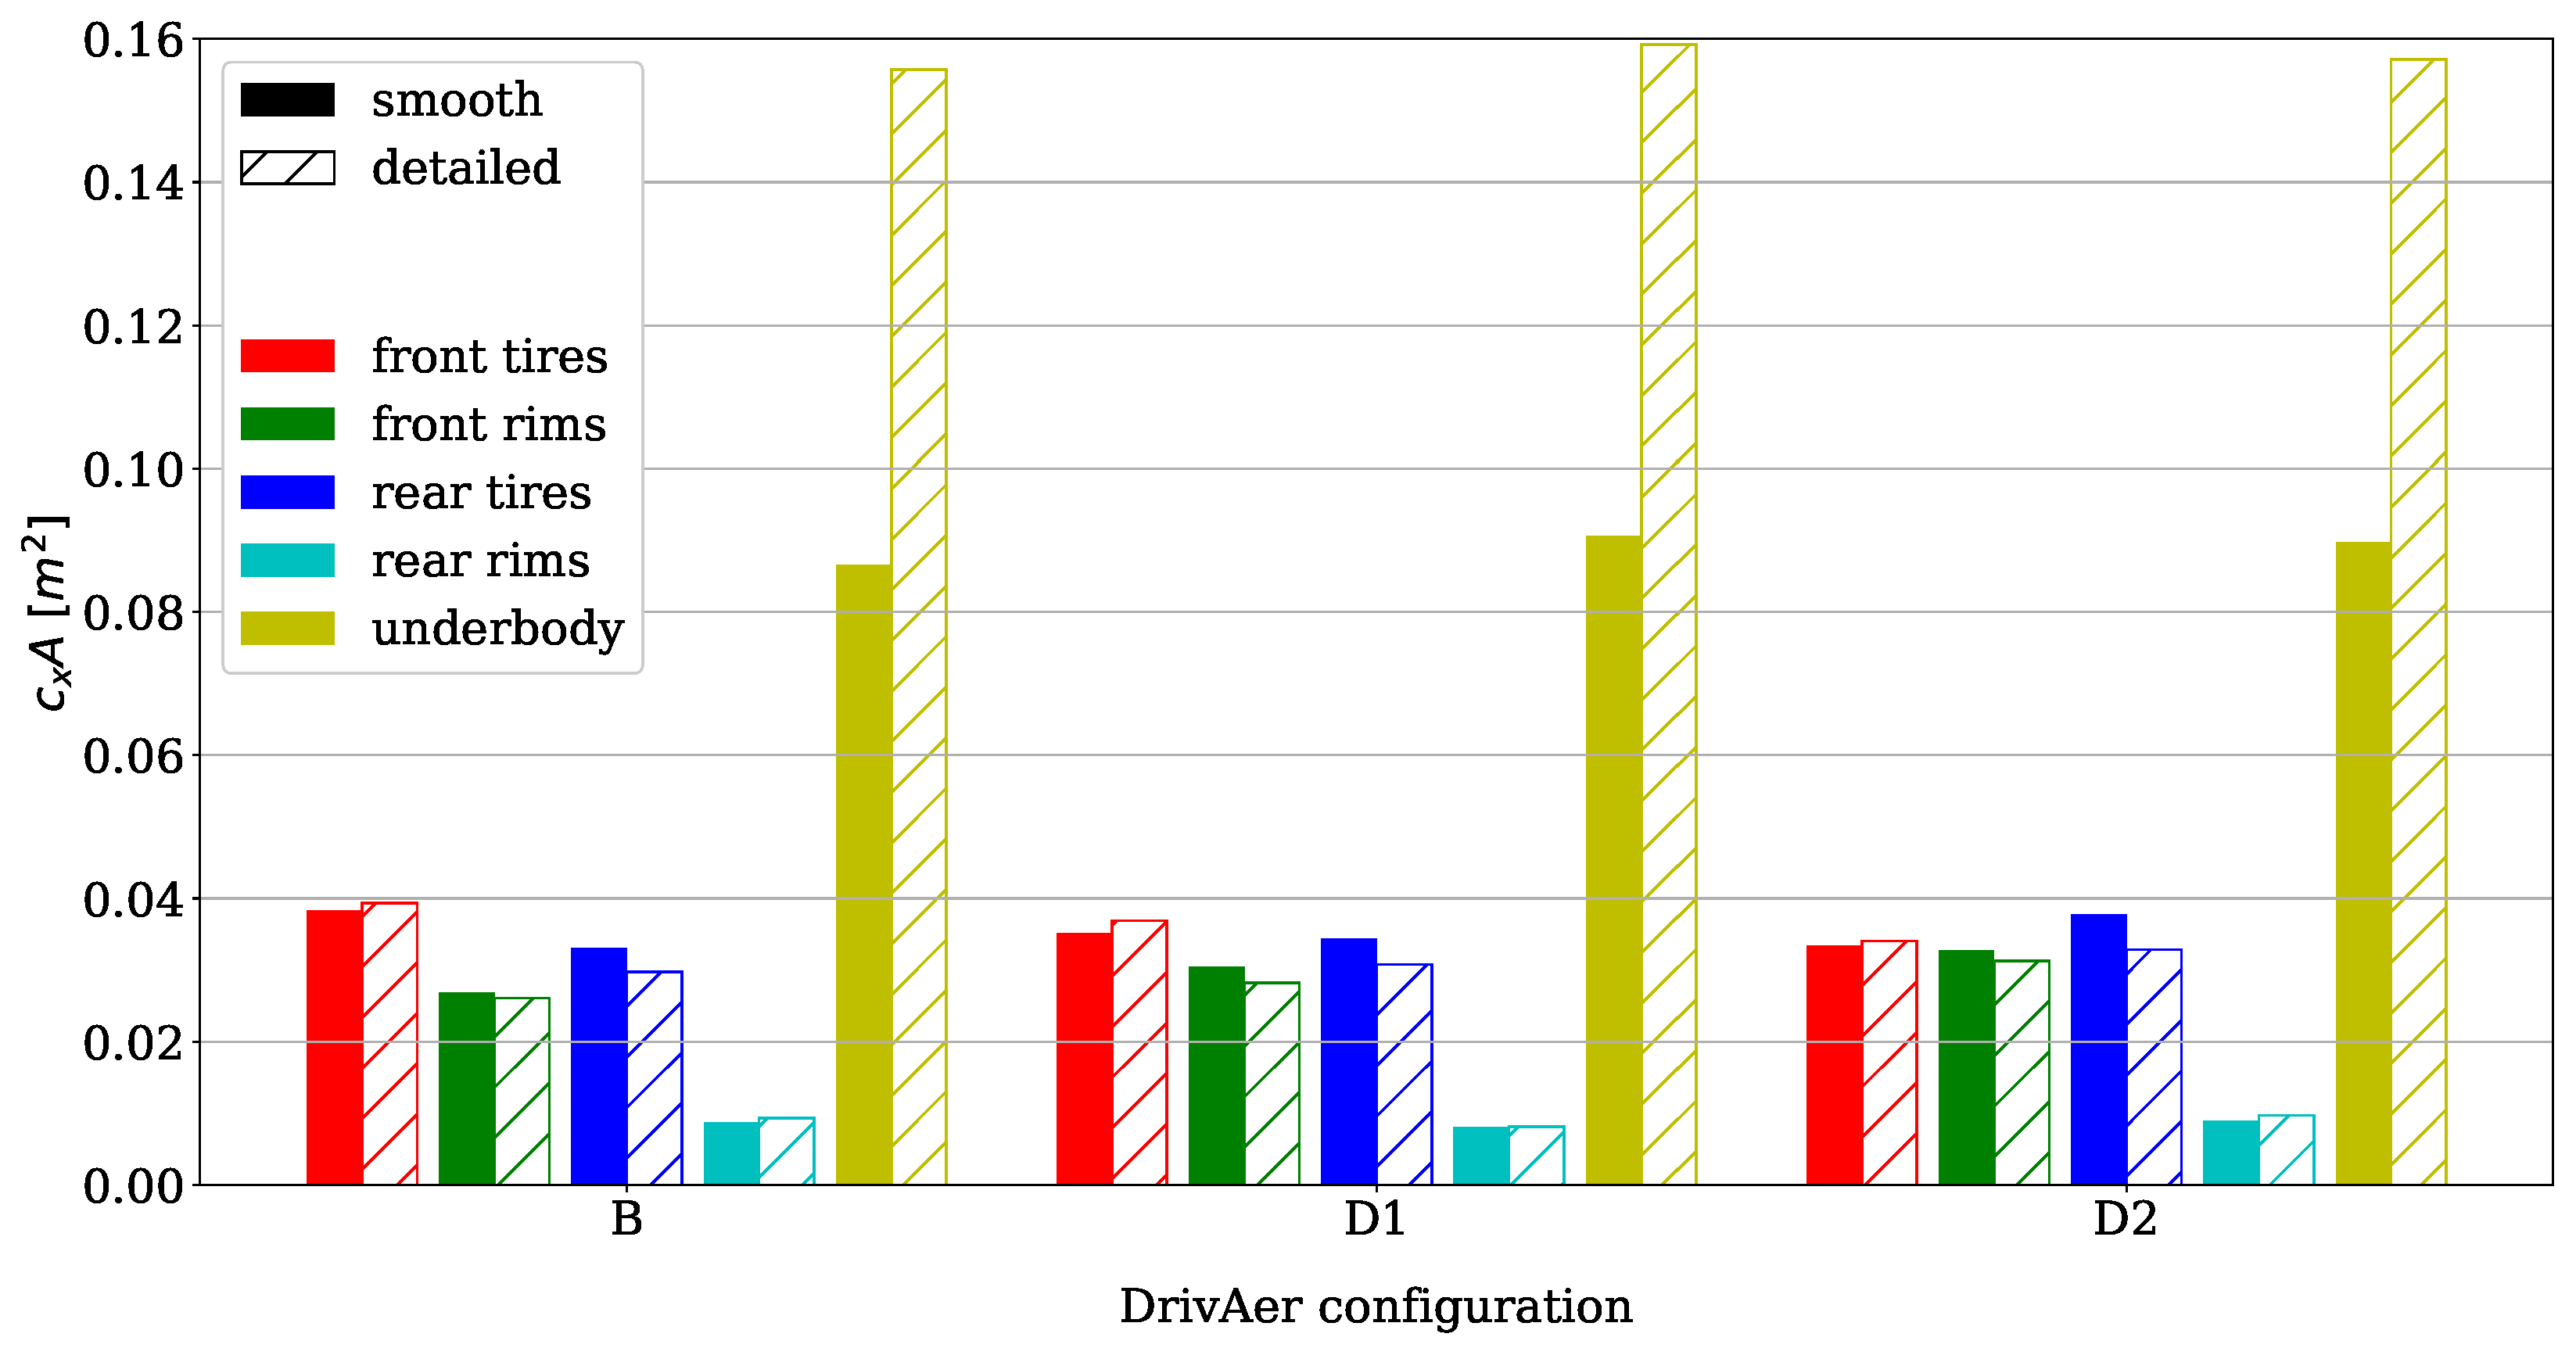
Figure 23.
Forces acting on vehicle components. DrivAer (left), AeroSUV (right).
For the DrivAer, increasing tire deformation brings a small reduction of the force acting on front tires. Overall, the load on front wheels (tires and rims) increases. The decrease in force on front tires will be addressed in the following. The rear wheels are subjected to an increase in drag with increasing tire deformation levels, but differently from front wheels, drag increases for both tires and rims. The scale of the plots does not allow to appreciate the relative size of the increase, but it is almost close to 30% from baseline to D2. The underbody contribution increases as well and this could be appointed only to the flow modifications introduced by the wheels, being the vehicle ride height constant. For the AeroSUV, the trends are similar. The drag for front and rear tires increases with tire deformation, as well as the drag for rims. The underbody is insensitive to tire deformation, showing an almost constant drag.
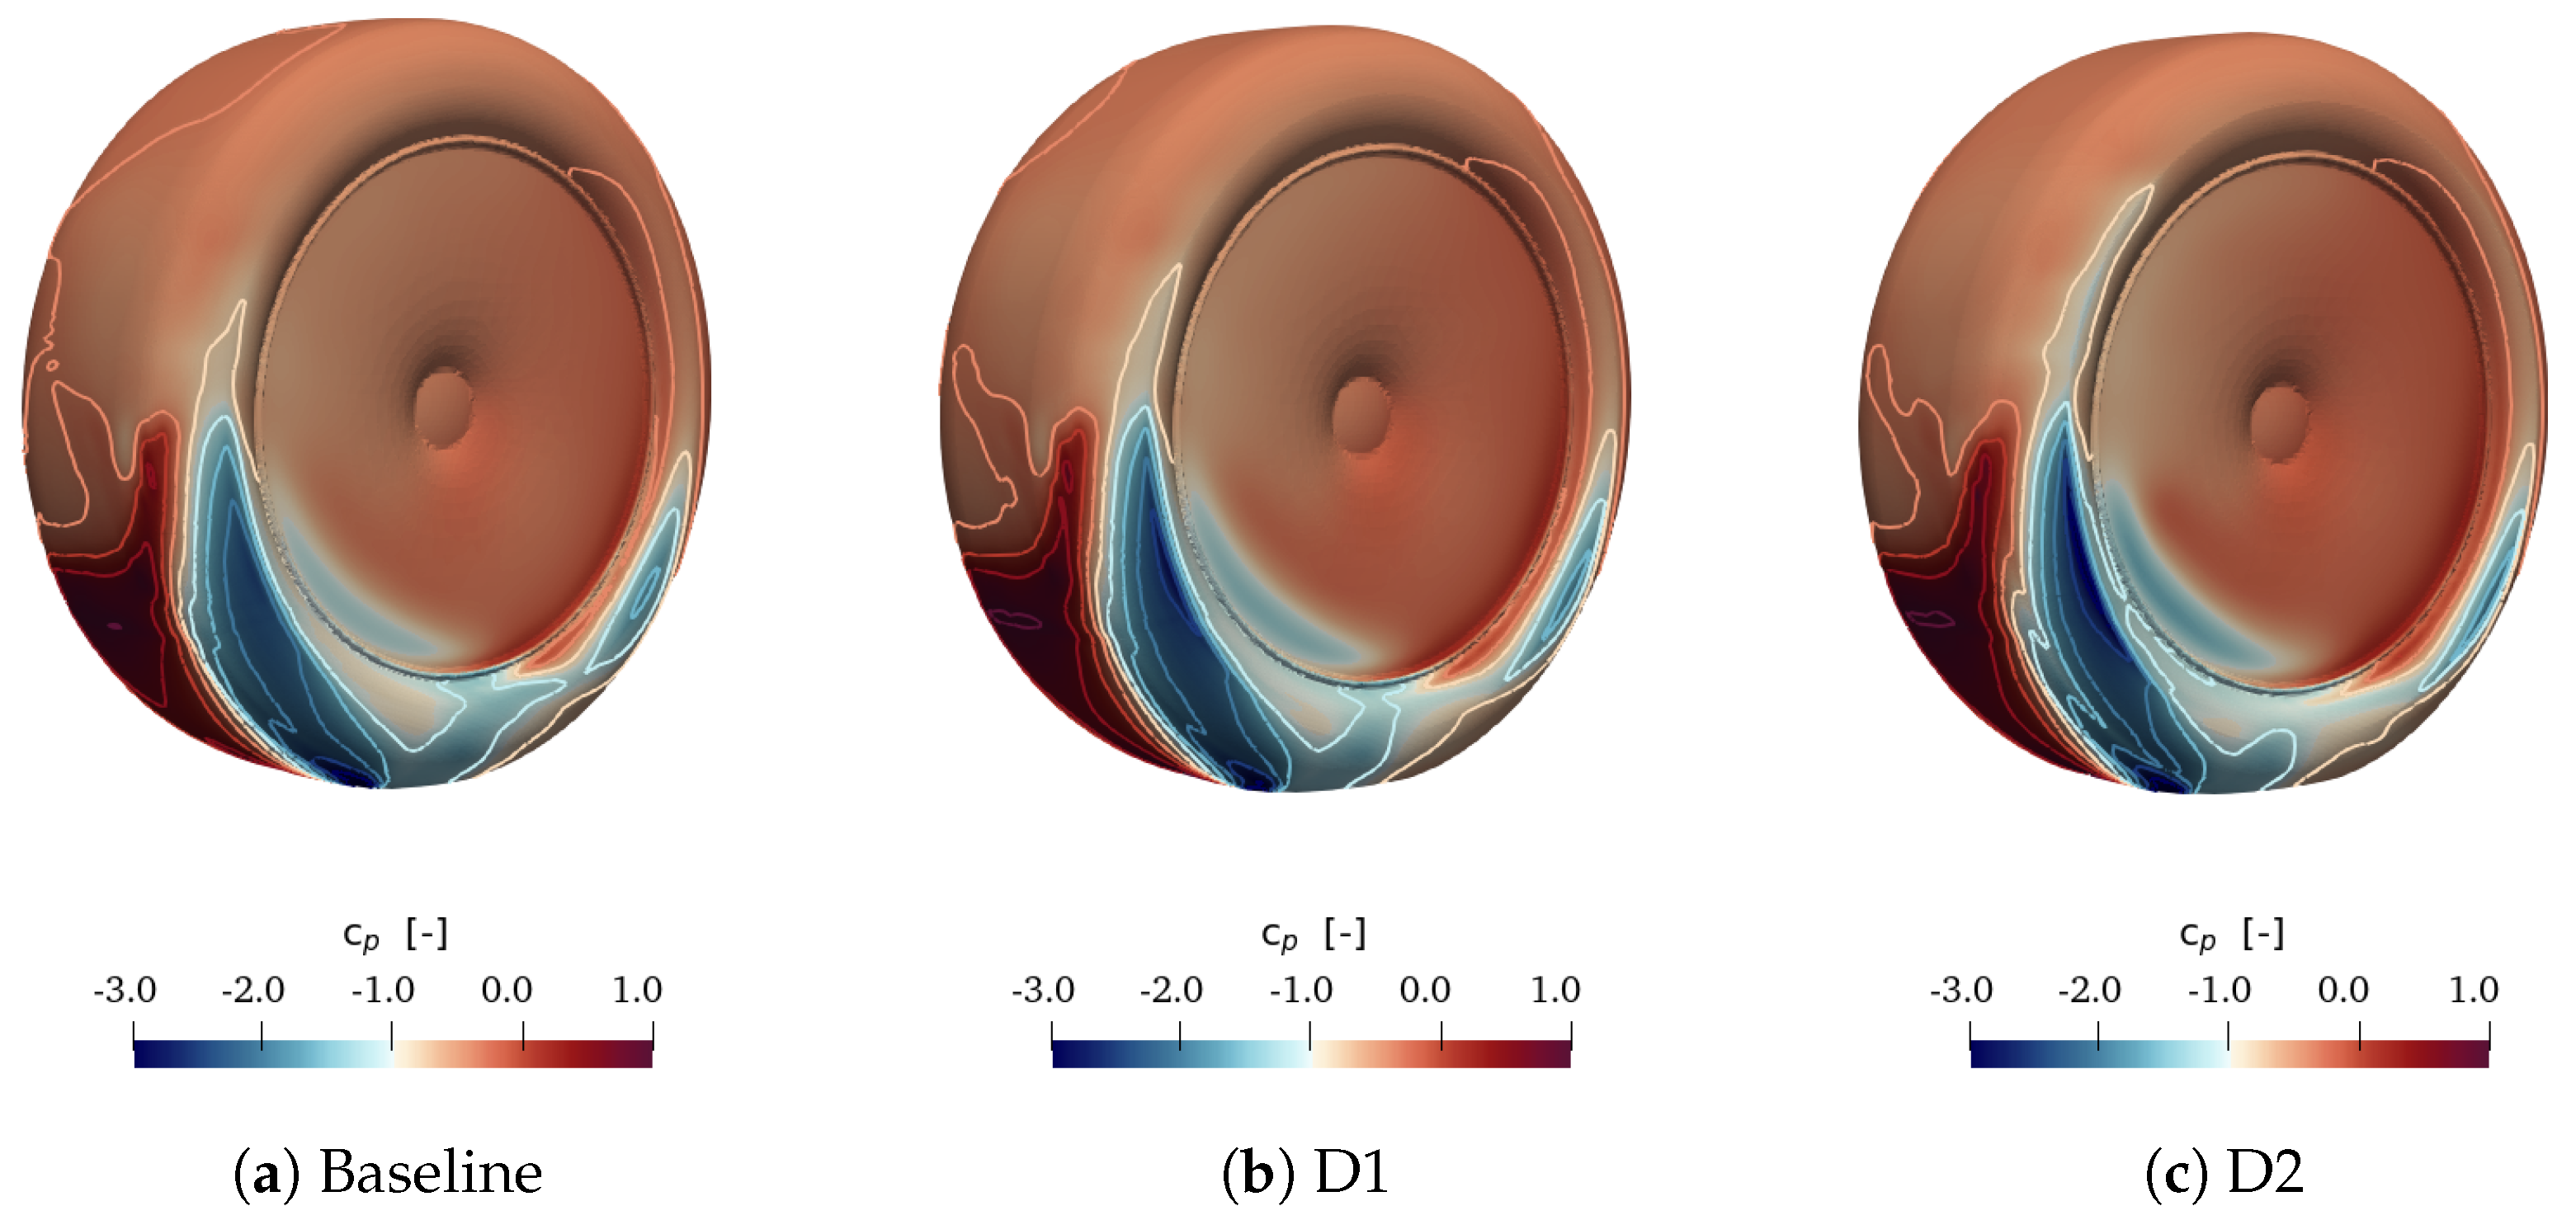
Figure 24 shows the static pressure coefficient on the front wheels of the DrivAer for increasing levels of deformation. From the point of view of the , the differences are mild and the pressure level on the surface of both tires and rims seem to be slightly affected. The high pressure region in the front part of the wheels has a comparable extension, while around the shoulder at the bottom of the tire, the velocity seems to increase when tire deformation increases. This would explain the mild decrease in drag for front tires (up to −10% between baseline and D2) and could be connected to the decrease in shielding by the front part of the car, due to a slight lowering of the tire after the deformation is applied.

Figure 24.
Static pressure coefficient on DrivAer front left wheel.
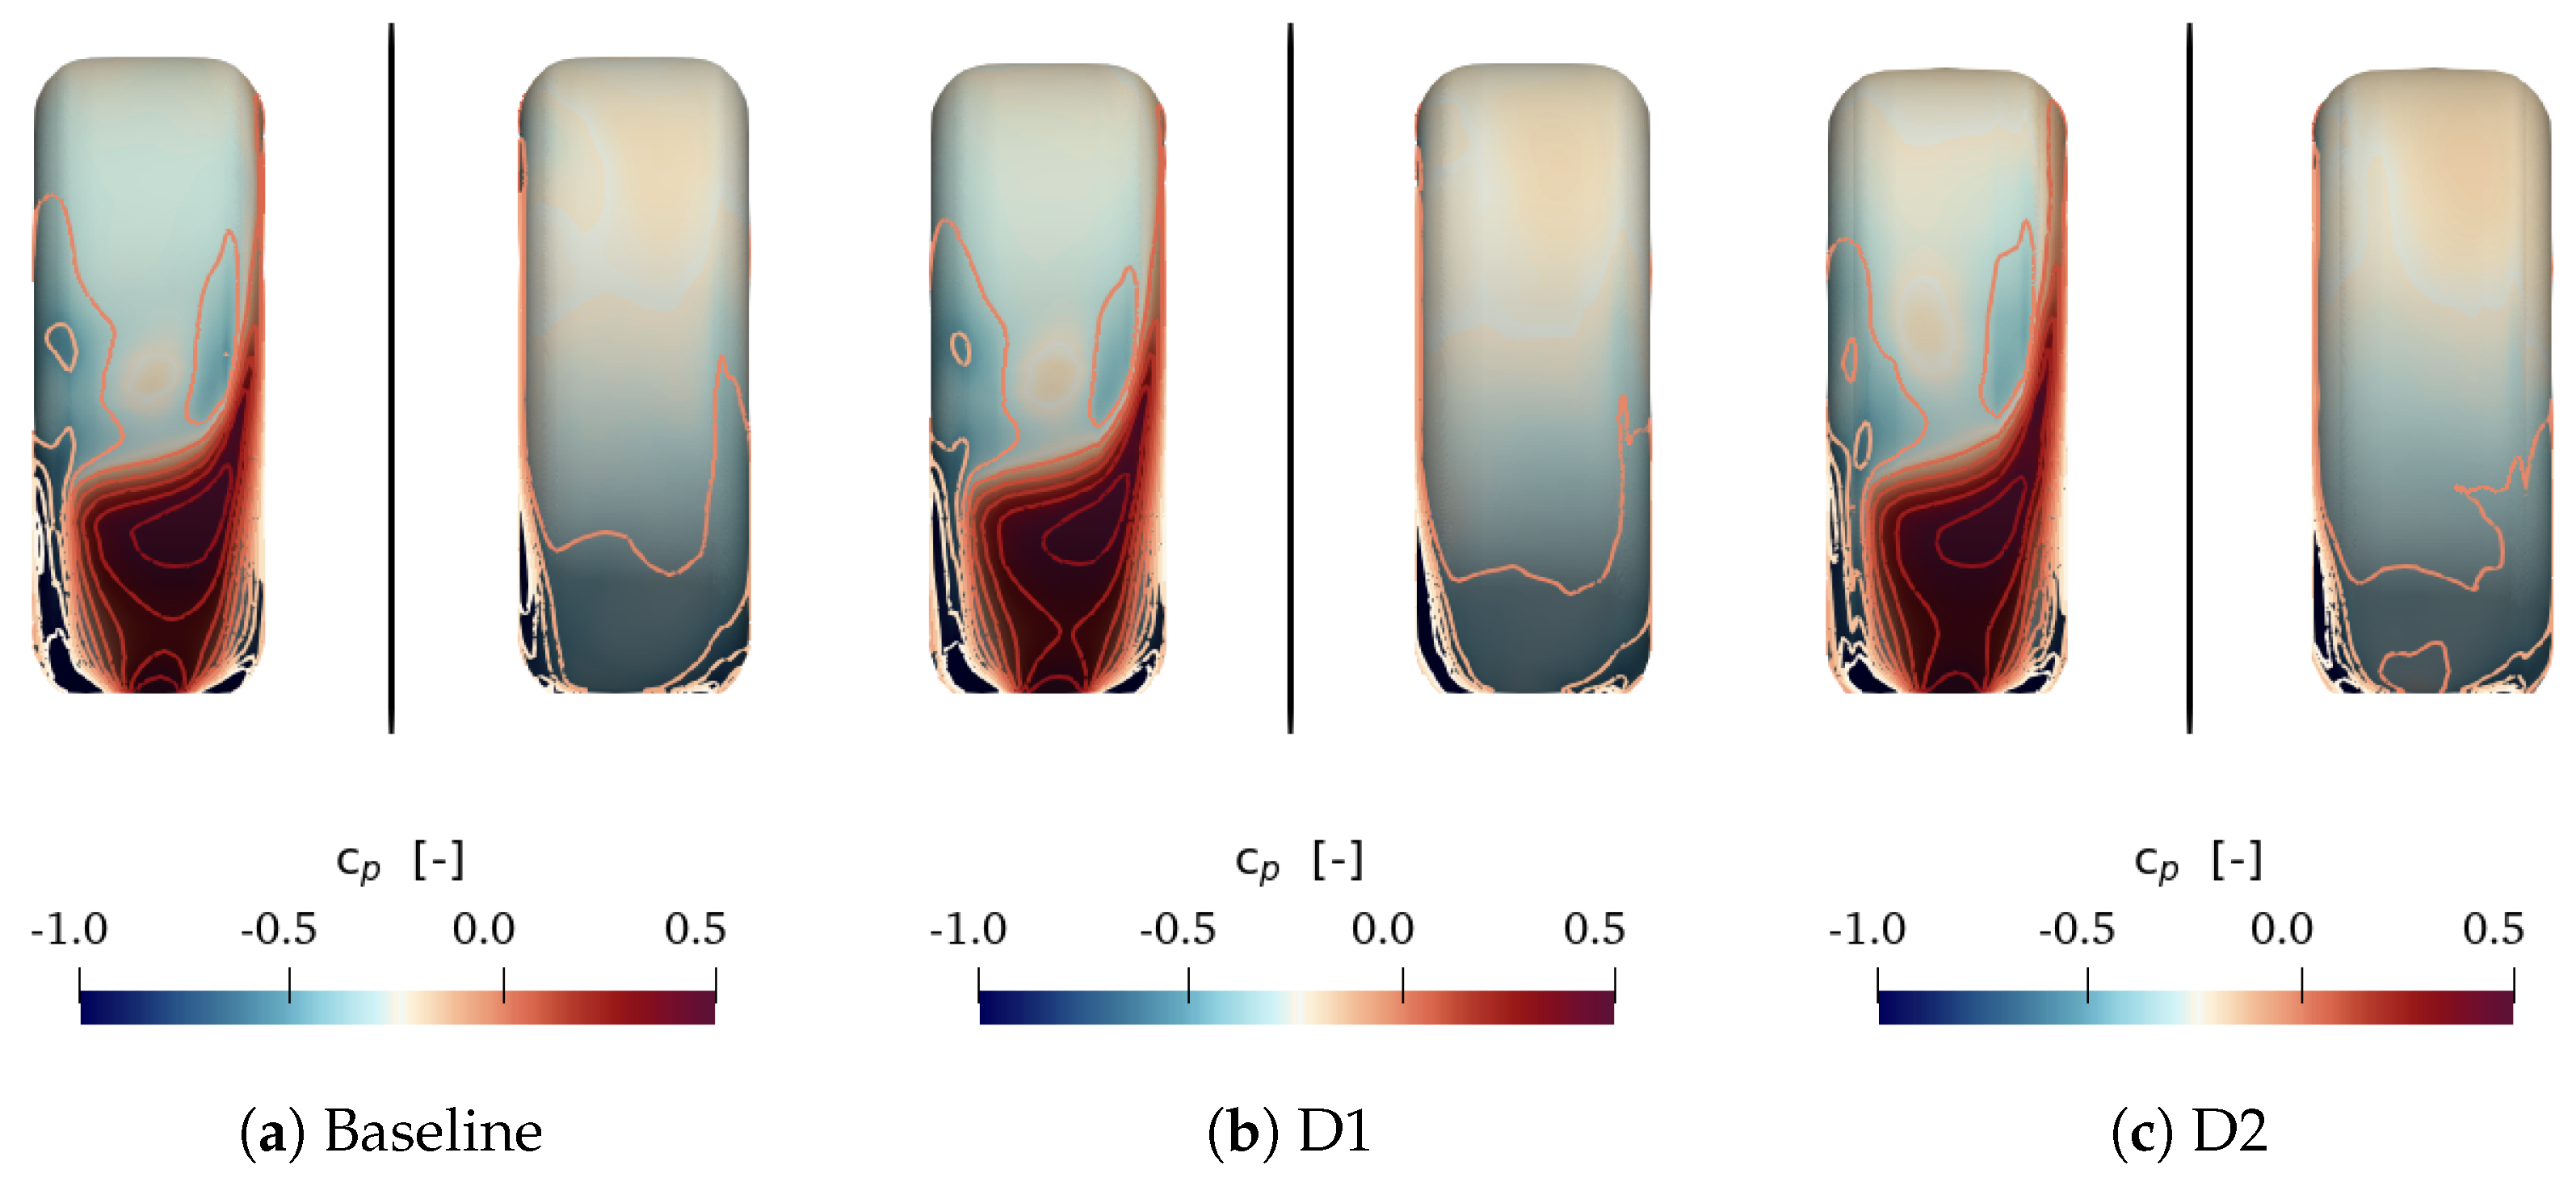
Figure 25 provides the on the surface of the rear left wheel of the DrivAer. Both the front and back views are provided, on the left and on the right respectively.

Figure 25.
Static pressure coefficient on DrivAer rear left wheel: front view (left), rear view (right).
With increasing levels of deformation, the high pressure region in the front part of the wheels is acting on a slightly larger surface, being a bit higher. Another interesting difference can be found in the rear part of the tires, close to the left corner. The low pressure region increases in that corner. The combination of these two factors could explain the increase in drag registered by rear wheels.
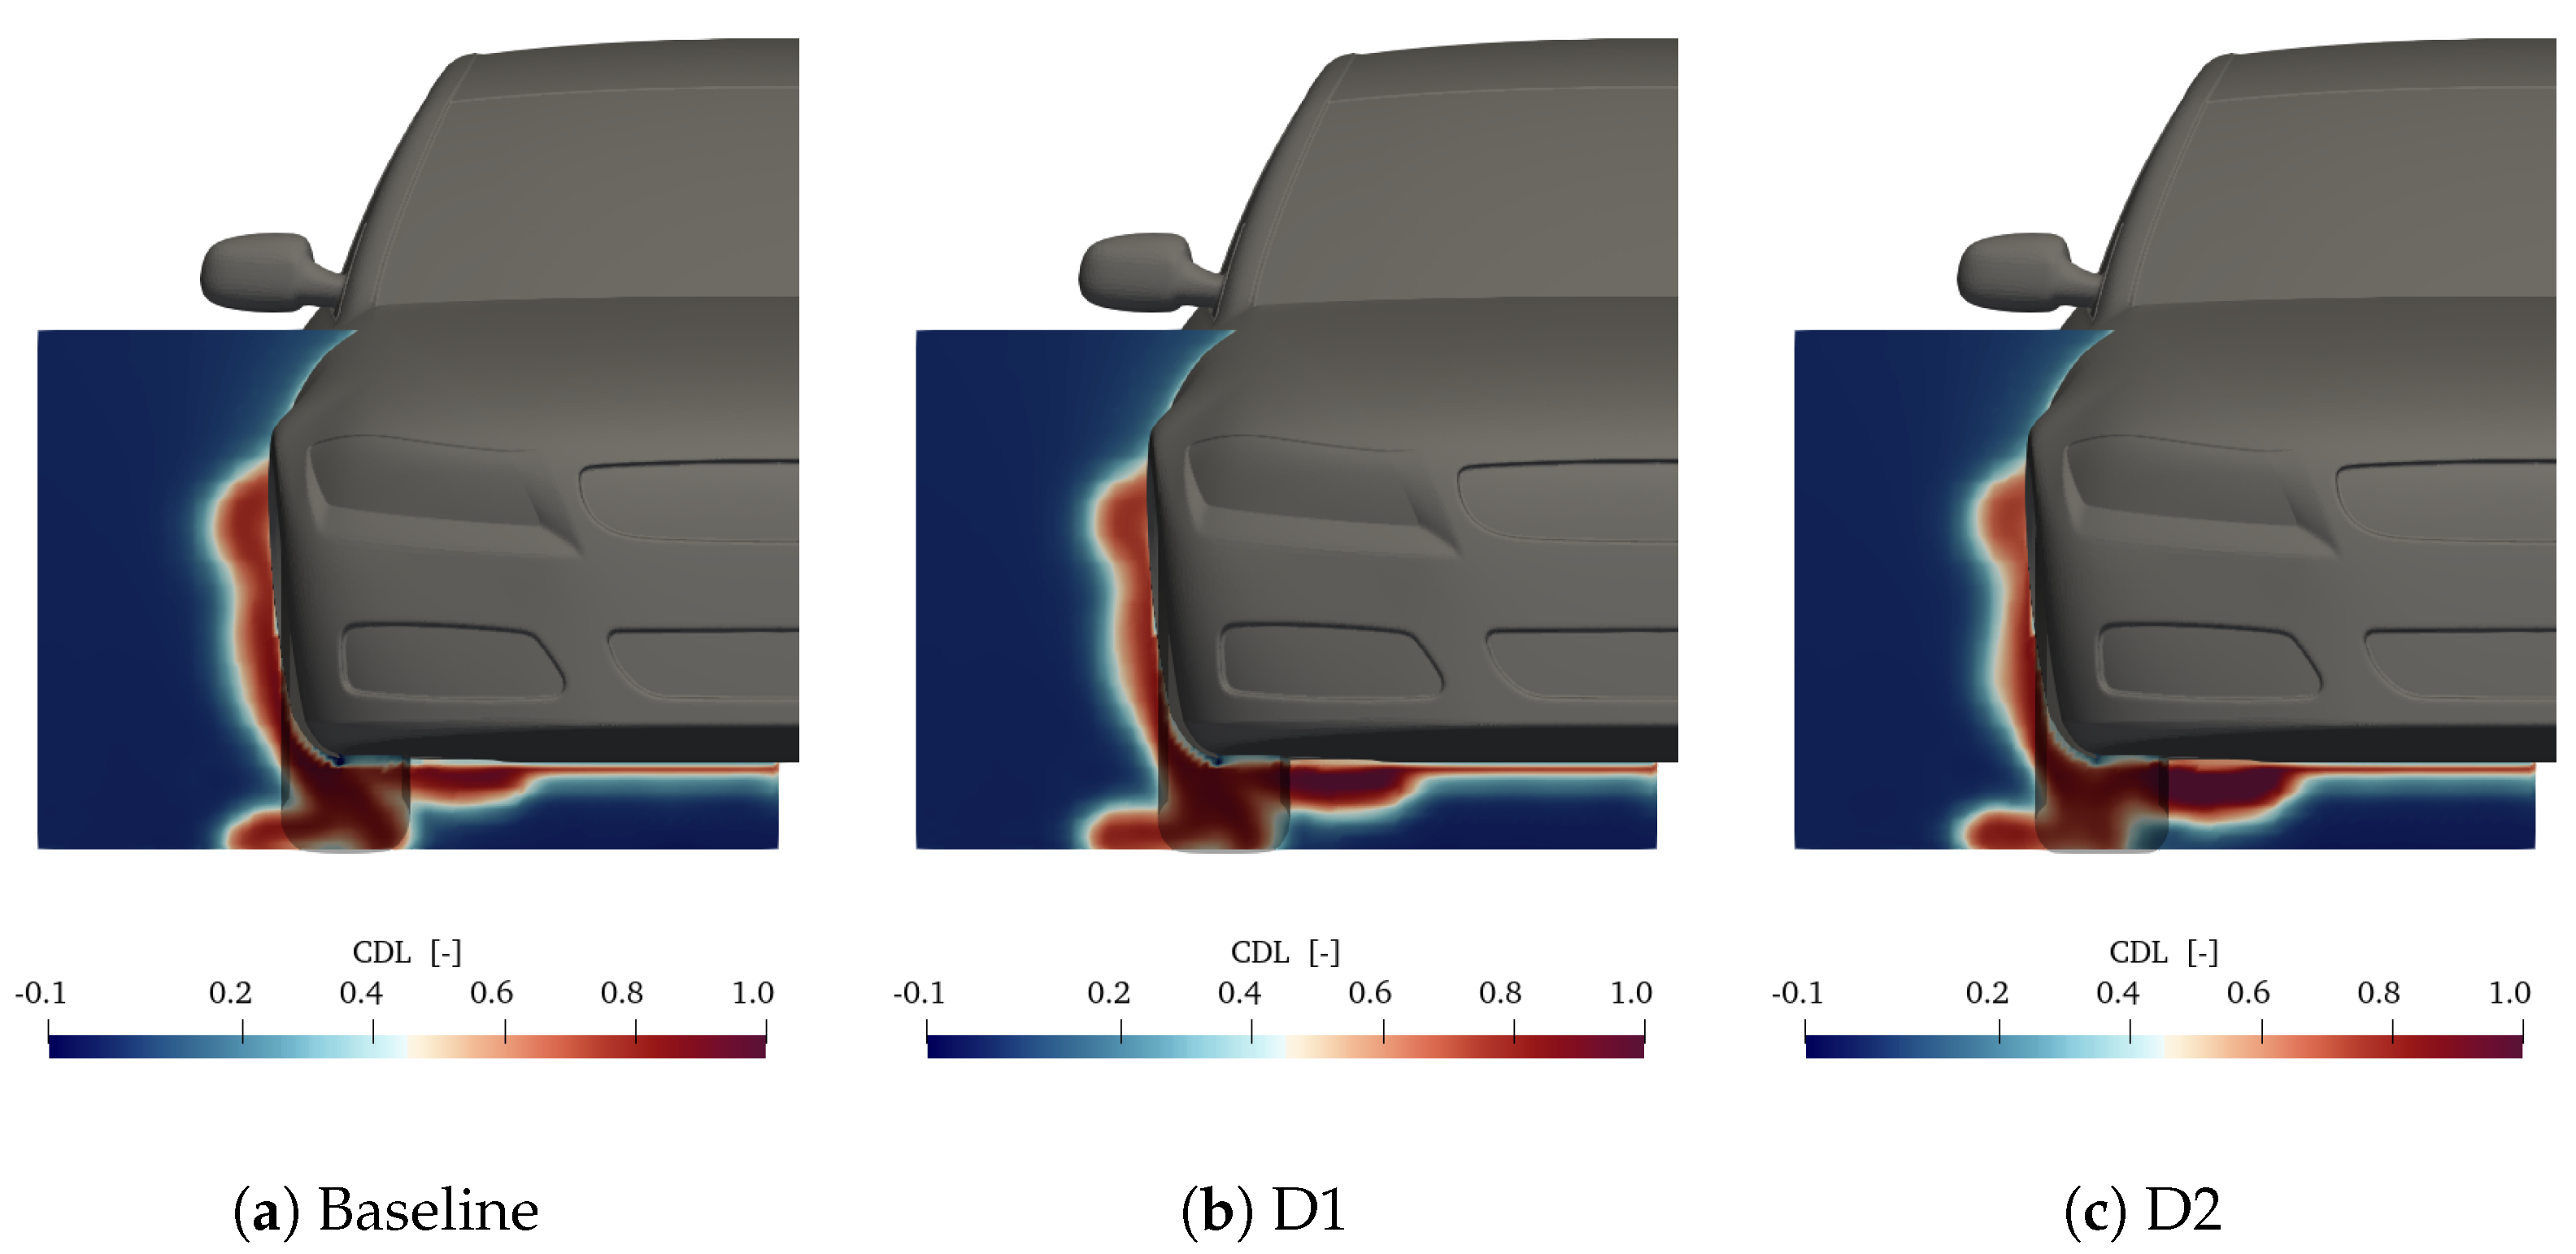
Dealing with front wheels, the combined contribution of tires and rims increases with tire deformation for both the DrivAer and the AeroSUV. This effect is investigated in Figure 26 and Figure 27 with the micro-drag CDL [13,24] in a plane located at x = 0.4 from the wheel axle. This visualization allows to track the drag sources and understand where drag is generated. Going from baseline to D2 configuration for the DrivAer, three main differences can be spotted. The region on the outside of the wheel, the region in the wheel wake and the red region located on the underbody. With increasing level of deformation, all of them increase in intensity and in size. It seems that the wake of the wheel starts moving outboard, while keeping big effects on the close underbody region.
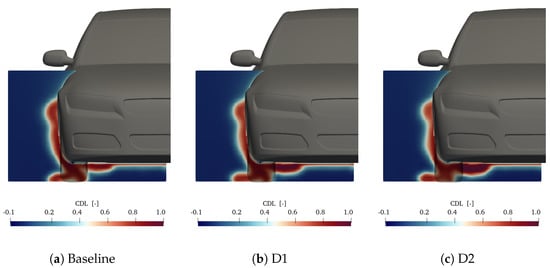
Figure 26.
Micro-drag in the wake of the front wheel. Plane at x = 0.4 m. DrivAer.

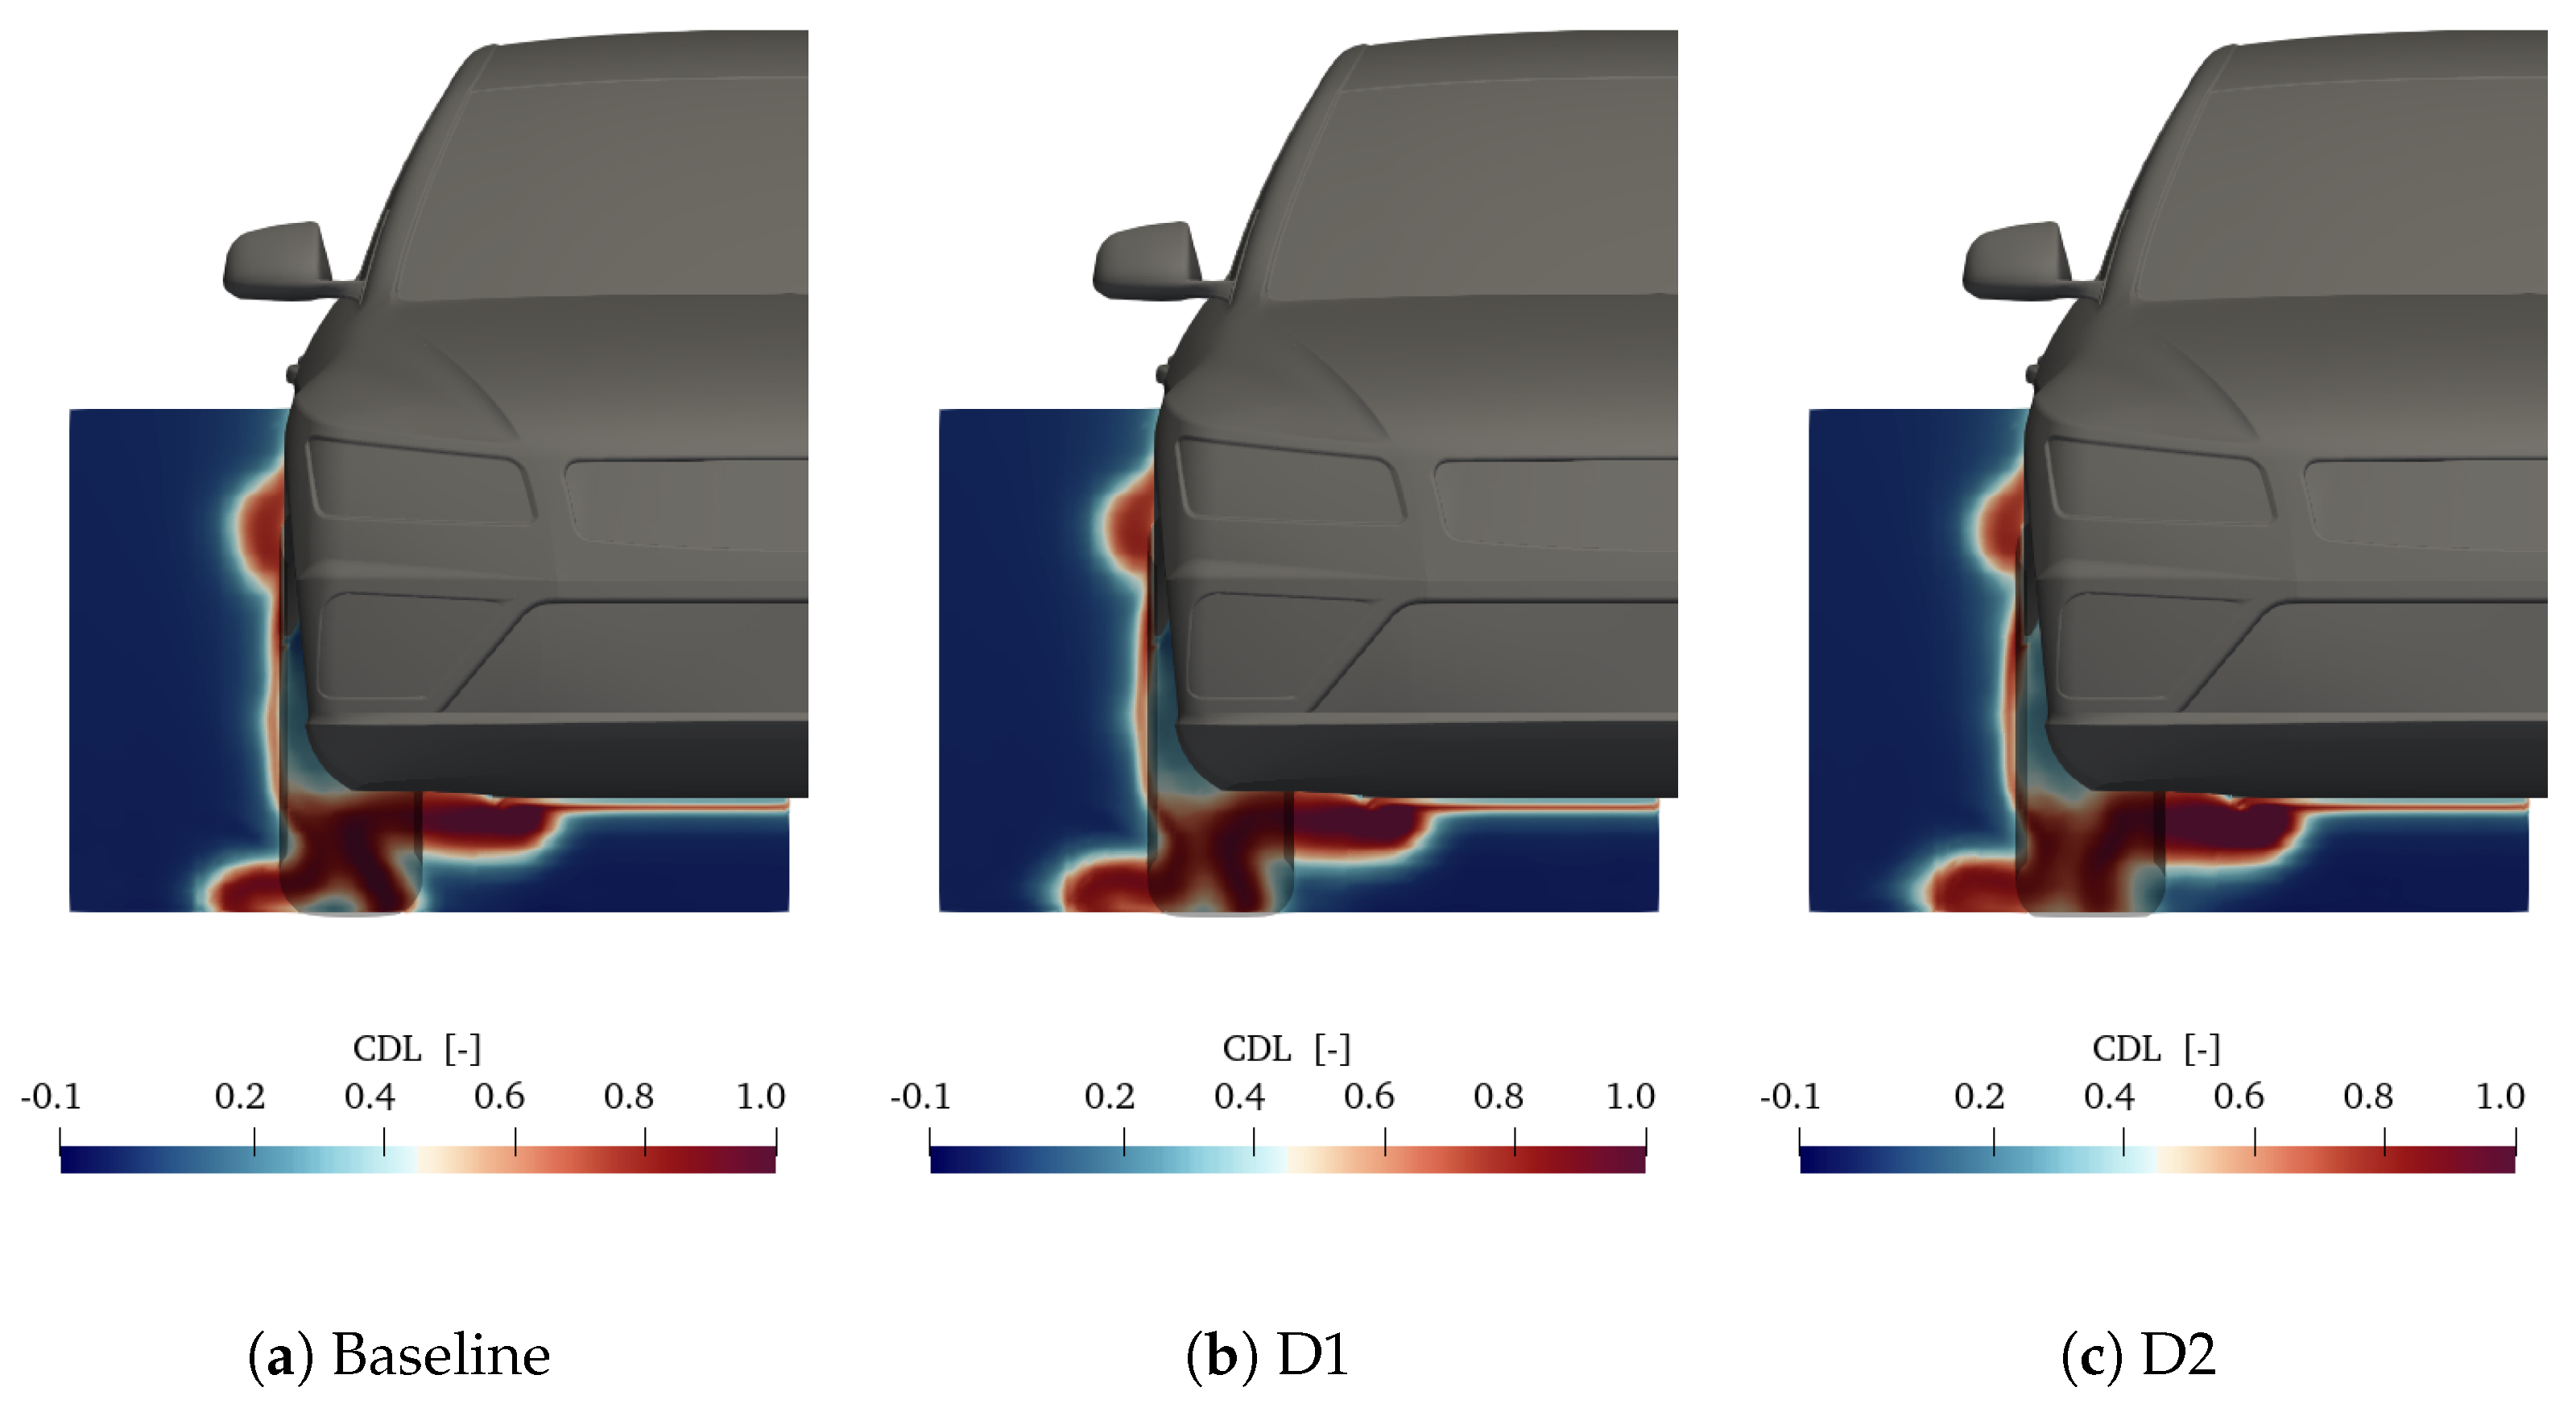
Figure 27.
Micro-drag in the wake of the front wheel. Plane at x = 0.4 m. AeroSUV.
Similar considerations can be done for the AeroSUV. Intensity and size of high CDL regions are bigger and this is confirmed by the force breakdown provided in Figure 23.
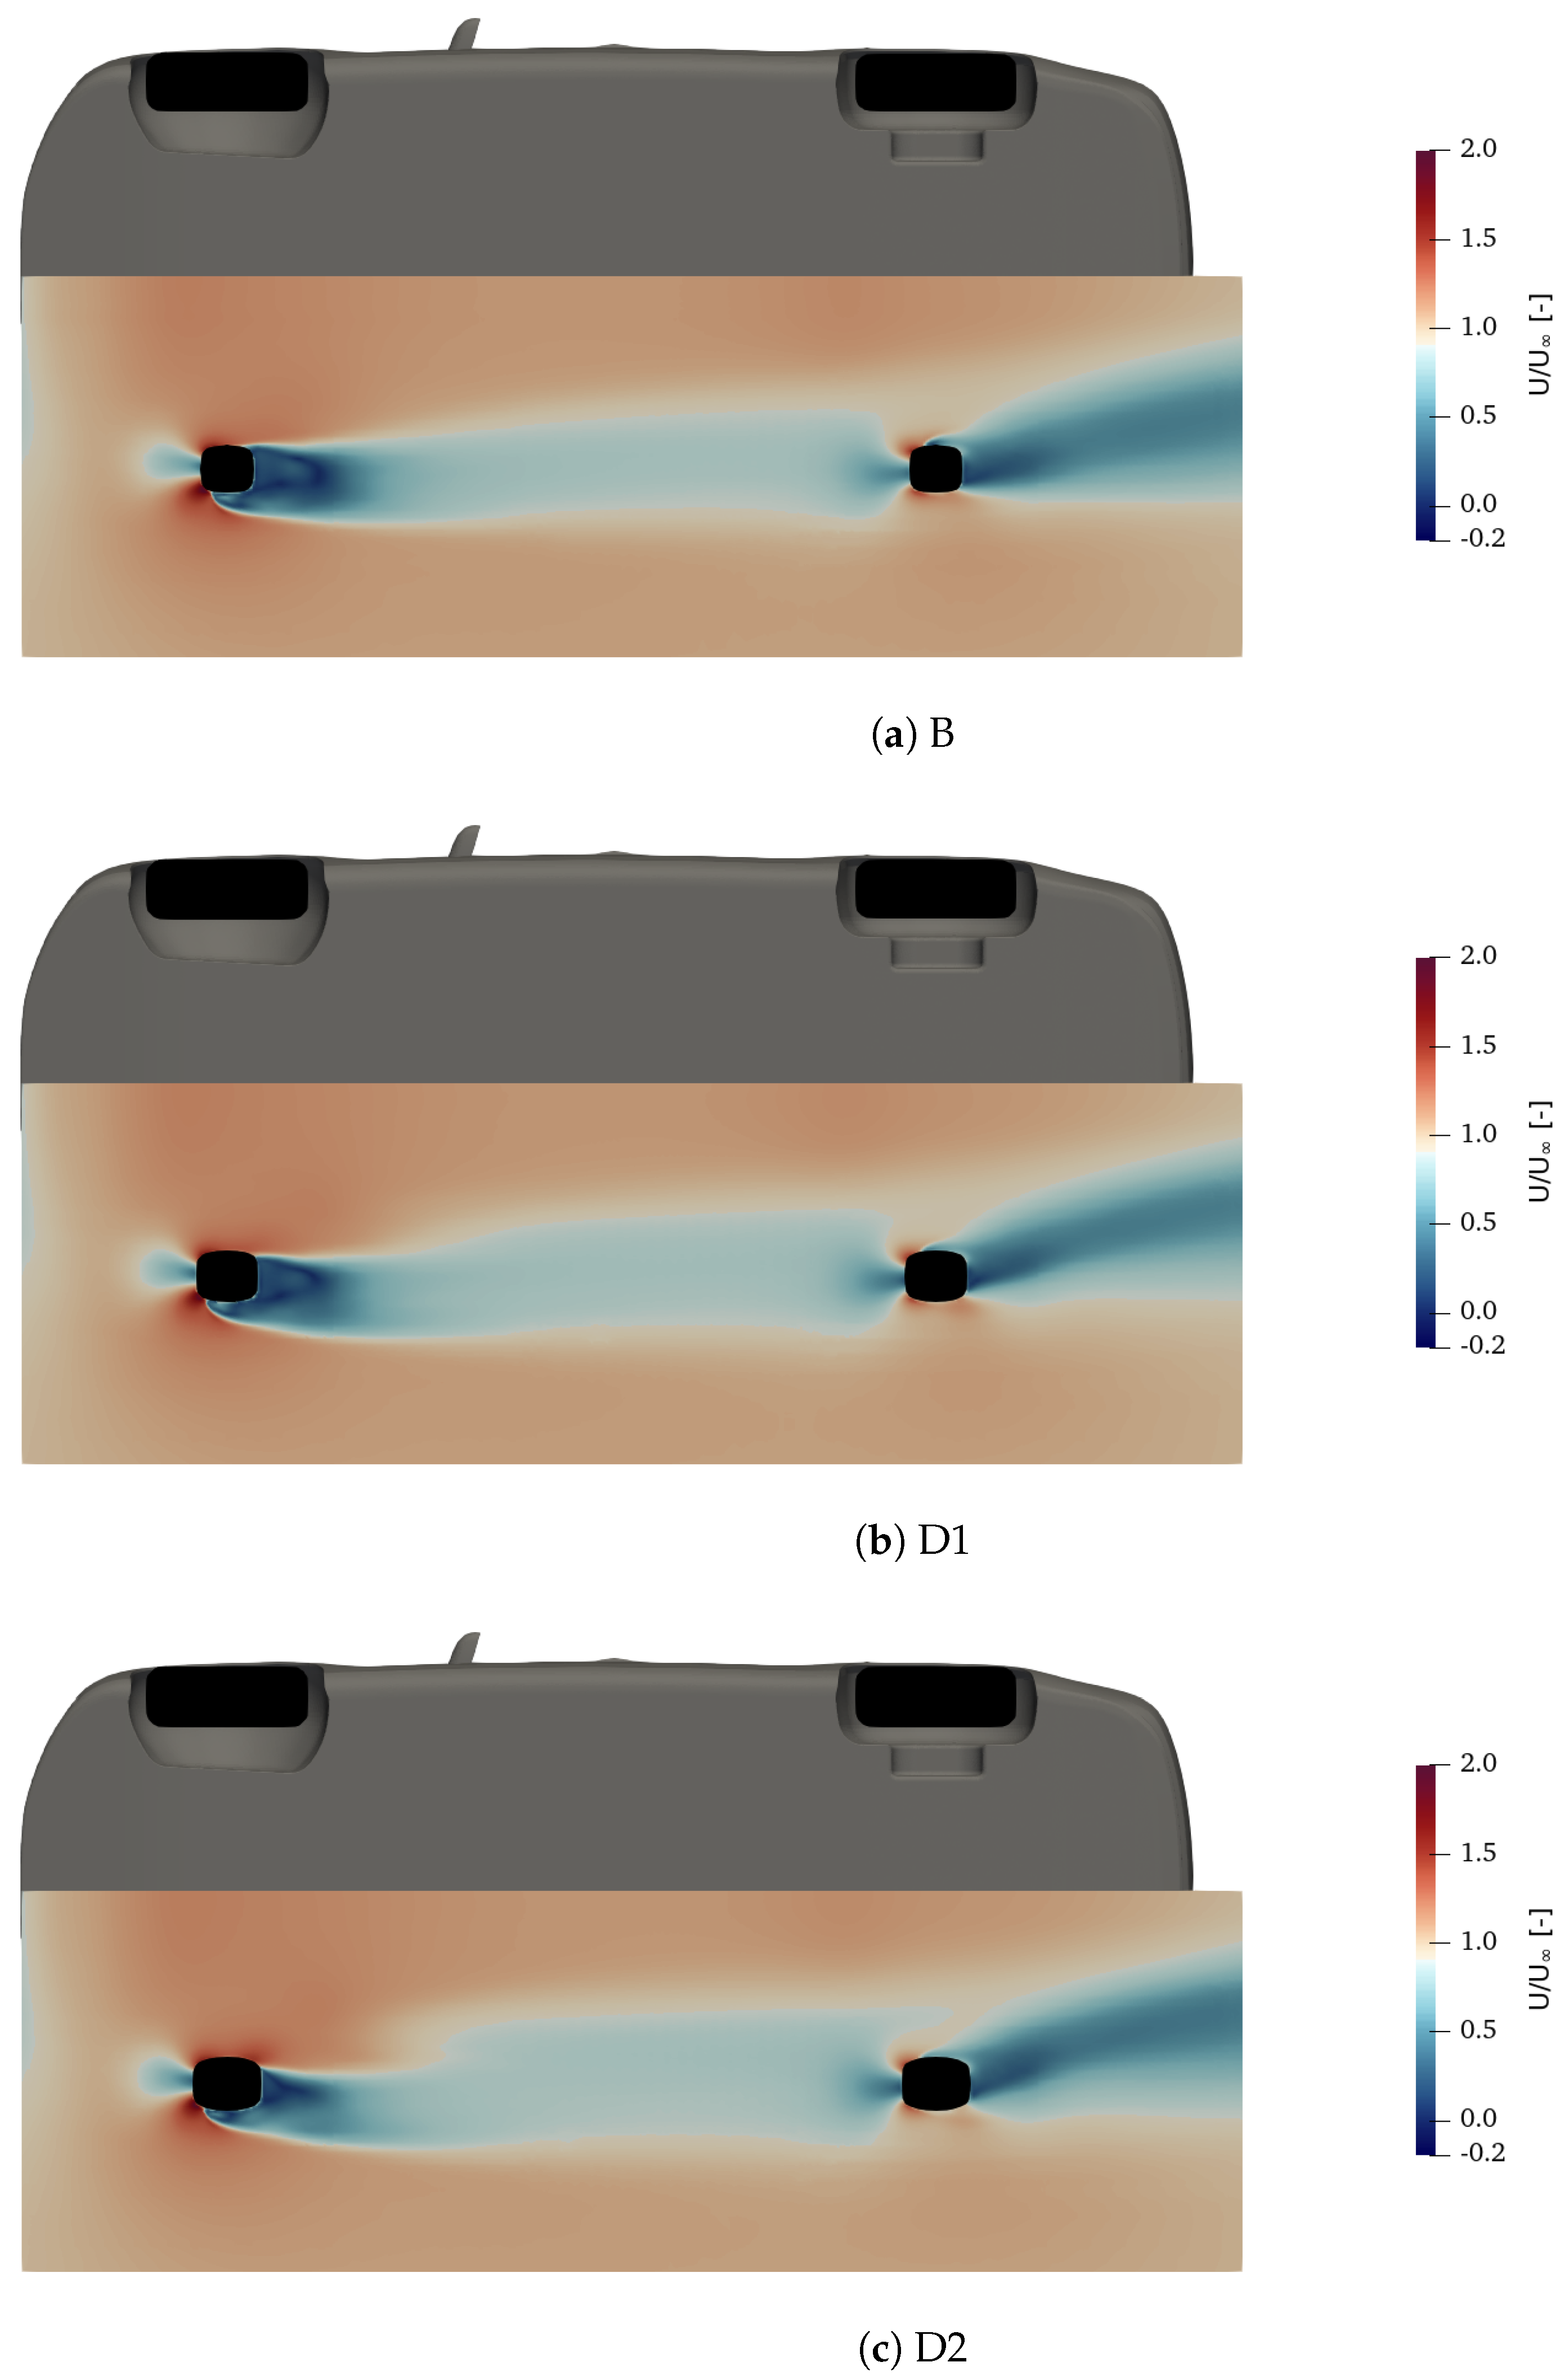
The decreasing drag of front tires and the hints of a outboard deflecting wake required further investigations. The flow field has been inspected to find a possible explanation for the observed behaviour. Figure 28 shows the normalised velocity magnitude in a plane at z = 0.01 m above the ground.
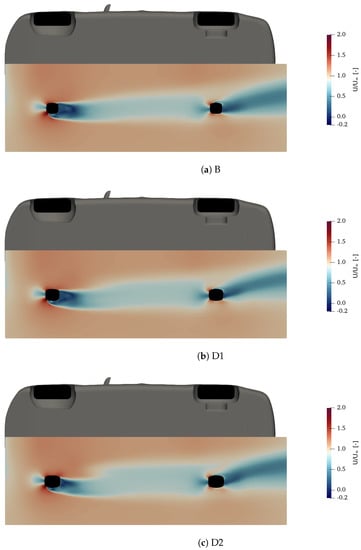
Figure 28.
Normalised velocity magnitude in a plane located at Z = 0.01 m. DrivAer.
The increased size of the contact patch results in a front wheel wake more outboard deflected and a smaller concentrated low momentum region. This could explain the reduction in the longitudinal force component acting on the front tire, with an extremely local effect. Then, the wake from the front tires develops and it is transported towards the rear tires. As the level of deformation increases, the wake region impacting the rear wheel is wider and wider. After the rear wheel, the momentum in the wake is lower and lower with more deformation. This, together with the increasing size of the wake of rear wheels, could explain the increase in drag.
4.3. Tire Deformation and Vehicle Ride Height Combined
To conclude the investigation, tire deformation and vehicle ride height have been combined and their impact is analysed when acting together. When tires are deformed, the amount of deformation is applied as a delta to the vehicle body, which is translated towards the ground. In this way, two parameters that cause the opposite effect are mixed. Tire deformation results in an increase in drag, while a reduction in ride height is beneficial. When the effects are combined, results show that typically a drag increase should be expected. This implies that deformation is the dominant factor in drag formation for the different configurations that have been analysed. These conclusions have been drawn based on the results provided in Figure 29.
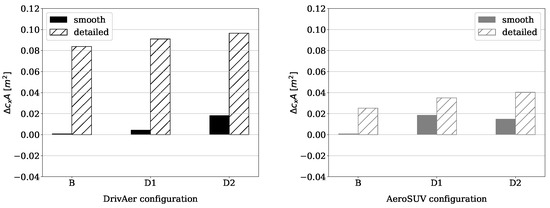
Figure 29.
Effect of vehicle ride height and deformation combined.
It must be mentioned that the AeroSUV shows a different behaviour for increasing levels of deformations. Going from Baseline to D1, drag increases of about 8 counts. Instead, going from D1 to D2, drag decreases by 2 counts. This result seems to be an outlier and cannot be judged properly with the data available at the moment.
A more detailed breakdown of the forces acting on the main vehicle components is provided in Figure 30 and Figure 31 for the DrivAer and the AeroSUV respectively.
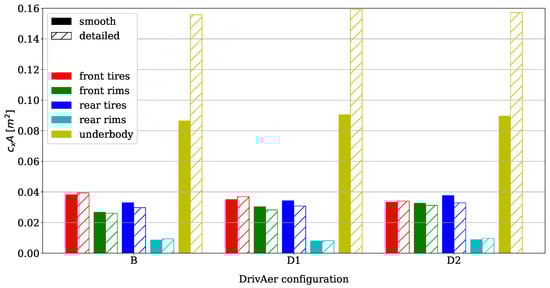
Figure 30.
Forces acting on vehicle components. DrivAer.
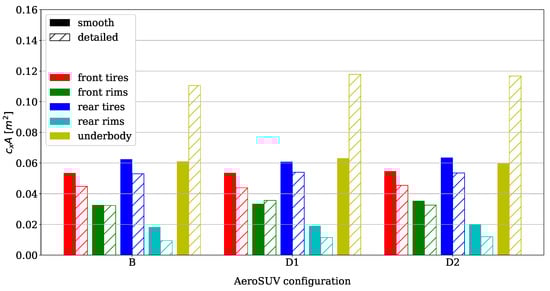
Figure 31.
Forces acting on vehicle components. AeroSUV.
As already found when only tire deformation was considered, the contribution of front tires decreases with increasing levels of deformation. Figure 19 resumes results for only ride height changes and suggests that front tires are almost insensitive to this modification, but Figure 23 highlighted that a decrease in drag could be expected for increasing deformation levels. When ride height and tire deformation are considered together, the latter trend is confirmed. Front rims showed increasing drag levels for increasing deformation and decreasing drag levels for reduced ride height. These two trends are conflicting and the effect shown with deformation prevails. The same happens to rear tires and rear rims. Instead, the underbody is the component that benefits the most by the decreased ride height resulting from the maximum deformation level D2. Indeed, the underbody experiences an increase in drag for the middle deformation level D1 and a slight decrease for the D2.
For the AeroSUV, the forces acting on the smooth underbody are almost constant. The contribution to total drag of front and rear wheels is in agreement with what described for the DrivAer. By comparing the forces acting on the DrivAer and AeroSUV, the wheels of the latter are subject to higher force levels.
5. Conclusions
The investigation described in this work aims at explaining how changes in vehicle ride height and tire deformation contribute to the overall drag of a passenger car. To do so, they have been investigated as separate parameters at first, to isolate their effect and highlight the most important features or modifications introduced in the flow field. Then, they have been combined to reproduce a normal driving condition. The knowledge gained in the first two steps of the work has allowed to better understand how the components share the total drag of the vehicle and where the most significant modifications can be expected.
The most important result of the investigation is that tire deformation consistently has a bigger effect on drag than vehicle ride height changes. A direct effect of tire deformation can be found in the wake of front and rear wheels. At the front, the wake tilts outboard and increases the drag of the underbody. At the rear, the wake of the wheels is characterized by a larger region of low momentum. It also seems that the front wheels typically have a larger share of the total drag, but are less sensitive both to ride height changes and increasing deformation levels. Instead, the contribution to drag of the rear wheels has always been found to be lower, especially for the rims. However, rear wheels have always experienced the biggest relative variations in terms of forces.
The investigation is conducted on two vehicle models with two different underbody configurations each. This part of the work has enriched the discussion with interesting findings. At first, the DrivAer has shown a larger sensitivity (higher drag penalty) to the introduction of a detailed underbody geometry compared to the AeroSUV. The latter has always shown a small contribution from the underbody. In terms of relative weights, with a different underbody the components contribute to the drag of the car differently. This information is useful because a detailed underbody configuration is necessary when the maximum level of accuracy is looked for. Nevertheless, a smooth underbody can be sufficient to at least capture the correct trends most of the times. The relevance of analysing the effects for the smooth underbody is increasing since the increase in sales of electric vehicles. For them, a smooth underbody is the best option for reducing drag and having a longer driving range, which is one of the most important design goals nowadays.
The choice of testing two different vehicle models is based on the results of previous studies present in literature that have shown a different sensitivity to the same tires, depending on the vehicle type. Thus, two vehicles with significant shape differences have been selected, namely a sedan and a SUV. They are equipped with different wheels (16″ and 19″), but surprisingly the effects of vehicle ride height and tire deformation were significantly similar in most of the cases. This is particularly true when the trends are compared, both for intensity and direction.
Outlook
The field of wheel aerodynamics is quite active recently and more and more interesting investigations are available. This study has shown that deformation seems to have a relevant role in the total drag of a passenger car. All the simulations have been done on vehicles with slick tires and closed rims. The authors are interested in expanding the investigations to vehicles with treaded tires and open rims. The authors believe that this study could be worth because the flow field around treaded tires is significantly different from the one observed for slick tires. This would lead to different mechanisms at the basis of drag generation and it is not trivial that the trends will stay the same (both in intensity and direction), considering the effect of grooves. Indeed, the effect of longitudinal grooves is always significantly beneficial to the aerodynamics of tires.
Author Contributions
Conceptualization, F.F.S.; Methodology, F.F.S.; Software, F.F.S.; Validation, F.F.S.; Formal Analysis, F.F.S.; Investigation, F.F.S.; Resources, F.F.S., P.S.; Data Curation, F.F.S.; Writing—Original Draft Preparation, F.F.S.; Writing—Review & Editing, P.S.; Visualization, F.F.S.; Supervision, P.S.; Project Administration, F.F.S.; Funding Acquisition, F.F.S. All authors have read and agreed to the published version of the manuscript.
Funding
This research received no external funding.
Institutional Review Board Statement
Not applicable.
Informed Consent Statement
Not applicable.
Data Availability Statement
The data that support the findings of this study are available from the corresponding author upon reasonable request.
Conflicts of Interest
The authors declare no conflict of interest.
Abbreviations
The following abbreviations are used in this manuscript:
| CFD | Computational Fluid Dynamics |
| WLTP | Worldwide Harmonised Light Vehicle Test Procedure |
| NEDC | New European Driving Cycle |
| SM | Sliding Mesh |
| MRF | Moving Reference Frame |
| RWBC | Rotating Wall Boundary Condition |
| DDES | Delayed-Detached Eddy Simulation |
| RANS | Reynolds Averaged Navier Stokes |
| LES | Large Eddy Simulation |
| Re | Reynolds number |
| BEV | Battery Electric Vehicle |
| Drag coefficient | |
| Side force coefficient | |
| Lift coefficient | |
| Pitch moment coefficient | |
| Drag Area | |
| e | Blockage ratio |
| Coefficient of exposure | |
| Wheel exposed area | |
| Wheel covered area | |
| CDL | Micro-drag |
| Static pressure coefficient | |
| Total pressure coefficient | |
| Friction Coefficient |
References
- Mock, P.; Kühlwein, J.; Tietge, U.; Franco, V.; Bandivadekar, A.; German, J. The WLTP: How a new test procedure for cars will affect fuel consumption values in the EU. Int. Counc. Clean Transp. 2014. Available online: https://theicct.org/publication/the-wltp-how-a-new-test-procedure-for-cars-will-affect-fuel-consumption-values-in-the-eu/ (accessed on 1 December 2021).
- Lee, H.; Lee, K. Comparative Evaluation of the Effect of Vehicle Parameters on Fuel Consumption under NEDC and WLTP. Energies 2020, 13, 4245. [Google Scholar] [CrossRef]
- Wickern, G.; Zwicker, K.; Pfadenhauer, M. Rotating wheels-their impact on wind tunnel test techniques and on vehicle drag results. SAE Trans. 1997, 106, 254–270. [Google Scholar]
- Morelli, A. Aerodynamic Effects on an Automobile Wheel. ATA Rev. 1969, 22, 281–288. [Google Scholar]
- Fackrell, J.E. The Aerodynamics of an Isolated Wheel Rotating in Contact with the Ground. Ph.D. Thesis, Faculty of Engineering, University of London, London, UK, 1974. [Google Scholar]
- Cogotti, A. Aerodynamic characteristics of car wheel. Int. J. Veh. Des. 1983, 3, 173–196. [Google Scholar]
- Wäschle, A.; Cyr, S.; Kuthada, T.; Wiedemann, J. Flow around an Isolated Wheel-Experimental and Numerical Comparison of Two CFD Codes; No. 2004-01-0445; SAE Technical Paper; SAE International: Warrendale, PA, USA, 2004. [Google Scholar]
- Hobeika, T.; Sebben, S.; Lofdahl, L. Study of different tyre simulation methods and effects on passenger car aerodynamics. In Proceedings of the International Vehicle Aerodynamics Conference, Holywell Park, Loughborough, UK, 14–15 October 2014; pp. 187–195. Available online: https://www.semanticscholar.org/paper/Study-of-different-tyre-simulation-methods-and-on-Hobeika-Sebben/976af046013ca7425fbbbea5a4c4f4bc9525c267 (accessed on 1 December 2021).
- Haag, L.; Kiewat, M.; Indinger, T.; Blacha, T. Numerical and experimental investigations of rotating wheel aerodynamics on the DrivAer model with engine bay flow. In Fluids Engineering Division Summer Meeting; American Society of Mechanical Engineers: New York, NY, USA, 2017; p. V01BT12A005. [Google Scholar]
- Hobeika, T.; Sebben, S. CFD investigation on wheel rotation modelling. J. Wind Eng. Ind. Aerodyn. 2018, 174, 241–251. [Google Scholar] [CrossRef] [Green Version]
- Ashton, N.; Revell, A. Comparison of RANS and DES Methods for the DrivAer Automotive Body; SAE Technical Paper; SAE International: Warrendale, PA, USA, 2015. [Google Scholar]
- Ashton, N.; West, A.; Lardeau, S.; Revell, A. Assessment of RANS and DES methods for realistic automotive models. Comput. Fluids 2016, 128, 1–15. [Google Scholar] [CrossRef] [Green Version]
- Schuetz, T. Aerodynamics of Road Vehicles; SAE International: Warrendale, PA, USA, 2016. [Google Scholar]
- Heft, A.I.; Indinger, T.; Adams, N.A. Introduction of a New Realistic Generic Car Model for Aerodynamic Investigations; SAE Technical Paper; SAE International: Warrendale, PA, USA, 2012. [Google Scholar]
- Zhang, C.; Tanneberger, M.; Kuthada, T.; Wittmeier, F.; Wiedemann, J.; Nies, J. Introduction of the AeroSUV—A New Generic SUV Model for Aerodynamic Research; SAE Technical Paper; SAE International: Warrendale, PA, USA, 2019. [Google Scholar]
- Ahmed, S.R.; Ramm, G.; Faltin, G. Some salient features of the time-averaged ground vehicle wake. SAE Trans. 1984, 93, 473–503. [Google Scholar]
- Cogotti, A. A parametric study on the ground effect of a simplified car model. SAE Trans. 1998, 107, 180–204. [Google Scholar]
- Littlewood, R.; Passmore, M. The Optimization of Roof Trailing Edge Geometry of a Simple Square-Back; SAE Technical Paper; SAE International: Warrendale, PA, USA, 2010. [Google Scholar]
- Acea. Available online: https://www.acea.auto/figure/fuel-types-of-new-passenger-cars-in-eu/ (accessed on 1 December 2021).
- Spalart, P. Detached-eddy simulation. Annu. Rev. Fluid Mech. 2009, 41, 181–202. [Google Scholar] [CrossRef]
- Spalart, P.; Allmaras, S. A one-equation turbulence model for aerodynamic flows. In Proceedings of the 30th Aerospace Sciences Meeting and Exhibit, Reno, NV, USA, 6–9 January 1992; p. 439. [Google Scholar]
- Guilmineau, E.; Deng, G.B.; Leroyer, A.; Queutey, P.; Visonneau, M.; Wackers, J. Assessment of hybrid RANS-LES formulations for flow simulation around the Ahmed body. Comput. Fluids 2018, 176, 302–319. [Google Scholar] [CrossRef]
- Ekman, P.; Wieser, D.; Virdung, T.; Karlsson, M. Assessment of hybrid RANS-LES methods for accurate automotive aerodynamic simulations. J. Wind Eng. Ind. Aerodyn. 2020, 206, 104301. [Google Scholar] [CrossRef]
- Cogotti, A. Flow-Field Surveys behind Three Squareback Car Models Using a New “Fourteen-Hole” Probe; SAE Technical Paper; SAE International: Warrendale, PA, USA, 1987. [Google Scholar]


Publisher’s Note: MDPI stays neutral with regard to jurisdictional claims in published maps and institutional affiliations. |
© 2022 by the authors. Licensee MDPI, Basel, Switzerland. This article is an open access article distributed under the terms and conditions of the Creative Commons Attribution (CC BY) license (https://creativecommons.org/licenses/by/4.0/).