Article

Jet Velocity and Acoustic Excitation Characteristics of a Synthetic Jet Actuator

1
Faculty of Applied Science and Technology, Sheridan College, Brampton, ON L6Y 5H9, Canada
2
Department of Mechanical and Industrial Engineering, University of Toronto, Toronto, ON M5S 3G8, Canada
3
Institute for Aerospace Studies, University of Toronto, Toronto, ON M3H 5T6, Canada
*
Author to whom correspondence should be addressed.
Fluids 2022, 7(12), 387; https://doi.org/10.3390/fluids7120387
Submission received: 14 October 2022 / Revised: 12 December 2022 / Accepted: 14 December 2022 / Published: 16 December 2022
(This article belongs to the Special Issue Recent Advances in Fluid Mechanics: Feature Papers, 2022)

Abstract

:
The effect of the excitation frequency of synthetic jet actuators on the mean jet velocity issuing from an array of circular orifices is investigated experimentally, focusing on the acoustic excitation characteristics of the actuator’s cavity. Two cavity configurations are considered. In the first configuration, synthetic jets are generated by exciting a single, large cavity having an array of sixteen orifices via sixteen piezoelectric elements. In the second configuration, the cavity volume of the first configuration is divided into eight isolated compartments, each with two orifices and two piezoelectric elements. Several distinct resonant peaks were observed in the frequency response of the synthetic jet actuator built with a single large-aspect-ratio cavity, whereas the case of compartmentalised cavities exhibited a single resonant peak. Acoustic simulations of the large-aspect-ratio-cavity volume showed that the multiple peaks in its frequency response correspond to the acoustic standing-wave mode shapes of the cavity. Due to its large aspect ratio, several acoustic mode shapes coexist in the excitation frequency range aside from the Helmholtz resonance frequency. When the actuator’s cavity volume is compartmentalised, only the Helmholtz resonance frequency is observed within the excitation frequency range.

1. Introduction

Previous work on synthetic jet actuators (SJAs) has proven their potential to delay flow separation over critical aerodynamic surfaces [1,2,3,4]. Like many other active flow control techniques [5,6], SJAs have the promising aspect of being tuned to control-separated flow in different conditions. In this technology, flow control is achieved by injecting flow via the external excitation of an enclosed cavity volume. SJAs contain a piezoelectric diaphragm that alternates the air volume in the cavity and produces the synthetic jet through an orifice [7,8]. SJAs are generally smaller than an aircraft wingspan, so they are usually used in array form to cover long spans in aeronautical applications [9,10]. There have been several studies in the literature that first focused on the design of a singular SJA unit and then utilized these units in arrays for a magnified effect. SJAs may comprise a number of discrete cavities excited by isolated piezoelectric elements [11,12] or a large, unified-cavity volume excited simultaneously by several piezoelectric elements. In the latter case, the single, large cavity may have several orifices [10] or a large-aspect-ratio rectangular slot [13,14]. Tang et al. [12] characterized a single cube-shaped cavity-volume unit powered by four piezoelectric elements and used ten of these SJA units, keeping them isolated, in an array form along an aerofoil span. In the frequency response of the single SJA unit, Tang et al. [12] observed a single peak corresponding to the Helmholtz resonance frequency for different excitation voltages. Therefore, they recommended operating the actuator near its Helmholtz frequency to achieve the highest possible jet velocity. Jabbal et al. [9] also used discrete, inclined cavities in an array form, where each chamber was powered by a single piezoelectric element of its own. They showed that inclining the cavities allows for the overlapping of the actuators and thereby reduces the size of the array with respect to the non-inclined version while maintaining a comparable mean jet velocity. Both Feero et al. [13] and Amitay et al. [15] employed synthetic jets issuing from a large-aspect-ratio rectangular slot to control flow separation over the span of an aerofoil. The internal cavity in their SJAs contained a single large-aspect-ratio cavity covering the length of the rectangular slot. Exciting such a single, large cavity with multiple piezoelectric elements brings the advantage of amplifying the output jet velocity compared to isolated volumes. Both groups showed that SJAs with large cavities and several excitation elements exhibit complex frequency responses when compared to isolated units. Currently, there is no general consensus on the design approach for SJA arrays, and it would be very important to understand the difference between using arrays of isolated SJA units or a single connected unit. Hence, insight into the characteristics of SJA arrays of different cavity types is needed for optimum design and flow-control output.
It is generally recommended to match the excitation frequency of SJAs to a flow instability to improve the flow-control effectiveness of the actuator [16]. Amitay and Glezer [16] showed that when the excitation frequency matches the frequency of the wake instability, unsteady flow reattachment over an aerofoil can be achieved via large-scale vortices that attract the flow towards the trailing edge of the aerofoil. On the other hand, when the excitation frequency matches the frequency of the shear-layer instability—which is approximately one order of magnitude higher than the frequency of the wake instability—flow control is achieved by the induction of small-scale vortices that may suppress the flow separation in a large eddy sheet or the separated layer [17]. Moreover, for efficient SJA performance it is suggested to use an excitation frequency that maximises the mean jet velocity injected into the crossflow to magnify the momentum flux into the crossflow [18]. Therefore, the excitation frequency in a well-designed SJA should match one of the instability frequencies and provide maximum jet velocity. These considerations should also leave some room for fine-tuning. Maximising the jet velocity from a cavity is generally achieved by exciting the cavity at its Helmholtz resonance frequency. Alternatively, the mechanical resonance of the oscillating diaphragm may also be targeted so that the excitation frequency amplifies the jet velocity [19]. Gallas et al. [20] proposed modelling the SJA components as elements of an equivalent electrical circuit using the Lumped Element Modelling (LEM) method to characterise the SJA response based on its geometry and material properties. This method could predict the interaction of the Helmholtz resonance frequency and the mechanical resonance frequency of the oscillating diaphragm when these frequencies are close to each other. The Helmholtz resonance frequency for the cavity volume, fH, can be estimated theoretically using the cavity and orifice dimensions as follows:
f H = c 2 π A L e V
where c is the speed of sound, A is the cross-sectional area of the orifice, Le is the equivalent depth of the orifice neck, and V is the cavity volume [21]. However, it should be noted that the Helmholtz equation is formulated for an ideal spherical volume in which the sound-wave propagation matches the volume boundaries. The mechanical-resonance frequency of the diaphragm can be formulated based on its geometric, material, and electrical properties [22]. It is also affected by the clamping condition of the diaphragm circumference, which may deviate the actual resonance frequency of the diaphragm from its theoretical formulation. If the Helmholtz resonance frequency of the cavity and the mechanical resonance frequency of the diaphragm used in the SJA are too close to each other, a coupled frequency response would be obtained in which the two peaks deviate from their theoretically estimated values and merge into one peak, which may maximise the peak jet velocity [22,23]. Such a situation is unpredictable and may be overlooked in the initial design phase, but would be discovered upon SJA implementation.
Another design aspect related to frequency is the noise generated from the actuator. Several studies in the literature were aimed at enhancing the SJA designs by reducing the resulting noise. This was achieved through several methods such as having out-of-phase dual-acting orifices [24], introducing phase miss-matching [25], soundproofing the cavity walls [26], or using different orifice shapes [27]. These studies showed very promising results. However, they also indicated the need for more understanding of the acoustic excitation characteristics of SJAs to reach a better design. Van Buren et al. [23,28] investigated the synthetic-jet-cavity acoustics to determine the effects of the orifice size and cavity volume on the resonance frequency of the SJA. They showed that, for a ‘pancake-shaped’ (high-aspect-ratio disk) cavity, the Helmholtz equation overestimates the value of the resonance frequency. They concluded that the acoustic resonance frequency is better estimated by a quarter-wavelength resonator equation when the cavity is thin and the orifice opening is relatively large. This is because this cavity volume shape tends towards having the necessary boundaries for the quarter-wavelength excitation (with an open-end condition at the orifice and a closed end at the cavity wall opposite to the orifice). On the other hand, as the width of the cavity increases with respect to diameter (diverging from the pancake shape) and the orifice size decreases, the Helmholtz equation becomes better in determining the resonance frequency while the accuracy of the quarter-wavelength resonator equation reduces. This can be attributed to the fact that the cavity widens and approaches an ideal Helmholtz-resonator shape (more detailed work on the effects of Helmholtz and quarter-wave resonators on cavity acoustics can be found in Ref. [29]). The work of Van Buren et al. [28] demonstrated that the geometry of the cavity volume controls the phenomenon responsible for the acoustic resonance of the SJA cavity. Therefore, the Helmholtz resonance equation may be insufficient to estimate the resonance frequency of SJA cavities, especially when considering geometries that significantly differ from the ideal Helmholtz resonator.
Feero et al. [30] investigated the effect of the synthetic jet injection location on the control of flow past an aerofoil. They used sixteen piezoelectric elements to excite a single large-aspect-ratio-cavity volume (similar to what will be investigated herein). The synthetic jet was introduced through a high-aspect-ratio rectangular slot encompassing a slender cavity volume. They observed that the mean jet-velocity response of the SJA depicts several local peaks at various excitation frequencies. An observation of multiple peaks in the jet-velocity response implies that the acoustic excitation characteristics of their cavity are not as simple as a Helmholtz excitation case and need further understanding. The literature lacks comprehensive studies on the acoustic excitation features of SJA cavities and how they may impact the generated jet velocities. It is crucial to understand all aspects related to the acoustic excitation phenomena in SJA cavities for designing SJAs with maximum actuator performance, which is the main motivation of the current study.
This paper investigates the frequency response of an SJA with emphasis on determining the effect of the cavity shape on the acoustic excitation characteristics of the SJA. Focus is placed on synthetic jets emanating from an array of circular orifices into the span of a flat plate under quiescent flow conditions. The effect of the excitation frequency on the mean jet velocity emanating from the SJA is characterized. Furthermore, on- and off-resonance excitation frequencies are used to capture the impact of the acoustic resonance excitation on the uniformity of the jet velocity along the span of the array. This work also compares the acoustic excitation characteristics of a single, large-aspect-ratio-cavity volume to those resulting from isolated volumes covering the same spanwise length. This shall provide a better understanding of the complex acoustic excitation characteristics of these cavity types.

2. Experimental and Numerical Techniques

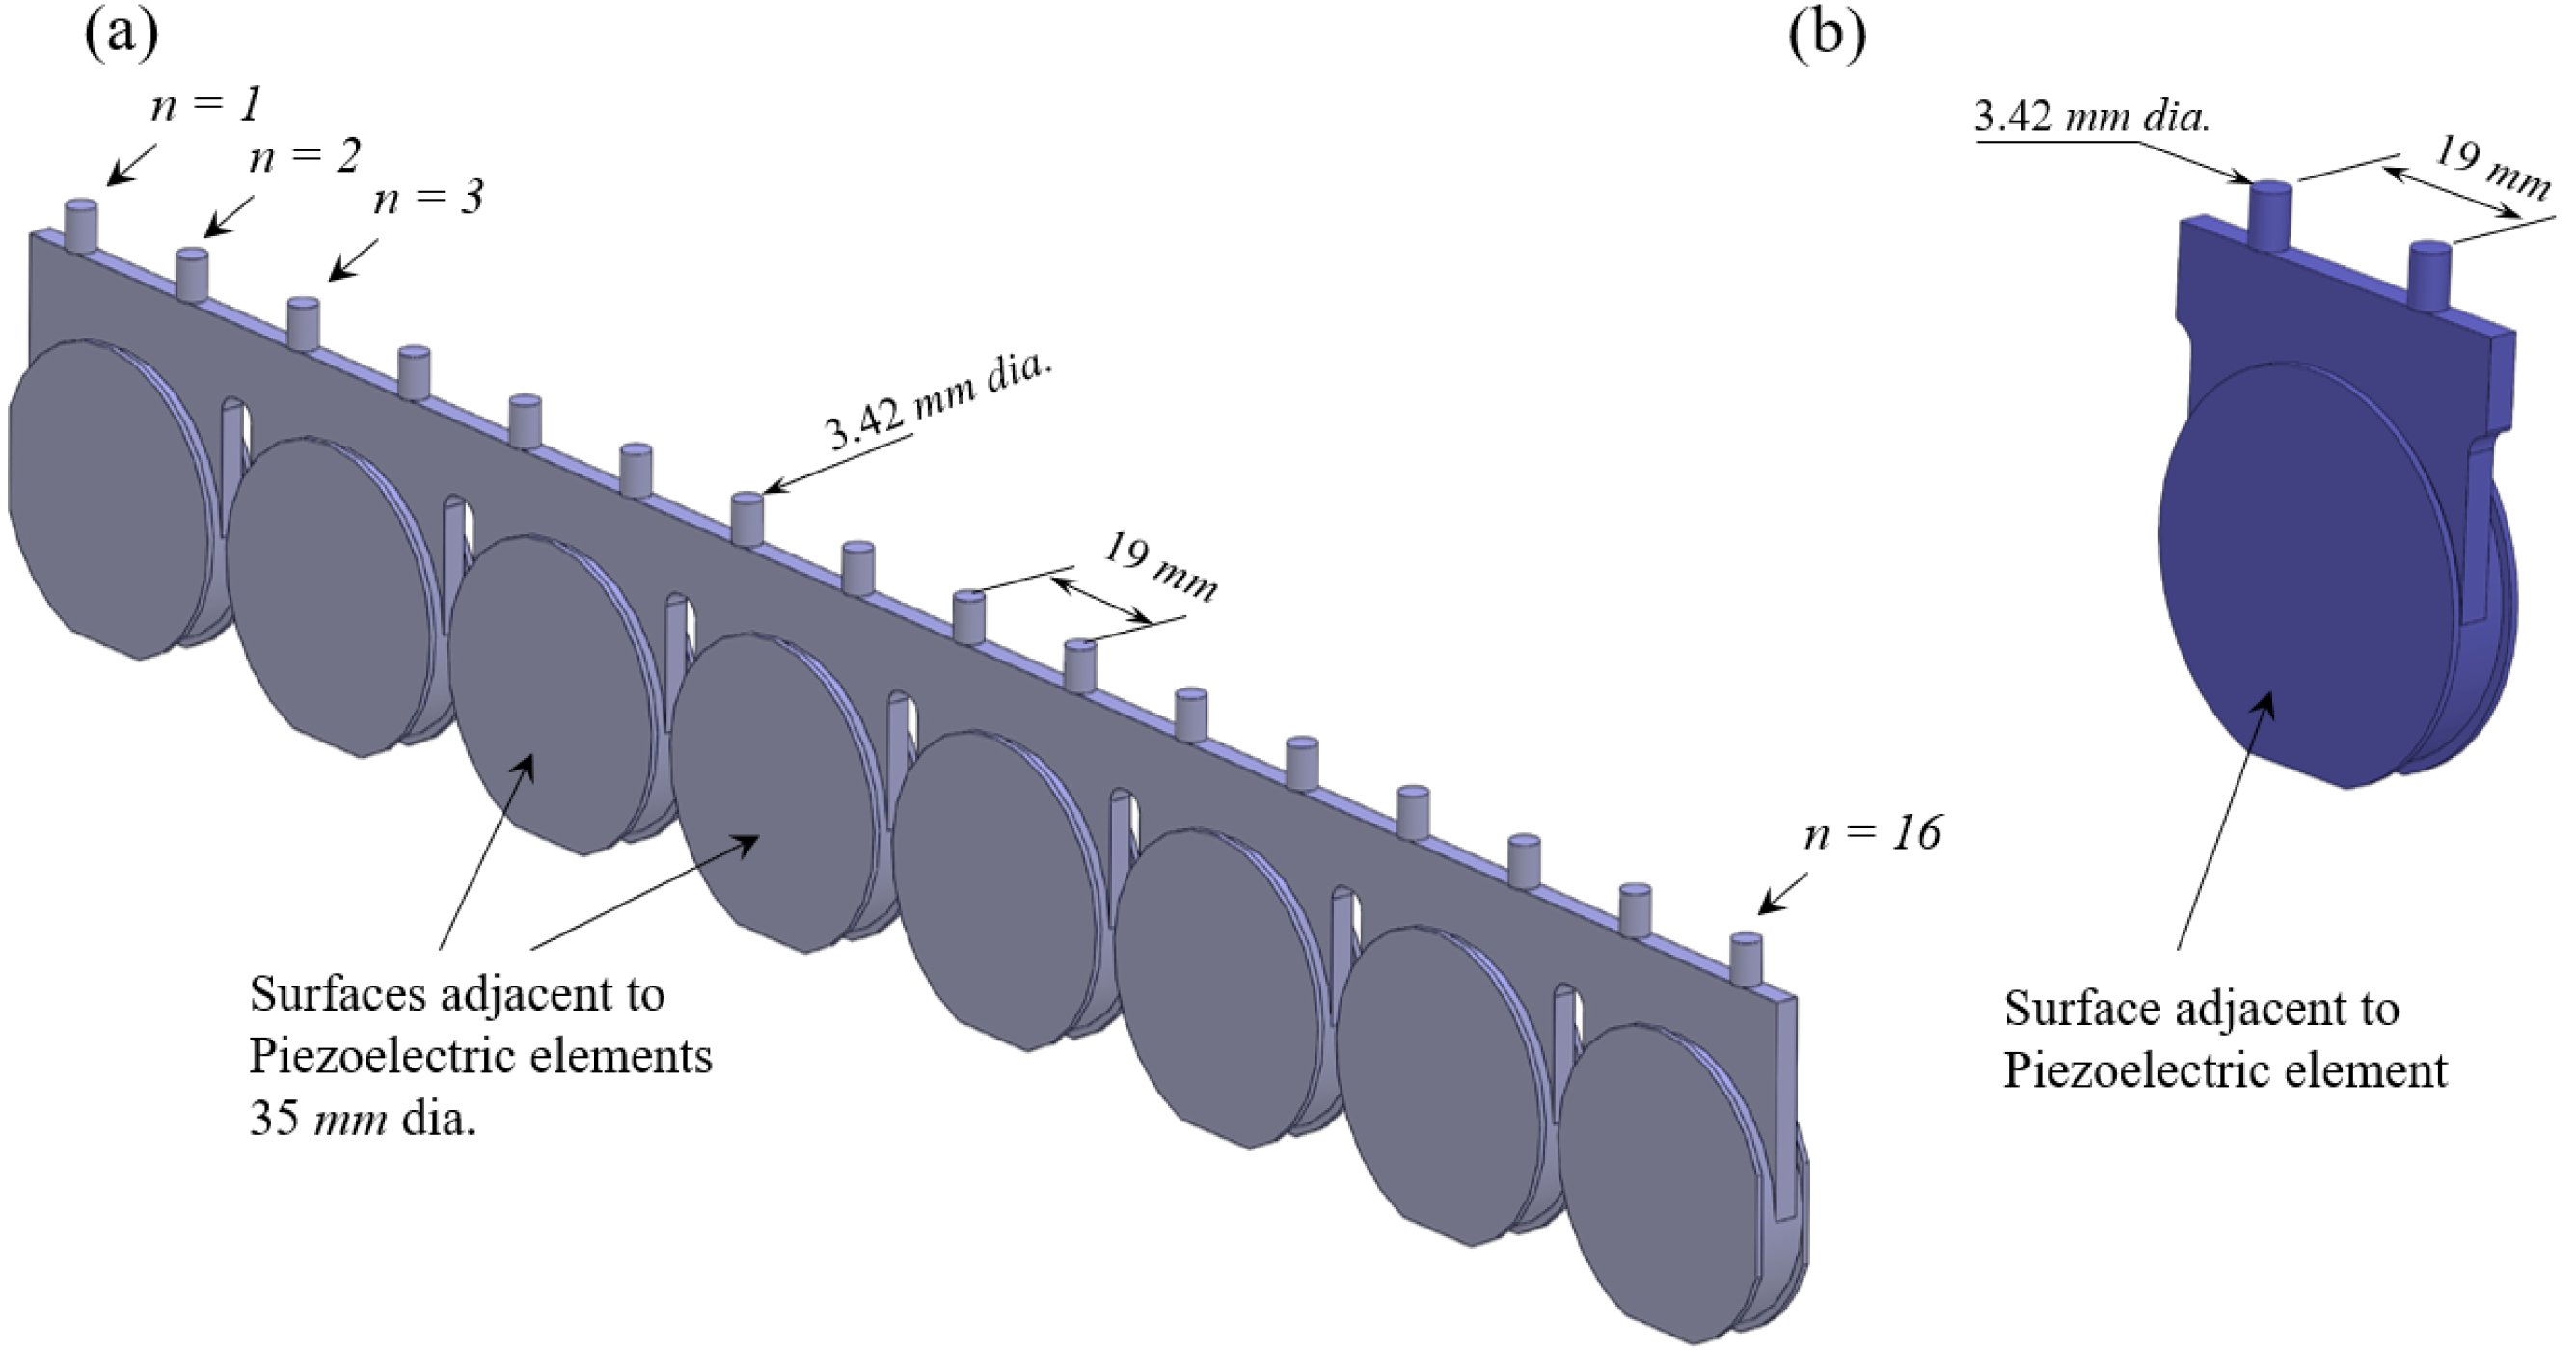
The SJA used in this investigation contained an array of sixteen piezoelectric disks, arranged into eight pairs mounted on the facing walls of the SJA cavity, and sixteen circular orifices, as shown in Figure 1a. For this SJA array, two cavity configurations were tested:
(a)
A single, large-aspect-ratio cavity encompassing the entire array of actuator disks, generated by leaving the region between the piezoelectric elements connected, as depicted in Figure 1a,
(b)
Eight single-cavity isolated compartments, created by using geometrical dividers between each pair of piezoelectric elements, as shown in Figure 1b.
The air volume entrained within each cavity configuration is depicted in Figure 2a. The air volume shown in Figure 2b is 7.54 × 10⁻⁶ m3, which is equal to 1/8th of the large-aspect-ratio-cavity volume depicted in Figure 2a. In both cavity configurations, synthetic jets were developed through sixteen orifices distributed over a span of 285 mm on a flat plate (as seen in Figure 1a) under quiescent conditions. Note that, in the compartmented cavity configuration, each cavity compartment opens to two orifices, depicted in in Figure 2b. Each of the sixteen orifices have a diameter of 3.42 mm and the spacing between the orifices is 19 mm (centre-to-centre).
All experiments were performed inside an anechoic room located at the University of Toronto Institute for Aerospace Studies. A signal generator (Model: Rigol, DG1022Z) powered all piezoelectric elements simultaneously by providing discrete, sinusoidal excitations which were amplified by a linear power amplifier (Model: Mide QuickPack, QPA3202) to give an amplified excitation amplitude of 150 Vpp to all piezoelectric elements (peak-to-peak amplitude). The piezoelectric elements were all operating in-phase through a parallel connection to the amplifier. During the experimental investigations, the jet velocity was measured by a single-sensor hot-wire probe (Dantec miniature probe, 55P11) across and at the centre of each orifice. A two-dimensional traverse mechanism controlled the location of the hot wire in the wall–normal and spanwise directions (i.e., Y and Z directions based on the coordinate system introduced in Figure 1a), with a motion resolution of 0.0025 mm. The velocity was sampled at a 32 kHz sampling frequency over 30 s, which was found to be sufficient to avoid aliasing and any measurement or sampling errors. The sinusoidal input signal sent to the piezoelectric elements was acquired simultaneously with the velocity data to obtain phase-correlated information between the jet velocity and the input excitation signal. The input signal was also used as a reference for the hot-wire measurements conducted non-concurrently over different orifices, eliminating the need for simultaneous measurements above all sixteen of the orifices.
Acoustic simulations were performed to investigate the acoustic excitations of the air volume inside the unified, large-aspect-ratio SJA cavity and its compartmented counterpart. The COMSOL software [31] was utilized to perform an eigenfrequency study for the cavity volumes entrained in both cases (the volumes are shown in Figure 2). Solving the wave equation for the eigenfrequencies and the eigenmodes gave the acoustic natural frequencies and the corresponding acoustic mode shapes or pressure distributions at these frequencies, respectively [32]. This wave equation is given by:
2 p x 2 + 2 p y 2 + 2 p z 2 = 1 c 2 2 p t 2
where p is the acoustic pressure and c is the speed of sound. Unstructured tetrahedral elements of various sizes were used to capture all details of the internal cavity geometries. The number of elements used for the large, unified-cavity volume case was 800,000, while around 100,000 elements were utilized for the compartmented cavity. The average meshing element size was 7.5 × 10⁻² mm3. This mesh size was reached following a size-decremental iterative procedure until the values of the acoustic mode frequencies from simulations matched those observed experimentally and did not change any further with the reduction in the mesh size. For the boundary conditions, all solid surfaces were modelled as stagnant walls, the orifices were modelled as pressure openings, and the surfaces adjacent to the piezoelectric diaphragms were modelled as rigid, moving walls. The excitation input was simulated by sinusoidally forcing all surfaces adjacent to piezoelectric diaphragms to oscillate in phase with a uniform amplitude. The elasticity of the diaphragms was not modelled to avoid interaction with structural flexural modes, which are not the focus of this work. It is important to note that the eigenfrequency study presented here provided a standing-wave solution for the natural frequencies and the corresponding acoustic mode shapes. A transient, or time-dependent travelling wave, solution for a specific excitation frequency or amplitude is not the focus of this work, as the motivation for this work was focused more on assessing the frequency response and excitation characteristics rather that the changes in the time domain for a given frequency.

3. Results

3.1. Jet-Velocity Measurements for the Unified, Large-Aspect-Ratio Cavity

Two sets of experiments were performed to characterize the frequency response of the SJA configuration that had one large, unified cavity. First, the mean jet-velocity response at the exit of one of the orifices was determined as a function of the excitation frequency. Second, the mean jet velocities over all sixteen of the orifices were measured at a single excitation frequency to explore whether the jet velocity varied from orifice to orifice over the array. Figure 3a shows the phase-averaged jet velocity at the exit of the orifice that is located in the middle of the array (i.e., the orifice numbered as n = 8 based on the convention used in Figure 2a, where the measurement point is X/D = Y/D = Z/D = 0) in response to the sinusoidal input signal shown in Figure 3b, which excited the piezoelectric elements at a frequency of fe = 1220 Hz and an amplitude of E = 150 Vpp. Here, for the positive amplitudes of the excitation input signal (i.e., where the phase of the input signal was 0 < φ < π) the piezoelectric elements deflected inward into the cavity, leading to the expulsion of the jet, while for the negative excitation amplitudes (i.e., π < φ < 2π) the piezoelectric elements deflected outward, corresponding to the ingestion stroke. The velocity signals detected by the single-wire probe used in this investigation were always positive. As a result, the direction of the jet flow could not be distinguished from these velocity signals. However, it was noted that the jet velocity over the return stroke (π < φ < 2 π) seemed marginally lower than the expulsion stroke. This is because some of the returning flow to the cavity was drawn from the edges of the orifice, following a path parallel to the orifice cross-section rather than normal to the orifice cross-section. The error bars in Figure 3a show the standard deviation around the phase-averaged jet velocity at each phase. It should be pointed out here that the hot-wire data always demonstrated a lag (or, in other words, a phase-angle difference) with respect to the input excitation. This phase difference between the hot-wire output and the excitation input was not significant for the case presented in Figure 3a, where the excitation frequency corresponded to a resonant frequency. However, phase-angle variations from orifice to orifice were observed for cases driven by other excitation frequencies, which will be discussed in further detail in Section 4.
It is common in the literature to define the time–mean jet velocity as the time average of the synthetic jet velocity over the expulsion half of the cycle [33]. Hence, it is essential to distinguish the expulsion stroke in the measured velocity signal since the measured data were not phase-locked to the excitation. Given that the measured velocity data had an excitation-frequency-dependent phase-angle difference from the excitation input, as indicated above, the expulsion stroke on the phase-averaged velocity cycle was determined by taking the phase of the maximum jet velocity as a reference point. The phase-angle range corresponding to the expulsion stroke in a cycle was then considered to be a quarter cycle (π/2) before and after the phase angle of the maximum jet velocity. Based on this convention, the time–mean jet velocity during the expulsion stroke was found by:
U J ¯ = 1 τ / 2 t 1 t 2   u t   d t
where τ is the period of one cycle, t1 is the onset time of the expulsion stroke, and t2 is the ending time of the expulsion stroke. Notice here that, as the expulsion stroke occurred over half of the excitation cycle (i.e., from 0 to τ/2) the denominator in Equation (3) equals t2t1 = τ/2. In Equation (3), the jet velocity was first phase-averaged and then integrated over the expulsion stroke so that the results were independent of the excitation frequency and the phase-angle difference.
Figure 4 shows the mean jet velocity of the expulsion stroke for the unified-cavity volume configuration, computed using Equation (3) for different excitation frequencies ranging from 300 Hz to 2200 Hz at the exit of the orifice that was located in the middle of the array (i.e., the orifice was numbered as n = 8 and the measurement location was X/D = Z/D = Y/D = 0). This frequency response revealed several peaks in the frequency range of fe = 800 to 1400 Hz. Equation (1) for the Helmholtz resonance frequency, fH, can be rearranged for round orifices using lumped elements to:
f H = c 2 π 3 A 4 h V
where c is the speed of sound, A is the orifice area, h is the depth of the orifice neck, and V is the cavity volume [21]. Using this formula, the theoretical value of the Helmholtz frequency was estimated to be 1232 Hz for the dimensions of the current cavity. This estimation is very close to the resonant peak observed at 1220 Hz in the experimental data presented in Figure 4. However, it can be seen in Figure 4 that, other than this resonant frequency, three more frequencies exist at which the jet velocity peaked. A similar frequency response for the jet velocity was obtained above all other orifices, which confirmed that the existence of these frequency peaks is a characteristic of the cavity excitation affecting the whole actuator.
To gain additional insight into these frequency peaks, further measurements and analyses were performed. To begin, the time–mean jet velocity across adjacent synthetic jets was acquired for different excitation frequencies to explore the possibility of an interaction between injected jets from neighbouring orifices. Figure 5 shows the time–mean jet profiles across two consecutive orifices at the height of one orifice diameter above the orifice exits (i.e., at Y/D = 1) for the excitation at the resonance frequency of 1220 Hz. In this figure, the first jet, centred around Z/D = 0, emanated from the orifice located in the middle of the array, n = 8, while the subsequent jet, centred around Z/D = 5.57, was injected from the adjacent orifice, n = 9. It can be observed that both synthetic jets showed a typical mean velocity profile that was similar to that of a steady jet with a local maximum at the centre of each jet, which agrees well with the literature [34,35]. It is also clear that the jets were not interacting with each other. Only a slight difference in the maximum jet velocity at the centreline was observed between these two consecutive jets. Cross-jet profiles captured over orifices located further away from each other depicted a similar jet profile but a significant difference in the peak jet-velocity value. In fact, when the mean jet velocity along all sixteen of the orifices in the array was captured one orifice-diameter above each orifice at the centreline of the jets, a significant variation in jet-velocity peak was observed over the array span. The shape of this variation was found to depend on the excitation frequency, as shown in Figure 6, where the mean jet velocity over the centre of each orifice is depicted for two representative excitation frequencies (the frequencies of fe = 1200 Hz and fe = 800 Hz). Notice that the relatively similar values observed for the velocity peaks of the jets issued from the orifices n = 8 and 9 in Figure 5 are also detectable in Figure 6 for the same orifices at the same excitation frequency. It can be seen from Figure 6 that, when the SJA array was excited near the resonant-frequency peak of 1220 Hz, the mean jet velocity increased over two sections: namely, over the orifices n = 3 to 6 and n = 10 to 14. On the contrary, when the excitation was supplied at a frequency of 800 Hz, the orifices n = 2 to 4 showed an increase in jet velocity while the orifices n = 9 to 14 showed a reduction. The origins of the additional resonant peaks, detected in Figure 4, and the rationale behind the variation of the jet velocity over the array of orifices, seen in Figure 6, will be revealed in Section 4 from the acoustic simulation results. However, before delving into these results, it was important to determine if the variation in the jet velocity over the orifice array could be avoided altogether. To this end, the internal cavity volume was divided into separate compartments, as is depicted in Figure 1b. The next section will discuss the experimental results for such a design.

3.2. Jet-Velocity Measurements for the Compartmented Array Cavity

In Figure 7 (below), the time–mean jet velocity over the expulsion stroke from one of the orifices of the compartmented cavity design is given as a function of the excitation frequency with the hot wire located at the centre of the orifice exit. It is observed that this frequency response exhibited only one resonant peak around 1200 Hz, which matches the theoretical Helmholtz resonance frequency estimated earlier. This is a significant difference from the multiple peaks observed for the unified-cavity volume before. Notice that each singular compartment has the same Helmholtz resonance frequency as the unified-cavity case because, when dividing the unified, large-cavity volume into eight isolated compartments, both the cavity volume and the total orifice area in Equation (4) are divided by 8, rendering the same Helmholtz resonance frequency for both configurations. Similar frequency-response graphs were observed when hot-wire measurements were performed above other isolated cavity compartments. The mean jet-velocity profiles above different orifices of the compartmented case were also found to be comparable with no significant differences. In fact, the maximum mean jet velocity, detected at the centre of each jet, varied only slightly for the array of orifices, as is shown in Figure 8. When the compartmented cavities were excited near their resonance frequency, fe = 1200 Hz, the standard deviation in the maximum time-averaged jet velocity was very small, as the error bars in Figure 8 show. On the other hand, at an off-resonance excitation of fe = 800 Hz, the standard deviation around the time-averaged value of the time–mean jet velocity was relatively larger. These observations correspond to the characteristics of acoustic excitation of a cavity at its Helmholtz resonance frequency. When the cavity was excited at its Helmholtz resonance frequency, the measured velocity signal was very close to the sinusoidal shape of the tonal-input excitation. Therefore, the standard deviation is relatively small when the signal is phase-averaged. However, in the case of off-Helmholtz resonance excitation, the velocity response to the input excitation was still sinusoidal but exhibited a larger standard deviation (or inconsistencies) in the signal.
The existence of only the Helmholtz resonance peak in the frequency response of every single compartment in the compartmented-cavity design suggests that only one mechanism of exciting the cavity volume can be at play for the compartmented case, and this is the reason why the jet velocity does not exhibit any considerable variation along the array span in this case. The next section discusses acoustic simulations of the two actuator configurations (the configuration with the unified, large-aspect-ratio cavity and the one with compartmented cavities) to further explore the acoustic excitation mechanisms for each case.

4. Acoustic Simulations Results

Acoustic simulations of the air volume entrained within each of the two cavity configurations considered in this study were carried out following the methodology explained in Section 2. The simulations were conducted for the exact geometry of the cavity, shown in 
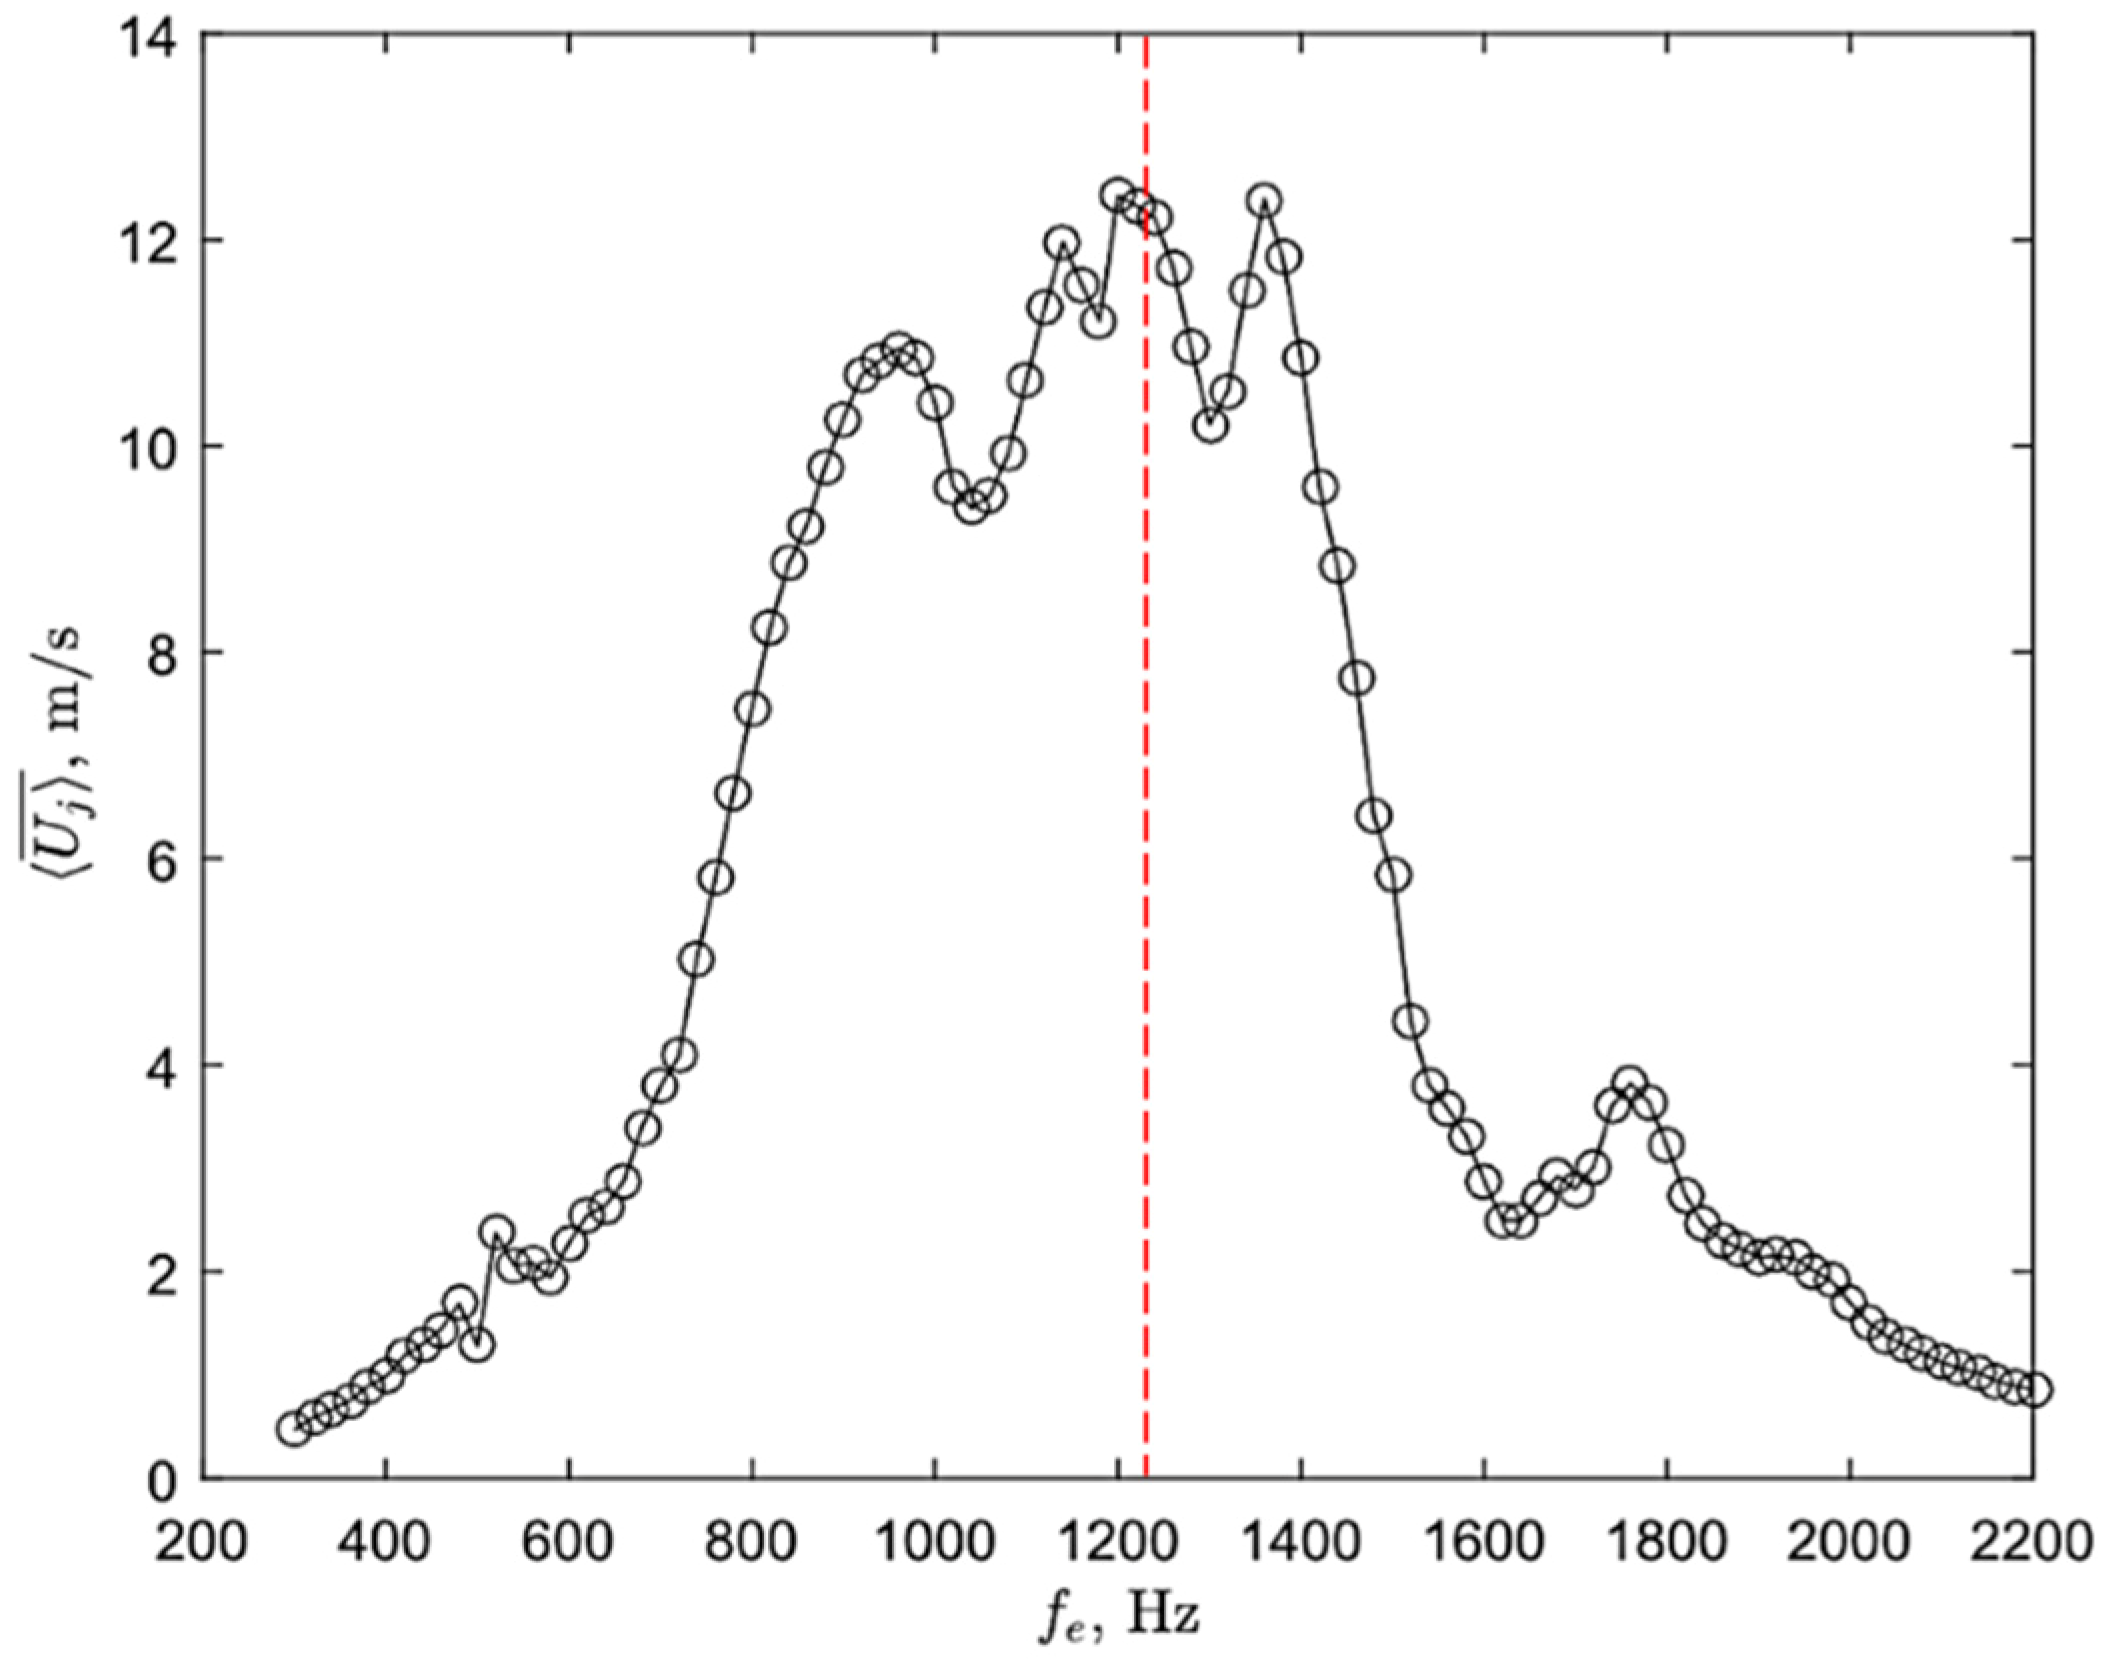
Figure 2. For the large-aspect-ratio cavity, the simulations gave several eigenfrequencies in the simulated range of excitation frequencies. Some of these frequencies closely matched the frequency peaks detected experimentally in the jet-velocity measurements (presented in Figure 4), shown in Table 1. Figure 9 shows the instantaneous acoustic-pressure distribution within the entire unified, large-aspect-ratio-cavity volume for the four resonant frequencies shown in Table 1. The acoustic pressure levels resulting from these simulations were arbitrary but comparative due to the nominal boundary condition used at the surfaces of the piezoelectric elements. Therefore, the acoustic pressure levels were normalized by the maximum pressure level detected in the cavity for any given case. Figure 9a reveals that, at the natural frequency of 956 Hz, two parts of the cavity volume exhibited opposing acoustic-pressure distributions (shown by red and blue contours). The opposing direction of the acoustic pressure in these simulations indicated an out-of-phase excitation at these cavity regions. That is, the acoustic pressure fluctuated in an opposite manner between the two parts of the cavity volume when the cavity was excited at this acoustic mode frequency. Figure 9c shows that, at the natural frequency of 1252 Hz, while two parts of the cavity volume exhibited higher acoustic-pressure distributions in one direction (indicated by red contours), the parts at the two ends and in the middle (shown by blue) displayed opposing pressure distributions. The other two natural frequencies, 1126 and 1331 Hz, also exhibited acoustic-pressure variations, giving their respective mode shapes as shown in Figure 9b,d. The acoustic mode distributions in Figure 9a,c for the two frequencies, 
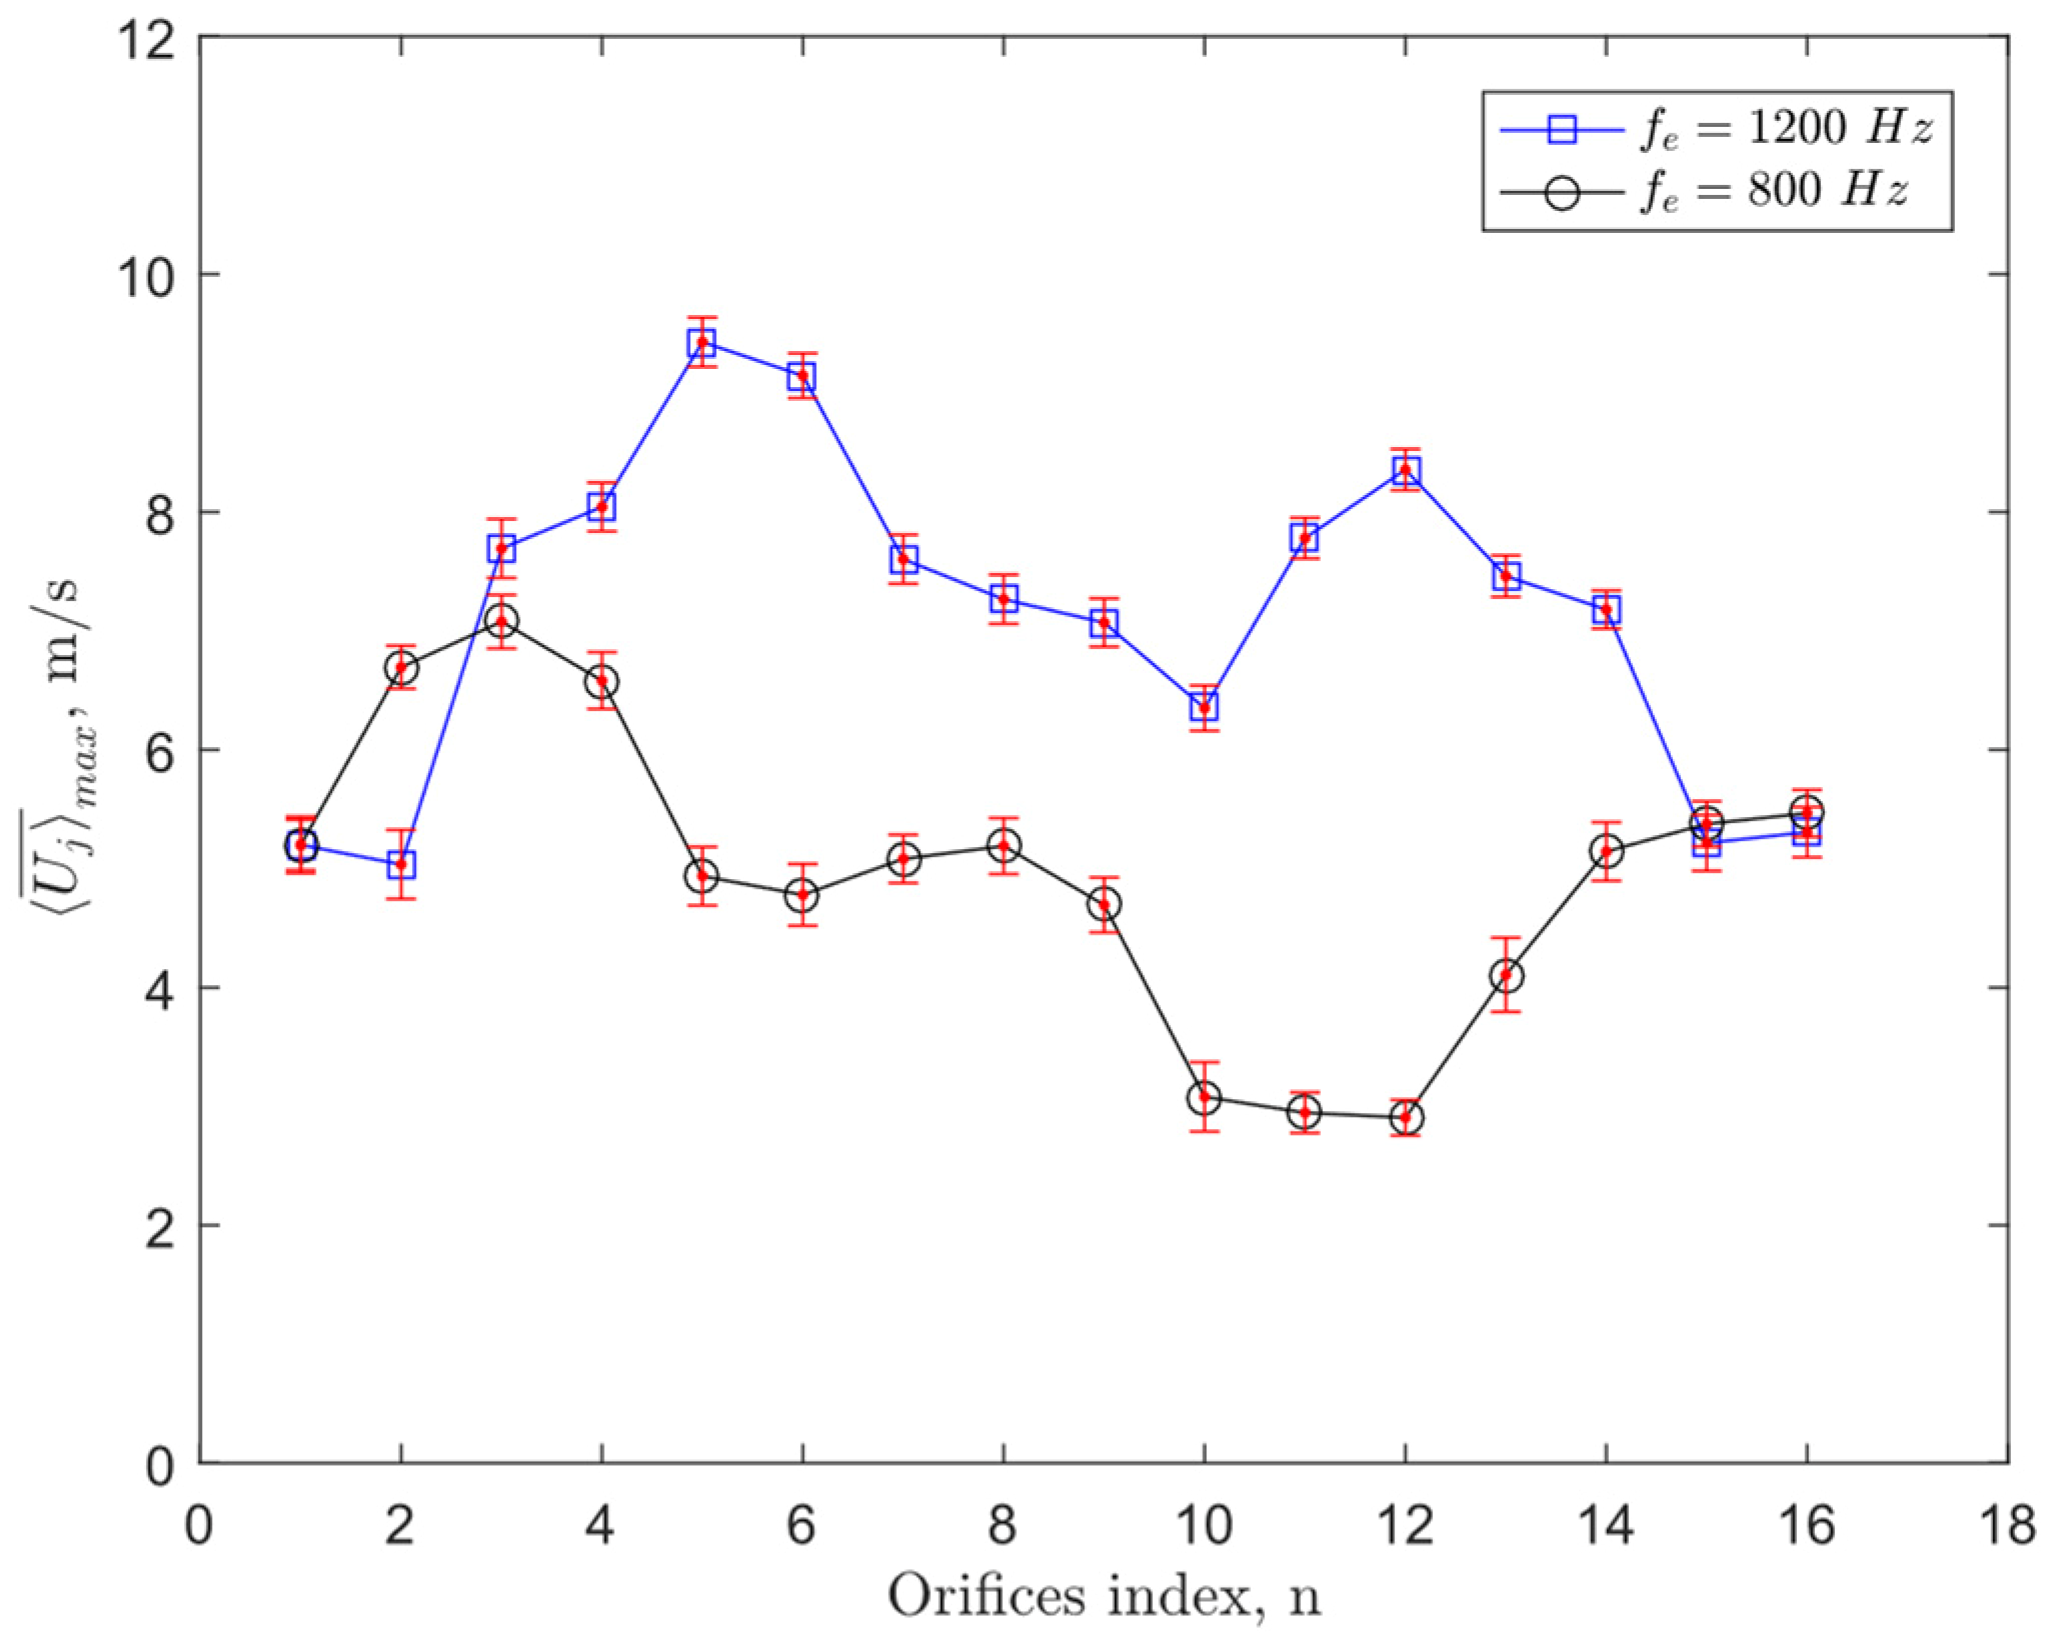
fs = 956 and 1252 Hz, agreed well with the experimentally observed variation of the mean jet velocity over the array of orifices for the excitation frequencies of fe = 800 and 1200 Hz, respectively (see Figure 6), where stronger or weaker jet velocities were obtained above the positive and negative acoustic-pressure regions inside the cavity, respectively.
Inspecting the acoustic simulation results and the experimental results of the mean jet-velocity variation over the orifices, it can be concluded that the excitation of an acoustic mode inside the cavity had a direct effect on the jet velocity exiting from each orifice during the expulsion stroke, which led to the non-uniform jet velocity pattern detected experimentally in Figure 6. It is important to note that the acoustic-pressure distributions shown in Figure 9 corresponded to the peak of the expulsion stroke, i.e., when the piezoelectric elements deflected to their inward-most location. In the other half of the excitation cycle, the acoustic-pressure regions would have been inverted, but that half-cycle would have corresponded to the ingestion stroke (which is not included in the jet-velocity plots discussed earlier). Hence, averaging the jet velocity during the expulsion strokes over the whole sampling time always gave high jet velocity at positive pressure regions and a weaker velocity at the negative pressure regions. Although the excitation of the large-aspect-ratio cavity configuration at the frequency of fe = 800 Hz was initially thought to be off-resonance, it seems that the fluctuations in acoustic pressure locked onto the closest acoustic mode to this excitation frequency. However, the excitation of the cavity at fe = 800 Hz generally generated lower jet velocities over the span compared to the fe = 1200 Hz excitation case. The reason behind the induction of much larger jet velocities for the 1200 Hz excitation frequency could be due to the coupling of one of the acoustic modes with the Helmholtz resonance frequency.
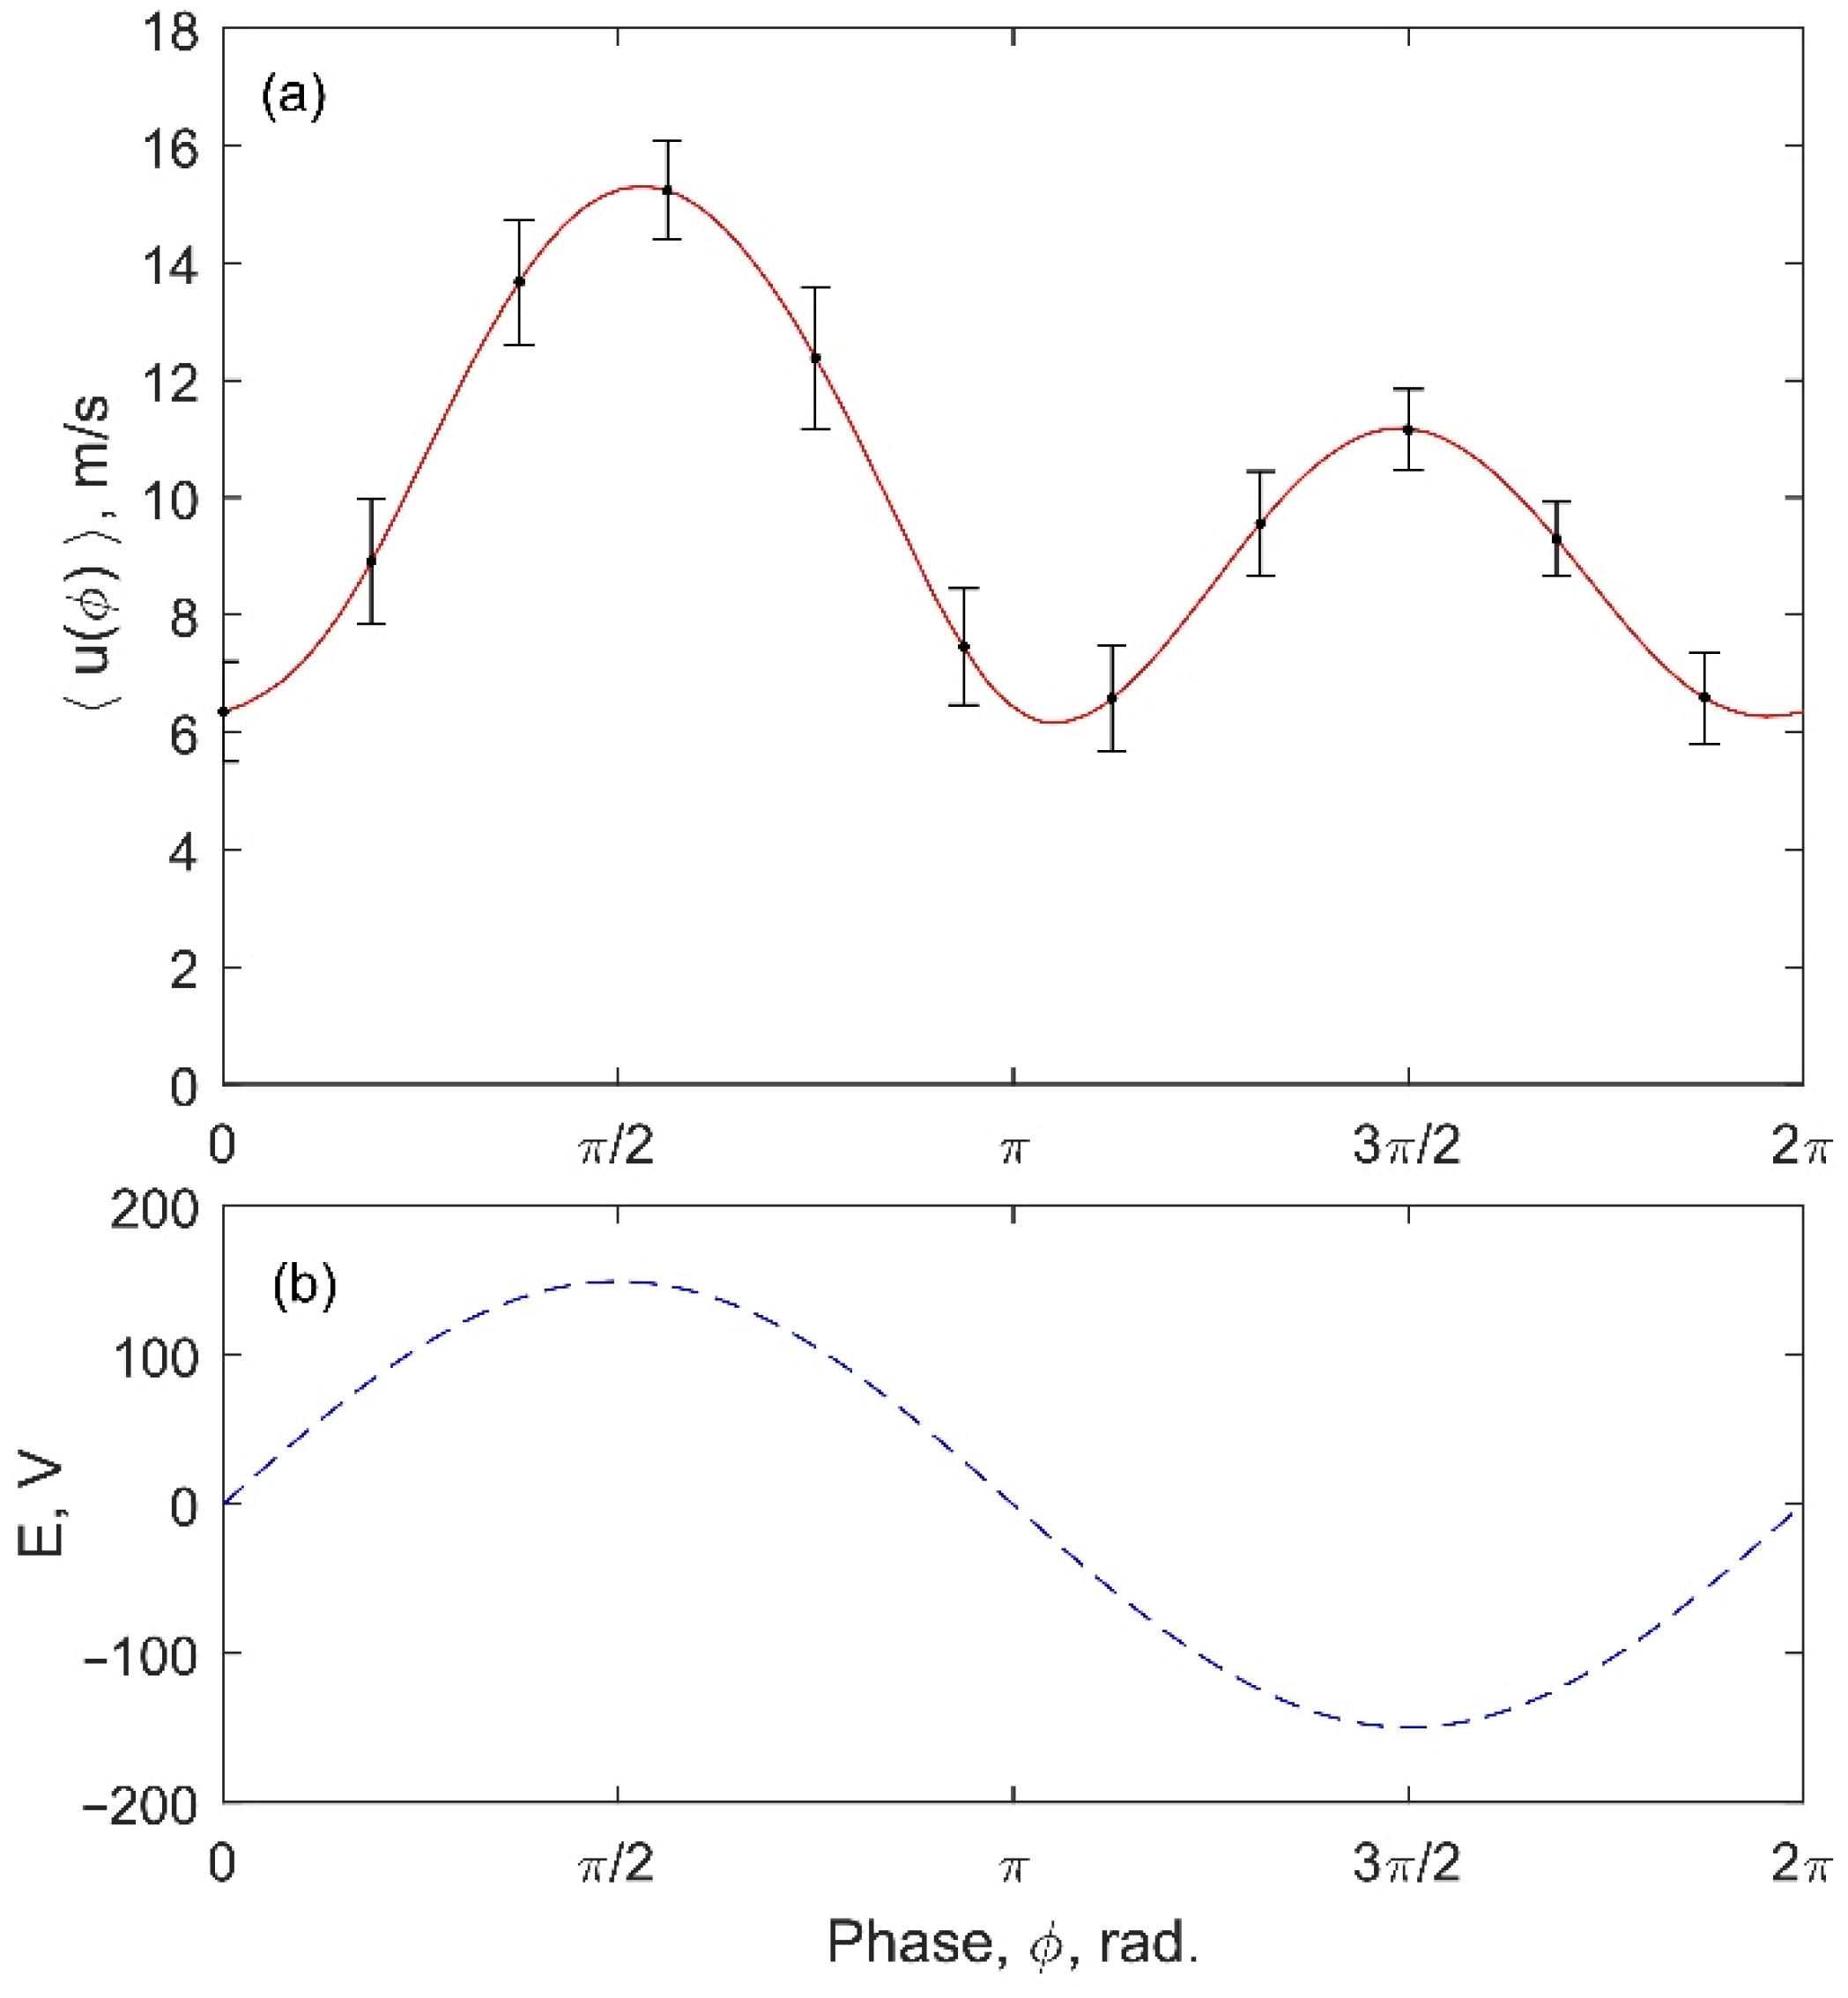
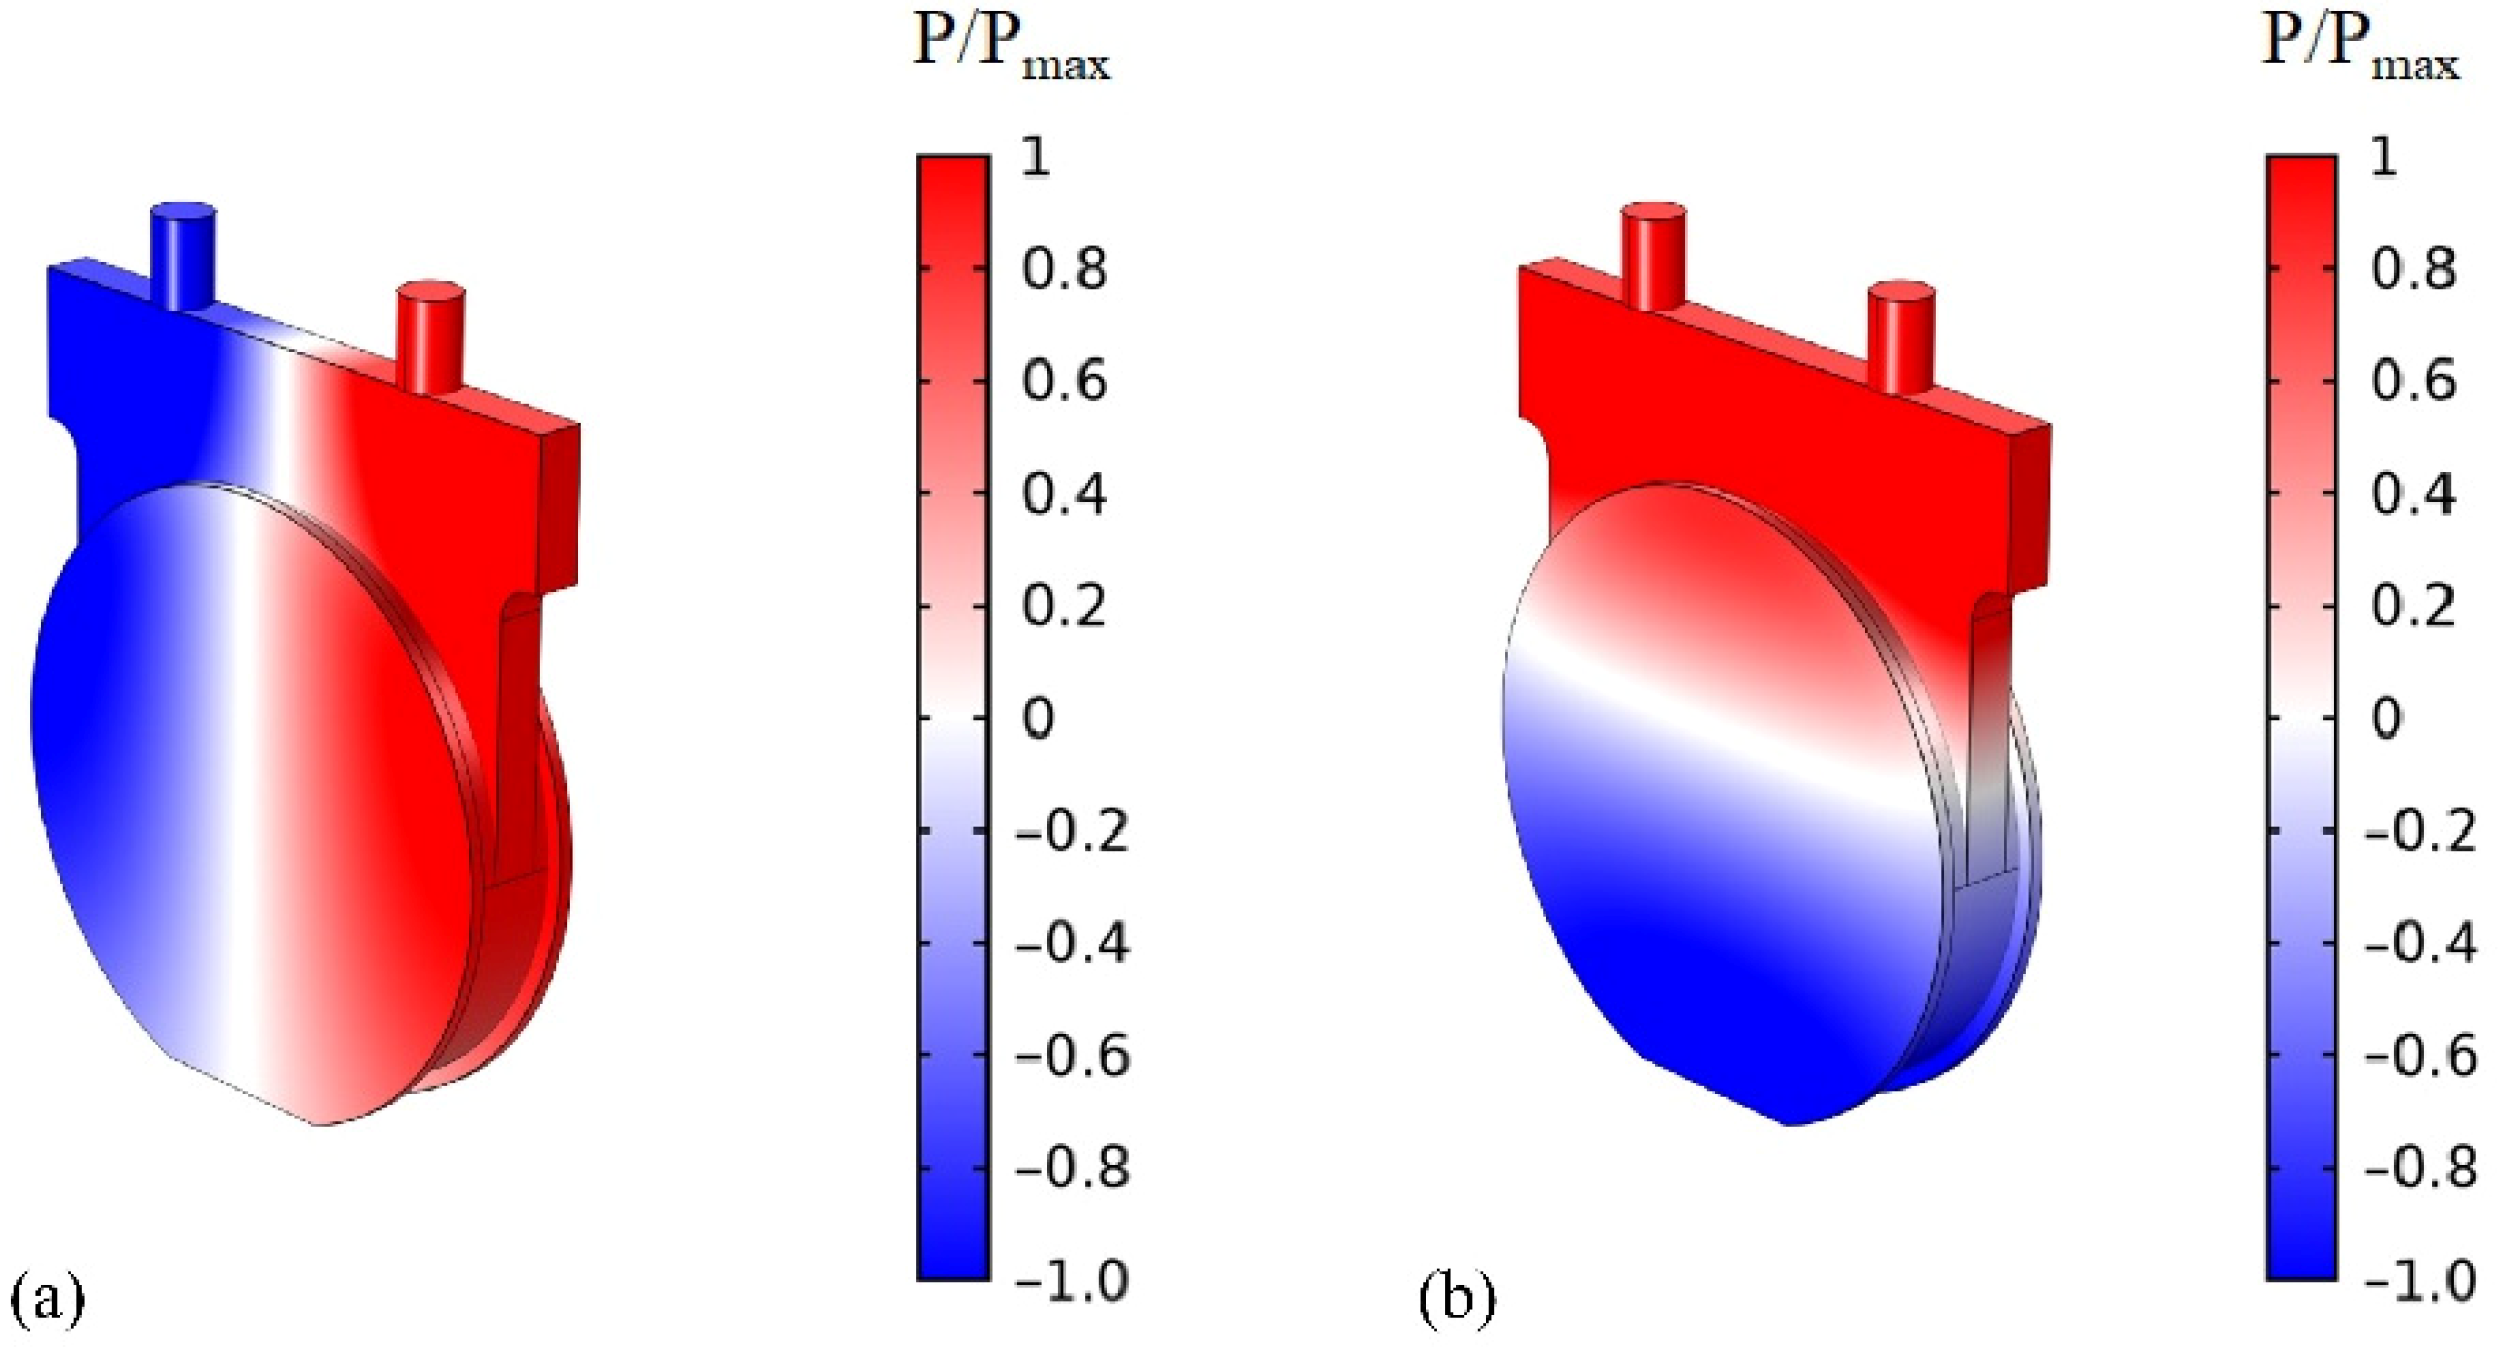
To gain further insight into the correlation of the excited acoustic mode shape of the cavity with the jet velocities emanating from the orifices, the phase-angle difference of the mean jet velocity between all of the orifices of the SJA array was determined. This phase-angle difference can be extracted from the experimental phase-averaged jet velocity measurements by comparing the phase of the highest phase-averaged jet velocity during the expulsion stroke to the phase of the maximum amplitude of the sinusoidal excitation (see Figure 3). Since the input excitation was recorded simultaneously with the measured jet velocity, the phase-averaged correlation can be extracted and compared for different excitation frequencies. 
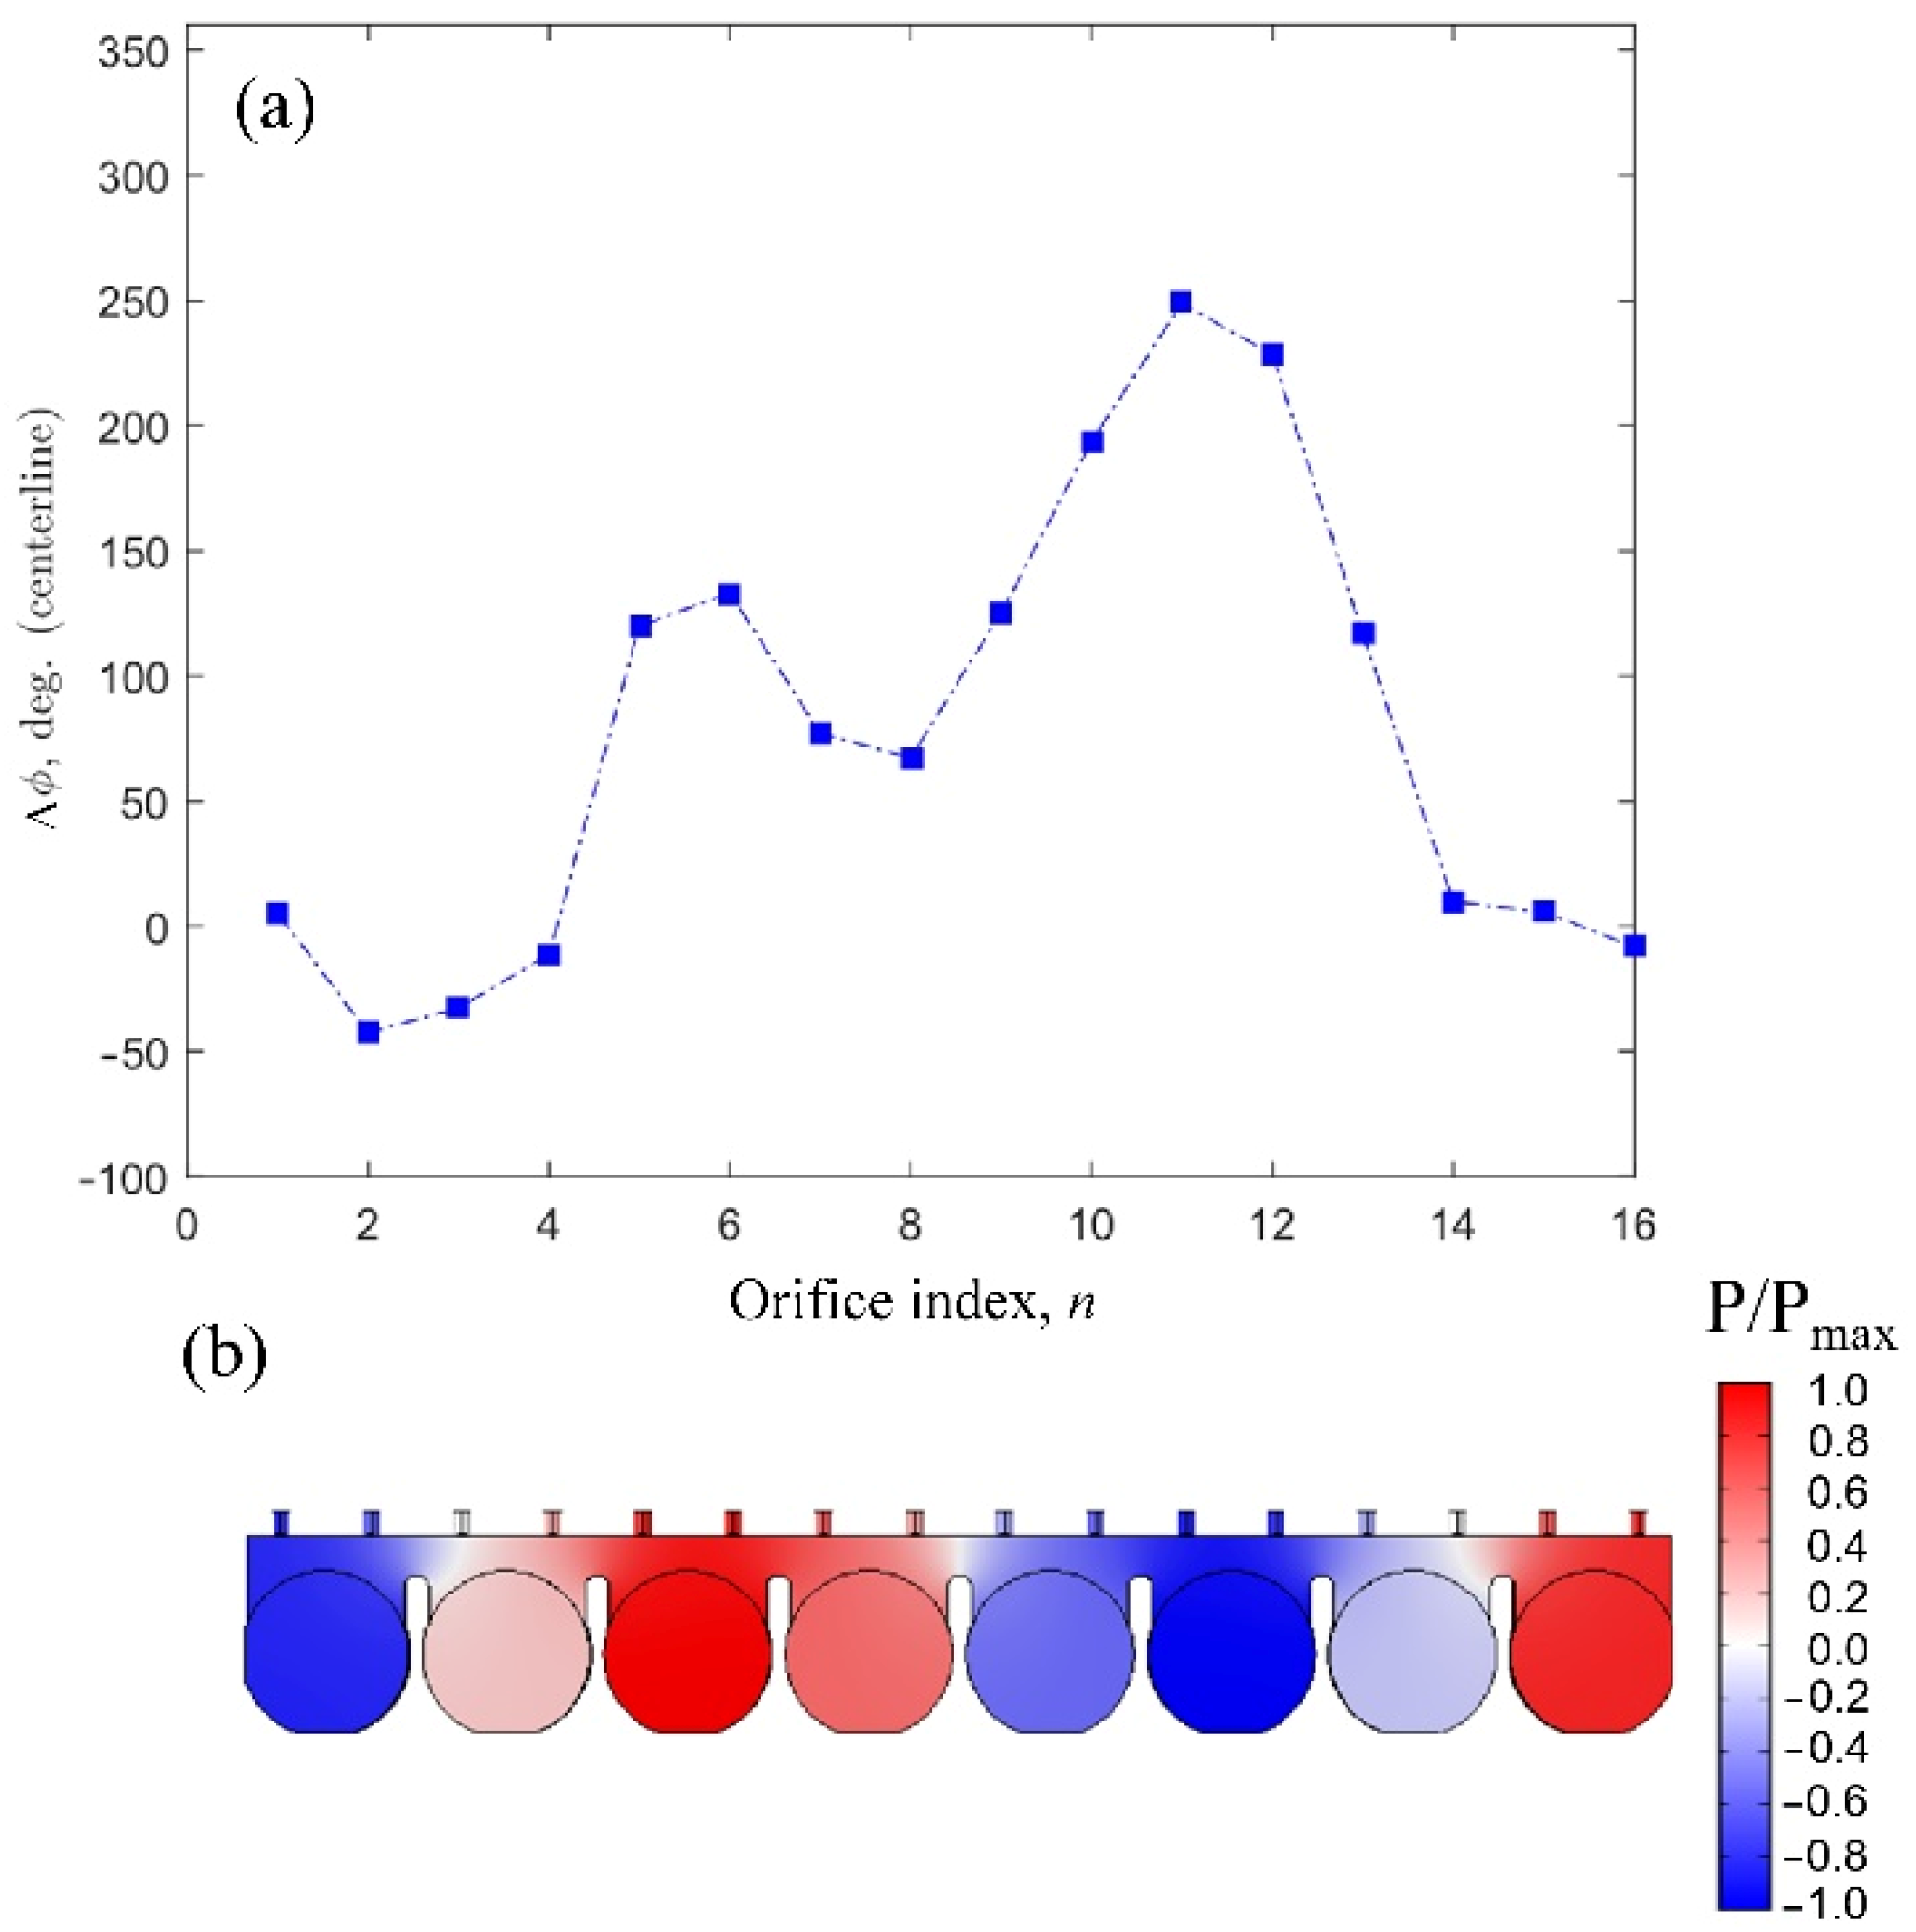
Figure 10a shows the phase-angle variation of the jet velocity over the orifices for the large-aspect-ratio and unified-cavity volumes, determined from experimental measurements at fe = 1200 Hz, and Figure 10b gives the acoustic mode distribution inside the same cavity volumes extracted from acoustic simulations of the cavity volume for excitation at fs =1252 Hz. Figure 10b reveals that the excited acoustic mode shape at fs = 1252 Hz exhibited a negative acoustic-pressure region around the middle of the array (given in blue), i.e., between the orifices n = 8 to 9. As seen in Figure 10a, the phase-angle difference between the phase-averaged jet velocity and the input excitation for these orifices was close to 0 degrees since both orifices were in the same acoustic-pressure region. Figure 10b also shows high acoustic-pressure levels in two regions of the cavity (indicated by red contours), containing the orifices n = 3 to 6 and n = 11 to 14. Around these same orifices, the phase-angle difference between the velocity of the jet and the input excitation was found to be non-zero and generally comparable, indicating the excitation of the acoustic mode shape seen in Figure 10b. Therefore, the jet velocities measured at the orifices in these two regions were relatively higher than the velocities in the middle and far sides of the cavity, which were observed earlier in Figure 6. It is important to mention again that the exact value of the phase angle itself was not the target here, but the proximity in phase-angle values is an indicator that the jets are synchronized, or that a similar acoustic-pressure distribution persists inside the cavity for these orifice regions.
It has been previously discussed that, at the excitation frequency of fe = 800 Hz, the acoustic-pressure distribution within the large cavity locked onto the closest acoustic mode shape obtained at fs = 956 Hz, which is given in Figure 11b. For this mode shape, there were two out-of-phase acoustic-pressure regions, shown by the blue and red contours in Figure 11b. These two out-of-phase regions fell somewhere between the orifices n = 5 to 6 and n = 11 to 12. The phase-angle variation of the phase-averaged jet velocity in reference to the input signal for the fe = 800 Hz case, shown in in Figure 11a, depicted that the jet velocities were within 90 to 120 degrees out of phase between these two regions. The fact that the jet velocities at the two regions were out of phase with each other suggests the excitation of the acoustic mode shape of the fe = 956 Hz case and explains why there would be a difference in the shape of the jet velocity measured above the array of orifices, as was shown earlier in Figure 6. These results point out a significant challenge for the SJA array, which is achieving a uniform synthetic jet injection along the array of orifices for consistent flow control. The slenderness of the unified, large cavity led to the excitation of different acoustic modes, which was responsible for the variation of the jet velocity over the array. That variation in mean jet velocity depended solely on the excitation frequency and the corresponding acoustic mode shape having been excited in the unified, large-aspect-ratio cavity.
Acoustic simulations were also performed for the singular case of the compartmented cavity configuration, which had two piezoelectric elements within each unit (see Figure 2b). The instantaneous acoustic-pressure distribution—i.e., acoustic mode shapes—that corresponded to the first two acoustic modes are presented in Figure 12. The simulations also provided several other acoustic modes happening at higher frequencies, listed in 
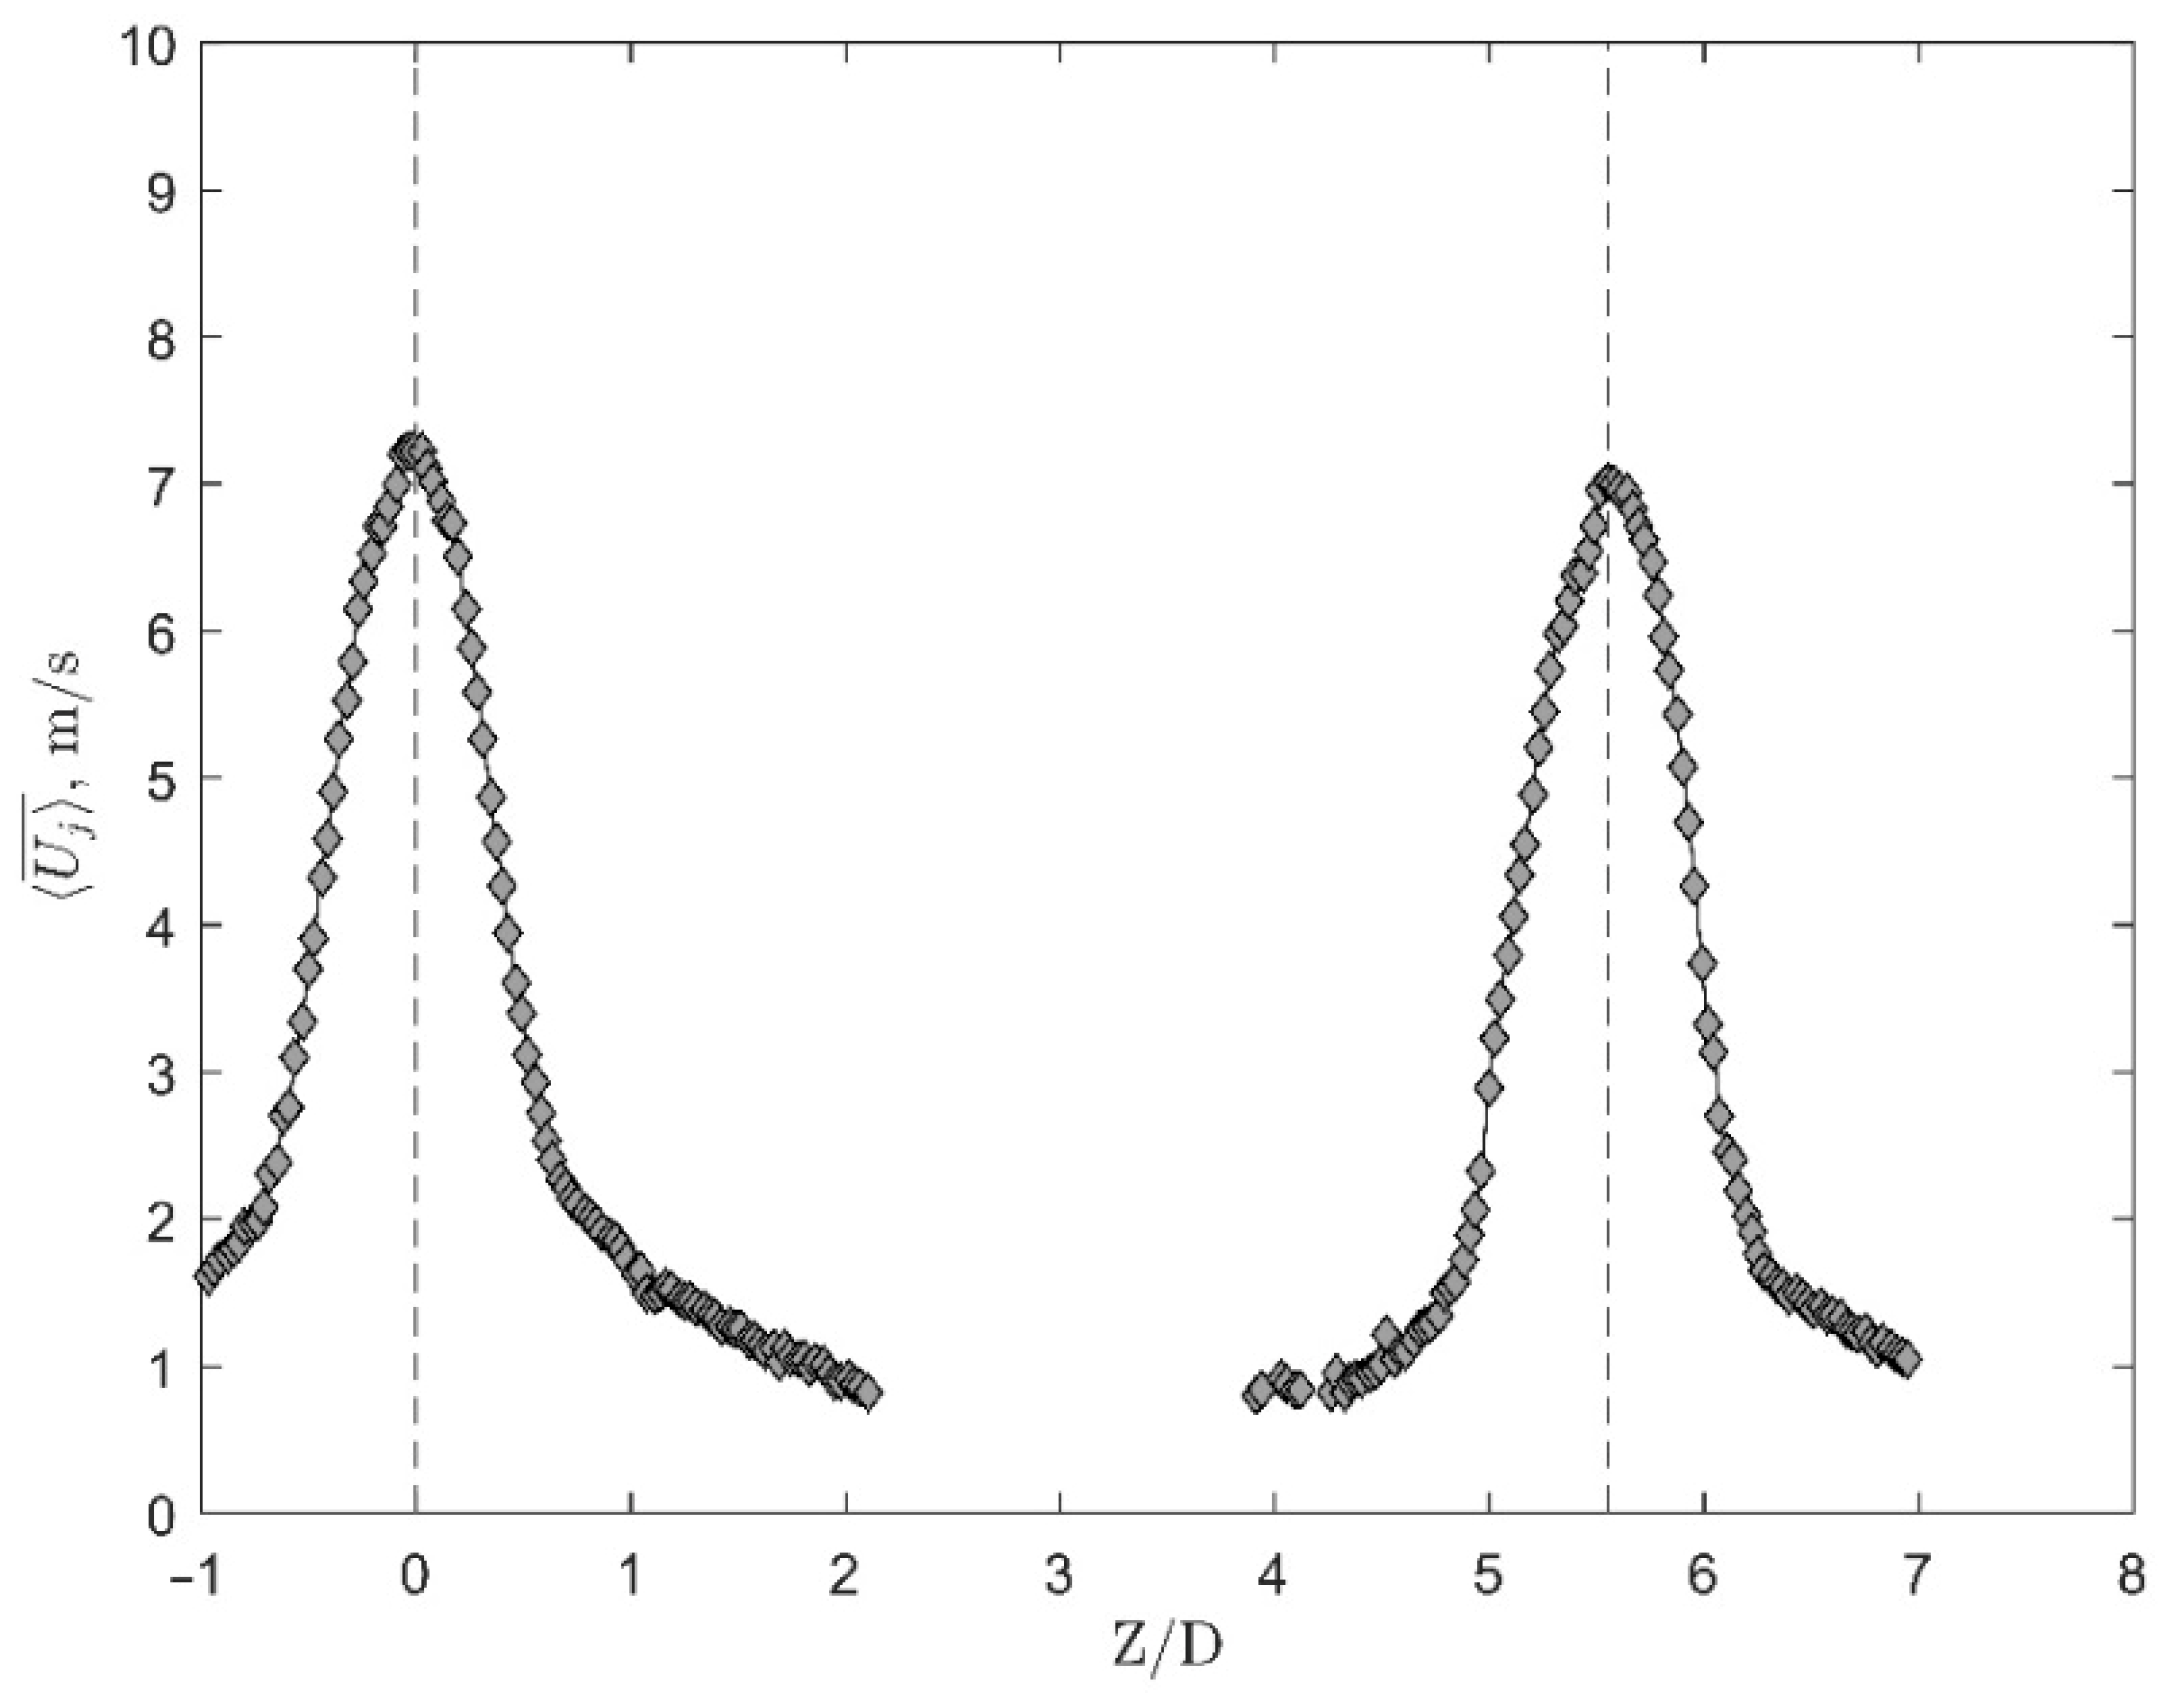
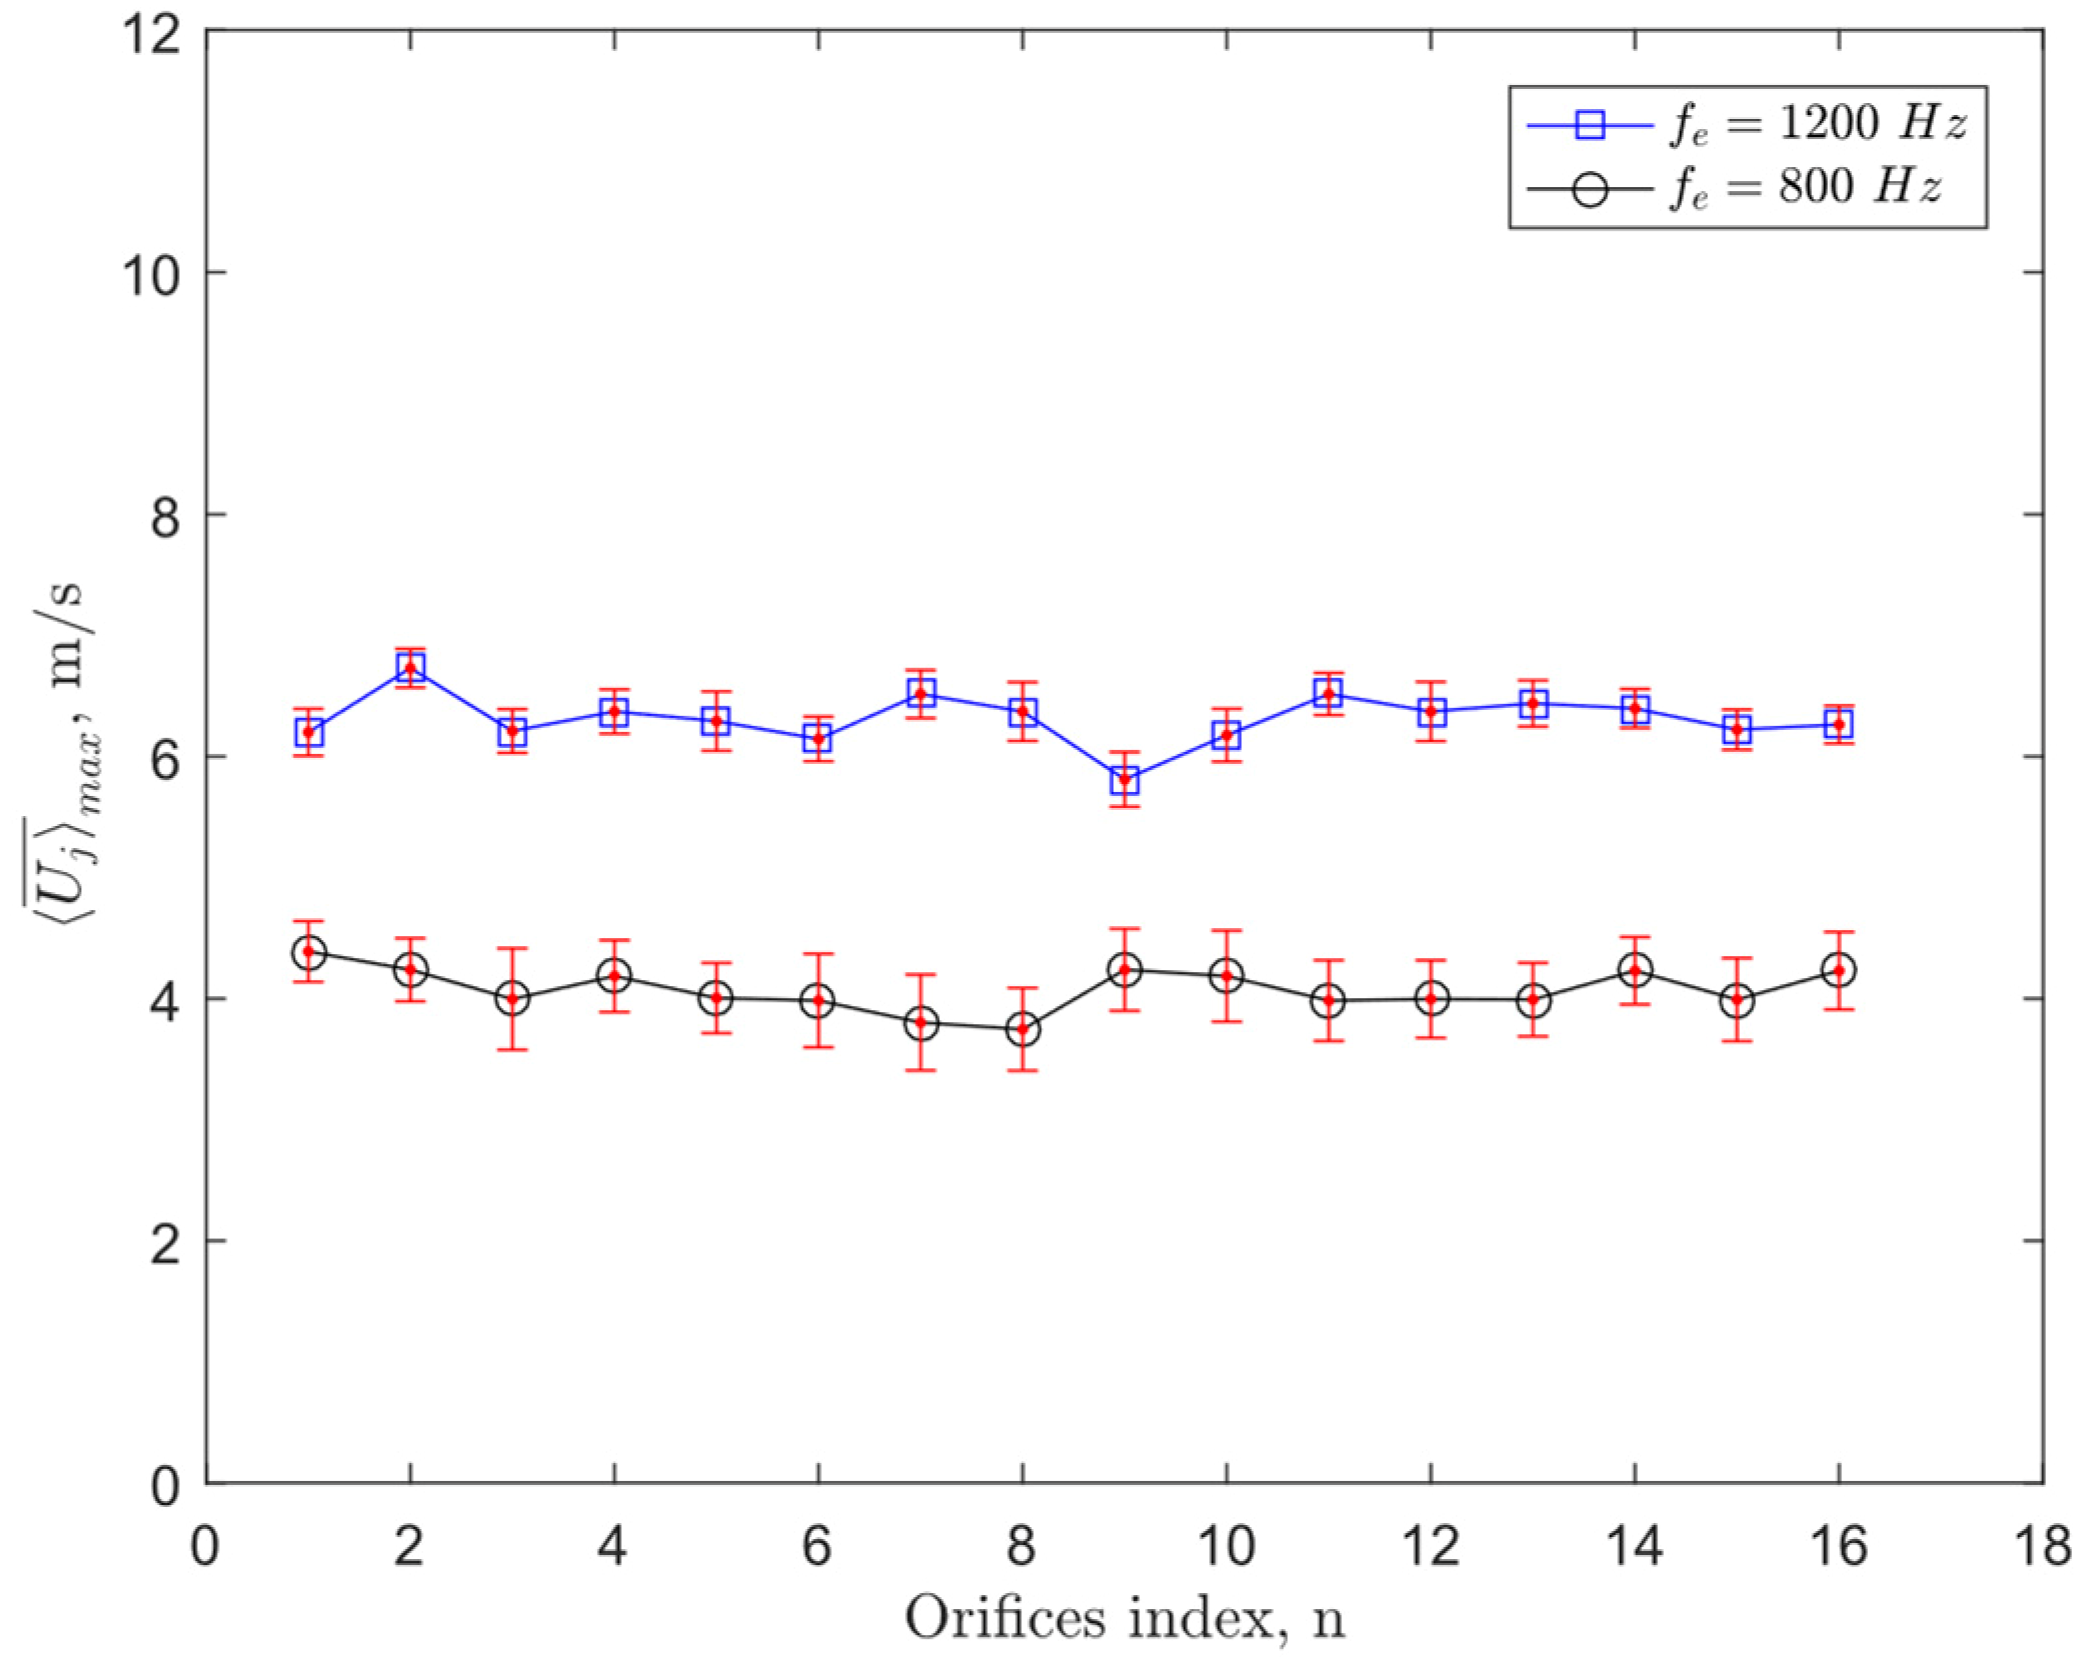
Table 2. All of those frequencies were outside of the experimentally tested excitation frequency range, and none of the acoustic-mode frequencies matched the value of the Helmholtz resonance frequency. As a result, a reasonably uniform velocity distribution (seen in 
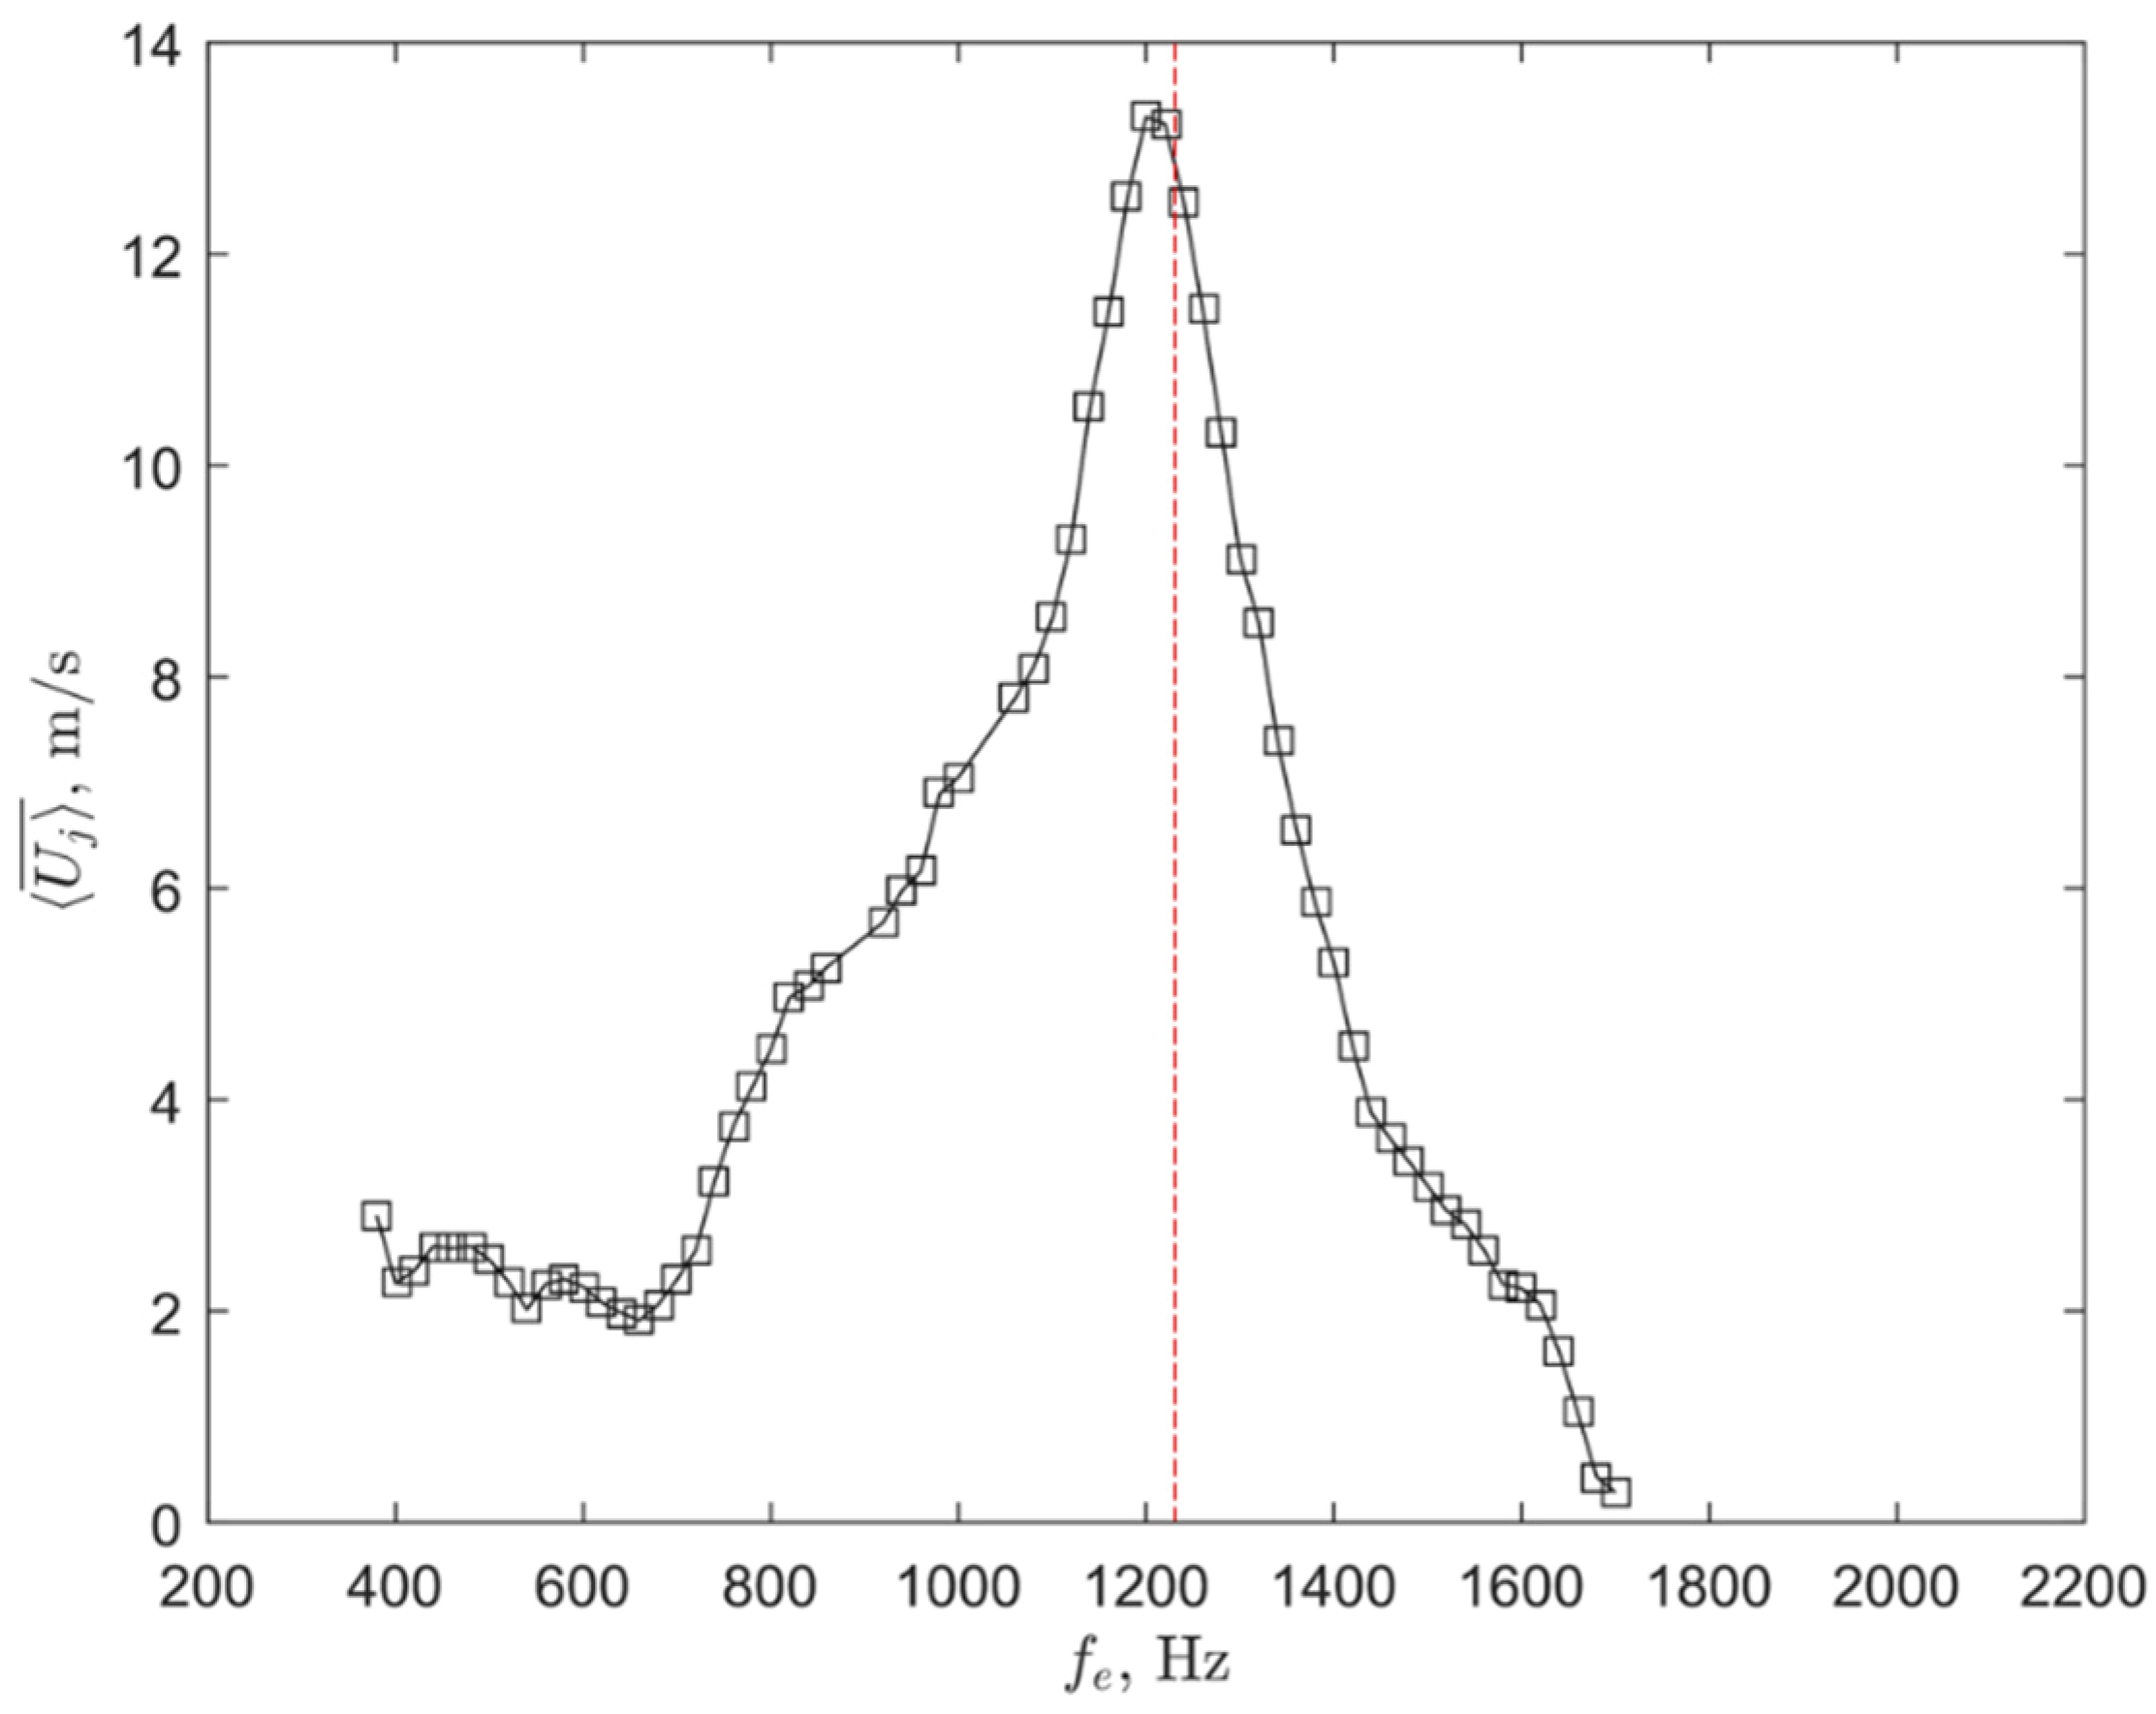
Figure 8) was developed over the SJA configuration with compartmentalized cavities when excited by the Helmholtz frequency, given that it was the only observed peak in the frequency response, as is shown in Figure 7. Additionally, at 800 Hz, a uniform jet velocity along the span was observed experimentally (provided earlier in Figure 8) because no acoustic modes exist in this range.
Although the smaller cavity compartment had a similar Helmholtz resonance frequency to that of the large-aspect-ratio–cavity volume, its shape did not result in acoustic modes close to the Helmholtz resonance frequency. The slenderness of the large cavity was the main reason for the generation of acoustic modes within the excitation frequency range, leading to jet-velocity variations. In the present large-aspect-ratio case, one of the acoustic modes also ended up coupling with the Helmholtz resonance frequency, inducing even larger jet velocities. However, this large jet velocity was still associated with large variations along the span following the acoustic mode shape. In conclusion, to gain high jet velocity and avoid spanwise jet-velocity variations over an SJA array, care should be given so that any acoustic modes will fall far away from the Helmholtz resonance frequency.

5. Conclusions

Frequency response and acoustic-cavity-excitation characteristics of synthetic jet actuators (SJAs) with an array of circular orifices were investigated experimentally and numerically. The array consisted of sixteen circular orifices and was powered by sixteen piezoelectric elements with either a single large-aspect-ratio cavity or eight isolated cavity compartments. In the case of a single, unified cavity, several excitation frequencies were observed to yield peaks in the mean jet velocity. For different excitation frequencies, the mean jet velocity of the expulsion stroke showed different spanwise variations over the array of orifices. In the case of isolated cavity compartments, only a single peak was observed in the frequency response and no variation in the mean jet velocity was detected over the array of orifices for the same excitation frequency range used in the unified-cavity configuration. Acoustic simulations of the large-aspect-ratio-cavity volume of the SJA design showed that each resonant frequency peak observed in the frequency response of the SJA corresponded to an acoustic mode shape of the cavity volume. The different mode shapes resulted in a distinct acoustic-pressure distribution within the cavity, leading to a corresponding variation in the jet velocity from one orifice to another within the array. The phase-angle variations of the jet velocity along the orifices were linked to the acoustic mode shapes of the cavity. Additionally, it was shown that if an acoustic mode fell close to the Helmholtz resonance frequency value, the jet velocity at the exit was amplified.
It was also noted that for an acoustic mode shape to form inside the cavity and induce related jet-velocity variations through the orifices, the excitation frequency did not have to be precisely equal to the associated acoustic natural frequency. With an off-resonance input excitation frequency to the SJA, the acoustic-pressure fluctuations within the cavity could still lock onto the closest acoustic mode, inducing a jet velocity variation over the array. The jet velocity and phase-angle variations observed along the orifices point out possible challenges in developing uniform control schemes across long-span aerofoils using an array of circular orifices from a single chamber. In the present work, by dividing the unified, large cavity into isolated cavity compartments, the acoustic mode shapes of each cavity compartment were put outside of the excitation frequency range and away from the Helmholtz resonance frequency value. As a result, each compartment ejected the same jet velocity, and no variation was observed along the span of the array. This indicates that, while designing an SJA array, cavity/cavities with acoustic mode shapes falling outside of the excitation frequency range of the SJA should be selected to ensure uniform mean jet-velocity output throughout the array. The trade-off is that the resultant jet velocity will be relatively less than what would be obtained when using a large, unified-cavity volume.

Author Contributions

Conceptualization, N.A., P.E.S. and A.E.; methodology, N.A., P.E.S. and A.E.; software, N.A.; validation, N.A.; formal analysis, N.A.; resources, P.E.S. and A.E.; data curation, N.A.; writing—original draft preparation, N.A.; writing—review and editing, P.E.S. and A.E.; supervision, P.E.S. and A.E.; project administration, P.E.S. and A.E.; funding acquisition, P.E.S. and A.E. All authors have read and agreed to the published version of the manuscript.

Funding

This research was funded by the Dean’s Strategic Fund (DSF19-30) from the Faculty of Applied Science and Engineering at the University of Toronto.

Data Availability Statement

Not applicable.

Acknowledgments

The authors would also like to acknowledge the licenses and technical support from CMC microsystems for the software used in this work.

Conflicts of Interest

The authors declare no conflict of interest.

References

  1. Seifert, A.; Eliahu, S.; Greenblatt, D.; Wygnanski, I. Use of Piezoelectric Actuators for Airfoil Separation Control. AIAA J. 1998, 36, 1535–1537. [Google Scholar] [CrossRef]
  2. Glezer, A.; Amitay, M. Synthetic Jets. Annu. Rev. Fluid Mech. 2002, 34, 503–529. [Google Scholar]
  3. Jabbal, M.; Liddle, S.C.; Crowther, W.J. Active Flow Control Systems Architectures for Civil Transport Aircraft. J. Aircr. 2010, 47, 1966–1981. [Google Scholar] [CrossRef] [Green Version]
  4. Obeid, S.; Ahmadi, G.; Jha, R. NARMAX Identification Based Closed-Loop Control of Flow Separation over NACA 0015 Airfoil. Fluids 2020, 5, 100. [Google Scholar] [CrossRef]
  5. Ffowcs Williams, J.E. Active Flow Control. J. Sound Vib. 2001, 239, 861–871. [Google Scholar] [CrossRef]
  6. Löffler, S.; Ebert, C.; Weiss, J. Fluidic-Oscillator-Based Pulsed Jet Actuators for Flow Separation Control. Fluids 2021, 6, 166. [Google Scholar] [CrossRef]
  7. Smith, B.L.; Glezer, A. The Formation and Evolution of Synthetic Jets. Phys. Fluids 1998, 10, 2281–2297. [Google Scholar] [CrossRef]
  8. Vasile, J.D.; Amitay, M. Interaction of a Finite-Span Synthetic Jet near the Tip of a Sweptback Wing. Phys. Fluids 2015, 27, 067102. [Google Scholar] [CrossRef]
  9. Jabbal, M.; Liddle, S.; Potts, J.; Crowther, W. Development of Design Methodology for a Synthetic Jet Actuator Array for Flow Separation Control Applications. Proc. Inst. Mech. Eng. Part G J. Aerosp. Eng. 2013, 227, 110–124. [Google Scholar] [CrossRef]
  10. Monastero, M.C.; Lindstrom, A.M.; Amitay, M. Effect of Synthetic Jets Spacing on Flow Separation over Swept, Flapped Airfoils. AIAA J. 2019, 57, 4670–4683. [Google Scholar] [CrossRef]
  11. Liddle, S.C. The Use of Synthetic Jet Actuators to Enhance Deflected Surface Controls. Ph.D. Thesis, University of Manchester, Manchester, UK, 2007. [Google Scholar]
  12. Tang, H.; Salunkhe, P.; Zheng, Y.; Du, J.; Wu, Y. On the Use of Synthetic Jet Actuator Arrays for Active Flow Separation Control. Exp. Therm. Fluid Sci. 2014, 57, 1–10. [Google Scholar] [CrossRef]
  13. Feero, M.A.; Goodfellow, S.D.; Lavoie, P.; Sullivan, P.E. Flow Reattachment Using Synthetic Jet Actuation on a Low-Reynolds-Number Airfoil. AIAA J. 2015, 53, 2005–2014. [Google Scholar] [CrossRef]
  14. Amitay, M.; Cannelle, F. Evolution of Finite Span Synthetic Jets. Phys. Fluids 2006, 18, 054101. [Google Scholar] [CrossRef]
  15. Amitay, M.; Smith, D.R.; Kibens, V.; Parekh, D.E.; Glezer, A. Aerodynamic Flow Control over an Unconventional Airfoil Using Synthetic Jet Actuators. AIAA J. 2001, 39, 361–370. [Google Scholar] [CrossRef]
  16. Amitay, M.; Glezer, A. Role of Actuation Frequency in Controlled Flow Reattachment over a Stalled Airfoil. AIAA J. 2002, 40, 209–216. [Google Scholar] [CrossRef]
  17. Yang, E.; Ekmekci, A.; Sullivan, P.E. Phase Evolution of Flow Controlled by Synthetic Jets over NACA 0025 Airfoil. J. Vis. 2022. [Google Scholar] [CrossRef]
  18. Goodfellow, S.D.; Yarusevych, S.; Sullivan, P.E. Momentum Coefficient as a Parameter for Aerodynamic Flow Control with Synthetic Jets. AIAA J. 2013, 51, 623–631. [Google Scholar] [CrossRef]
  19. Gil, P.; Wilk, J.; Korzeniowski, M. Helmholtz Resonance Frequency of the Synthetic Jet Actuator. Appl. Sci. 2021, 11, 5666. [Google Scholar] [CrossRef]
  20. Gallas, Q.; Holman, R.; Nishida, T.; Carroll, B.; Sheplak, M.; Cattafesta, L. Lumped Element Modeling of Piezoelectric-Driven Synthetic Jet Actuators. AIAA J. 2003, 41, 240–247. [Google Scholar] [CrossRef] [Green Version]
  21. Gallas, Q. On the Modeling and Design of Zero-Net Mass Flux Actuators. Ph.D. Thesis, University of Florida, Gainesville, FL, USA, 2005. [Google Scholar]
  22. Gomes, L.D.; Crowther, W.J.; Wood, N.J. Towards a Practical Piezoceramic Diaphragm Based Synthetic Jet Actuator for High Subsonic Applications—Effect of Chamber and Orifice Depth on Actuator Peak Velocity. In Proceedings of the 3rd AIAA Flow Control Conference, San Francisco, CA, USA, 5–8 June 2006; pp. 267–283. [Google Scholar]
  23. Van Buren, T.; Whalen, E.; Amitay, M. Achieving a High-Speed and Momentum Synthetic Jet Actuator. J. Aerosp. Eng. 2016, 29, 04015040. [Google Scholar] [CrossRef]
  24. Jabbal, M.; Jeyalingam, J. Towards the Noise Reduction of Piezoelectrical-Driven Synthetic Jet Actuators. Sens. Actuators A Phys. 2017, 266, 273–284. [Google Scholar] [CrossRef]
  25. Guo, Y. Acoustic Analysis of Low-Noise Actuator Design for Active Flow Control. J. Sound Vib. 2008, 311, 843–860. [Google Scholar] [CrossRef]
  26. Smyk, E.; Markowicz, M. Impact of the Soundproofing in the Cavity of the Synthetic Jet Actuator on the Generated Noise. Fluids 2022, 7, 323. [Google Scholar] [CrossRef]
  27. Smyk, E.; Markowicz, M. Acoustic and Flow Aspects of Synthetic Jet Actuators with Chevron Orifices. Appl. Sci. 2021, 11, 652. [Google Scholar] [CrossRef]
  28. Van Buren, T.; Whalen, E.; Amitay, M. Synthetic Jet Actuator Cavity Acoustics: Helmholtz versus Quarter-Wave Resonance. J. Vib. Acoust. Trans. ASME 2015, 137, 054501. [Google Scholar] [CrossRef]
  29. Bourquard, C.; Noiray, N. Stabilization of Acoustic Modes Using Helmholtz and Quarter-Wave Resonators Tuned at Exceptional Points. J. Sound Vib. 2019, 445, 288–307. [Google Scholar] [CrossRef] [Green Version]
  30. Feero, M.A.; Lavoie, P.; Sullivan, P.E. Influence of Synthetic Jet Location on Active Control of an Airfoil at Low Reynolds Number. Exp. Fluids 2017, 58, 99. [Google Scholar] [CrossRef]
  31. COMSOL Inc. Acoustics Module User’s Guide. Available online: www.comsol.com/blogs (accessed on 1 December 2020).
  32. Kinsler, L.E.; Frey, A.R.; Coppens, A.B.; Sanders, J.V. Fundamentals of Acoustics; John Wiley & Sons: Hoboken, NJ, USA, 1999. [Google Scholar]
  33. Holman, R.; Utturkar, Y.; Mittal, R.; Smith, B.L.; Cattafesta, L. Formation Criterion for Synthetic Jets. AIAA J. 2005, 43, 2110–2116. [Google Scholar] [CrossRef] [Green Version]
  34. Milanovic, I.M.; Zaman, K.B.M.Q. Synthetic Jets in Crossflow. AIAA J. 2005, 43, 929–940. [Google Scholar] [CrossRef] [Green Version]
  35. Shuster, J.M.; Smith, D.R. Experimental Study of the Formation and Scaling of a Round Synthetic Jet. Phys. Fluids 2007, 19, 045109. [Google Scholar] [CrossRef]
Figure 1. Exploded view of the SJA showing (a) the single cavity case, with 16 piezoelectric elements and 16 orifices, and (b) 8 single-compartmented cavities, where the cavity volume plate illustrates how the division of the array cavity into 8 equal compartments is achieved. Dashed lines show the assembly lines.
Fluids 07 00387 g001
Figure 2. (a) The air volume existing inside the single array cavity, excited by the 16 piezoelectric elements, and (b) the air volume entrained within one of the cavity compartments, excited by two piezoelectric elements, i.e., this is one of the eight compartments shown in Figure 1b.
Fluids 07 00387 g002
Figure 3. (a) Phase-averaged jet velocity, 〈u(ϕ)〉, at the exit of the orifice Y/D = 0 in response to (b) the sinusoidal excitation at the frequency of fe = 1220 Hz and the excitation voltage of E = 150 Vpp. Error bars mark the standard deviation in estimating the phase-averaged jet velocity.
Fluids 07 00387 g003
Figure 4. Time–mean velocity, U j ¯ , at the centre of the jet exit plane (X/D = Y/D = 0) as a function of the excitation frequency, fe, for the unified array cavity at the exit of the orifice located in the middle of the array (n = 8), E = 150 Vpp. Estimated Helmholtz frequency value is shown by dotted line.
Fluids 07 00387 g004
Figure 5. The mean jet velocity during the blowing stroke across two consecutive synthetic jet orifices (n = 8 and n = 9) for the excitation frequency fe = 1220 Hz. Velocity measurements are performed at one orifice diameter above the exit of the orifices (Y/D = 1). The excitation voltage is E = 150 Vpp.
Fluids 07 00387 g005
Figure 6. Variation of the peak mean jet velocity during expulsion stroke along the array of orifices at Y/D = 1 (measured at each orifice centreline) for two excitation frequencies (fe = 800 Hz and 1200 Hz) for the unified-array-cavity volume. Error bars show the standard deviation of measurements at each point. The excitation voltage is E = 150 Vpp.
Fluids 07 00387 g006
Figure 7. Time–mean velocity, U j ¯ , at the jet centre over the expulsion stroke as a function of the excitation frequency, fe, for one of the eight cavity compartments at the exit of the orifice located in midspan of the array, n = 8. Estimated Helmholtz frequency value is shown by dotted line.
Fluids 07 00387 g007
Figure 8. Variation of the time–mean jet velocity during expulsion stroke along the array of orifices at Y/D = 1 (measured at each orifice centreline) for two representative excitation frequencies (fe = 800 Hz and 1200 Hz) for the case with compartmented cavities.
Fluids 07 00387 g008
Figure 9. Results of acoustic simulations showing the instantaneous acoustic-pressure distribution, i.e., acoustic mode, within the unified, large-aspect-ratio-cavity volume for different natural frequencies. The frequencies are (a) fs1 = 956 Hz, (b) fs2 = 1126 Hz, (c) fs3 = 1252 Hz, and (d) fs4 = 1331 Hz.
Fluids 07 00387 g009
Figure 10. (a) Variation of the phase-angle difference between the phase-averaged peak jet velocity at the orifice centre and the peak input excitation along all 16 orifices for the excitation of the unified cavity at the frequency of fe = 1200 Hz, which is an on-resonance peak, and (b) the variation of the instantaneous acoustic pressure within the unified-cavity volume for the corresponding acoustic mode at the natural frequency of fs = 1252 Hz.
Fluids 07 00387 g010
Figure 11. (a) Variation of the phase-angle difference between the phase-averaged peak jet velocity at the orifice centre and the peak input excitation along all 16 orifices for the excitation of the unified-cavity configuration at the frequency of fe = 800 Hz and (b) the variation of the instantaneous acoustic pressure within the unified-cavity volume at the closest resonance frequency of an acoustic mode (fs = 956 Hz).
Fluids 07 00387 g011
Figure 12. Instantaneous acoustic-pressure distribution, i.e., acoustic mode shape, inside a single compartment from the compartmented cavity configuration for the first two natural frequencies (a) fs1 = 4664 Hz and (b) fs2 = 5410 Hz.
Fluids 07 00387 g012
Table 1. Comparison of the natural frequencies, in Hz, obtained from acoustic simulations with resonant frequencies extracted from experimental measurements for the unified, large-aspect-ratio-cavity volume.
Mode Index1234
Simulations956112612521331
Experiments960114012201360
Table 2. The natural frequencies (in Hz) corresponding to the acoustic mode shape of the single-cavity unit within the compartmented cavity design.
Mode Index1234
Simulations4664541068907667
Publisher’s Note: MDPI stays neutral with regard to jurisdictional claims in published maps and institutional affiliations.

