Article

Dynamic Behavior of Air Void during the Discharge of Cohesive Powder in a Hopper Using a Rubber Air Spring

1
Department of Shipping Technology, National Institute of Technology, Oshima College, 1091-1 Komatsu, Suo Oshima, Oshima, Yamaguchi 742-2193, Japan
2
Department of Mechanical Engineering, National Institute of Technology, Oita College, 1666 Maki, Oita City 870-0152, Japan
*
Author to whom correspondence should be addressed.
Fluids 2021, 6(8), 276; https://doi.org/10.3390/fluids6080276
Submission received: 11 July 2021 / Accepted: 31 July 2021 / Published: 6 August 2021
(This article belongs to the Collection Advances in Flow of Multiphase Fluids and Granular Materials)

Abstract

:
An unstable discharge rate occurs during dry fine powder discharge from a hopper because of the significant two-phase solid/gas interactions that occur in powder flows. In addition, the air bubble phenomenon may occur in a silo during fine powder discharge. In this study, we conducted experiments using a semi-conical dual-structure hopper, and examined the effects on the hopper internal flow structure, cavity fluid pressure, pressure inside the airtight cavity section, and the powder discharge rate when changes are made in the position of the supplied air injection port and the solenoid valve open/close timing. From the experimental results, it was confirmed that an appropriate pressure supply port position exists, and the change in expansion/contraction of the flexible container due to air vibration is determined by the balance between the amount of air inserted and the amount of air discharged, and does not affect the presence or absence of powder so much. Furthermore, as the pressure value in the airtight void is directly related to the change in the expansion and contraction of the flexible container, the maximum amplitude value of the pressure in the airtight void can be kept high and constant at the time of opening and closing the solenoid valve.

1. Introduction

In recent years, high quality, resource conservation, energy conservation, environmental protection, and hygiene have been regarded as important in the handling of powders, and there are strict requirements for precise management when handling refined powders for applications such as pharmaceuticals, magnetic powders, and pigments. Previously, hoppers have been used to measure and transport powders in treatment processes in industrial fields handling all sorts of powders. However, these hoppers have the problem that arches form near the discharge port, and the powder causes a blockage inside the hopper, thus making it difficult to smoothly discharge powder [1,2,3].
Various steps have been taken to resolve the above problem. Examples include methods employing structural countermeasures in the hopper, methods employing mechanical manipulation, and methods applying an air current to the powder layer. First, with methods employing structural countermeasures in the hopper, it is possible to reduce friction between the powder and hopper wall by increasing the inclination angle of the hopper, but the hopper volume decreases with this method. In addition, if the diameter of the hopper’s discharge port is increased, then the powder near the hopper inner wall is pressed against the wall because of powder pressure, resulting in increased friction between the powder particles and the wall surface, which makes it harder for powder to slide, and thus only powder directly above the discharge port is discharged first. In addition, powder is discharged through the funnel flow, as shown in 
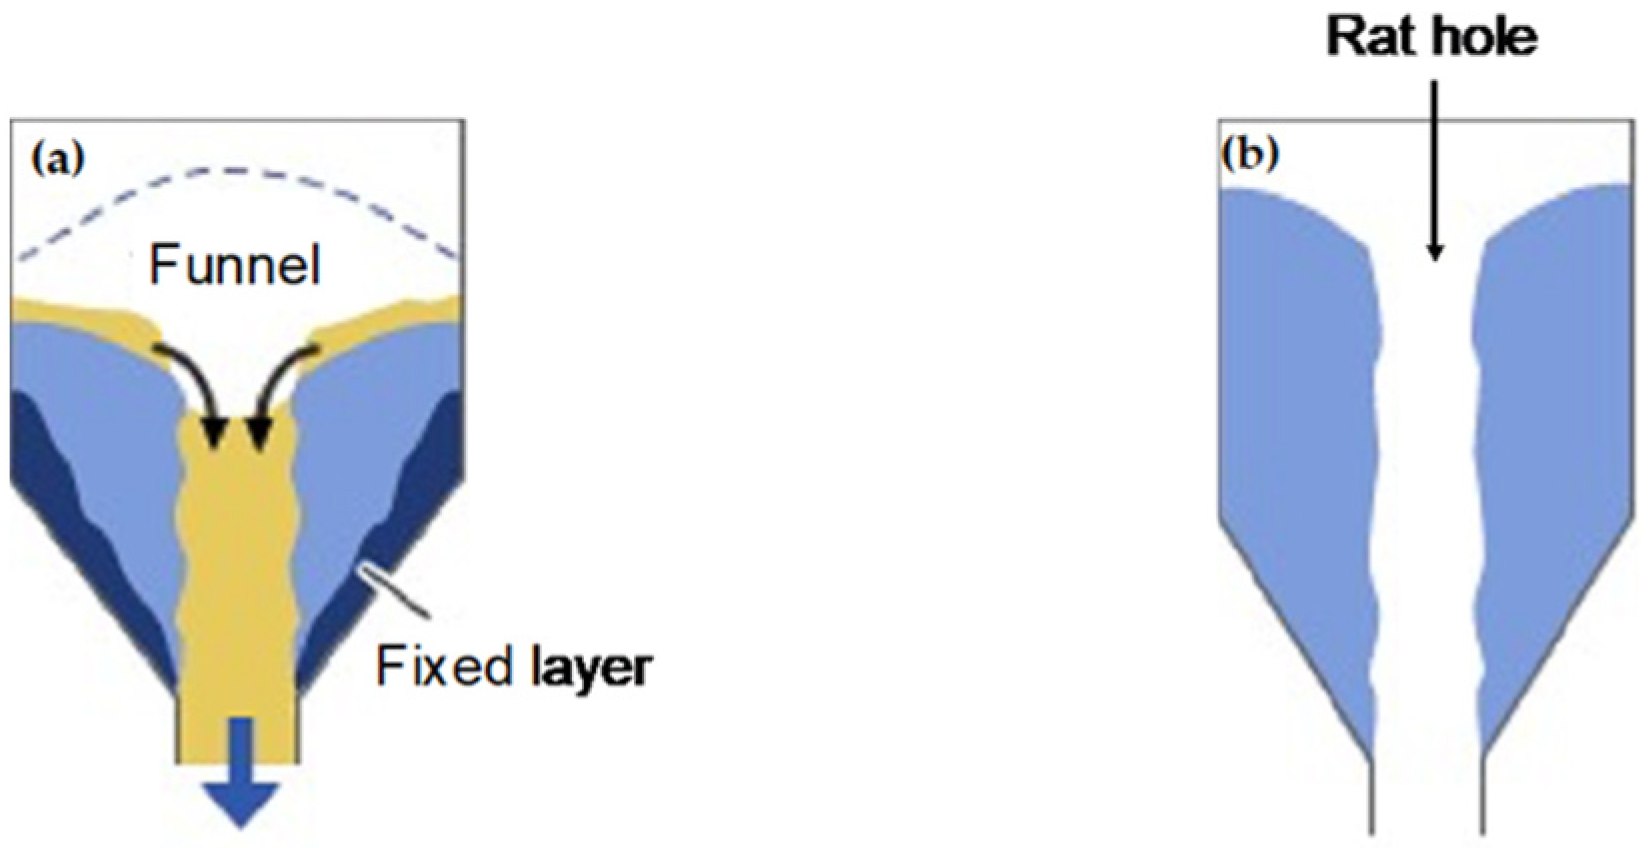
Figure 1a, where the powder gradually collapses and flows down, starting from the top powder layer near the discharge layer. Therefore, the discharge speed of the powder near the hopper inner wall is slow, in contrast with the high discharge speed of the powder directly above the discharge port, and as irregularity appears in the amount of powder supplied per unit time, it becomes difficult to control the discharge rate.
Next, with methods using mechanical manipulation, impact or vibration is applied to the hopper, and here cost issues arise, such as increased equipment size and complexity, noise produced by impact, and the need to provide the hopper with enough strength to withstand impact. Furthermore, when impact or vibration is applied to a hopper, there will be funnel flow discharge like that explained above if the force applied from the outside is not uniform. In this case, powder is discharged to a certain extent, but a problem arises in that a residual layer is formed in the cone near the hopper inner wall, and in the formed residual layer, there is no replacement with new powder, so a caked layer is formed and the powder is solidified. Finally, in methods applying air current to the powder layer, the powder is dispersed by blowing compressed air into the hopper, but here too, there is a problem in that it is impossible to break down the top end part of the arch produced in the powder layer, and if a rat hole (a condition like that in Figure 1b where powder sticks near the wall surface of the hopper, and powder is not present at the top part of the discharge port) appears, the method cannot exhibit an effect because the air passes through the rat hole. In this way, we can say that none of these measures can serve as a method for smoothly discharging cohesive powder from a hopper, and that solving this problem is an important issue.
Several previous studies have investigated fine powder discharge. Bideau and Hansen [4], and Wu et al. [5] demonstrated an oscillatory discharge phenomenon of fine powders using hour glasses, and presented several interesting properties to increase our understanding of the granular flow, with interstitial fluid playing a critical role. Janda et al. [6] investigated the fluctuations in the flow rate in the discharge of grains from a two-dimensional (2D) silo. Their results demonstrated that the power spectrum of the oscillations of the flow rate was not dominated by any particular frequency. Pennec et al. [7] experimentally investigated the effect of ambient pressure on the flow properties in an open-top silo. They determined that an intermittent flow became continuous at a sufficiently low surrounding pressure, and demonstrated that the intermittency was due to the interaction between the particles and air. Lu et al. [8] investigated the effects of the surface roughness of a particle on the gravity discharge rate and flow behavior of fine dry powders from a hopper. They argued that the van der Waals force dominated the discharge of fine particles. Huang et al. [9] presented experimental results for the discharge characteristic of cohesive fine coal from an aerated hopper, and discovered that aeration is an effective method for improving the flow pattern and increasing the discharge rate for cohesive fine powder. However, if the aeration position is too close to the outlet, a stable arch forms that significantly decreases the discharge rate and may even cause a jam.
The effect of reverse-direction air flow on fine powder discharge was also discussed in our two previous studies [10,11]. Hsiau et al. [10] investigated the effect of ambient pressure on the discharge process in a silo. The results demonstrated that the ambient pressure significantly influenced the discharge process, and that the effects of air flow could be reduced by lowering the ambient pressure. In Hsiau et al. [11], open-top and closed-top silos with different outlet openings sizes were tested to investigate the discharge behavior of different-sized fine sands using the Beverloo equation and Darcy’s law. The average discharge rate and pressure drop in the silos were measured and analyzed. In relatively fine powder silo systems (particle size smaller than 196 μm), a bubble phenomenon can occur. Sheng et al. [12] experimentally investigated the effect of air bubbles on fine powder discharge behavior, including the discharge mass flow rate and variation in the pressure inside the silo. An initial collapse of the powder bed in the silo was observed at the beginning of the discharge process, causing the pressure to change rapidly. Moreover, the dependence of the bubble size, bubble rising velocity, number of bubbles, and frequency of the bubble generation on the size of the fine powder were analyzed in detail.
Therefore, to enable the gravity discharge of cohesive powder, we fabricated a dual-structure hopper in which a rubber flexible container was inserted inside the rigid container constituting the hopper. In addition, tests were conducted using this dual-structure hopper. First, the powder discharge characteristics were clarified in a conical hopper, and the effectiveness of this hopper was confirmed [13]. Furthermore, to visualize the flow conditions of the powder layer that exists in the hopper during powder discharge, we fabricated a semi-conical dual-structure hopper and observed the internal flow structure. The results showed that air voids appeared in the powder layer at the same time as the powder discharge, and it was confirmed that these moved inside the layer [
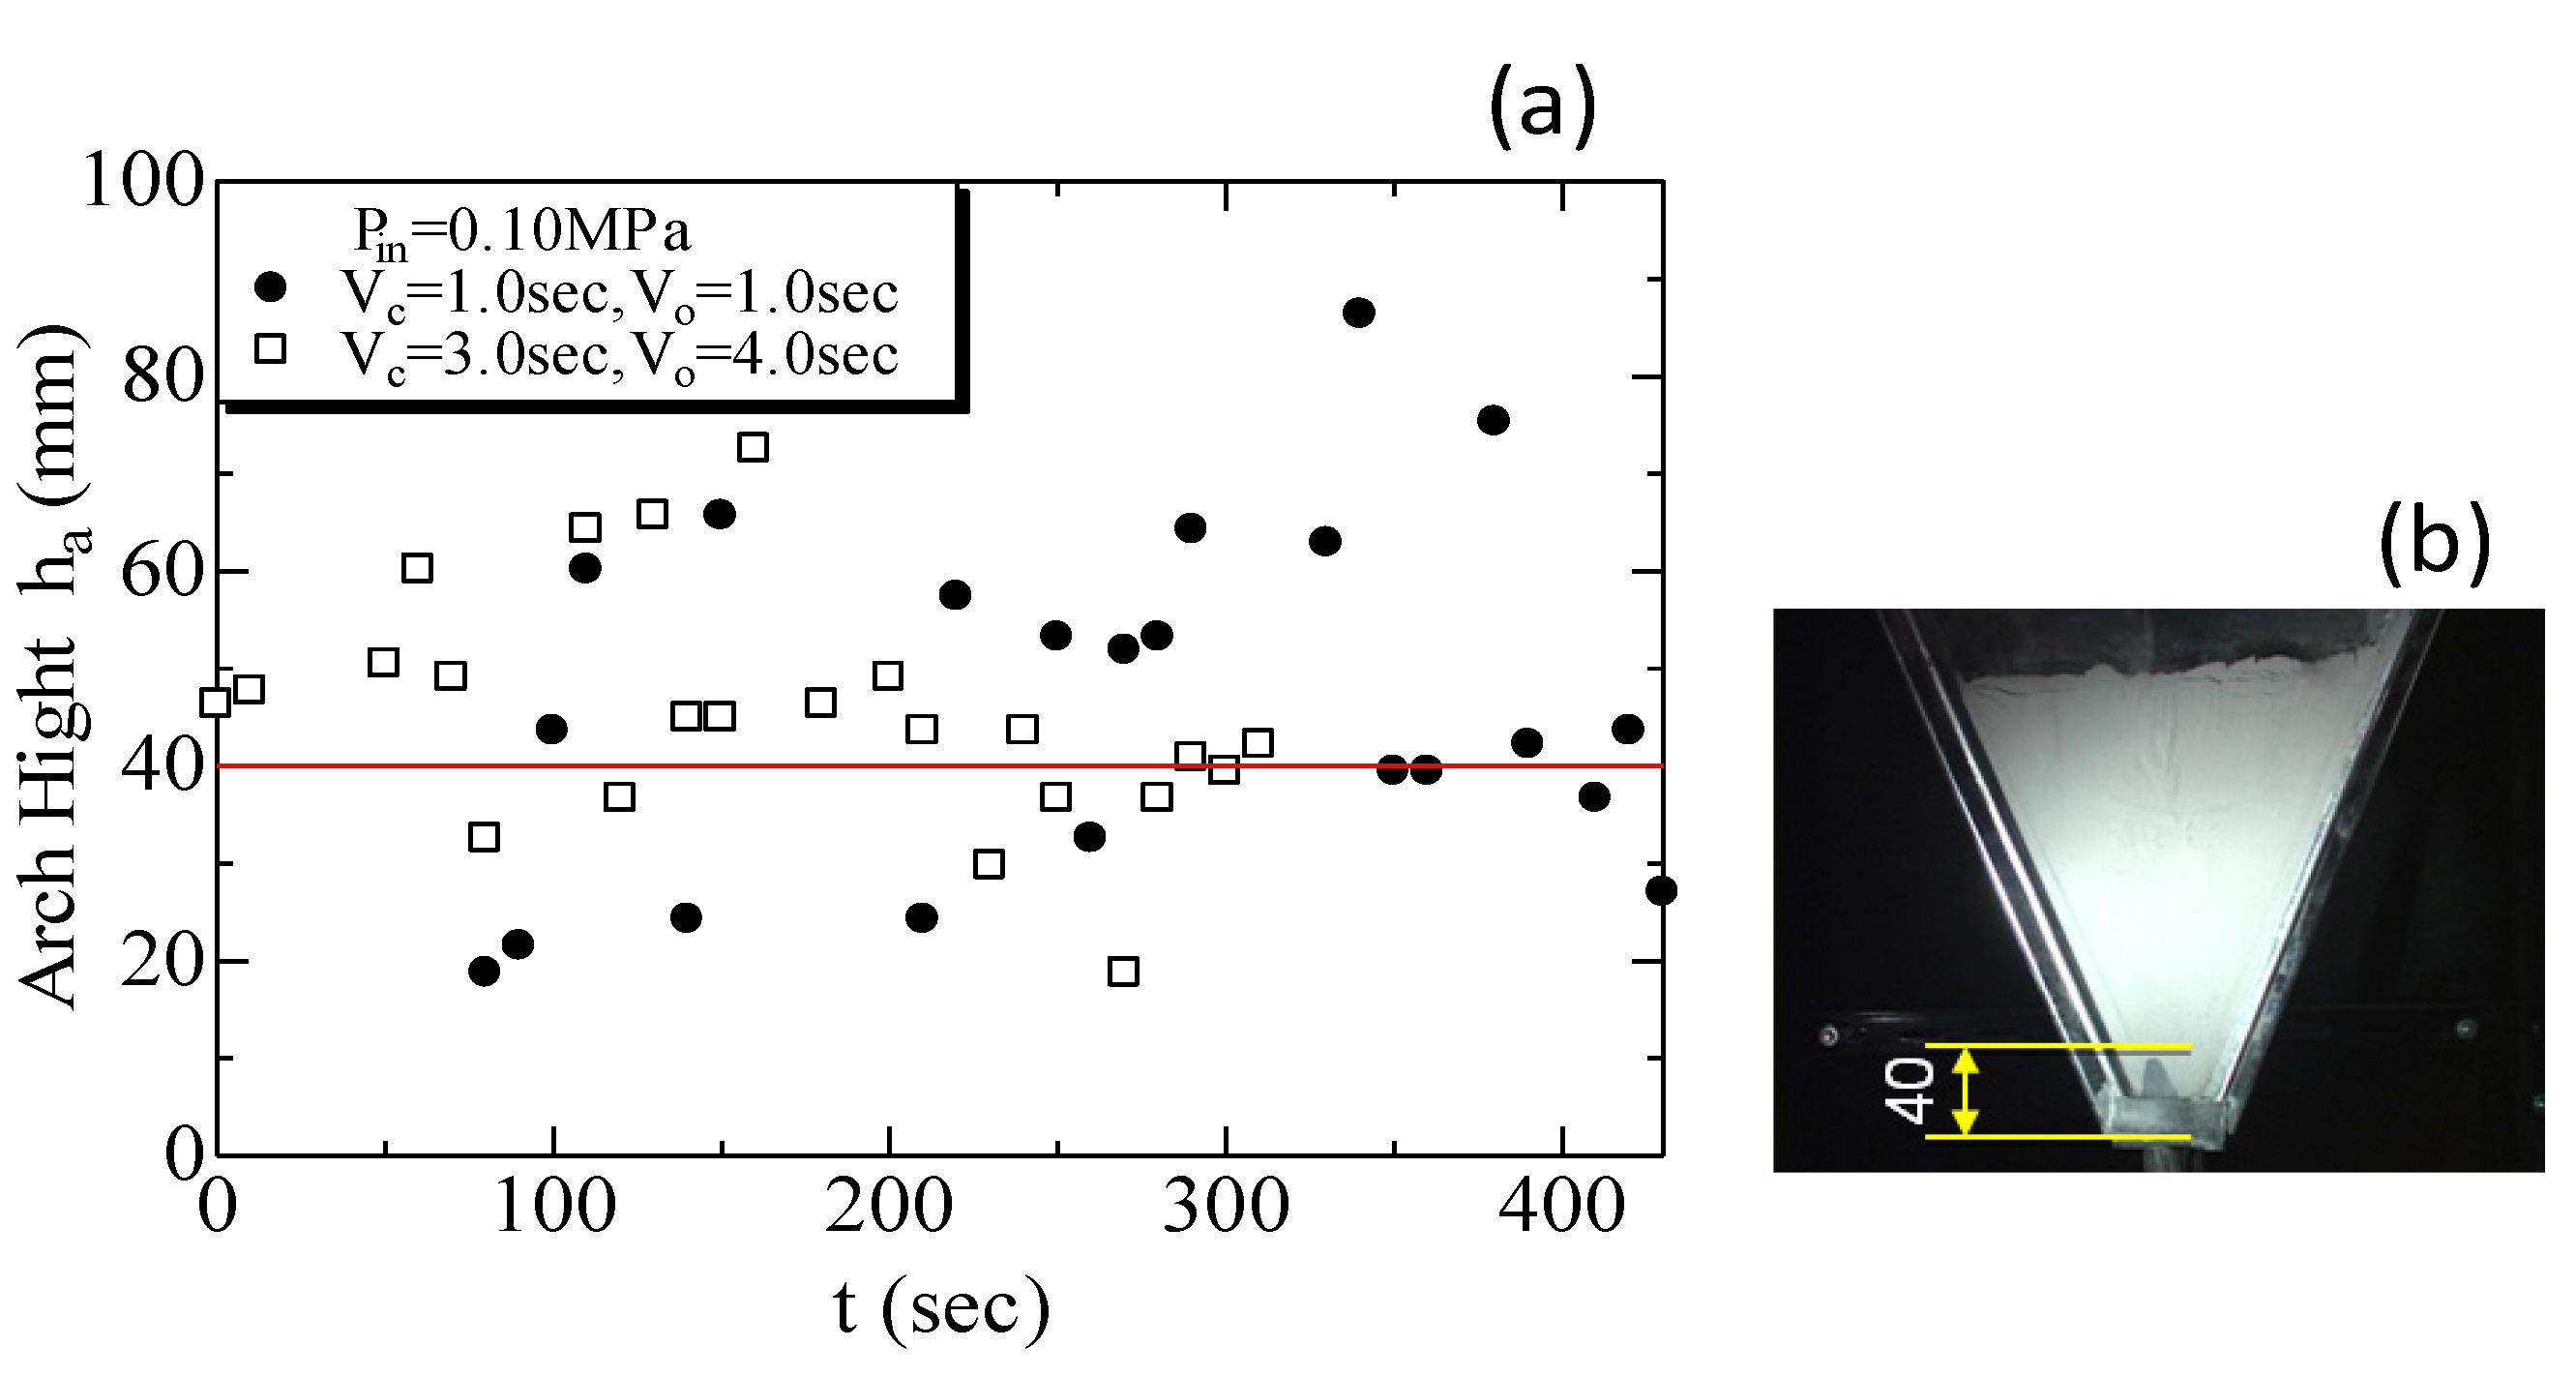
14]. On the other hand, in previous research, supply was done by positioning the supplied air injection port at a height of 40 mm from the discharge port of the hopper, but it is unclear whether this position was really the optimal position. Furthermore, the discharge rate and variation in the flexible container expansion have not been elucidated in the case where the open/close timing of the solenoid valve is varied.
Therefore, in this research, we conducted experiments using a semi-conical dual-structure hopper, and examined the effects on the hopper internal flow structure, cavity fluid pressure, pressure inside the airtight cavity section, and the powder discharge rate when changes were made in the position of the supplied air injection port and the solenoid valve open/close timing.

2. Materials and Methods

2.1. Structure of Semi-Conical Dual-Structure Hopper

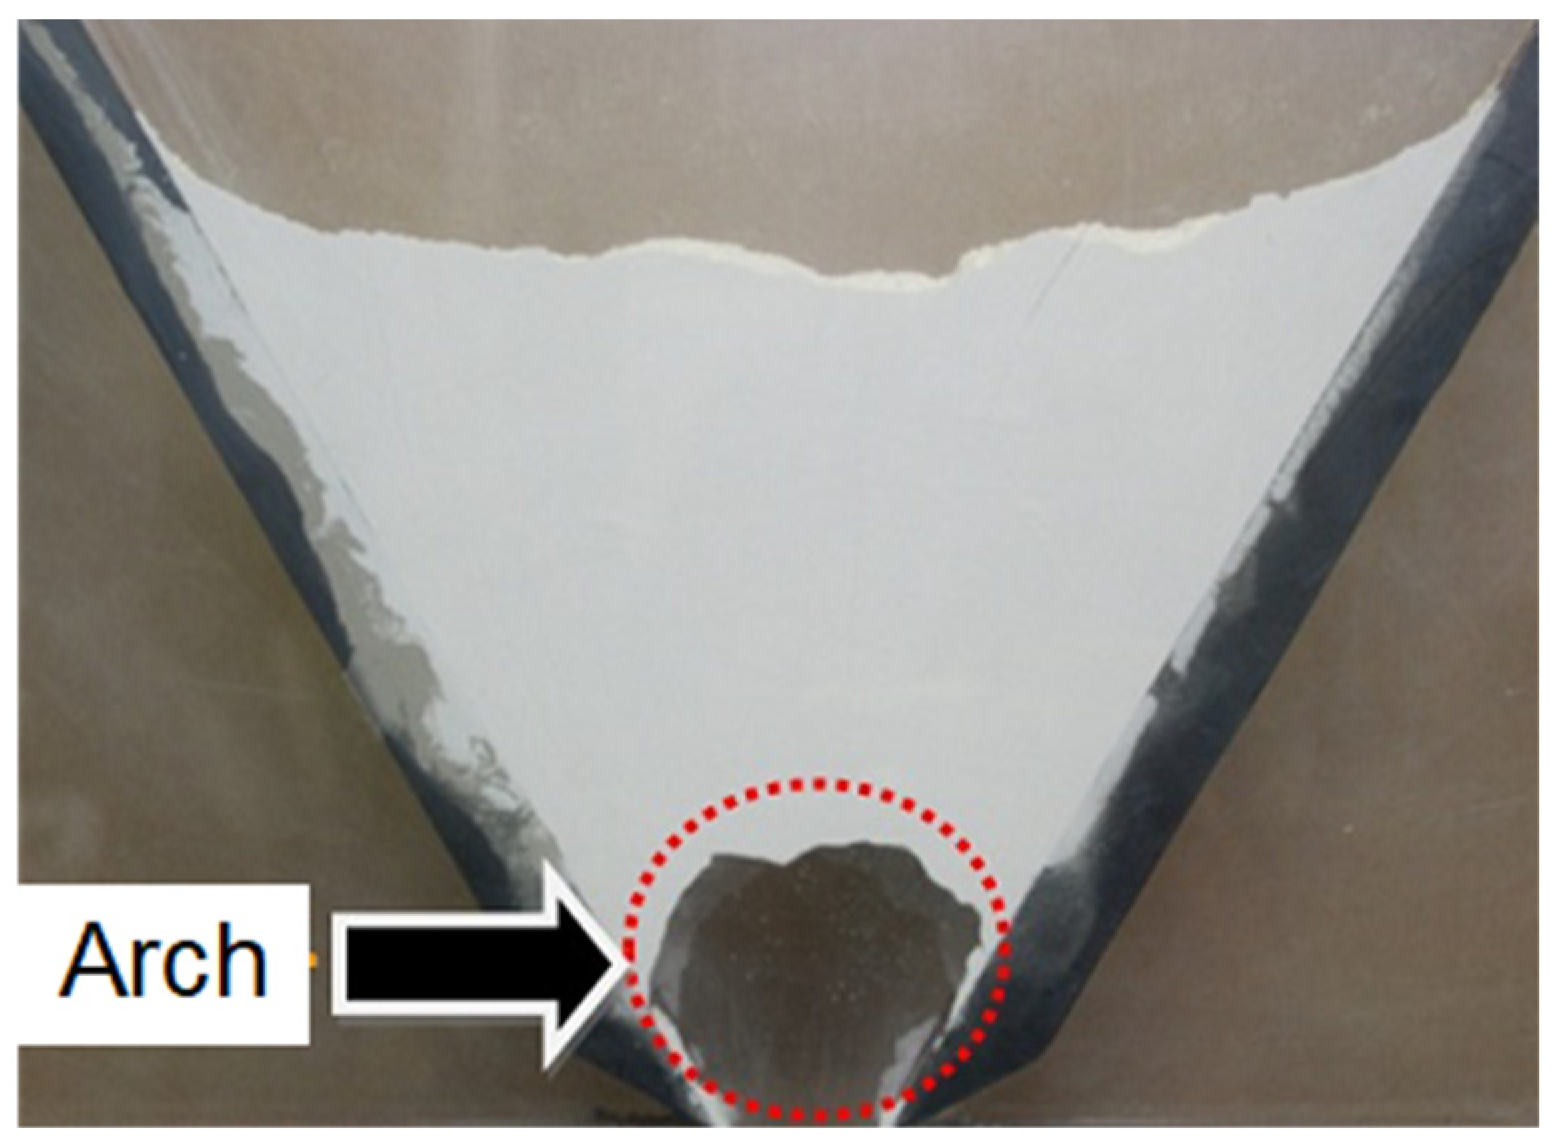
Figure 2 shows a photo of the situation when the powder is actually causing a blockage inside the hopper. Generally speaking, in the discharge of powder in a hopper, air gets into the gaps between the particles, and this lessens the friction between particles. However, in the case of a microparticle powder, the particle diameter is small and thus the gaps that can be created between particles are also smaller, the amount of air that passes through decreases, and the friction between particles increases. In addition, because the pathways for this air are blocked, and particles cohere together, arches like that shown in the figure are formed near the hopper discharge port, and this stops the discharge of powder from the hopper. If vibration is applied from the outside while in this condition, the arch will break down and the discharge of powder will resume, but if the vibration from outside is shut off, the arch will form again. We noticed this property, and to avoid blockages inside of hoppers for cohesive powder, we fabricated a dual-structure hopper composed of a rigid container and flexible container.
Figure 3 schematically indicates the structure of the dual-structure hopper and the flow of the powder inside. A rubber flexible container was inserted inside the rigid container constituting the hopper, thereby providing an airtight cavity between the rigid container and flexible container. In addition, if an arch was formed inside the hopper, as in Figure 3a, the system was designed to inject compressed air into the airtight cavity, as shown in Figure 3b, effectively breaking down the arch formed in the hopper through an expanding and contracting motion of the flexible container driven by air oscillation, thereby enabling powder discharge.

2.2. Experiment Equipment

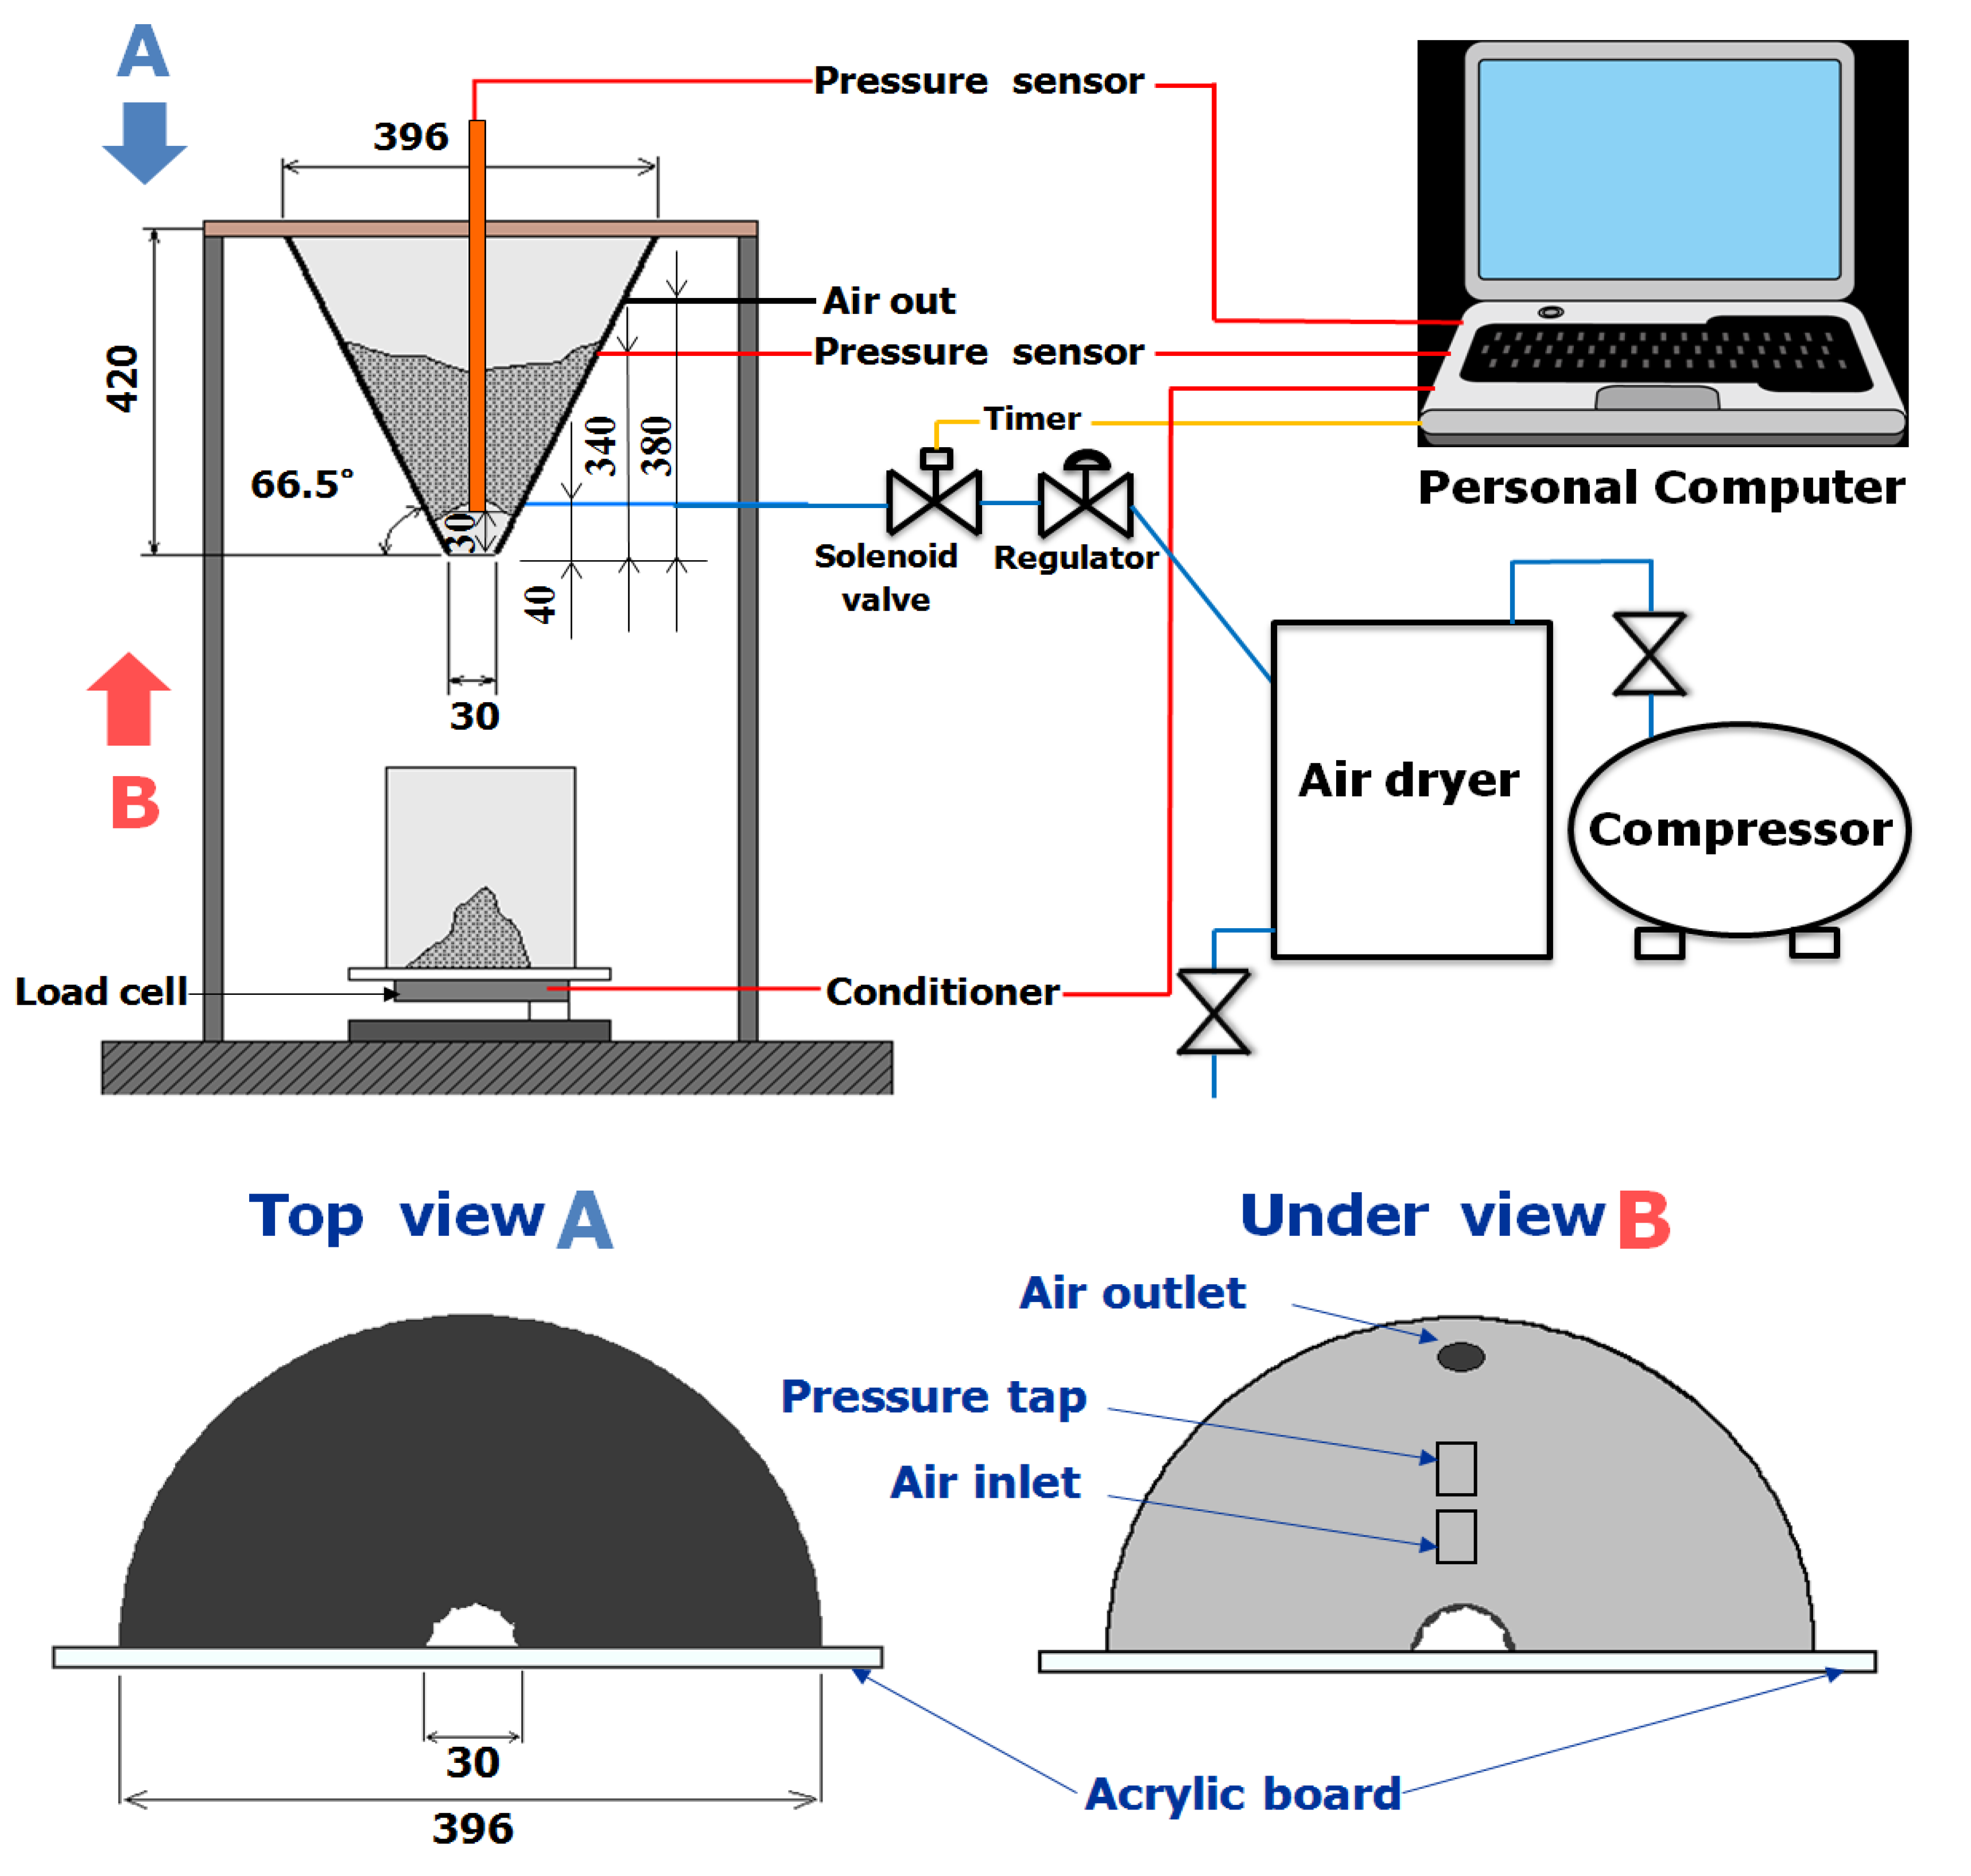
Figure 4 shows a schematic diagram of the experiment equipment and measuring equipment. This hopper has a dual-structure, with a rubber flexible container with a 0.5 mm thickness inserted into a stainless steel semi-conical rigid container of a 1 mm thickness, and a transparent acrylic panel of a 5 mm thickness is mounted on the vertical side to allow for viewing of the flow structure of the powder. In addition, by fastening the top end and bottom end of the hopper, an airtight cavity was provided to enable the supply of compressed air between the rigid container and flexible container. Detailed dimensions of the hopper are a height of 420 mm, diameter of 396 mm, discharge port diameter of 30 mm, and incline angle of 66.5°. To maintain a constant expansion rate of the flexible container due to the supply of compressed air, supplied air injection ports (pipe inner diameter 6 mm) are provided, as indicated in 
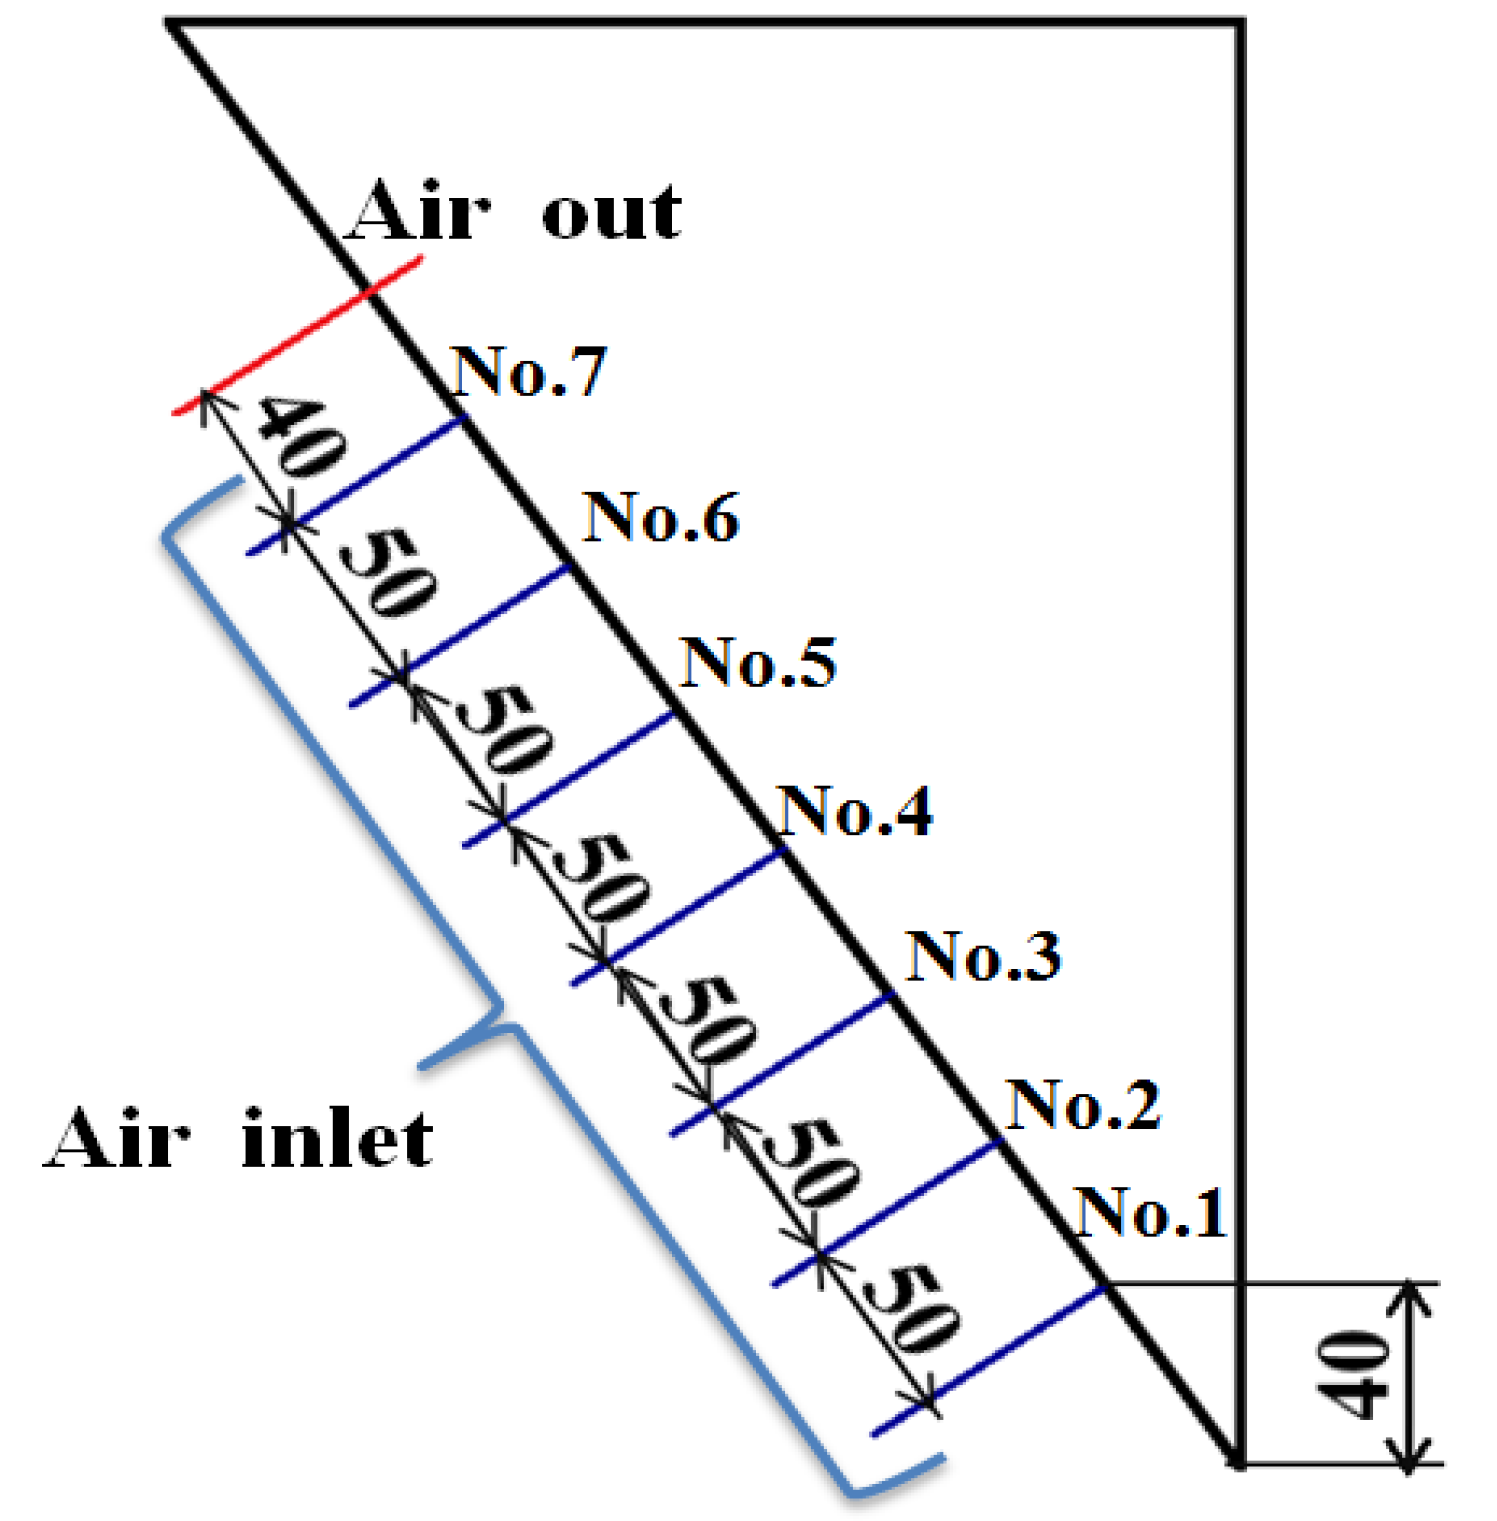
Figure 5, at seven points, located at heights from the hopper bottom of 40 mm (No. 1), 90 mm (No. 2), 140 mm (No. 3), 190 mm (No. 4), 240 mm (No. 5), 290 mm (No. 6), and 340 mm (No. 7), and the injected air was discharged from the discharge port (pipe diameter of 8 mm) located at a height of 380 mm from the bottom of the hopper. Compressed air produced by the compressor passed through an air dryer, regulated to the proper pressure with a pressure reducing valve, and supplied via a solenoid valve to the airtight cavity between the rigid container and flexible container of the hopper. By repeatedly opening and closing this solenoid valve, the flexible container can be made to oscillate.
As the measuring equipment, a micro pressure differential converter with a built-in amp (PDV-10GA, made by KYOWA, Tokyo, Japan) was used to measure the cavity fluid pressure of the powder layer inside the hopper. In this experiment, a brass pressure probe with an outer diameter of 3 mm and inner diameter of 2 mm was placed in the powder layer, 30 mm from the bottom of the hopper, and the pressure was measured by introducing the cavity fluid pressure at the end of that into a pressure sensor. In addition, the pressure of the airtight cavity between the rigid container and the flexible container was measured at a height of 340 mm from the bottom of the hopper. The change over time in the amount of powder discharged from the hopper was measured using a load cell (C2G1-10k, made by NMB, Tokyo, Japan) installed at the bottom of the hopper. The load cell measurement system used in this experiment was the strain (compression) system employing a beam-type single-point load cell, and if force (a load) was applied, then at the same time, the load cell deformed, the strain gauge mounted to the surface of the load cell also deformed, and thus the measurement principle used the fact that the resistance value varied according to the amount of deformation, and involved detecting a minute voltage that varied in proportion with the change in the resistance value of the strain gauge, when a voltage was applied to the power supply terminals of the load cell.
These electrical signals produced during measurement were acquired with a digital recorder (GR-3500, made by KEYENCE, Osaka, Japan) at a sampling time of 100 ms, and data processing was performed afterward with a personal computer. Furthermore, to visualize the powder behavior inside the hopper, a video was taken simultaneously from the side and top of the hopper using a digital CCD video camera (DCR-PC109, made by SONY, Tokyo, Japan).

2.3. Experiment Conditions

In the experiment conditions, the supplied air pressure Pin was set to 0.05, 0.06, and 0.10 MPa, and the experiment was carried out while varying the closing and opening times when the solenoid value opened/closed (Vc and Vo) in the ranges of 1.0–3.0 s and 1.0–5.0 s, respectively. The powder used was class 5 fly ash powder for JIS testing, and the fly ash used here was produced at a thermal power plant using pulverized coal as the fuel, and the powder was obtained by adjusting the particle diameter distribution through classification. The average particle diameter was 22.4 μm, and the particle density was 2290 kg/m3. For the initial conditions, the inside of the hopper was filled with 1.0 kg of powder, and then compressed air was supplied from the state where the blockage occurred. Then, measurement of the powder discharge rate, airtight cavity pressure, and cavity fluid pressure was carried out while viewing the flow status in the powder layer.

3. Results

3.1. Flow Structure of the Powder Layer Inside Hopper

First, we will explain the typical flow structure of the powder layer inside a dual-structure hopper to which the air oscillation was applied. Figure 6 shows the motion of the powder layer inside the hopper, imaged using a digital CCD video camera. Images taken simultaneously from the hopper top (a) and side (b) were arranged for each time series. The experiment conditions were as follows: supplied air injection port position 40 mm (No. 1) and solenoid valve open/close timing Vc = 3.0 s and Vo = 5.0 s, respectively.
At the initial time t1, an arch formed near the hopper discharge port and the powder discharge was stopped, as shown in Figure 6b. In addition, even on the surface at the top of the hopper, there were no major changes in the power layer surface, as shown in Figure 6a. When air oscillation was applied and time t2 was reached, the arch broke down, and the powder near the hopper wall flowed toward the hopper discharge port, and, as a result, an apparent air void flowed toward the powder layer. At time t3, this air void moved further upward because the powder around the air void flowed toward the discharge port, and it can be confirmed that wrinkles appeared on the powder layer surface at the top of the hopper, as shown in Figure 6a. In addition, powder that was not completely discharged accumulated at the top part of the hopper discharge port, and a new arch was formed near the discharge port. At time t4, the air void observed at time t3 reached the surface of the powder layer and disappeared. The powder was smoothly discharged through the repetition of a phenomenon like the above.

3.2. Effects of Variation of the Supplied Air Injection Position on Powder Discharge Characteristics

Next, we examined the effect that the position of the supplied air injection port had on the powder discharge characteristics. In Figure 7, time is the horizontal axis and the discharge rate is the vertical axis. The graph shows the time variation in the powder discharge rate for the No. 1, No. 3, and No. 5 supplied air injection port positions shown in Figure 5. In addition, the solenoid valve open/close times were Vc = 3.0 s and Vo = 5.0 s. At the supplied air injection port of position No. 1, the large slope of the discharge curve was maintained simultaneously with the start of the discharge. Discharge was performed almost linearly, and all of the powder was discharged in approximately 400 s. At No. 3, in contrast, the slope of the powder discharge curve was small, and when approximately 300 s had passed, the slope of the discharge line became flat, resulting in a situation where almost no powder was discharged. Furthermore, at No. 5, there was no marked discharge from immediately after the start of the experiment. Because of the above results, we examined the position of the arch formed inside the hopper in order to investigate the reason the discharge rate changed dramatically due to changes in the position of the supplied air port, as indicated in Figure 7.
Figure 8 shows changes over time in the position of the arch formed inside the hopper. Here, the arch position is defined as the height to the top of the arch. In addition, the position of the supplied air injection port was taken to be No. 1, and as variables, there were two cases: Vc = 1.0 s and Vo = 1.0 s, and Vc = 3.0 s and Vo = 4.0 s. In addition, the measurement time was set to 10 s, and the height was calculated visually from a video taken with a digital CCD video camera. Furthermore, in the diagram, the position of No. 1 of the supplied air injection port is indicated with the red solid line. It was confirmed that the arch height varied in the range of approximately 20–80 mm as time passed. Although there were differences in the varying height of the arch formed, namely 70 mm under the Vc = 1 s and Vo = 1 s condition, and 54 mm under the Vc = 3 s and Vo = 4 s condition, the average height of the arch formed was about the same: 46.5 mm for Vc = 1.0 s and Vo = 1.0 s, and 45.3 mm for Vc = 3.0 s and Vo = 4.0 s. For the above reasons, the supplied air injection port position a No. 1 (40 mm) was closest to this arch, and could effectively break down the arch, so this was determined to be the optimal position for the supplied air the injection port. Based on this finding, the position of the supplied air injection port was fixed at No. 1 in all of the subsequent experiments.

3.3. Expansion and Contraction of Flexible Container

We looked at the changes in the expansion/contraction of the flexible container, i.e., we looked at the pressure in the airtight cavity between the rigid container and flexible container. Figure 9 shows the change over time in pressure Pa inside the airtight cavity between the rigid container and flexible container when Vc was set to 2.0 s and Vo was varied in the range 1.0–5.0 s. In addition, the time scales of each horizontal axis shown in the figure matched with the powder discharge time under each condition, and in the figure, the red solid line shows the case with no powder, and the black dashed line shows the case with powder.
First, if Vo shown in Figure 9a was 1.0 s, then the Pa amplitude value exhibited a higher value with the powder than without, and this declined little by little as time passes. In contrast, it is evident that the amplitude was almost fixed in the case with no powder. Next, if Vo shown in Figure 9b was 2.0 s, then the amplitude value of Pa exhibited almost the same variation, regardless of whether or not there was powder. On the other hand, it can be confirmed that the magnitude of the decline in amplitude of Pa due to the passage of time tended to become faster as Vo increased as shown in Figure 9c. Furthermore, if Vo increased with respect to Vc, then it is evident, as shown in Figure 9d, that the decline in the pressure amplitude value occured more quickly with powder than without.
Figure 10 shows an enlargement of the part where the decline of Pa begins in the state with no powder with Vo = 5.0 s. Images taken with the digital CCD video camera are also shown. These capture the expansion and contraction of the flexible container corresponding to the numbers listed on the pressure waveform in the figure. When a comparison was made of the expansion status of the flexible container at ①, the position before the decline in Pa, and at ③ after the decline, it was observed that the two states were almost the same, but there was a major difference in the expansion of the flexible container between position ② before the decline in Pa and position ④ after the decline in Pa. This confirmed the correspondence between the Pa pressure waveform in the diagram and the expansion/contraction of the flexible container.

3.4. Relationship between Supplied Air Pressure and Airtight Cavity Pressure in the State with No Powder

Next, an investigation was carried out of the time variation in the pressure inside the airtight cavity in response to changes in the supplied air pressure in the state with no powder. In Figure 11, the experiment conditions were fixed at Vc = 1.0 s and Vo = 5.0 s, and the supplied air pressure was varied between 0.05 (black line), 0.08 (red line), and 0.10 (blue line) MPa. The horizontal axis is time, and the vertical axis is pressure in the airtight cavity. In Figure 11, when the maximum amplitude value of pressure in the airtight cavity is 0.05 MPa, the time is about 50 s. When the pressure is 0.08 MPa, the time is about 90 s, and when the pressure is 0.10 MPa, the time is about 140 s. In all of the cases, there was a decline. Furthermore, it can be confirmed that the decline effect in the maximum amplitude value of this pressure in the airtight cavity has a tendency to appear more quickly the larger the value of the supplied air pressure. In addition, the maximum amplitude value of the pressure in the airtight cavity was about 55 MPa at 0.05 MPa, about 90 Pa at 0.08 MPa, and about 125 Pa at 0.10 MPa, and thus it was found that the higher the value of the supplied air pressure, the greater the maximum amplitude value of the pressure in the airtight cavity. At the same time, it was confirmed that there was a variation in the maximum amplitude value of pressure in the airtight cavity, i.e., in the expansion limit value of the flexible container.

3.5. Time Variation in Powder Discharge Rate, Airtight Cavity Pressure, and Cavity Fluid Pressure

We examined the time variation in the powder discharge rate Mp, airtight cavity pressure Pa, and cavity fluid pressure Pp in the state with powder when Vc was 2.0 s, and Vo was 1.0 s or 3.0 s. These results are shown in Figure 12 and Figure 13. In addition, in these graphs, the horizontal axis is time, and the vertical axes are the powder discharge rate (black line), airtight cavity pressure (red line), and cavity fluid pressure (blue line).
First, with Vo = 1.0 s, as shown in Figure 12a, an impetus was applied to the powder layer in the hopper in accordance with the repeated changes in the expansion and contraction of the flexible container, and thus it is evident that large positive and negative fluctuations also appeared in the cavity fluid pressure Pp of the powder layer. In addition, a large decline was not evident in the amplitude value of the airtight cavity pressure Pa, and thus discharge occurred while maintaining a constant slope of the discharge curve. On the other hand, when Vo in Figure 12b was 3.0 s, the cavity fluid pressure in the powder layer repeatedly exhibited the same changes as when Vo was 1.0 s, but the Pa amplitude value declined greatly from 100 Pa to 50 Pa, starting around 130 s. An enlargement of this region is shown in Figure 13. As shown in the figure, at around the point where the decline in Pa started, expansion of the flexible container became smaller, and the force exerted by the flexible container on the powder layer decreased, and thus it is confirmed from this diagram that the slope of the powder discharge curve was smaller from around this point.

3.6. Relationship with Pressure Amplitude Value Inside the Airtight Cavity Relative to the Solenoid Valve Open/Close Timing

We examined the variation over time in the pressure amplitude value inside the airtight cavity relative to the solenoid valve open/close timing. Figure 14 shows the time variation of the pressure in the airtight cavity when Vc = 2.0 s and Vo = 5.0 s. In the graph, the red solid line indicates the case without powder, and the black dashed line indicates the case with powder. In this research, in order to clarify the relationship with the pressure amplitude value relative to the solenoid valve open/close timing, we focused on the pressure curve in the state with powder, as shown in Figure 14, and defined the pressure amplitude value prior to the decline to be ΔP1, and the time when the decline occurred to be t1. Based on this definition, Figure 15 shows the changes in ΔP1 and t1 resulting from the changes in the solenoid valve open/close timing.
In Figure 15, the overall trend was toward smaller t1 and larger ΔP1 for each Vc with increasing Vo. However, the maximum value of ΔP1 approached the expansion limit of the flexible container at approximately 125 Pa, and therefore it was confirmed that the value of ΔP1 did not increase higher than this.
The above showed that changes in the expansion/contraction of the flexible container due to air oscillation were determined by the balance of the injected amount of air and the discharged amount of air, and that the values of ΔP1 and t1 were major factors for providing a large impetus to the powder layer.

3.7. Relationship between Solenoid Valve Open/Close Timing and Powder Discharge Rate

Figure 16 shows the relationship of the powder discharge amount per unit time relative to the solenoid opening time Vo. As the variable, the solenoid valve closing time Vc was varied in the range 1.0–3.0 s. Overall, the discharge amount per unit time increased with increasing Vo, but when Vo approached 3.0 s, a trend was evident where there was little change in the discharge rate, m. This is because the flexible container of the hopper used in this experiment had an expansion limit, and when that limit, at a supplied air press of 0.10 MPa, was converted to airtight cavity pressure, the value became 125 Pa. In the following graph, the vertical axis is the pressure amplitude value before decline ΔP1, and the horizontal axis is the time when the decline occurs t1. The value of the pressure amplitude value before the decline ΔP1 is shown on the vertical axis for the solenoid valve open/close timing condition. In addition, the red dotted line in the graph shows the expansion limit of the flexible container. This graph shows that, near where the pressure inside the airtight cavity Pa was Vo = 3.0 s, there was convergence to 125 Pa, the expansion limit value of the flexible container. In addition, the value of the pressure inside the airtight cavity Pa is related directly to how the flexible container expands, and thus the fact that the flexible container does not expand beyond this means that the force pushing the powder layer outward cannot be applied beyond this, and thus it is likely that the discharge efficiency will not improve, and the discharge amount per unit time m did not change very much beyond the point where Vo = 3.0 s. For changes in Vc, there was a tendency for m to increase with smaller Vc under conditions with Vo = 1.0 or 2.0 s, and Vc = 1.0, 2.0, or 3.0 s. The reason for this is that, under conditions with Vo=1.0 or 2.0 s, the time for supplying compressed air is short, and thus it is evident that the value of the pressure in the airtight cavity Pa did not approach convergence. Therefore, under conditions where the time compressed air was not supplied was longer than the time compressed air was supplied, the number of expansions of the flexible container decreased and the effect on the powder layer became smaller, and thus it is likely that a trend was evident where m increased with a smaller Vc under conditions where Vo = 1.0 or 2.0 s, and Vc = 1.0, 2.0, or 3.0 s.

4. Conclusions

The following findings were obtained as a result of examining the effects on the hopper’s internal flow structure, cavity fluid pressure, airtight cavity internal pressure, and powder discharge rate when a semi-conical dual-structure hopper was used, and the supplied air injection port position and solenoid valve open/close timing were varied.
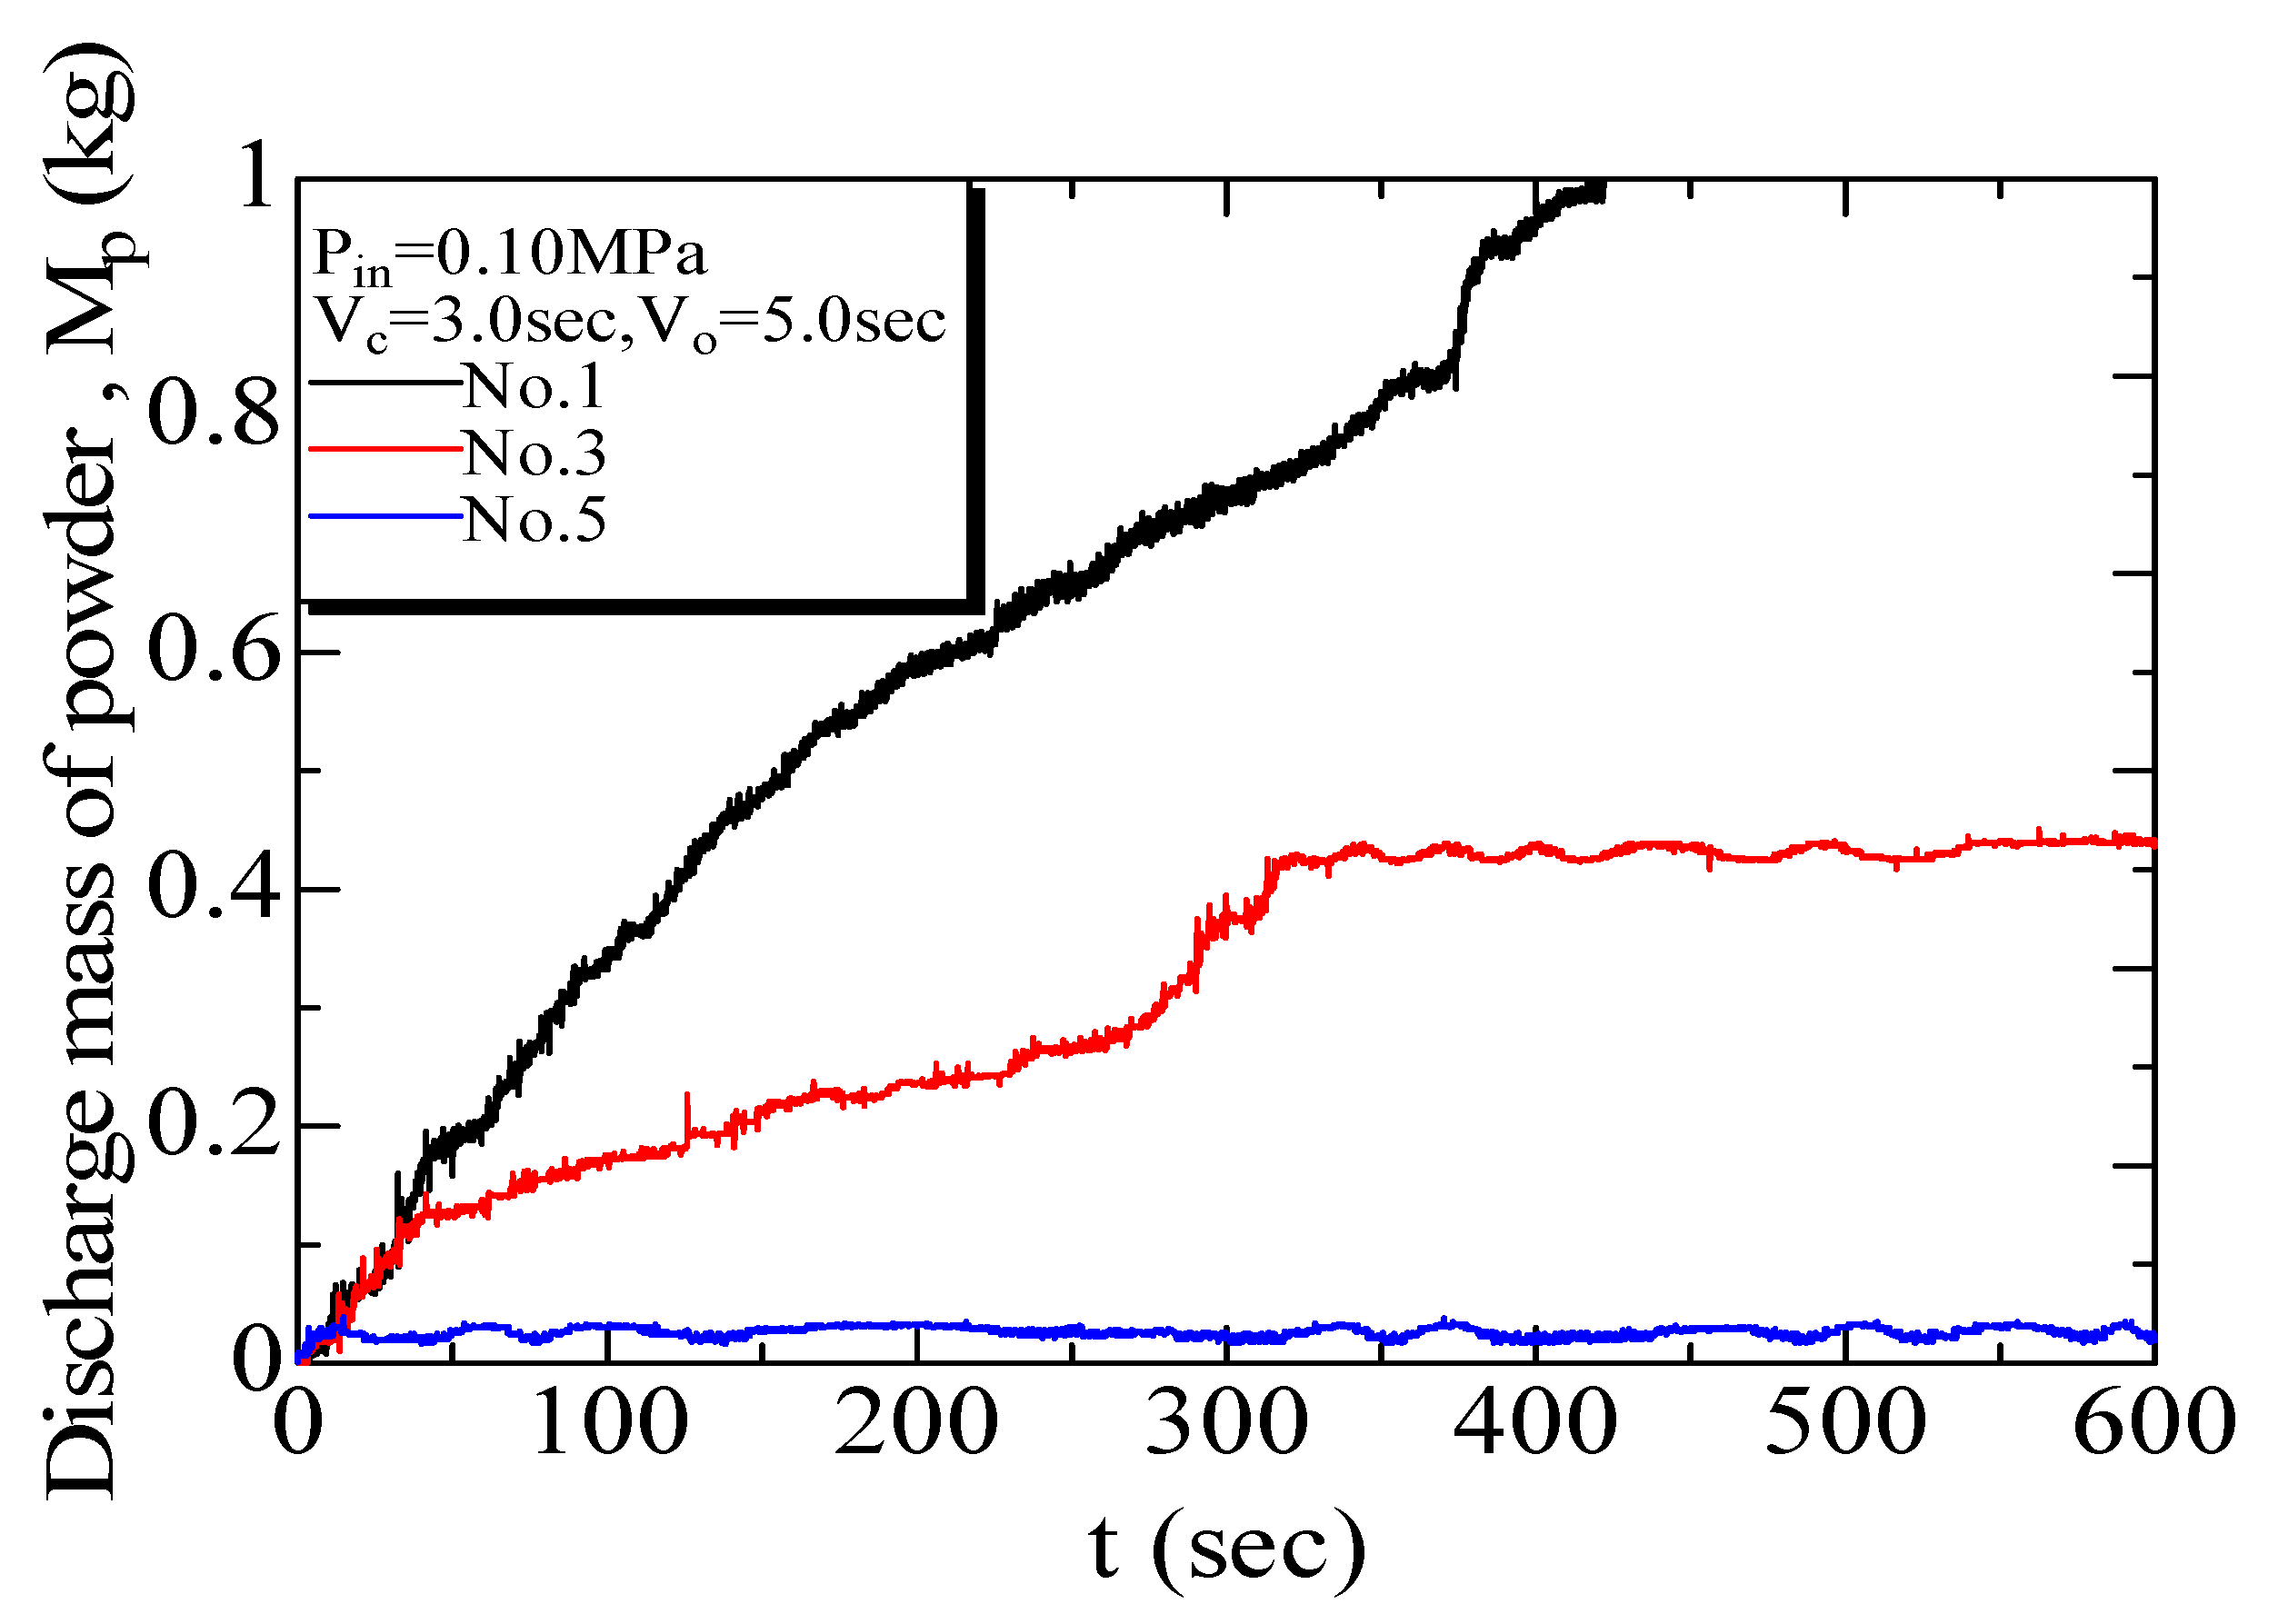
It was confirmed that the position of the supplied air injection port had a major effect on the breakdown of arches that formed near the hopper discharge port, and that there was an appropriate pressure supply port position.
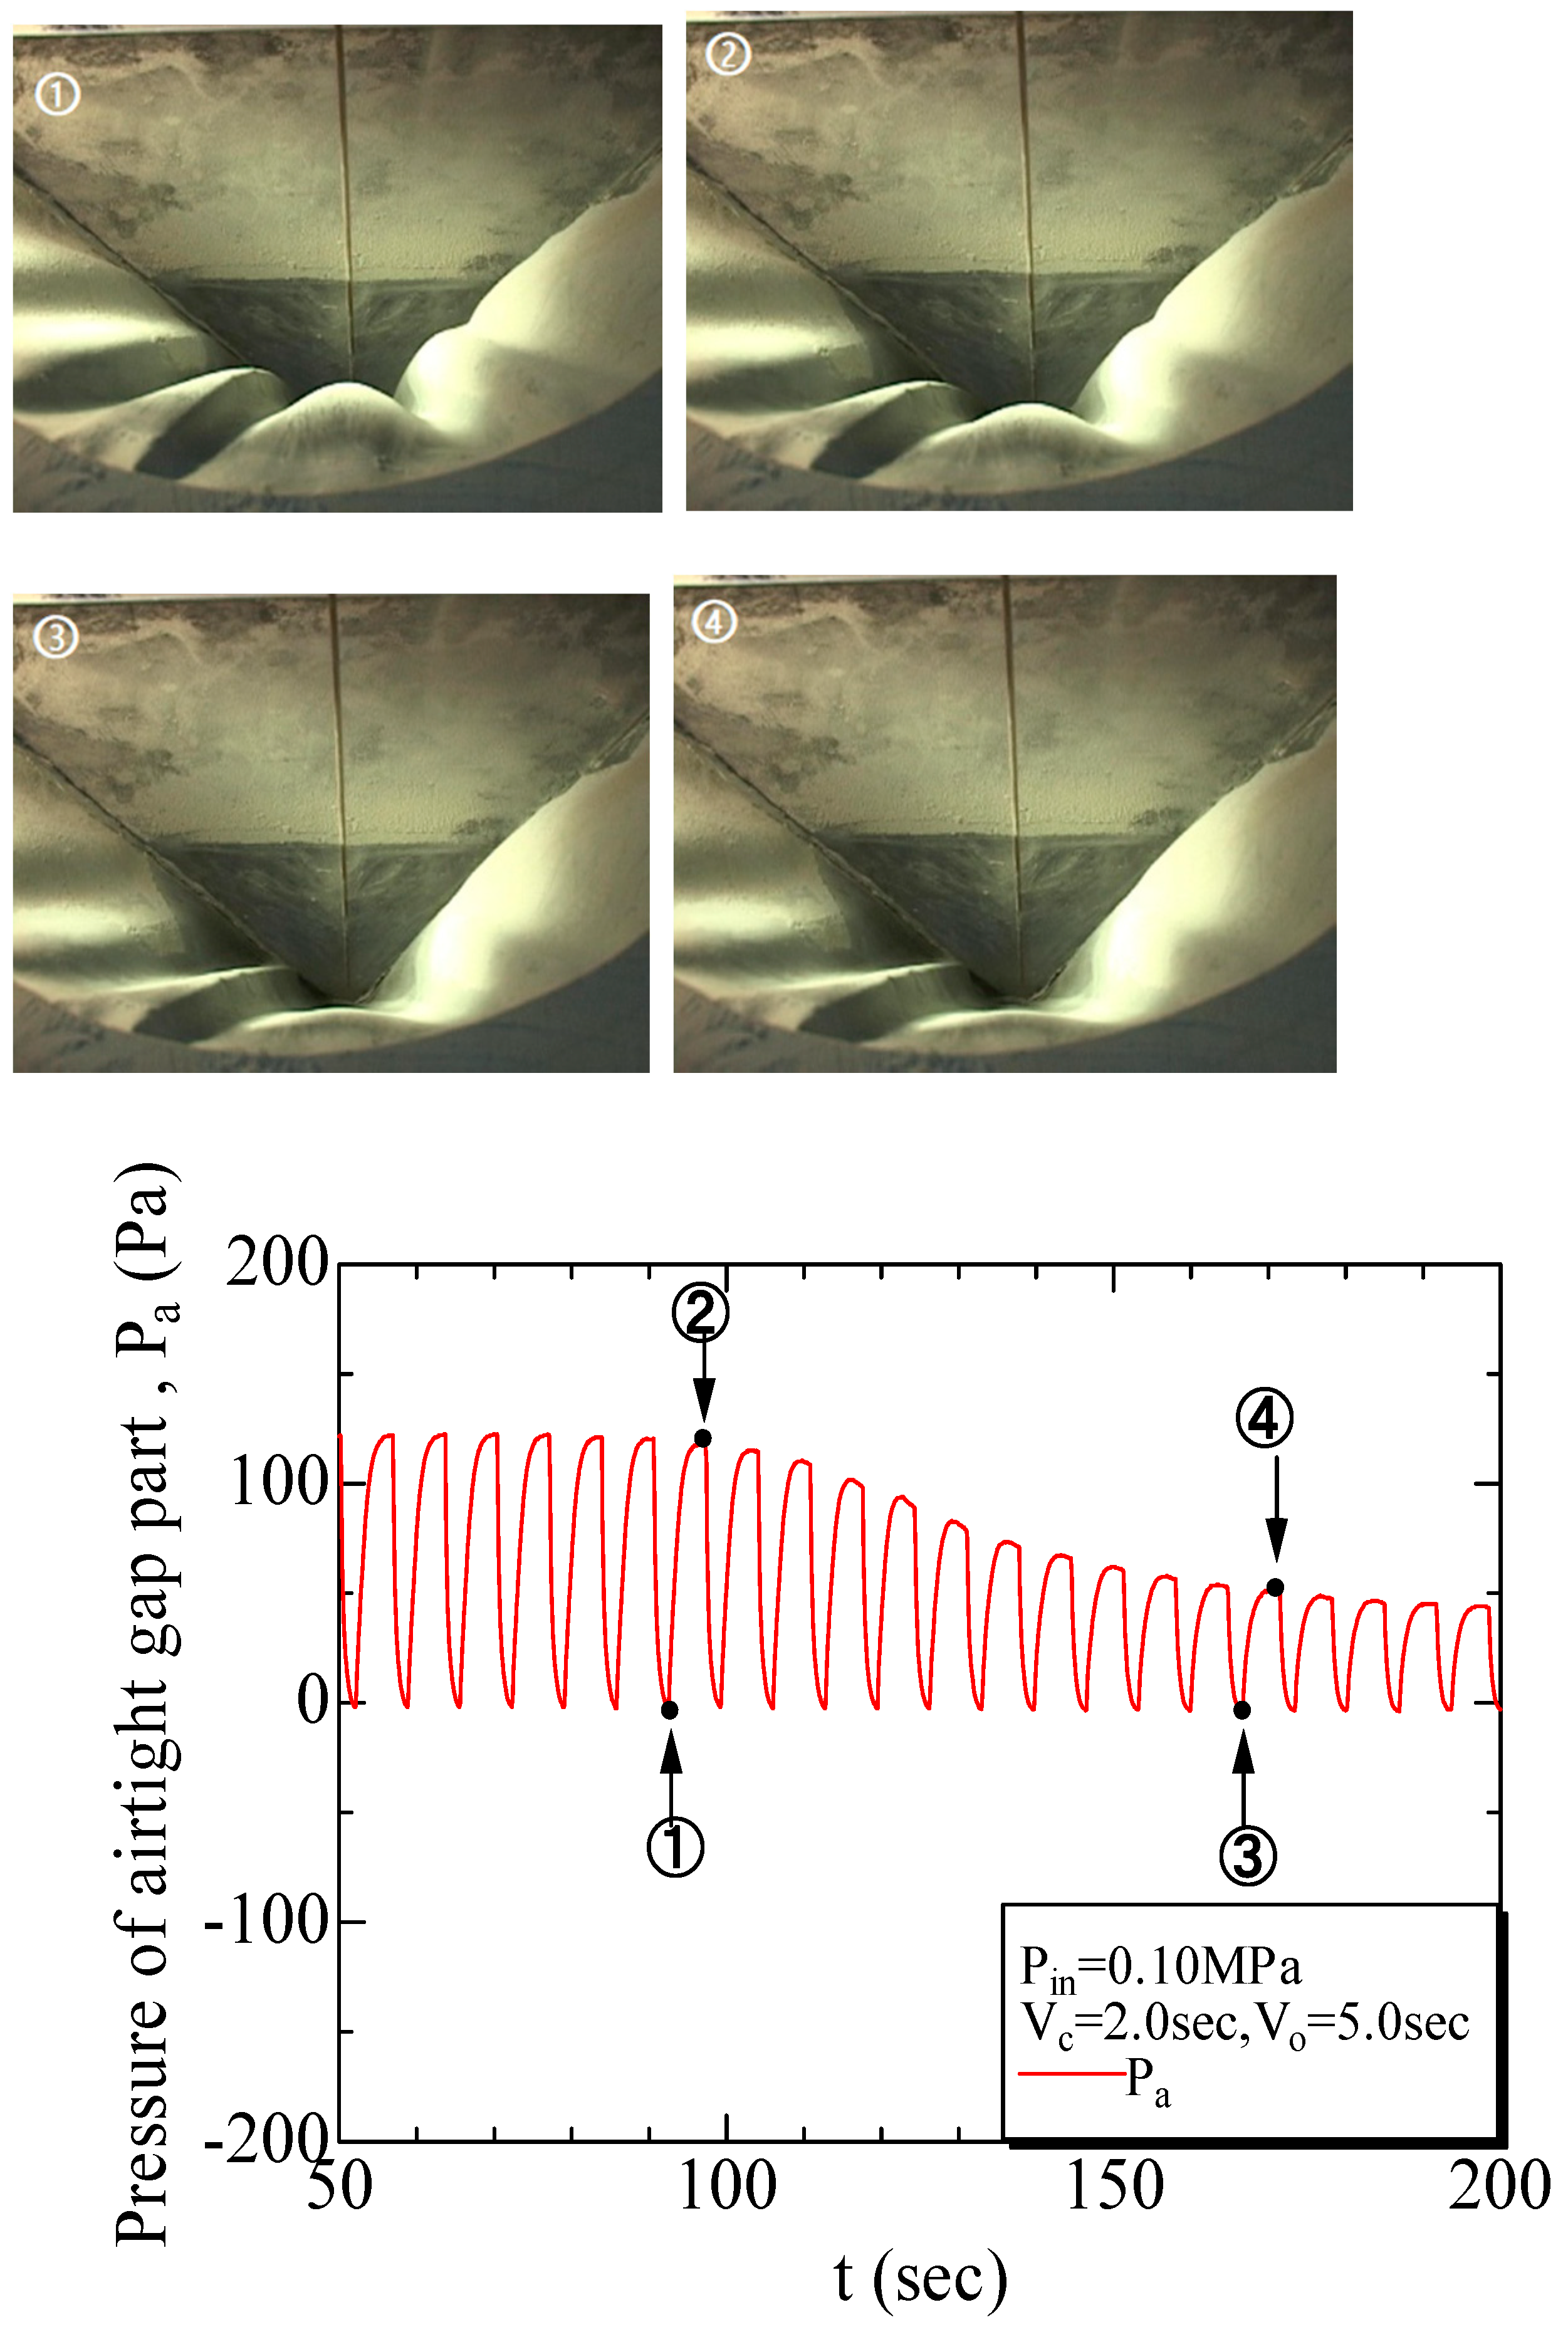
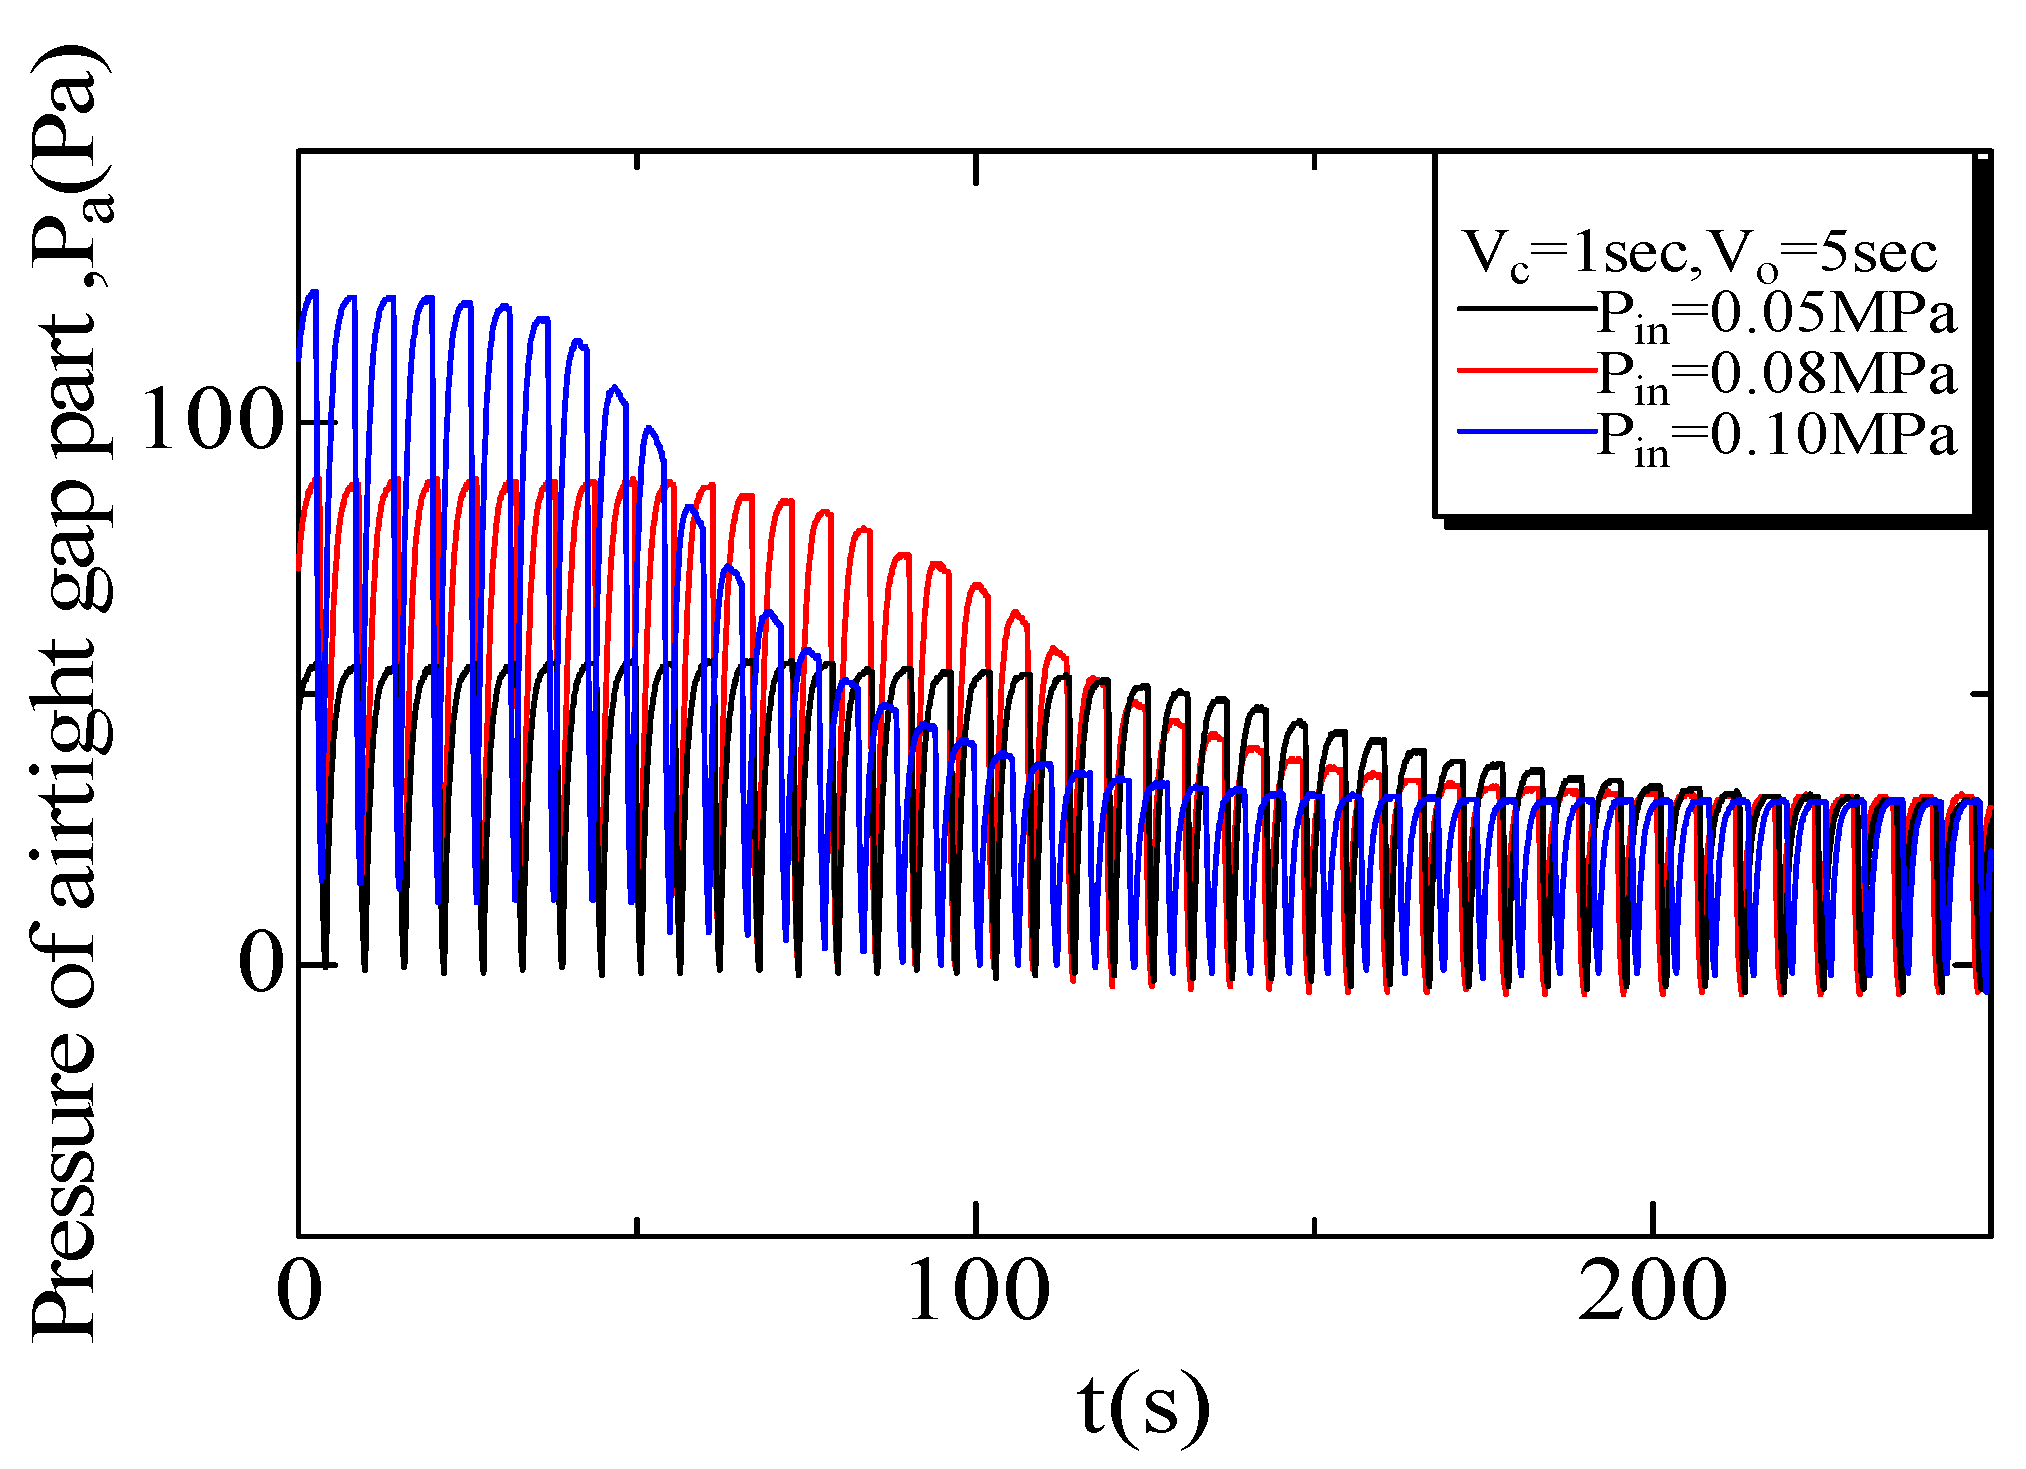
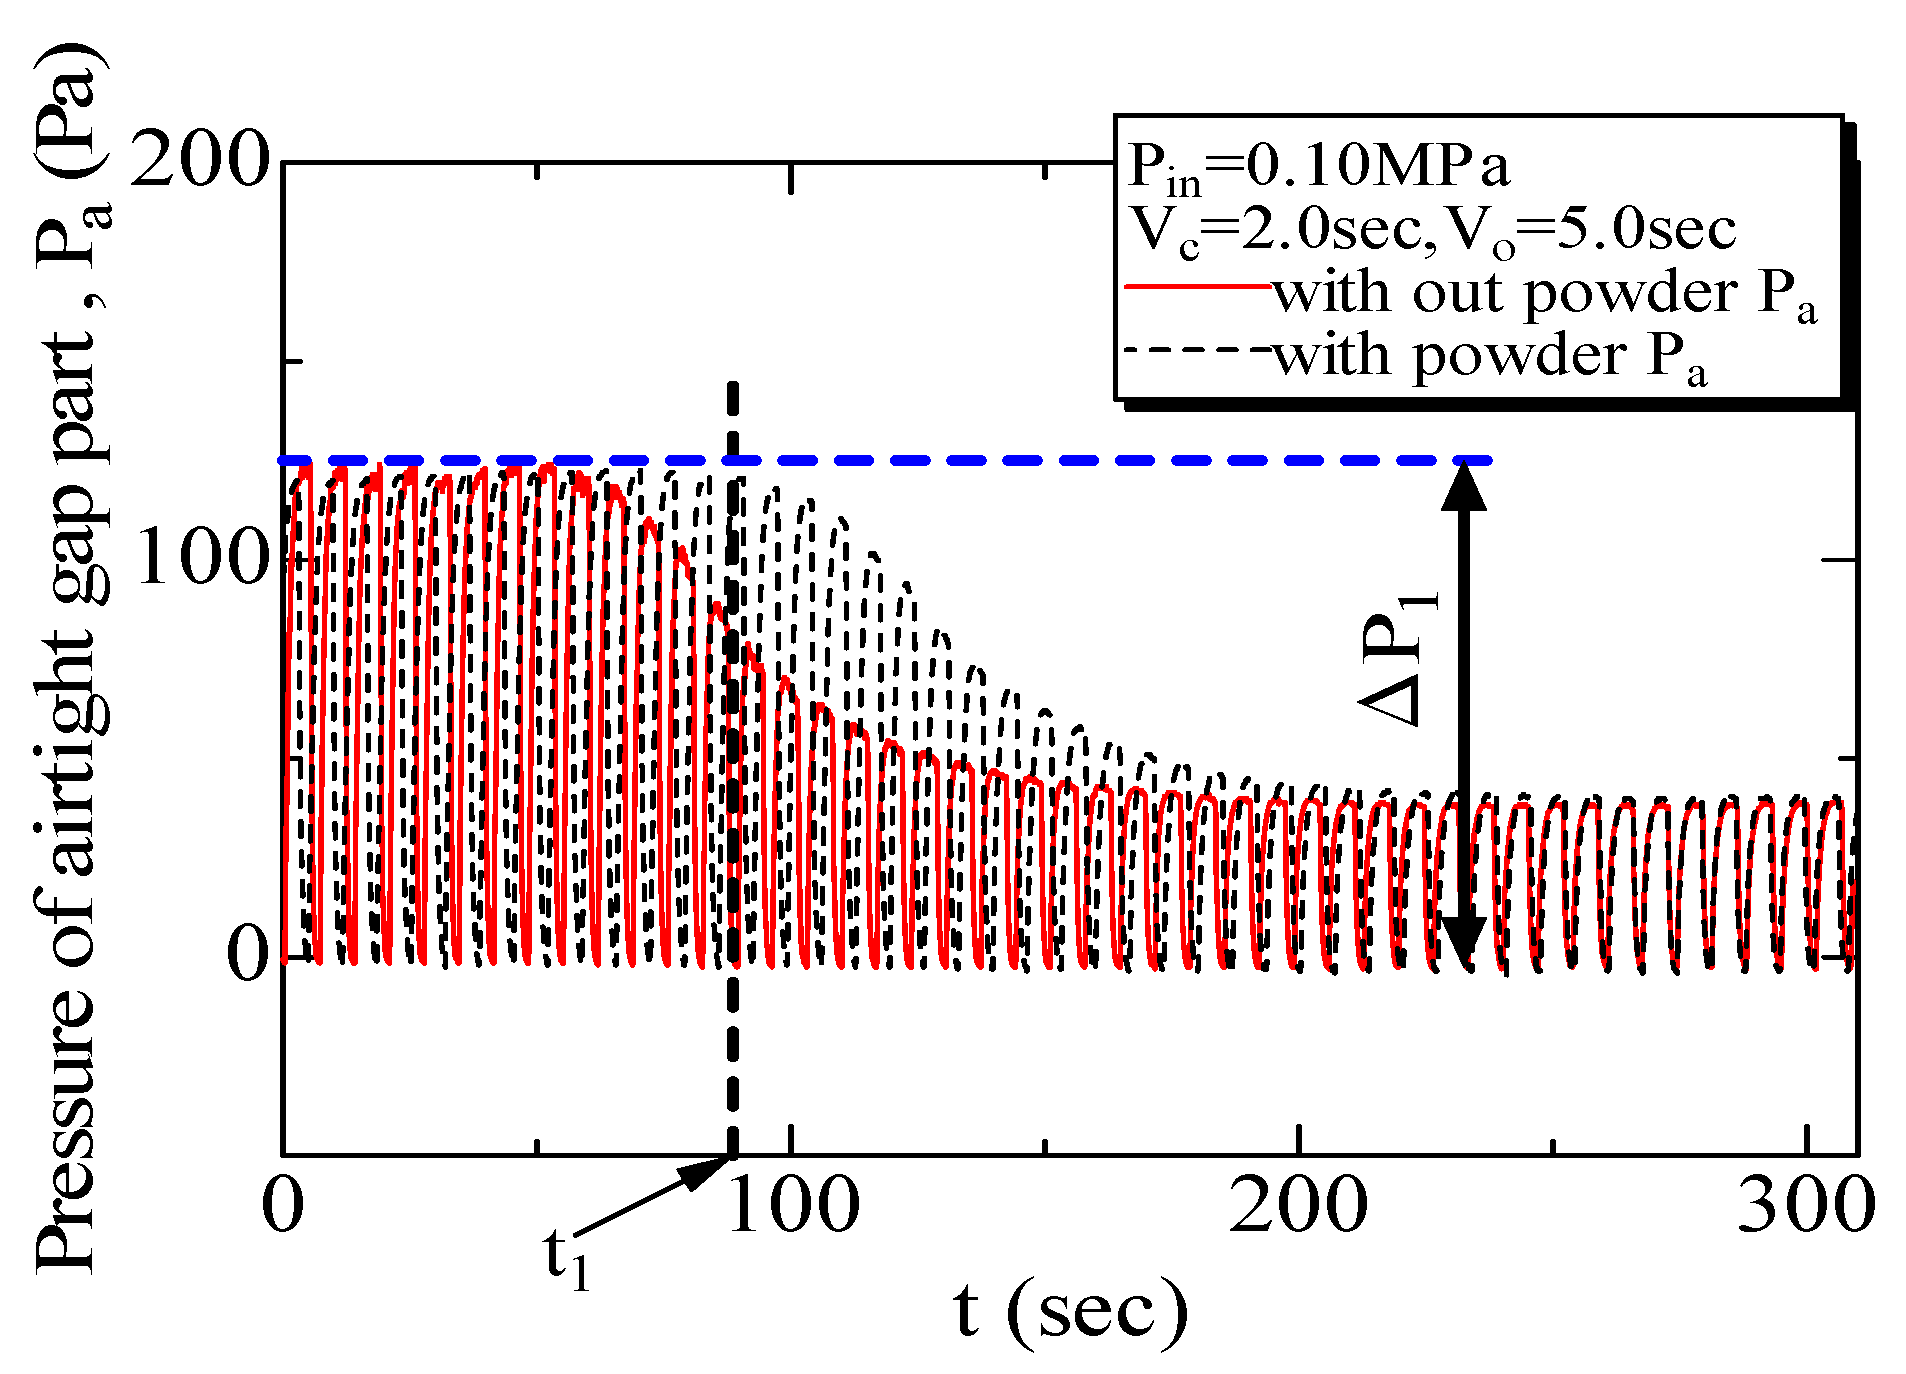
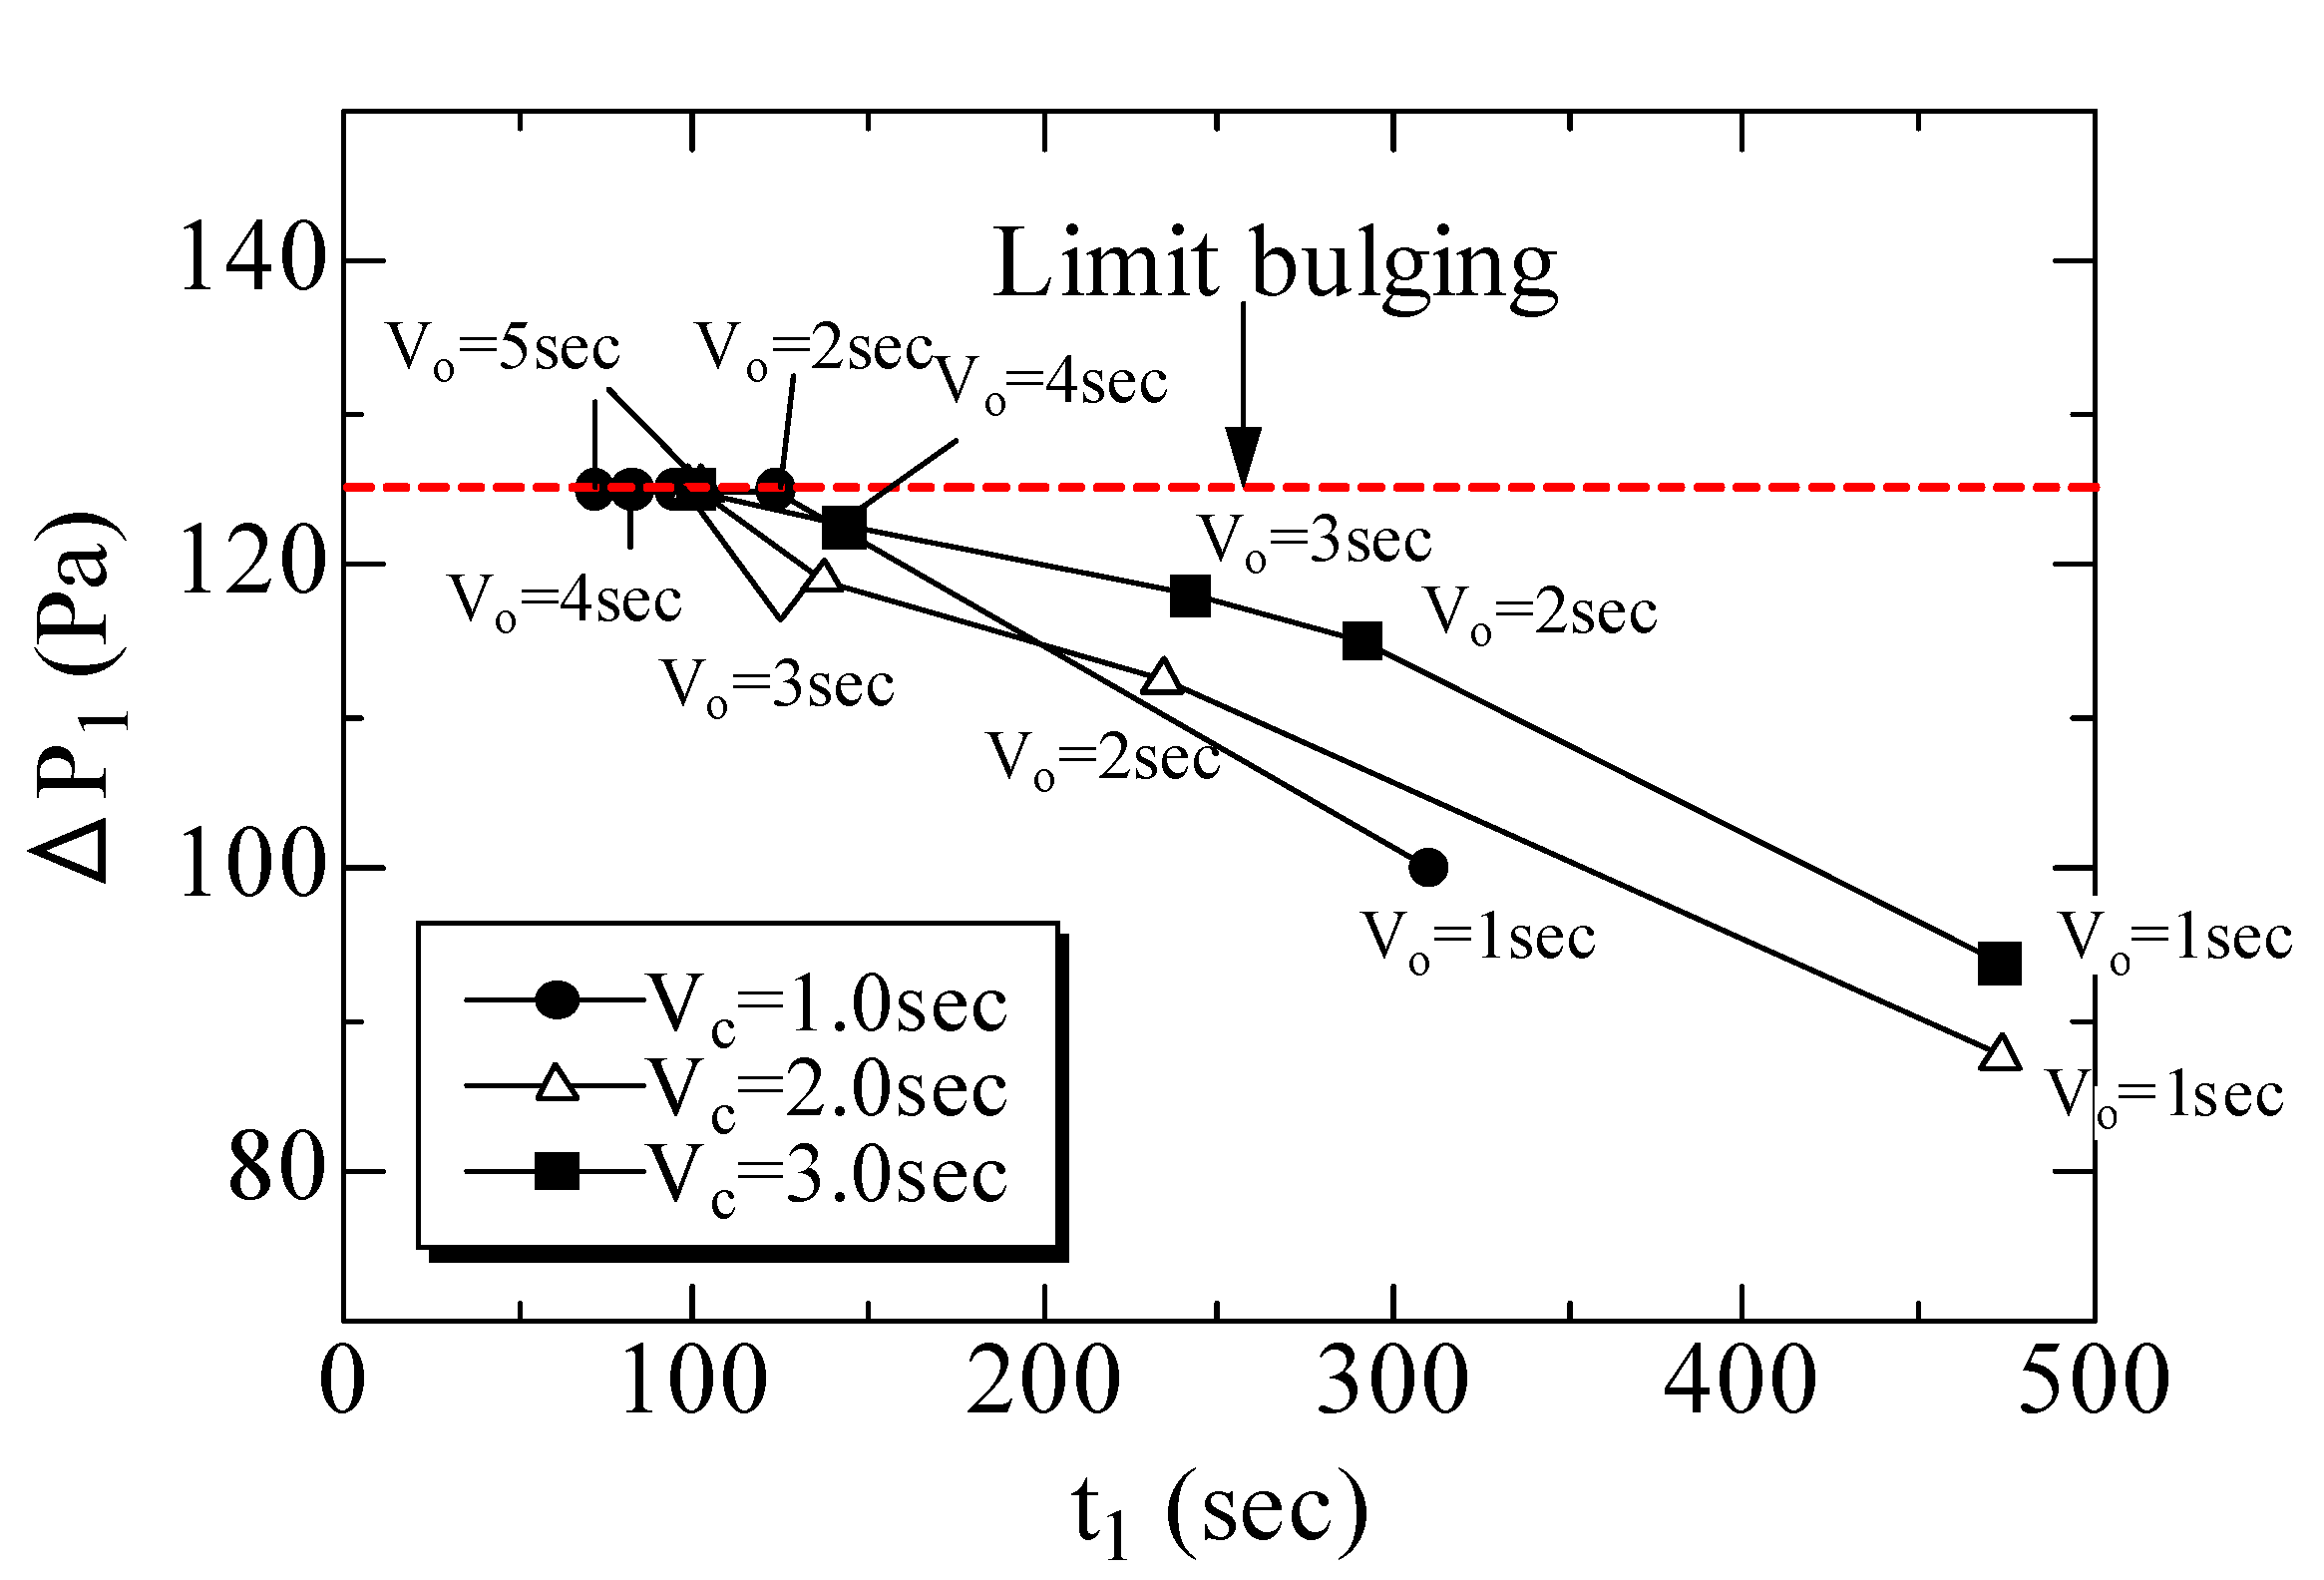
It was confirmed that the maximum amplitude value of the pressure in the airtight cavity, i.e., the expansion limit value of the flexible container, varied depending on the supplied air pressure condition.
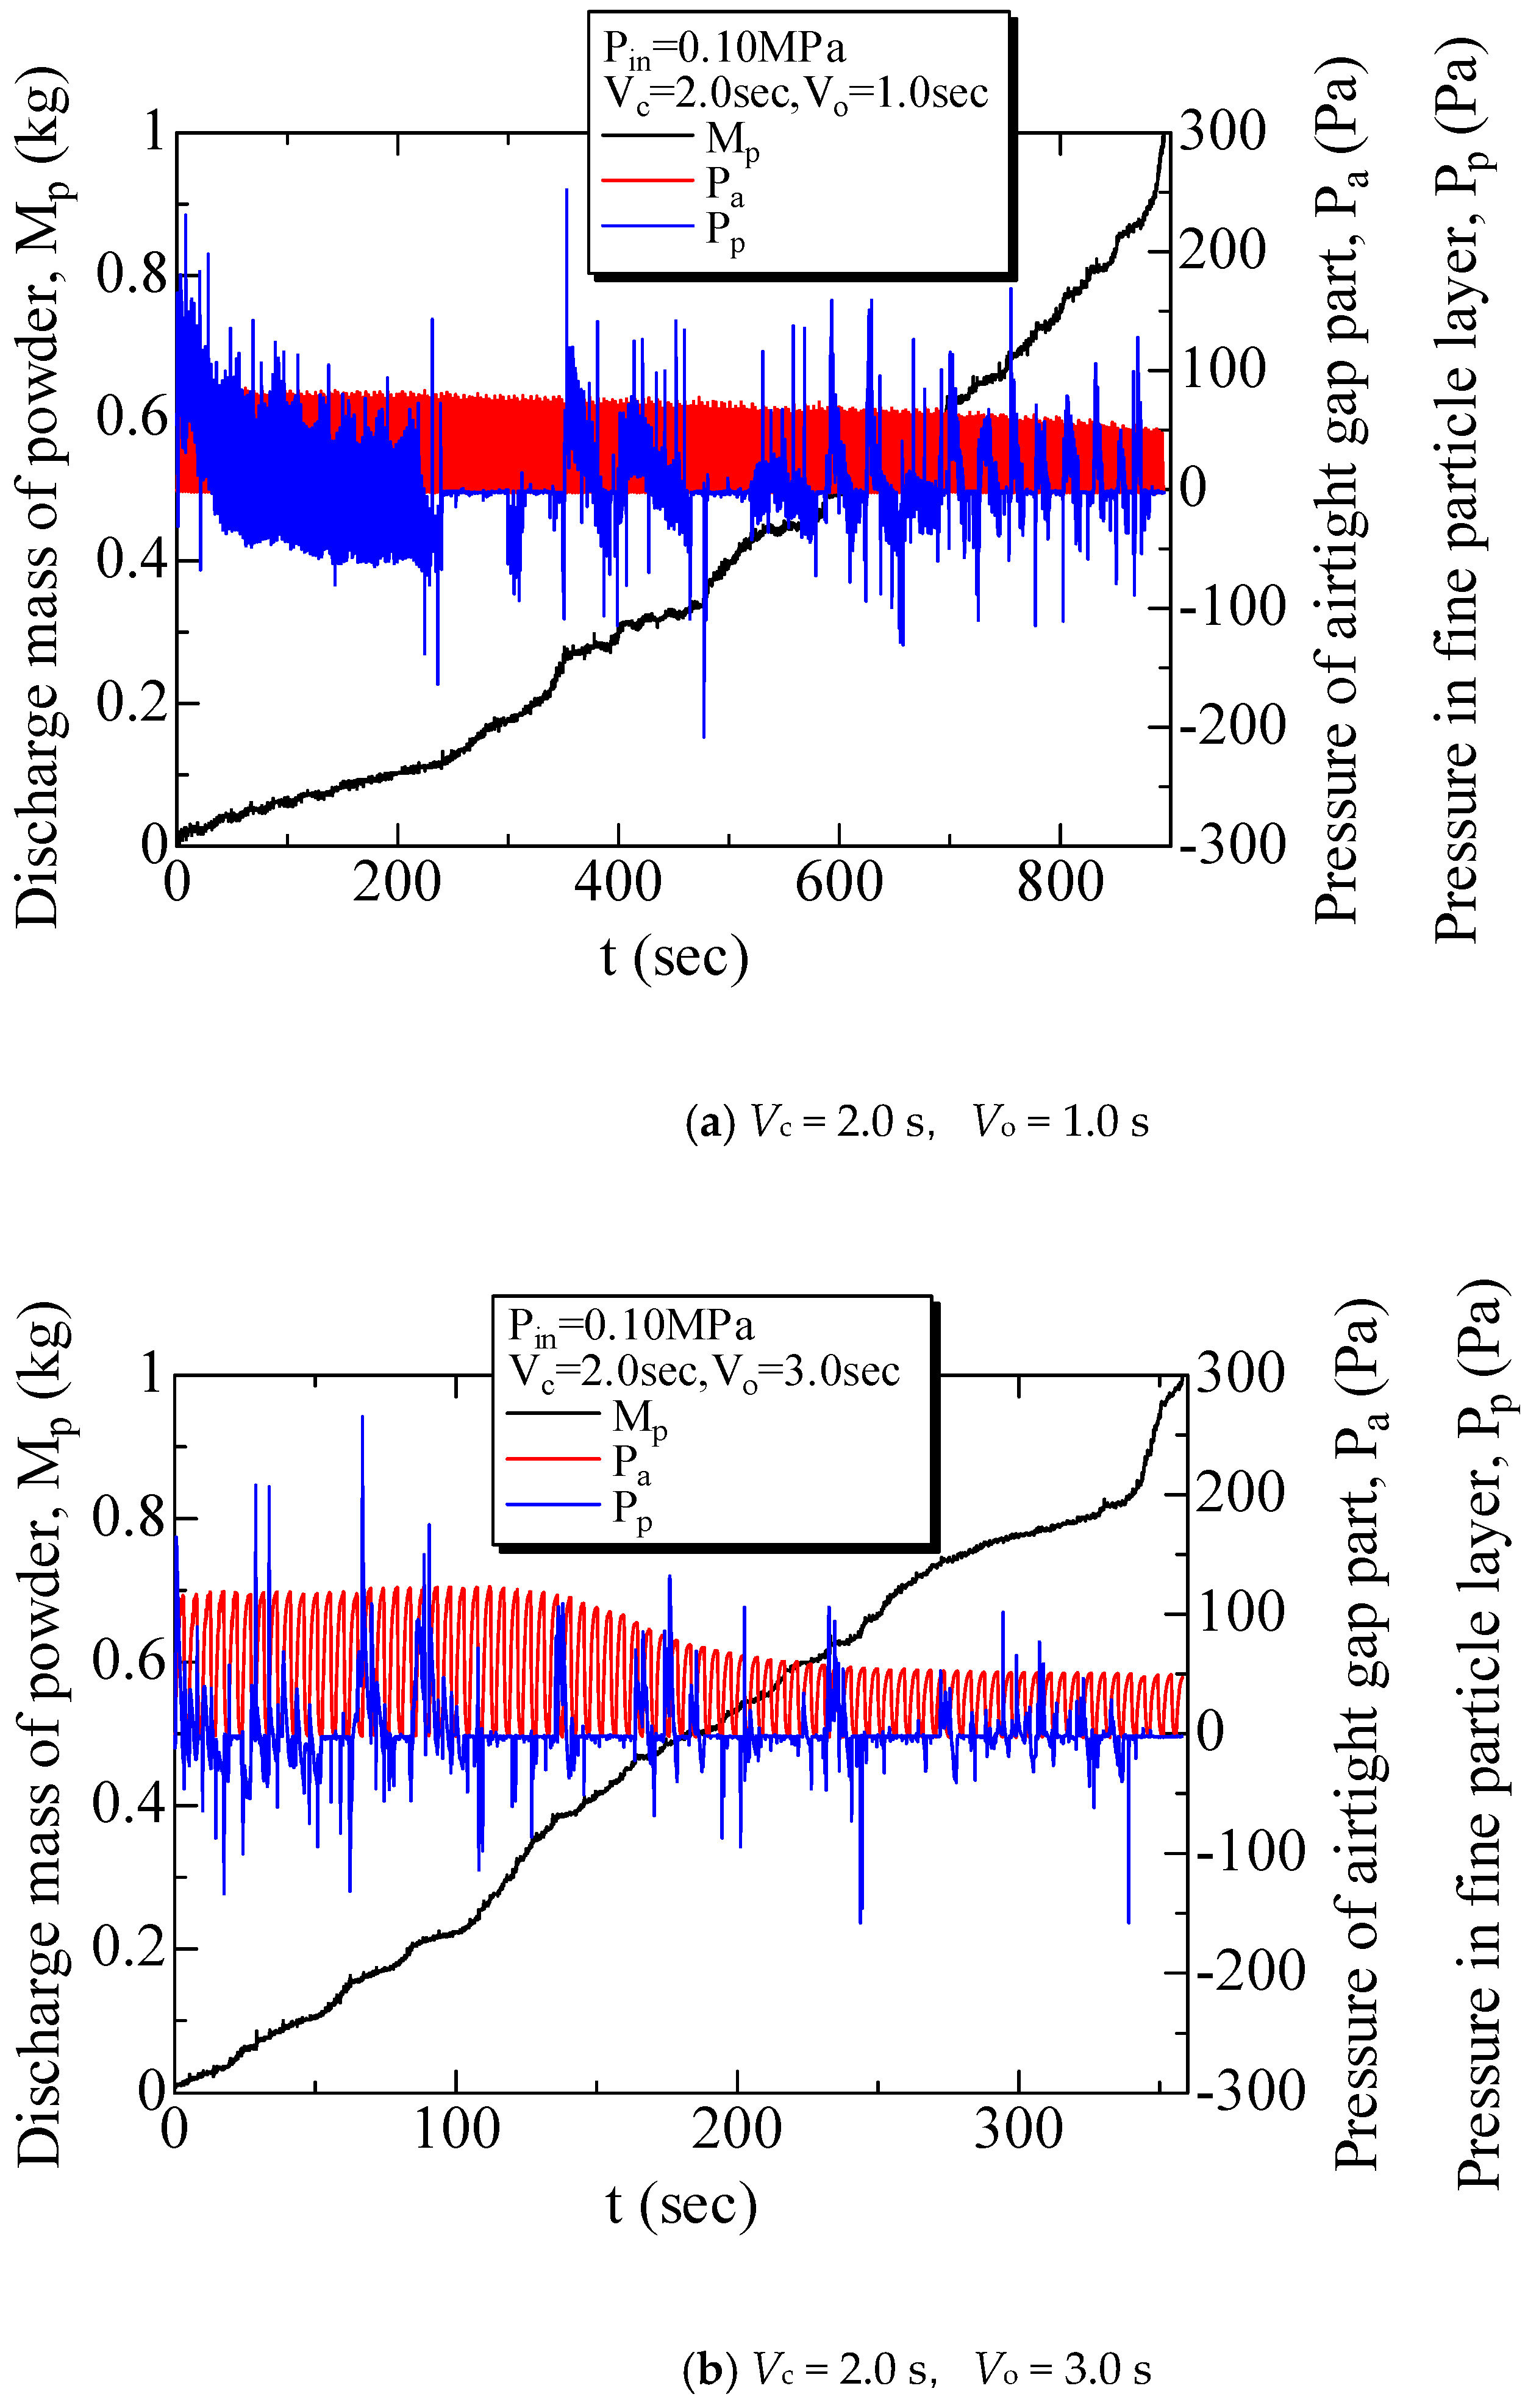
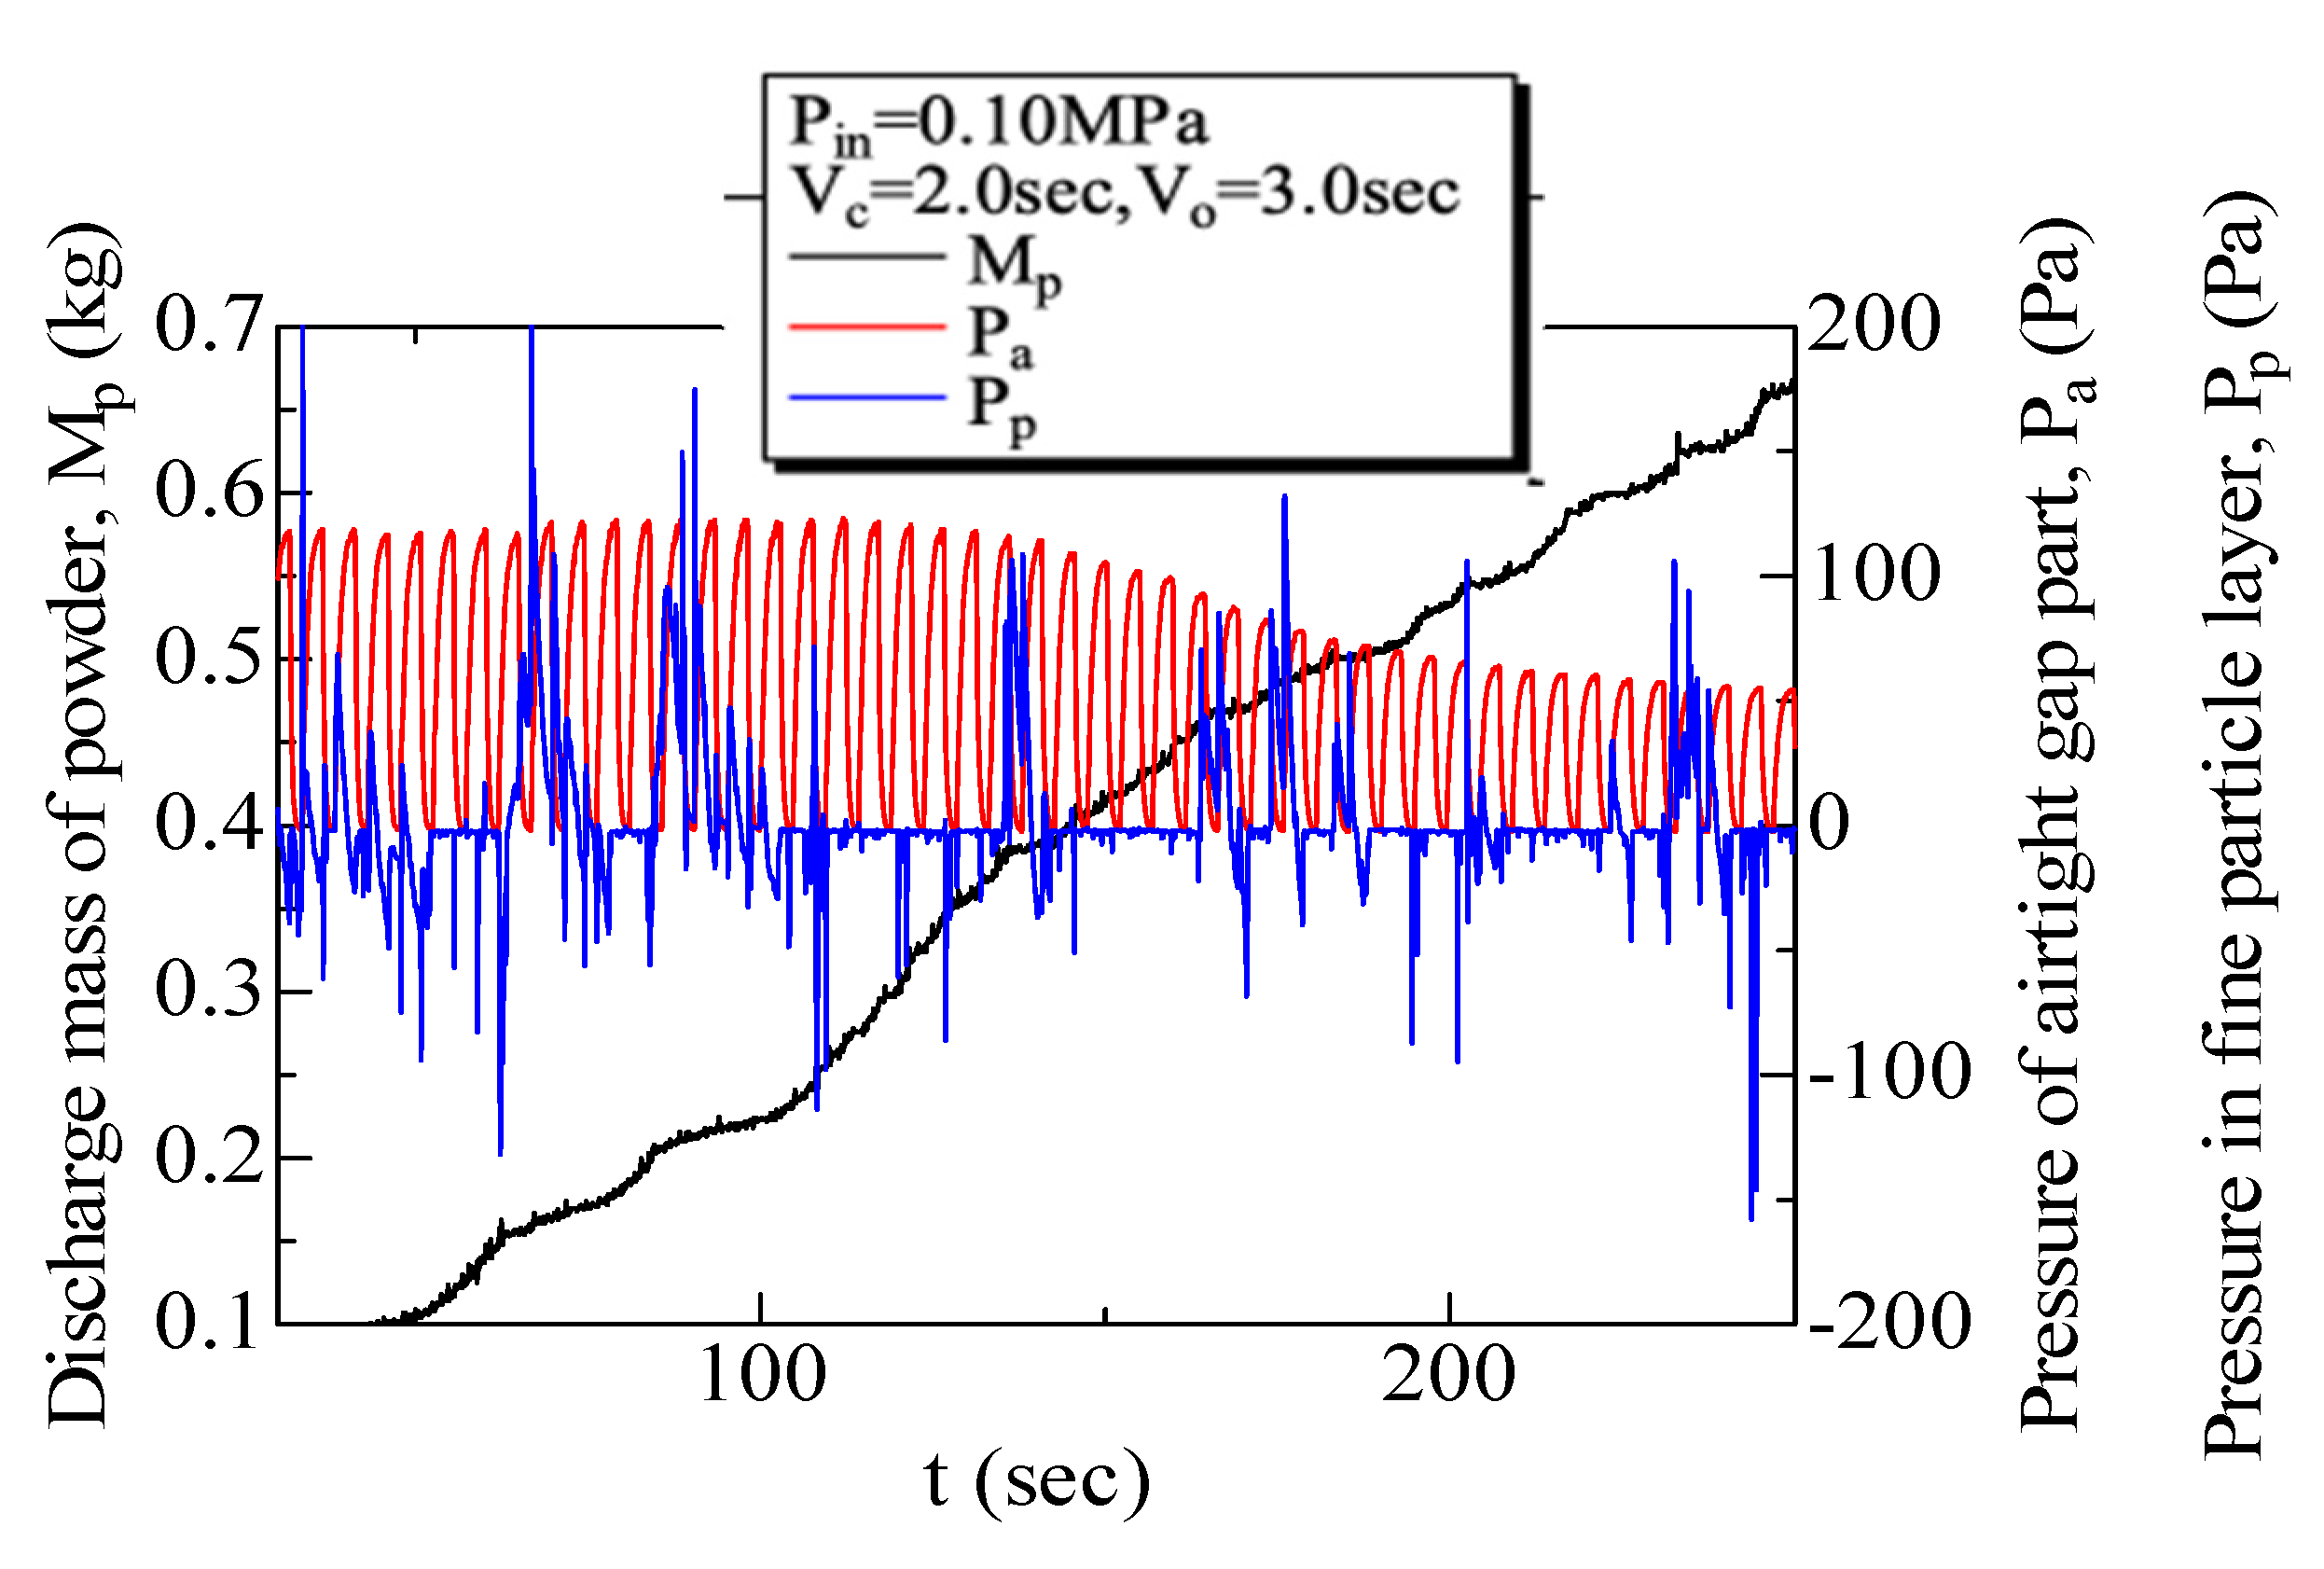
Changes in the expansion/contraction of the flexible container due to air oscillation were determined by the balance of the injected amount of air and the discharged amount of air, and did not have much effect on the presence of powder. In addition, the value of pressure in the airtight cavity was directly related to the variation in the expansion/contraction of the flexible container, and thus it was thought that the powder was discharged more efficiently under solenoid valve open/close timing conditions where the maximum amplitude value of pressure in this airtight cavity could be kept at a high constant level.

Author Contributions

Conceptualization and methodology, H.K. and K.O.; formal analysis, validations, investigations, and data curation: H.K. and K.K.; writing—original draft preparation and visualization, H.K.; writing—review and editing, supervision, and project administration, H.K. All authors have read and agreed to the published version of the manuscript.

Funding

This research received no external funding.

Data Availability Statement

Not applicable.

Conflicts of Interest

The authors declare no conflict of interest.

References

  1. Miwa, S. Funtai Kougaku Tsuuron; Nikkan Kogyo: Tokyo, Japan, 1998; pp. 121–149. [Google Scholar]
  2. Funtai Kougaku Henshuuin, Funtai Kougaku Binran Dainihan; Nikkan Kogyo: Tokyo, Japan, 1998; pp. 344–349.
  3. Tomita, Y. Gijyutsu notameno Funtai Handoringu Gijyutsu. Kagaku Souchi 1999, 41, 23–36. [Google Scholar]
  4. Bideau, D.; Hansen, A. Disorder and Granular Media; Elsevier: Amsterdam, The Netherlands, 1993; pp. 1–323. [Google Scholar]
  5. Wu, X.; Måløy, K.J.; Hansen, A.; Ammi, M.; Bideau, D. Why hour glasses tick. Phys. Rev. Lett. 1993, 71, 1363. [Google Scholar] [CrossRef] [PubMed]
  6. Janda, A.; Harich, R.; Zuriguel, I.; Maza, D.; Cixous, P.; Garcimartin, A. Flow rate fluctuations in the outpouring of grains from a two-dimensional silo. Phys. Rev. 2009, 791, 031302. [Google Scholar] [CrossRef] [PubMed] [Green Version]
  7. Pennec, T.L.; Måløy, K.J.; Ammi, H.A.M.; Bideau, D.; Wu, X.-L. Ticking hour glasses: Experiments analysis of intermittent flow. Phys. Rev. 1996, 53, 2257–2264. [Google Scholar] [CrossRef]
  8. Lu, H.; Zhong, J.; Zurguel, I.; Cao, G.P.; Liu, H.F. Gravitational discharge of fine dry powder with asperities from a conical hopper. AICHE J. 2018, 64, 427–436. [Google Scholar] [CrossRef]
  9. Huang, W.J.; Gong, X.; Guo, X.L.; Dai, Z.H.; Liu, H.F.; Zheng, L.J.; Zhao, J.C.; Xiong, Y.J. Discharge characteristics of cohesive fine coal from aerated hopper. Powder Technol. 2009, 194, 126–131. [Google Scholar] [CrossRef]
  10. Hsiau, S.S.; Liao, C.C.; Lee, J.H. The discharge of fine silica sands in a silo under different ambient air pressure. Phys. Fluids 2012, 24, 043301. [Google Scholar] [CrossRef]
  11. Hsiau, S.S.; Hsu, C.C.; Smid, J. The discharge of fine silica sands in a silo. Phys. Fluids 2010, 22, 043306. [Google Scholar] [CrossRef]
  12. Sheng, L.T.; Hsiau, S.S.; Wen, C.Y. Experimental investigation on air bubble dynamics during fine powder discharge in a silo. Adv. Powder Technol. 2021, 32, 106–120. [Google Scholar] [CrossRef]
  13. Kawahara, H.; Hirozane, T.; Ogata, K. Discharge characteristics of powder from cone dual structure hopper using air vibration. J. Soc. Powder Technol. 2010, 47, 206–213. [Google Scholar] [CrossRef] [Green Version]
  14. Kawahara, H.; Nakamura, S.; Ogata, K. Characteristics of powder flow and interstitial air pressure in dual structure hopper using air vibration. J. Soc. Powder Technol. 2010, 47, 697–706. [Google Scholar] [CrossRef]
Figure 1. Flow structure in the hopper: (a) Funnel flow and (b) rat hole.
Fluids 06 00276 g001
Figure 2. Arch in hopper.
Fluids 06 00276 g002
Figure 3. Powder discharge by the dual structure hopper.
Fluids 06 00276 g003
Figure 4. Experimental apparatus.
Fluids 06 00276 g004
Figure 5. Position of supply air part.
Fluids 06 00276 g005
Figure 6. Flow structure of the fly ash powder in the dual structure hopper.
Fluids 06 00276 g006
Figure 7. Relation between position of the supply air port and discharge mass of the powder.
Fluids 06 00276 g007
Figure 8. Time variation of the position of arch: (a) Graph and (b) Photograph.
Fluids 06 00276 g008
Figure 9. Time variation of the pressure of airtight space (expansion and contraction of the flexible container).
Fluids 06 00276 g009
Figure 10. Expansion and contraction of the flexible container by air vibration.
Fluids 06 00276 g010
Figure 11. Time histories of pressure in the airtight gap due to change of supply air pressure.
Fluids 06 00276 g011
Figure 12. Time histories of the discharge mass of powder Mp, the interstitial air pressure of powder bed Pp, and the pressure in the airtight space Pa.
Fluids 06 00276 g012
Figure 13. Time histories of the discharge mass of powder Mp, the interstitial air pressure of powder bed Pp, and the pressure in the airtight space Pa in 30 s to 250 s.
Fluids 06 00276 g013
Figure 14. Time histories of pressure of airtight space of the flexible container at VC = 2.0 s and V0 = 5.0 s.
Fluids 06 00276 g014
Figure 15. Time histories of the pressure difference ΔP1 of the airtight space of the flexible container.
Fluids 06 00276 g015
Figure 16. Relationship between discharge per unit of time and frequency.
Fluids 06 00276 g016
Publisher’s Note: MDPI stays neutral with regard to jurisdictional claims in published maps and institutional affiliations.

