Article

Energy Saving and Charging Discharging Characteristics of Multiple PCMs Subjected to Internal Air Flow

Department of Mechanical Power Engineering, Engineering Technical College-Baghdad, Middle Technical University, Baghdad 53172, Iraq
Fluids 2021, 6(8), 275; https://doi.org/10.3390/fluids6080275
Submission received: 5 July 2021 / Revised: 2 August 2021 / Accepted: 2 August 2021 / Published: 6 August 2021
(This article belongs to the Special Issue Heat Transfer and Fluid Dynamics in Energy Systems)

Abstract

:
One essential utilization of phase change materials as energy storage materials is energy saving and temperature control in air conditioning and indirect solar air drying systems. This study presents an experimental investigation evaluating the characteristics and energy savings of multiple phase change materials subjected to internal flow in an air heating system during charging and discharging cycles. The experimental tests were conducted using a test rig consisting of two main parts, an air supply duct and a room model equipped with phase change materials (PCMs) placed in rectangular aluminum panels. Analysis of the results was based on three test cases: PCM1 (Paraffin wax) placed in the air duct was used alone in the first case; PCM2 (RT–42) placed in the room model was used alone in the second case; and in the third case, the two PCMs (PCM1 and PCM2) were used at the same time. The results revealed a significant improvement in the energy savings and room model temperature control for the air heating system incorporated with multiple PCMs compared with that of a single PCM. Complete melting during the charging cycle occurred at temperatures in the range of 57–60 °C for PCM1 and 38–43 °C for PCM2, respectively, thereby validating the reported PCMs’ melting–solidification results. Multiple PCMs maintained the room air temperature at the desired range of 35–45.2 °C in the air heating applications by minimizing the air temperature fluctuations. The augmentation in discharging time and improvement in the room model temperature using multiple PCMs were about 28.4% higher than those without the use of PCMs. The total energy saving using two PCMs was higher by about 29.5% and 46.7% compared with the use of PCM1 and PCM2, respectively. It can be concluded that multiple PCMs have revealed higher energy savings and thermal stability for the air heating system considered in the current study.

1. Introduction

Phase change materials have been widely utilized for thermal energy storage in various heating and cooling applications. One of these essential PCM utilizations is air heating used for buildings’ air conditioning and indirect solar dryers. The primary function of thermal energy storage materials is to store the excess energy to be used at relatively low heat supply periods, which results in a reduction in energy consumption. In some applications, it is required to keep the temperature of space at specified limits due to the fluctuations in heat supply resulting from weather variations, as in the case of solar air dryers. To solve this problem, multiple PCMs can be used in air heating systems to control the temperature of the conditioned space at desired values. Various research works [1,2,3,4,5] have been conducted to evaluate the thermal systems’ performances based on a single PCM used as a thermal storage material. Several parameters, such as inlet temperature, flow rate, and time of charging and discharging cycles, were investigated. The attained improvements were in the range of 24–57% in the charging and discharging processes and a variation in the range of 4–9 °C in space temperature when PCM was utilized for cooling and heating purposes. Wang et al. [6] and Krzysztof et al. [7] evaluated the heat of fusion, specific heat capacity, and various thermo-physical properties of a mixture of paraffin wax with nanomaterials and microencapsulated PCM slurry at various concentrations, respectively. Significant improvements in PCM performance were observed in these works. Nada et al. [8] experimentally investigated the free air cooling performance using PCM filled in plate containers during charging and discharging cycles. The required number of PCM plates, energy saving, air flow rate, and outdoor temperature were investigated. The results revealed that the discharge time decreases by 17–25% with the increase in air temperature and air flow rate. A solar air heater with a double pass was experimentally and numerically investigated using a solar simulator with and without paraffin wax by Salah et al. [9,10]. The system’s charging and discharging process was tested under different air flow rates: 0.6–1.8 kg/min and constant solar irradiation. The results showed that the system’s thermal efficiency with and without PCM was 63.53% and 68.23%, respectively. Many researchers [11,12,13,14] have focused on optimizing the performance of solar collectors integrated with PCMs placed under an absorber plate. Thermal energy efficiency and air heater temperature differences with and without PCM were evaluated in natural and forced convection. Modelling of the charging and discharging process of PCM integrated with heat exchangers was investigated by Peter and Cornelia [15] and Wisam et al. [16] for shell and tube and double–pipe heat exchangers, respectively.
A significant improvement in heat exchanger performance and a reduction in PCM melting time in the range of 27–46% were obtained with the change in heat transfer fluid temperature from 60 to 80 °C. The numerical modelling of charging and discharging cycles of phase change materials integrated with air heaters and solar systems is covered in several studies [17,18,19,20,21,22]. The charging and discharging behavior of different phase change materials placed in capsules with various geometries is simulated using computational fluid dynamic (CFD) analysis. The numerical results, including PCM thermal performance, melting and solidification times, the configuration of the liquid–solid interface, and temperature field, have revealed an improvement in the storage and recovery of heat energy. The evaluation of the thermal performance of various thermal systems integrated with different phase change materials has been reported by many researchers [23,24,25,26,27]. The results are presented in terms of charging and discharging characteristics, thermal storage capacity, and heat transfer rate and show a significant effect of multiple PCMs on the prevention of the fluctuations in temperature of cool and hot storage systems. The vital features of phase change materials are the melting and solidification times as well as the latent heat of fusion. Therefore, the melting and solidification characteristics during the PCM charging and discharging process are investigated in many experimental and numerical research works [28,29,30,31,32]. Abduljalil et al. [33] presented an experimental study of PCM melting and solidification in a finned triplex tube heat exchanger to examine the charging process under steady and unsteady conditions. The results indicated that the melting time of PCM was reduced by 86% due to the change in the inlet temperature of the heat transfer fluid compared with 58% due to a change in the mass flow rate. Ajay and Vinod [34] analyzed the charging and discharging time of paraffin wax and myristic acid as phase change materials for a comparison. It was found that the melting process of myristic acid required less time (2 h and 25 min) compared with that required for paraffin wax (3 h and 7 min) under similar operating conditions. The behavior of PCM (Plus ICE H190) during melting and solidification process was investigated experimentally using a differential scanning calorimeter (DSC) and thermal gravity (TG) lab test apparatus [35]. The results of the melting and solidification temperatures and latent heat of fusion for the tested PCM revealed that using Plus ICE H190 as a phase change material was feasible in many applications at a temperature in the range of 170 to 200 °C. Kanimozhi et al. [36] introduced an experimental study to investigate the charging and discharging characteristics of paraffin wax as a phase change material placed in a storage tank fabricated from concentric steel cylinders. Heat transfer was enhanced using several copper tubes filled with PCM and inserted in the storage tank. Heat absorption, heat rejection, time and temperature during the melting and solidification of paraffin wax were evaluated under different fluid mass flow rates.
It was observed from the reported research works that there is still a need to fill the gap in the research area of melting and solidification characteristics of multiple phase change materials utilized in the air heating systems. The present work focuses on evaluating the charging and discharging characteristics of two PCMs subjected to internal flow in an air heating system. The use of two PCMs will improve the energy savings of the air heaters utilized in building air conditioning systems and indirect solar dryers. The period of supplying the heat energy stored by PCMs for the control of the temperature fluctuations of a room model and keeping it at the desired value is also experimentally investigated in the current study.

2. Materials and Methods

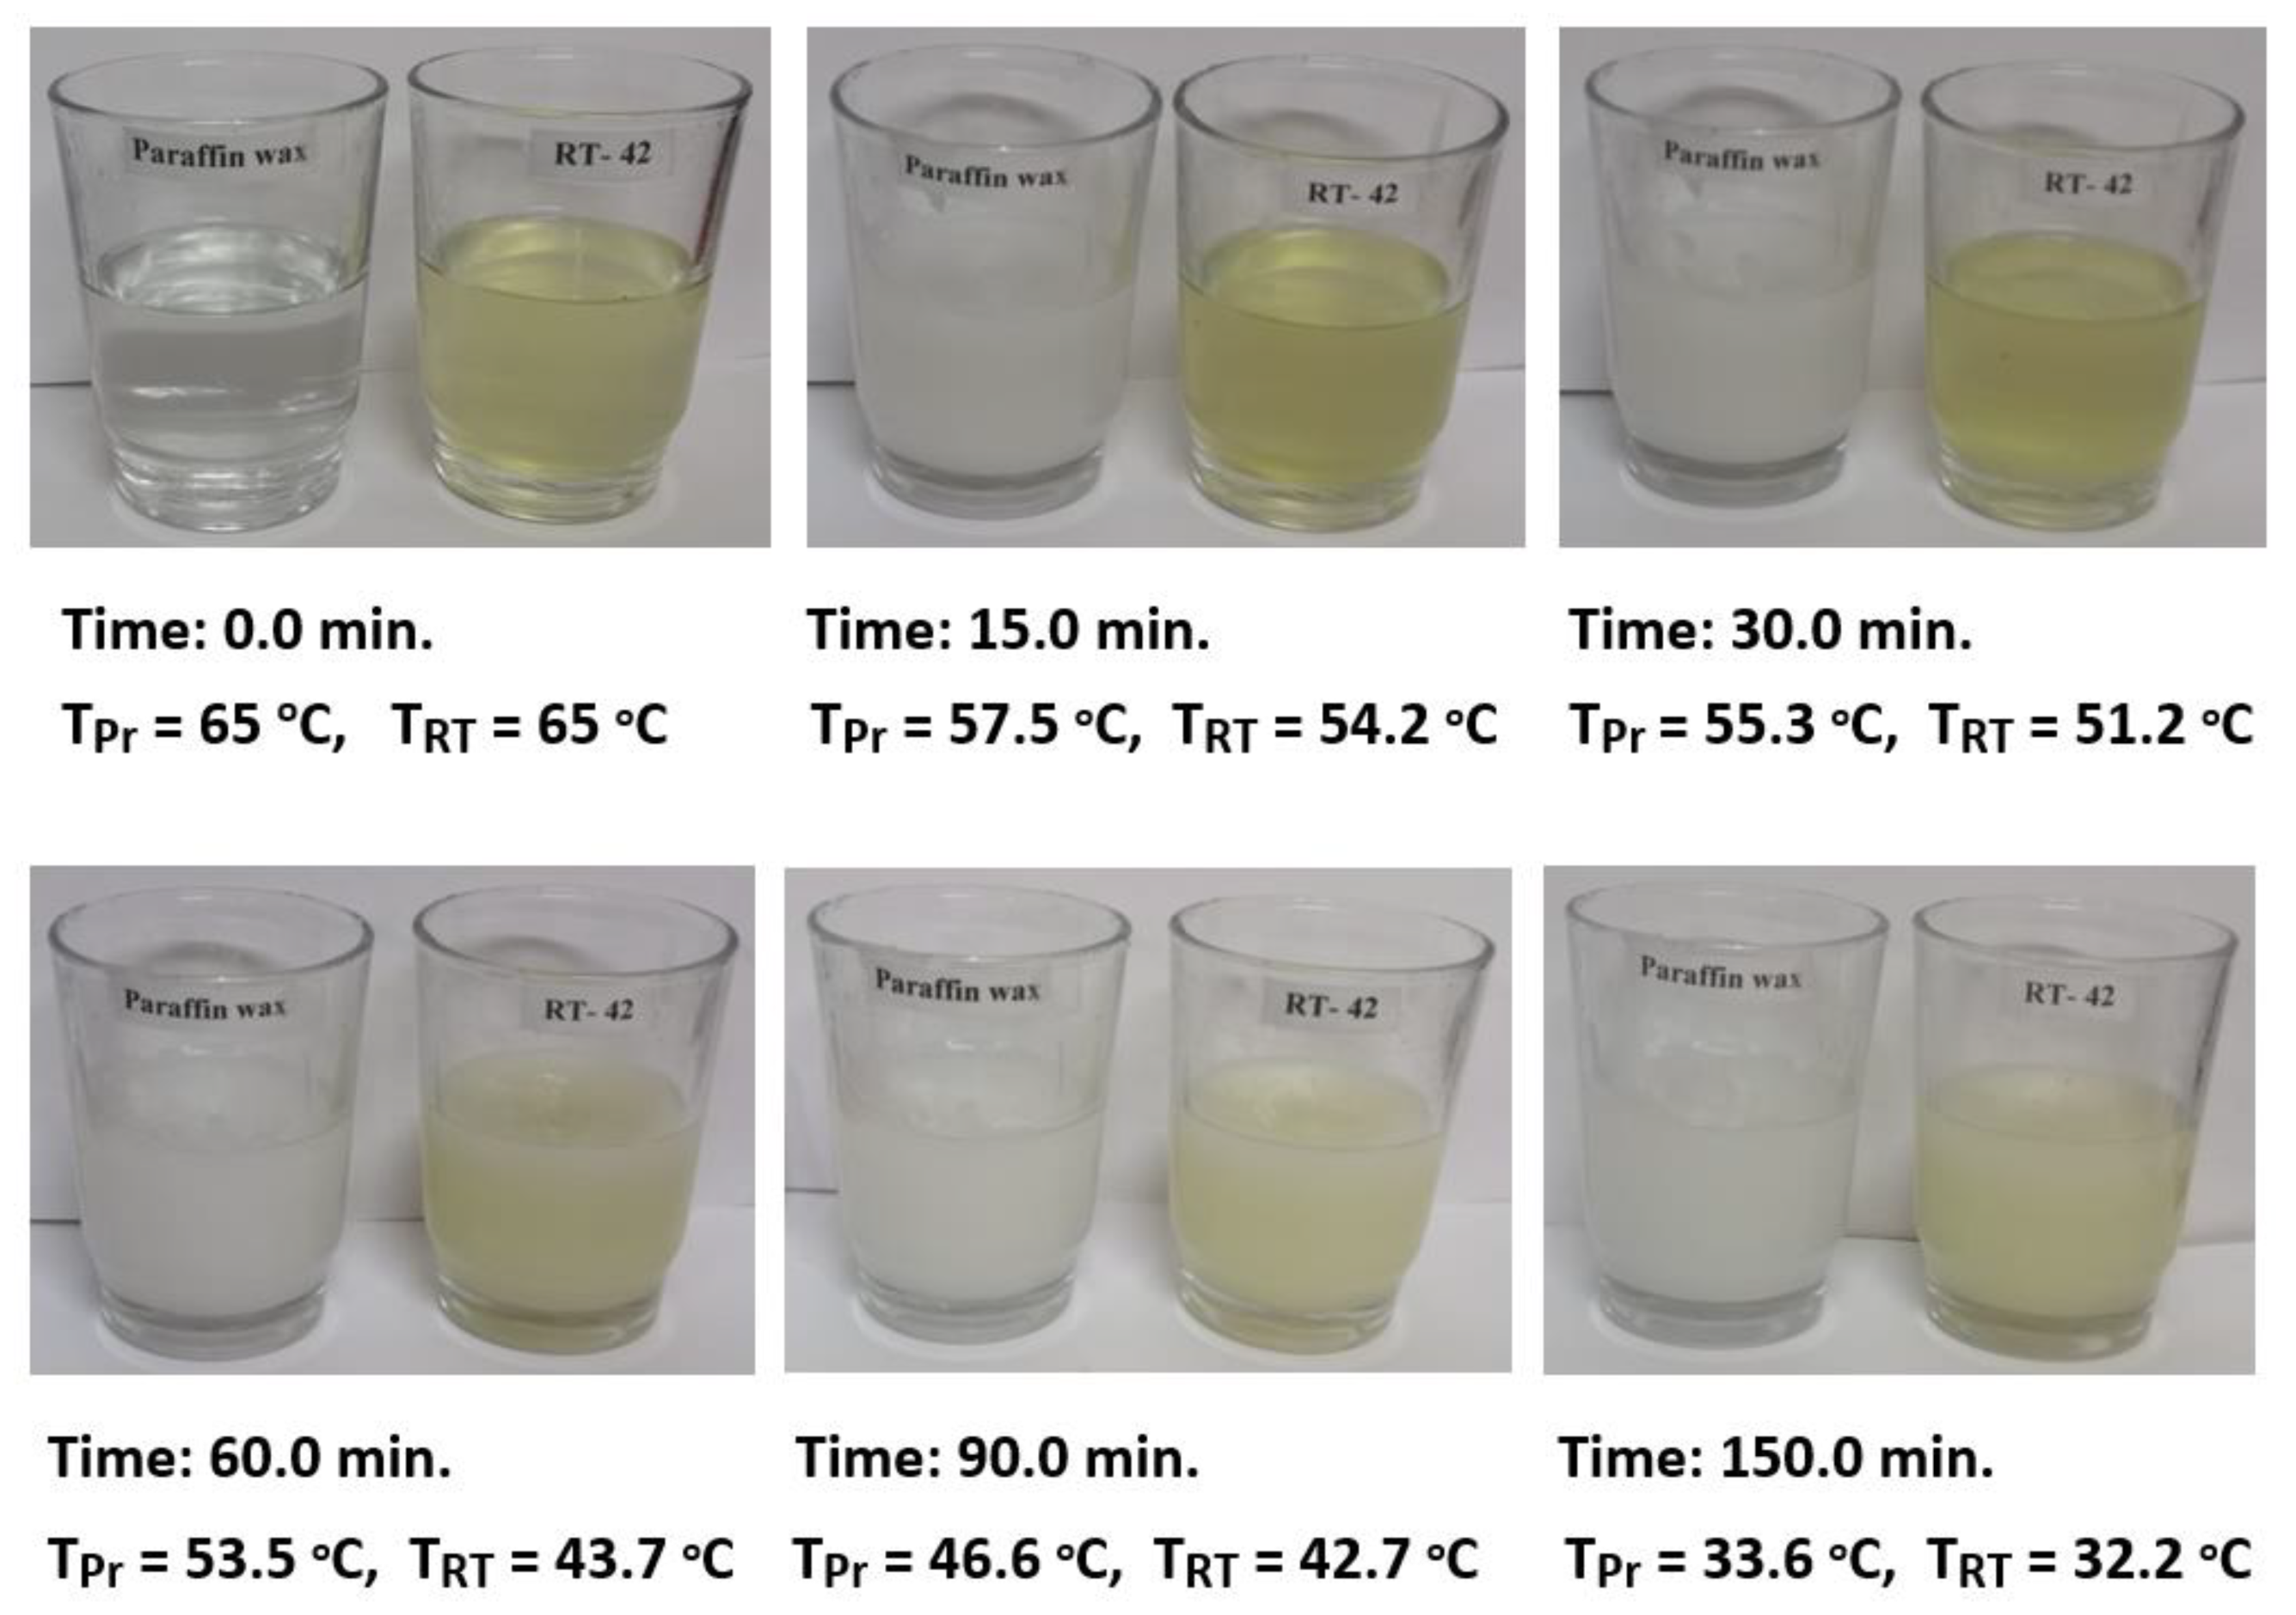
2.1. Charging and Discharging of PCM Analysis

The air duct illustrated in Figure 1 is thermally insulated, thus, it is assumed that there is no heat loss from the duct to the surrounding air. Based on the energy balance between the hot air in the duct and PCM1 during the charging cycle (melting process), the energy released by the air and gained by PCM1 can be expressed as follows [8]:
0 t m a . · C p a · ( T a 2 T a 3 ) ·   d t = m a . · C p a · ( T a 2 T a 3 ) · t c h 1
and:
m a . · C p a · ( T a 2 T a 3 ) · t c h 1 = q p c 1 · m p c 1 + m p c 1 · C p p c 1 · ( T p c 1 L T p c 1 M ) + m A l · C p A l · ( T s 1 f T s 1 i )
where m a . is the air mass flow rate (kg/s); m p c 1 and m A l are the mass (kg) of PCM1 and panels aluminum sheets, respectively, t c h 1 is the charging time (s) measured experimentally at a time interval (Δt = 5 min), q p c 1 is PCM1 latent heat of fusion (J/kg), T p c 1 L is the temperature of the PCM1 at the liquid phase; and T p c 1 M is the melting temperature (melting point) of the PCM1 from the thermo–physical properties of the phase change materials as illustrated in Table 1. T s 1 i   and   T s 1 f   are initial and final aluminum sheets’ temperatures of PCM1 panels measured at the start and end of the charging cycle, respectively.
The first term on the right–hand side of Equation (2) represents the latent heat gained by PCM1, while the second and third terms represent the sensible heat gained by the PCM1 and the aluminum sheets of the PCM1 panels, respectively.
Heat energy ( Q 1 c ) gained by the first energy storage material PCM1 in the air duct during the excess heat energy period of the charging cycle (melting process) represents the energy saving of PCM1, and it can be determined using Equation (3):
Q 1 c = m a . · C p a · ( T a 2 T a 3 ) · t c h 1 m A l · C p A l . ( T s 1 f T s 1 i )      
The heat energy ( Q 2 c ) gained by the PCM2 in the room model during the charging cycle represents the energy saving of PCM2, and can be estimated as follows [17]:
Q 2 c = m a . · C p a · ( T a 3 T a 4 ) · t c h 2 m a r · C p a r · ( T a r f T a r i ) m A l · C p A l · ( T s 2 f T s 2 i )
where m a r is the mass of the air (kg) occupied by the room volume,   T a r i   and   T a r f are the initial and final room temperatures at the start and end of the charging cycle, respectively, and T s 2 i   and   T s 2 f are initial and final surface temperatures of PCM2 aluminum panels measured at the start and end of the charging cycle, respectively.
During the discharging cycle (solidification process), when the supplied air temperature is less than the desired value for air heating purposes ( T a r s ) the heat energy ( Q 1 d ) released by the energy storage material PCM1 and transferred to the air flowing in the duct is approximated using Equation (5). As the heat gained by the aluminum sheets is small compared with that gained by the PCM1, it can be neglected.
  Q 1 d = m a . · C p a · ( T a r s T a 2 ) · t d c 1
where the set point air temperature of the room model T a r s was selected in the present study to be in the range of (35–40 °C), which represents the desired temperature for the air heating purpose or food product drying in the solar dryers.
The discharging time t d c 1 (s), represents the required time to release heat energy from PCM1 at a low air temperature period during the discharging cycle. This time must be determined from the start of the discharging period when the PCM is at the liquid phase and until the PCM temperature reduces and approaches thermal equilibrium with the surrounding air in the PCM solid phase. tdc1 can be estimated based on the energy balance between the air and PCM1 as expressed by Equation (6).
q p c 1 · m p c 1 + m p c 1 · C p p c 1 · ( T p c 1 L T p c 1 M ) = m a . · C p a · ( T a r s T a 2 ) ·   t d c 1                                              
The heat energy ( Q 2 d ) released by the second energy storage material PCM2 and transferred to the air in the room model can be determined as follows:
  Q 2 d = m a . · C p a · ( T a r s T a 3 ) ·   t d c 2
The required time ( t d c 2 )   to release heat energy by PCM2 during the low room air temperature period of the discharging cycle can be approximated using energy balance Equation (8):
m a . · C p a · ( T a r s T a 3 ) ·   t d c 2 = q p c 2 · m p c 2 + m p c 2 · C p p c 2 · ( T p c 2 L T p c 2 M )
where T p c 2 L is the temperature of the PCM2 during the liquid phase, and T p c 2 M is the melting temperature (melting point) of the PCM2.

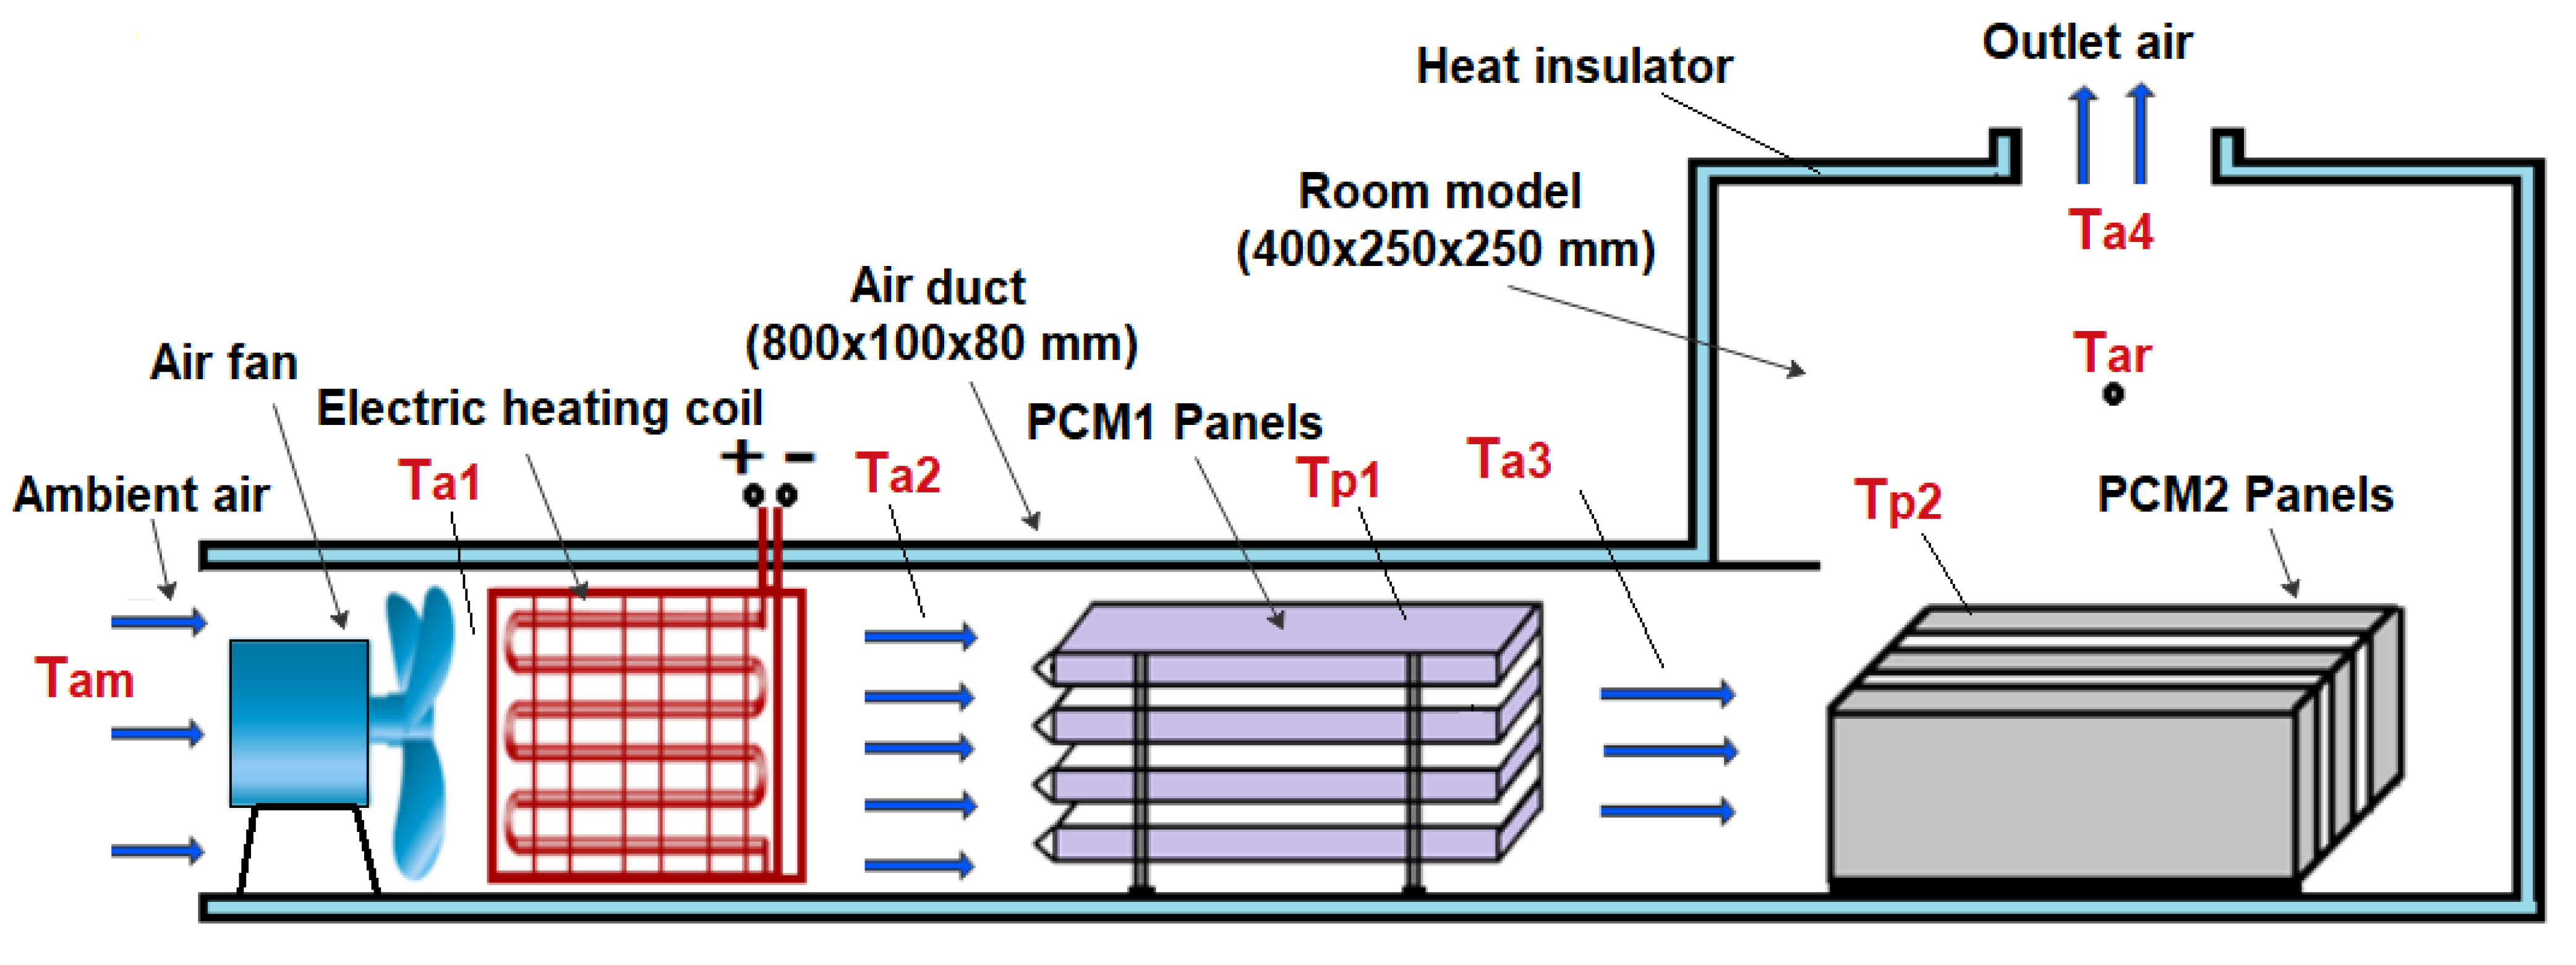
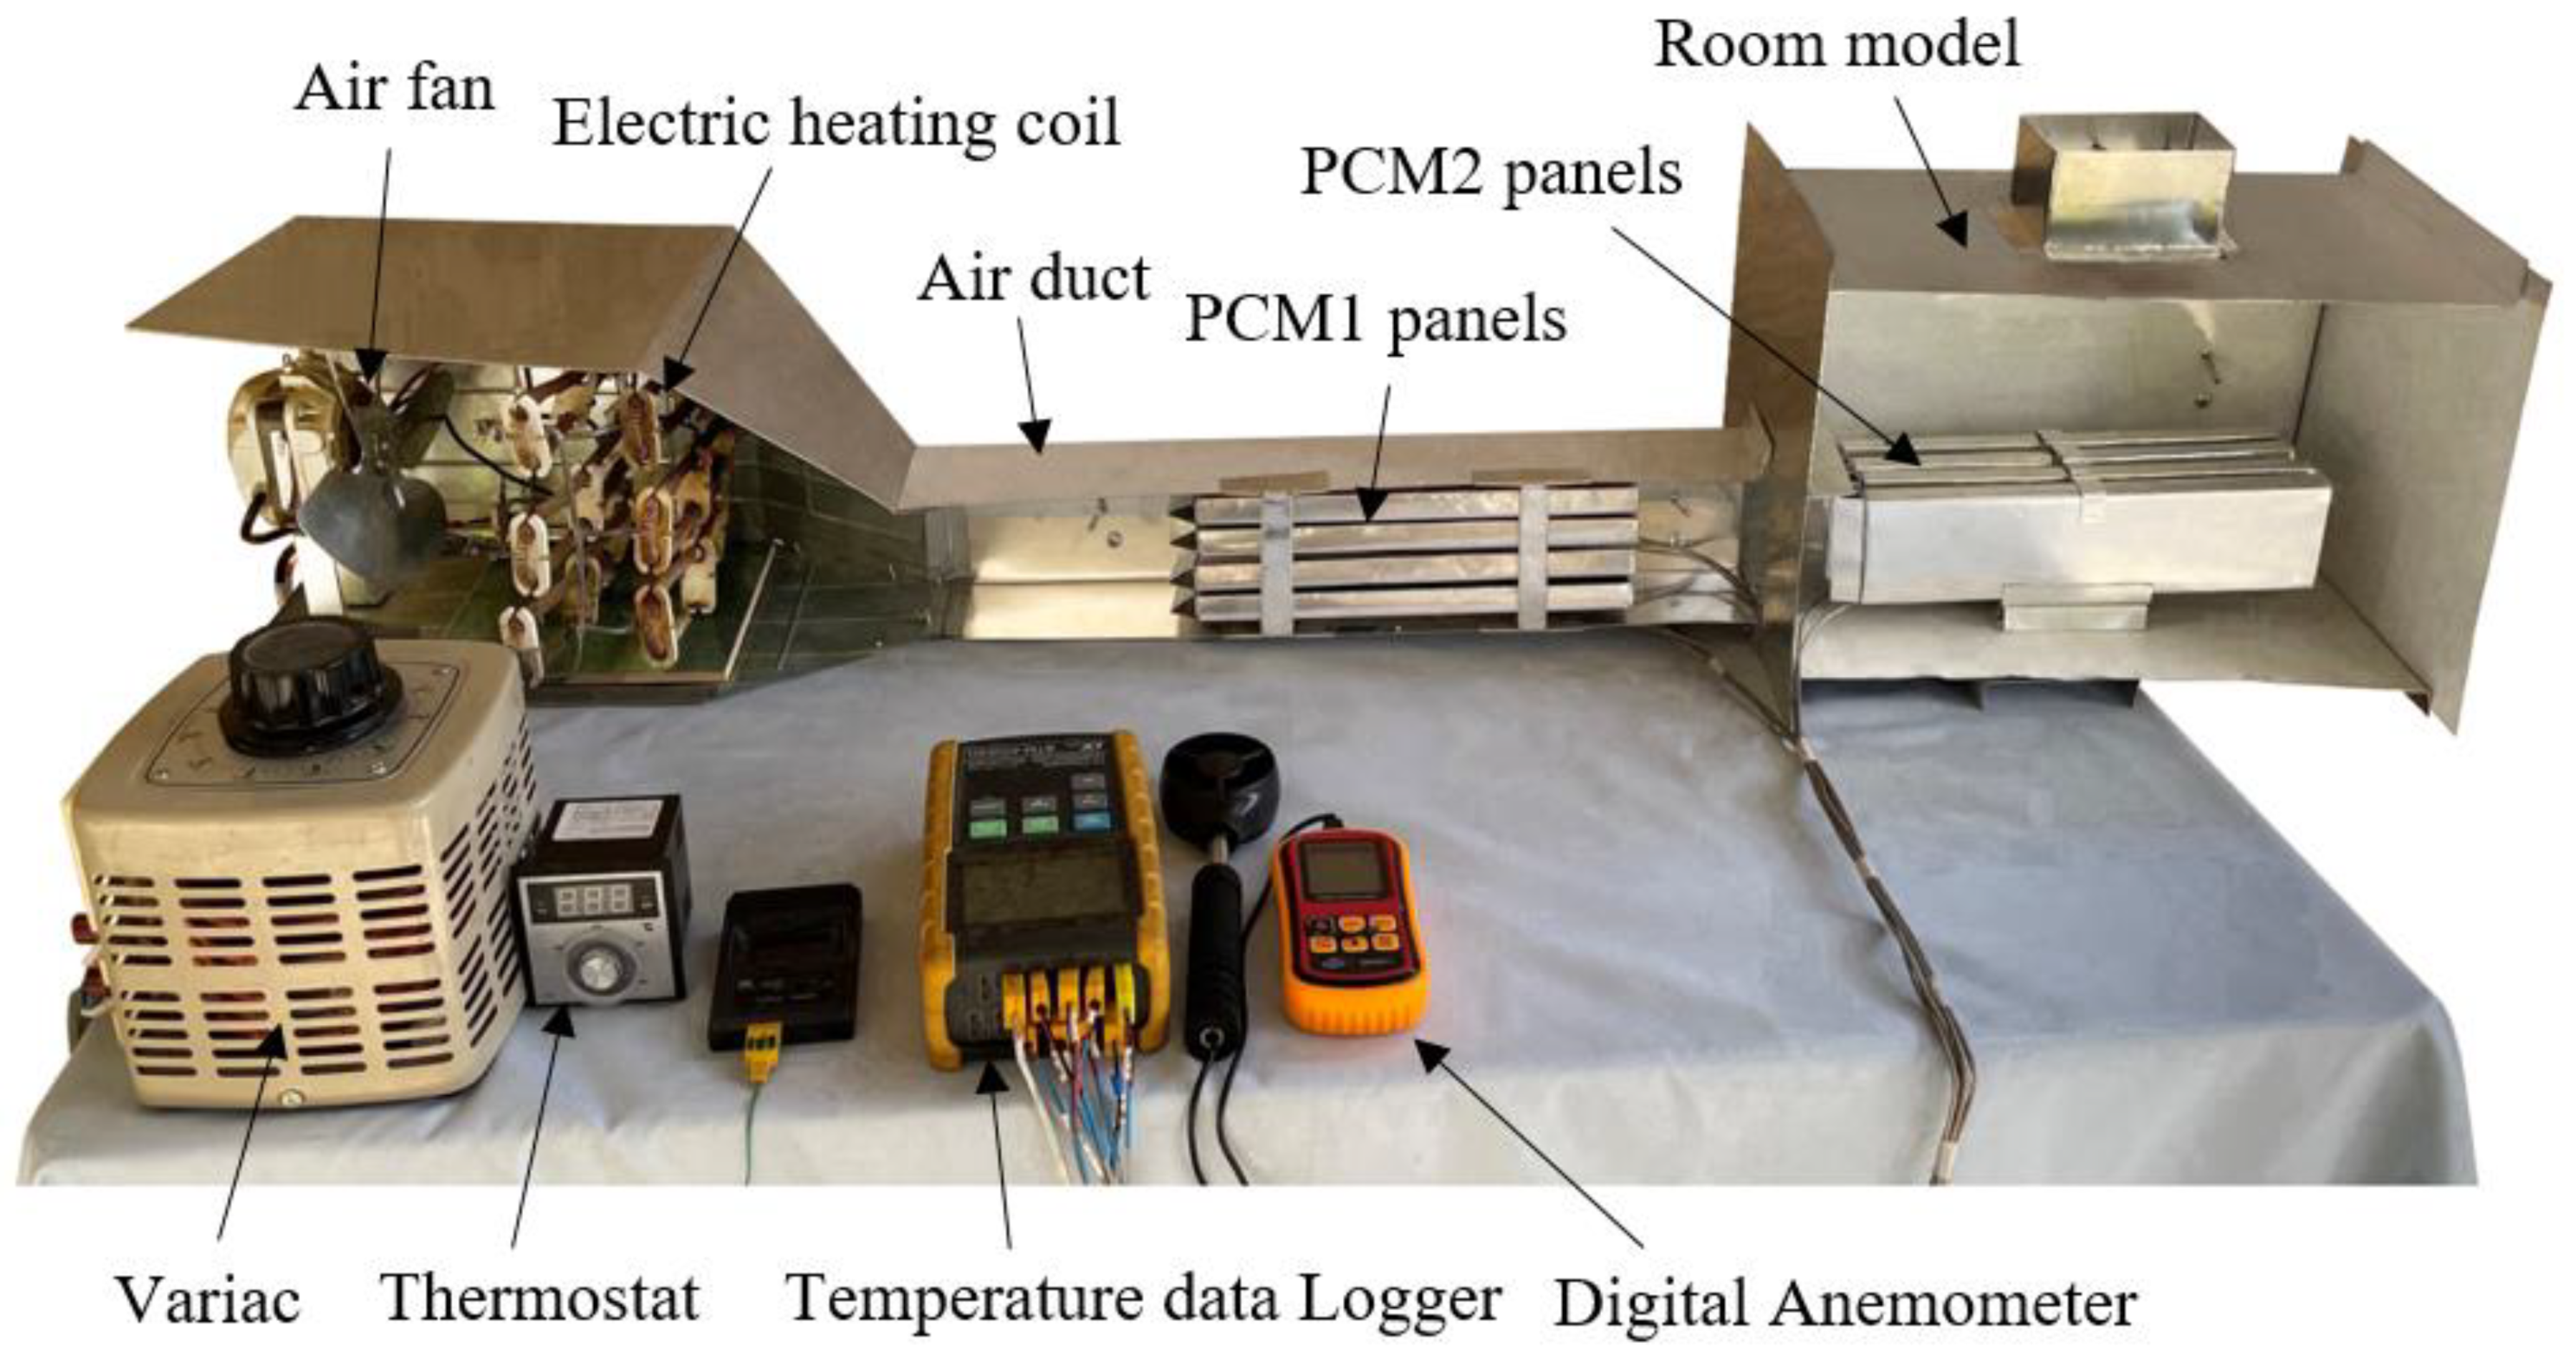
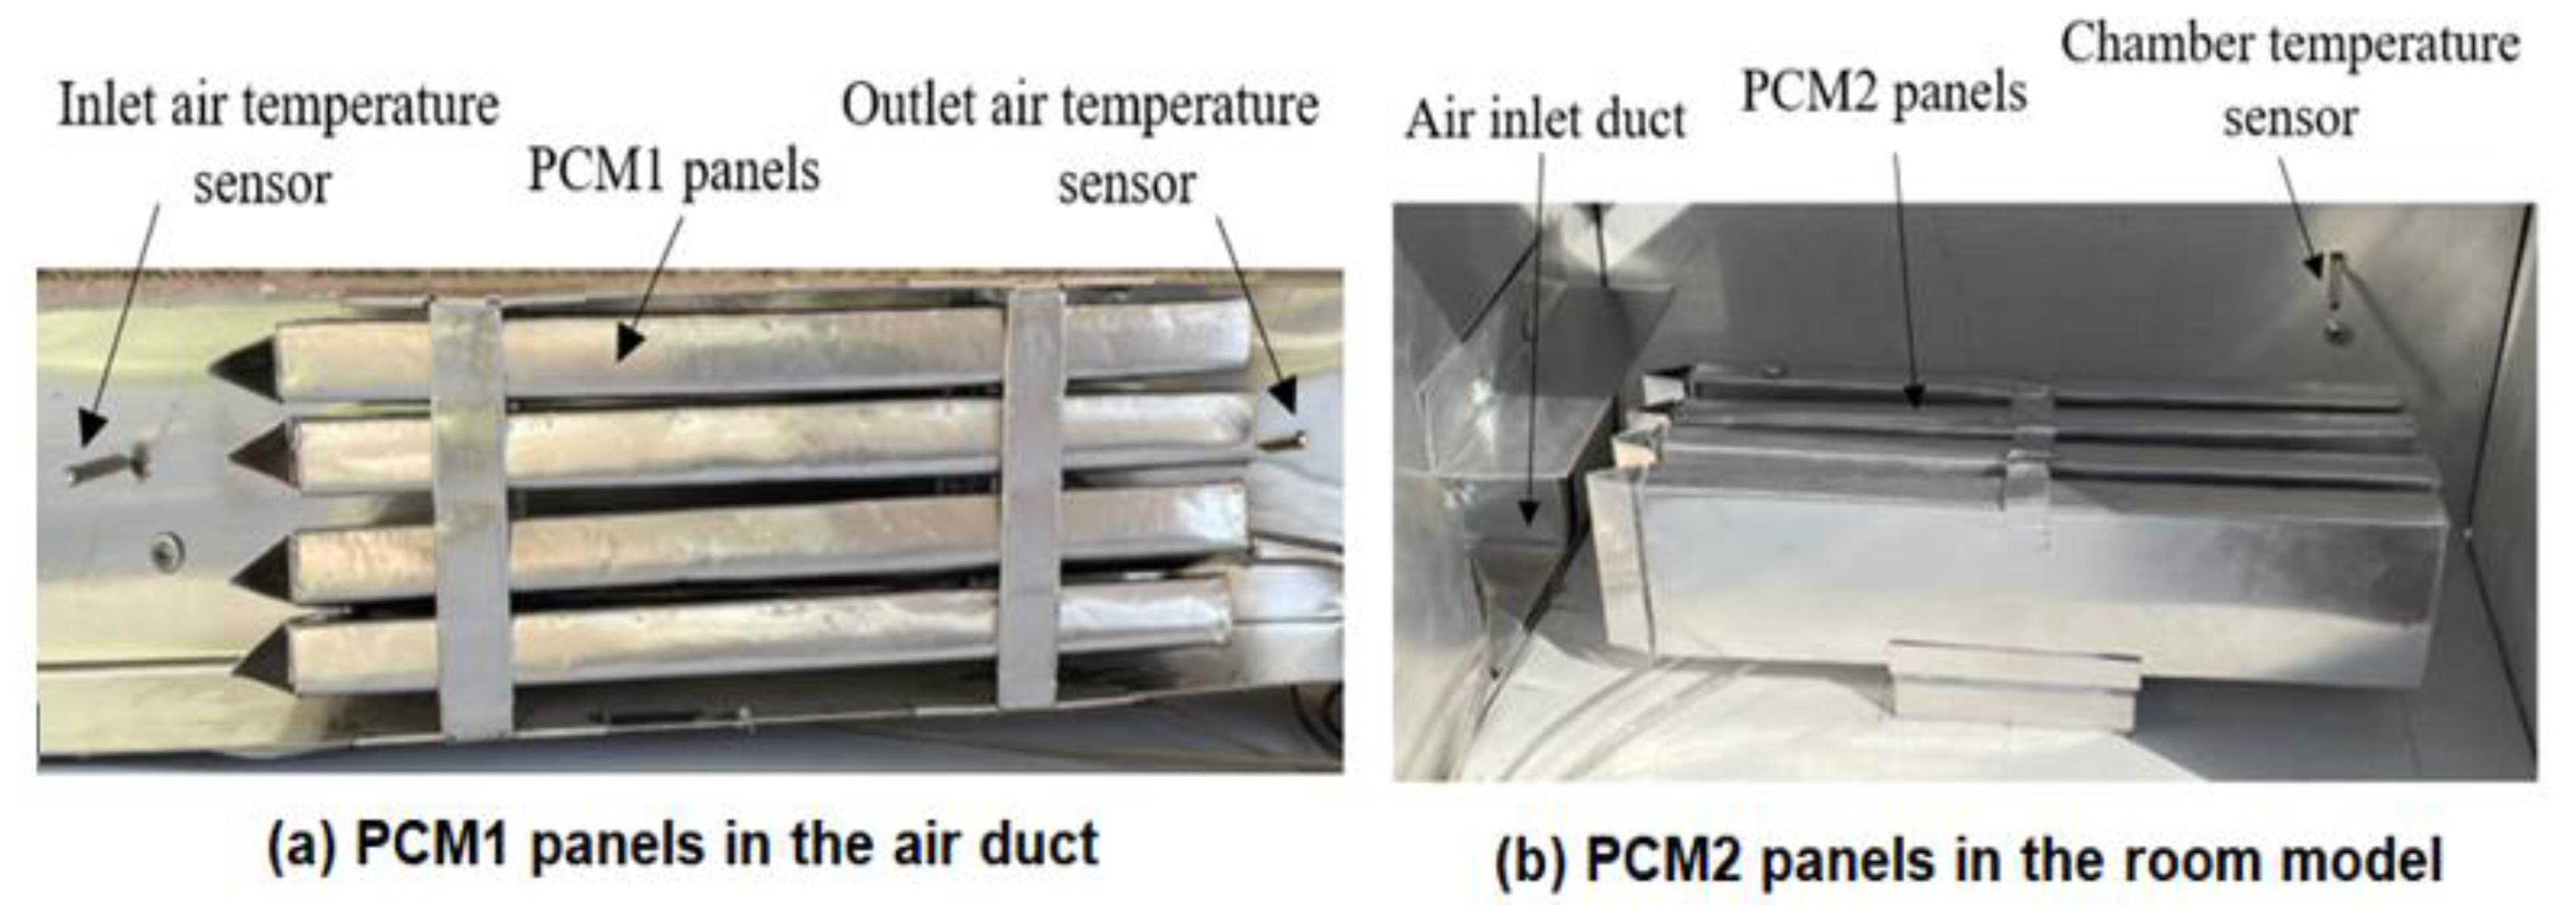
2.2. Experimental Setup and Methodology

The experimental work was conducted using a test rig fabricated in the present work to provide the specified conditions for the testing of multiple PCM characteristics. The test rig consisted of two main parts, an air duct of 800 mm in length, 80 mm in width and 100 mm in height, and a room model with dimensions 400 × 250 × 250 mm, as shown in Figure 1 and Figure 2. The air duct is equipped with an electric heating coil of power 1000 W and a variable speed air fan to provide a hot air with a flow of 0.005–0.01 kg/s at temperature in the range of 30–65 °C. The air duct and room model were fabricated from aluminum sheets (k = 232 W/m °C) and insulated using glass wool (k = 0.038 W/m °C) to minimize the heat loss to the surrounding air. Two phase change materials, PCM1 and PCM2, of different melting points and latent heat of fusion were used, as illustrated in Table 1. The first PCM was paraffin wax filled in 4 rectangular panels with dimensions of 310 × 70 × 15 mm, which were fabricated from 0.5 mm thick aluminum sheets. The PCM1 panels were placed horizontally in the duct with equal vertical spacing of 7 mm to allow the air to flow around the panels. The second PCM was paraffin RT–42 filled in 4 aluminum panels of similar dimensions and positioned vertically in the room model as shown in Figure 3. Ten K–type thermocouples (−200 to 1250 °C) with a data logger of the BTM–4208SD model and accuracy of ±0.2 °C were used to monitor and record the temperatures at many locations in the test rig as depicted in Figure 1. Two thermocouples were inserted inside two panels located at different locations for both PCM1 and PCM2 to measure the mean temperatures of PCM1 and PCM2. A digital anemometer (Am802 model) with accuracy of ±3% m/s was used to measure the velocity of air flow in the duct. The specified temperature of the heated air in the duct was controlled using a variable transformer (25 amp. Variac) and a thermostat to regulate the power supplied to the electric heating coil.

2.3. Test Procedure

The experimental tests were conducted for three cases: PCM1 (Paraffin wax) panels placed in the air duct were used alone at the first case; PCM2 (RT–42) panels placed in the room model were used in the second case; and in the third case, two PCMs (PCM1 and PCM2) were used at the same time. During the PCM1 charging cycle (melting process), the ambient air entering the duct was heated with an electric coil to 65 °C in the first case (PCM1) and passed through the PCM panels until the PCM1(paraffin wax) melted. The charging cycle was stopped when the temperature of PCM1 exceeded the melting point (57 °C). In the PCM1 discharging cycle (solidification process), the electric heating coil was switched off, and the ambient air entering the duct at a temperature of 29–31 °C was heated by the energy released from the PCM1. The ambient air was heated to the desired temperature in the room model (35–40 °C) via heat exchange between PCM1 panels and entering air until the PCM1 solidified. When the test system approached a steady operation at the start of each charging and discharging cycle, the air and PCMs temperatures, duct inlet air velocity, and power supplied to the electric heater were monitored and recorded at a time interval of 5 min during the testing period of 330 min. These test steps were repeated for the second case (PCM2) and the third case with two PCMs.

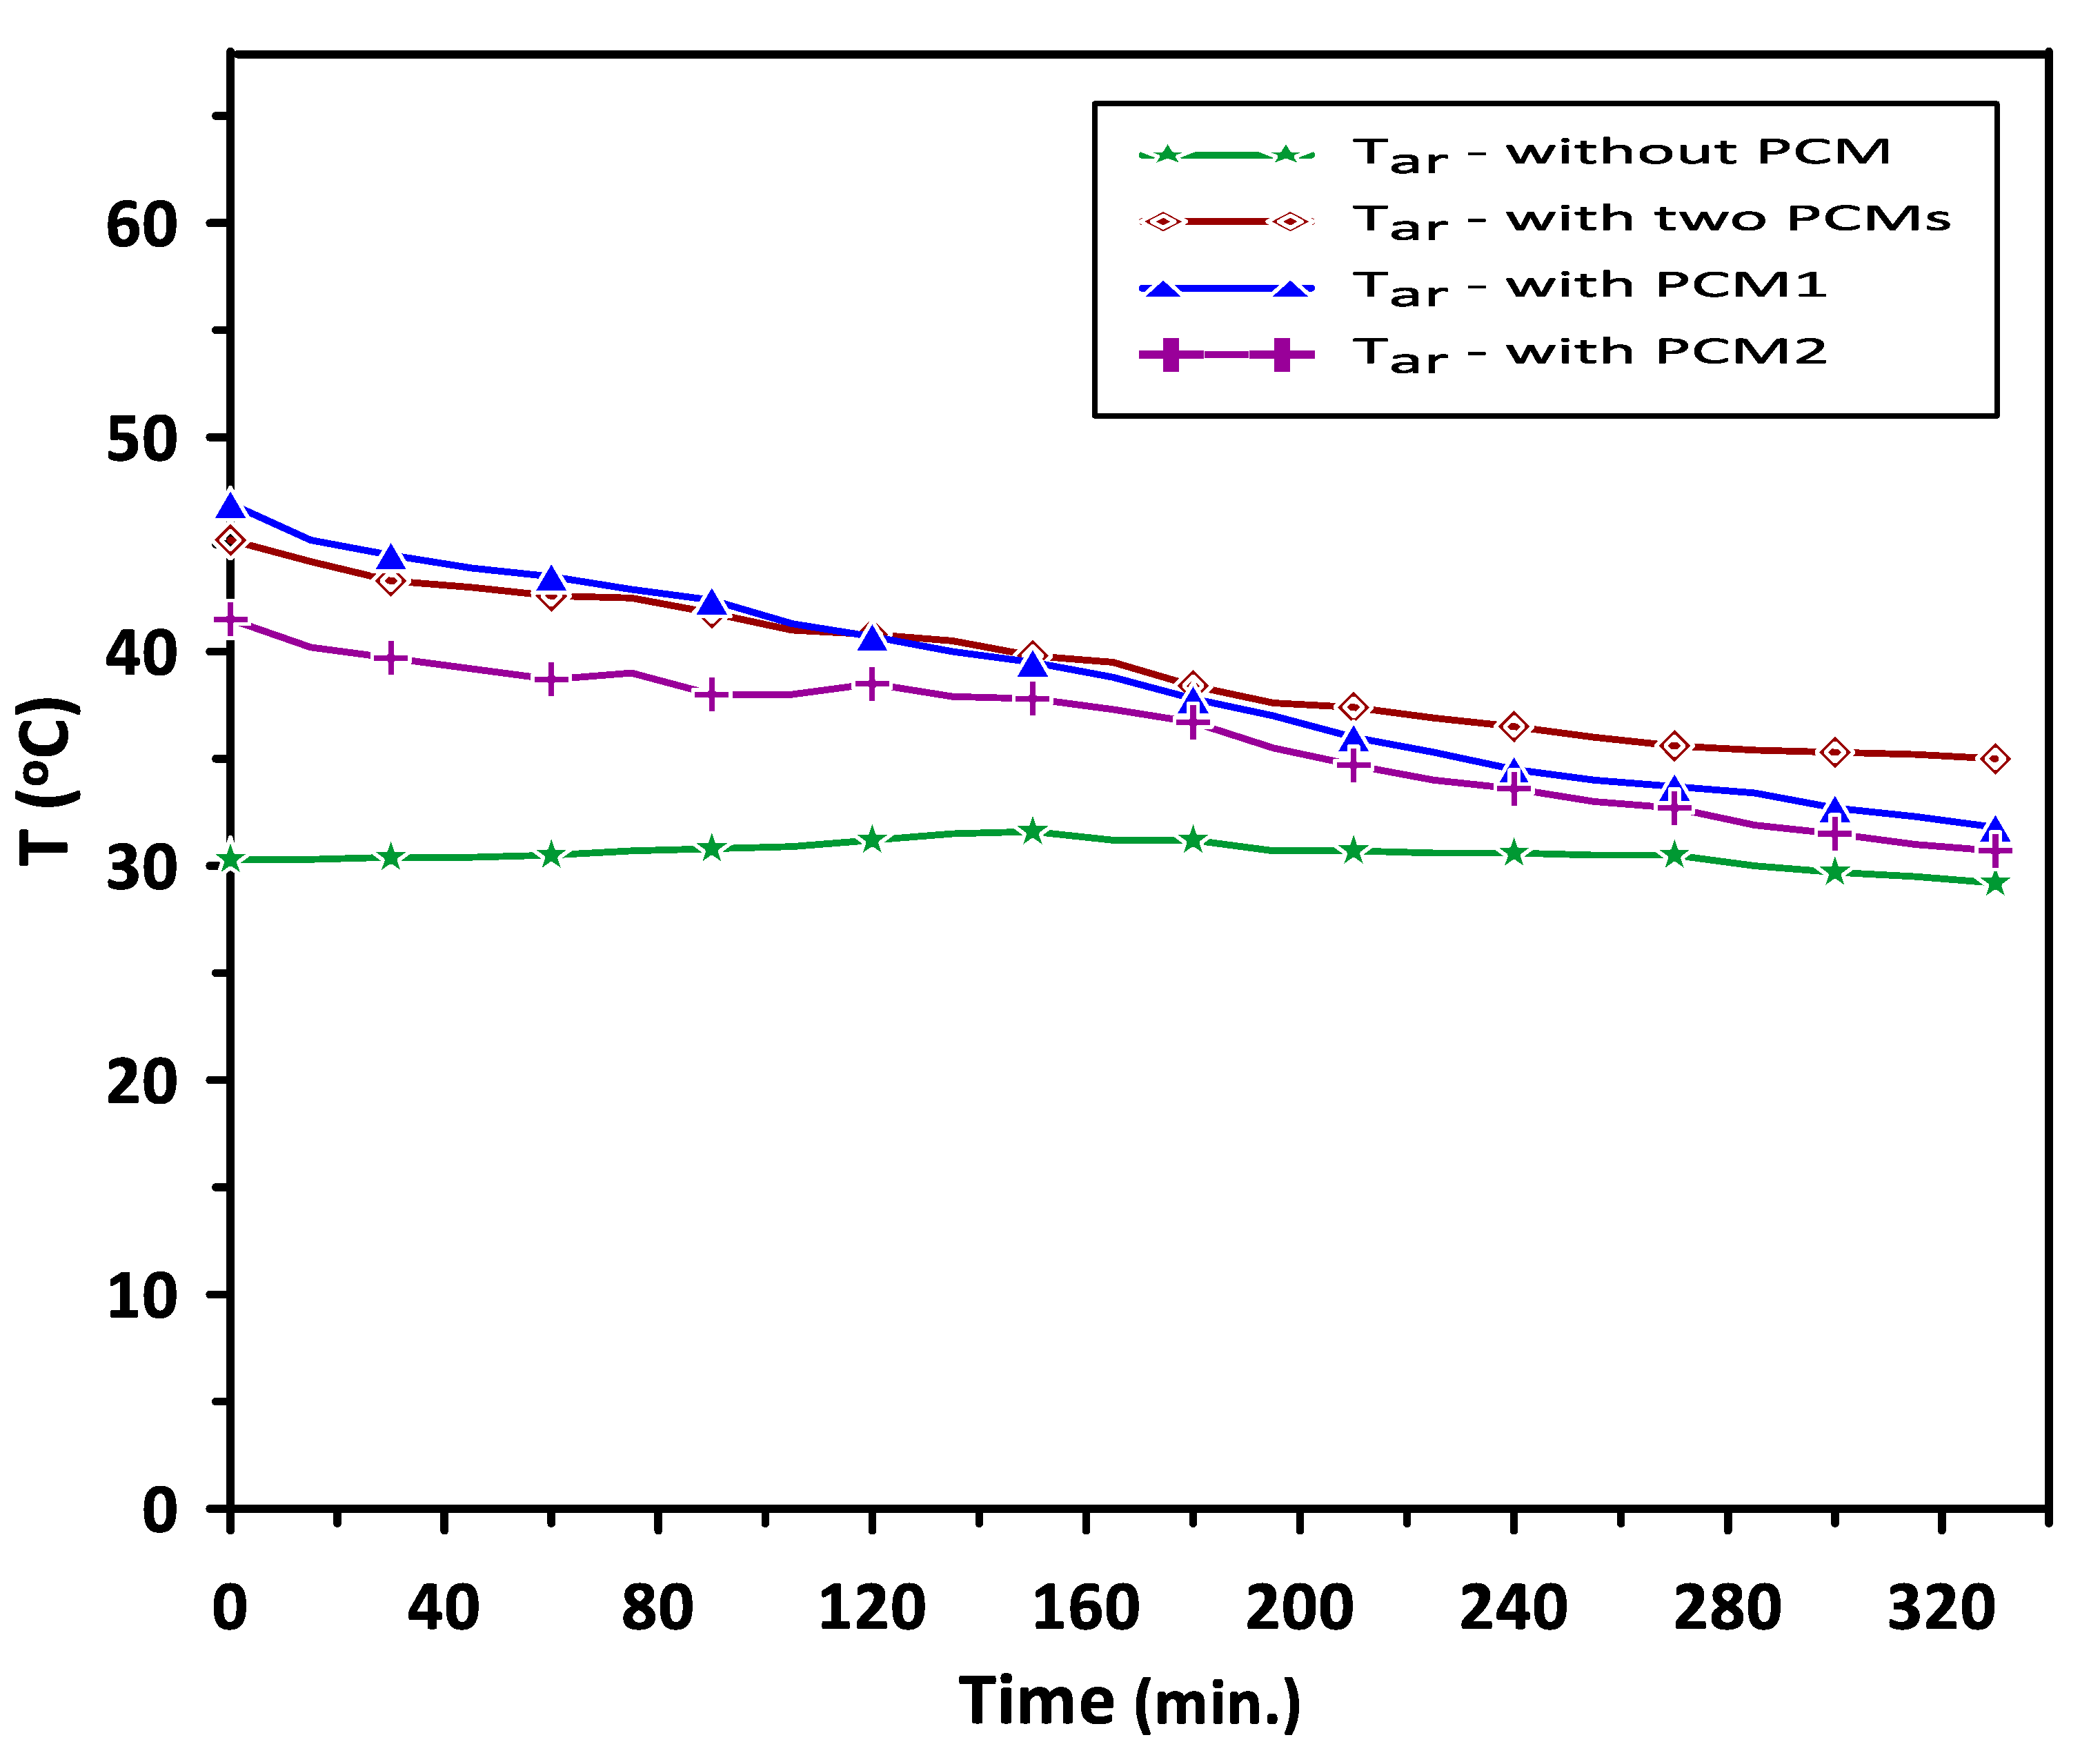
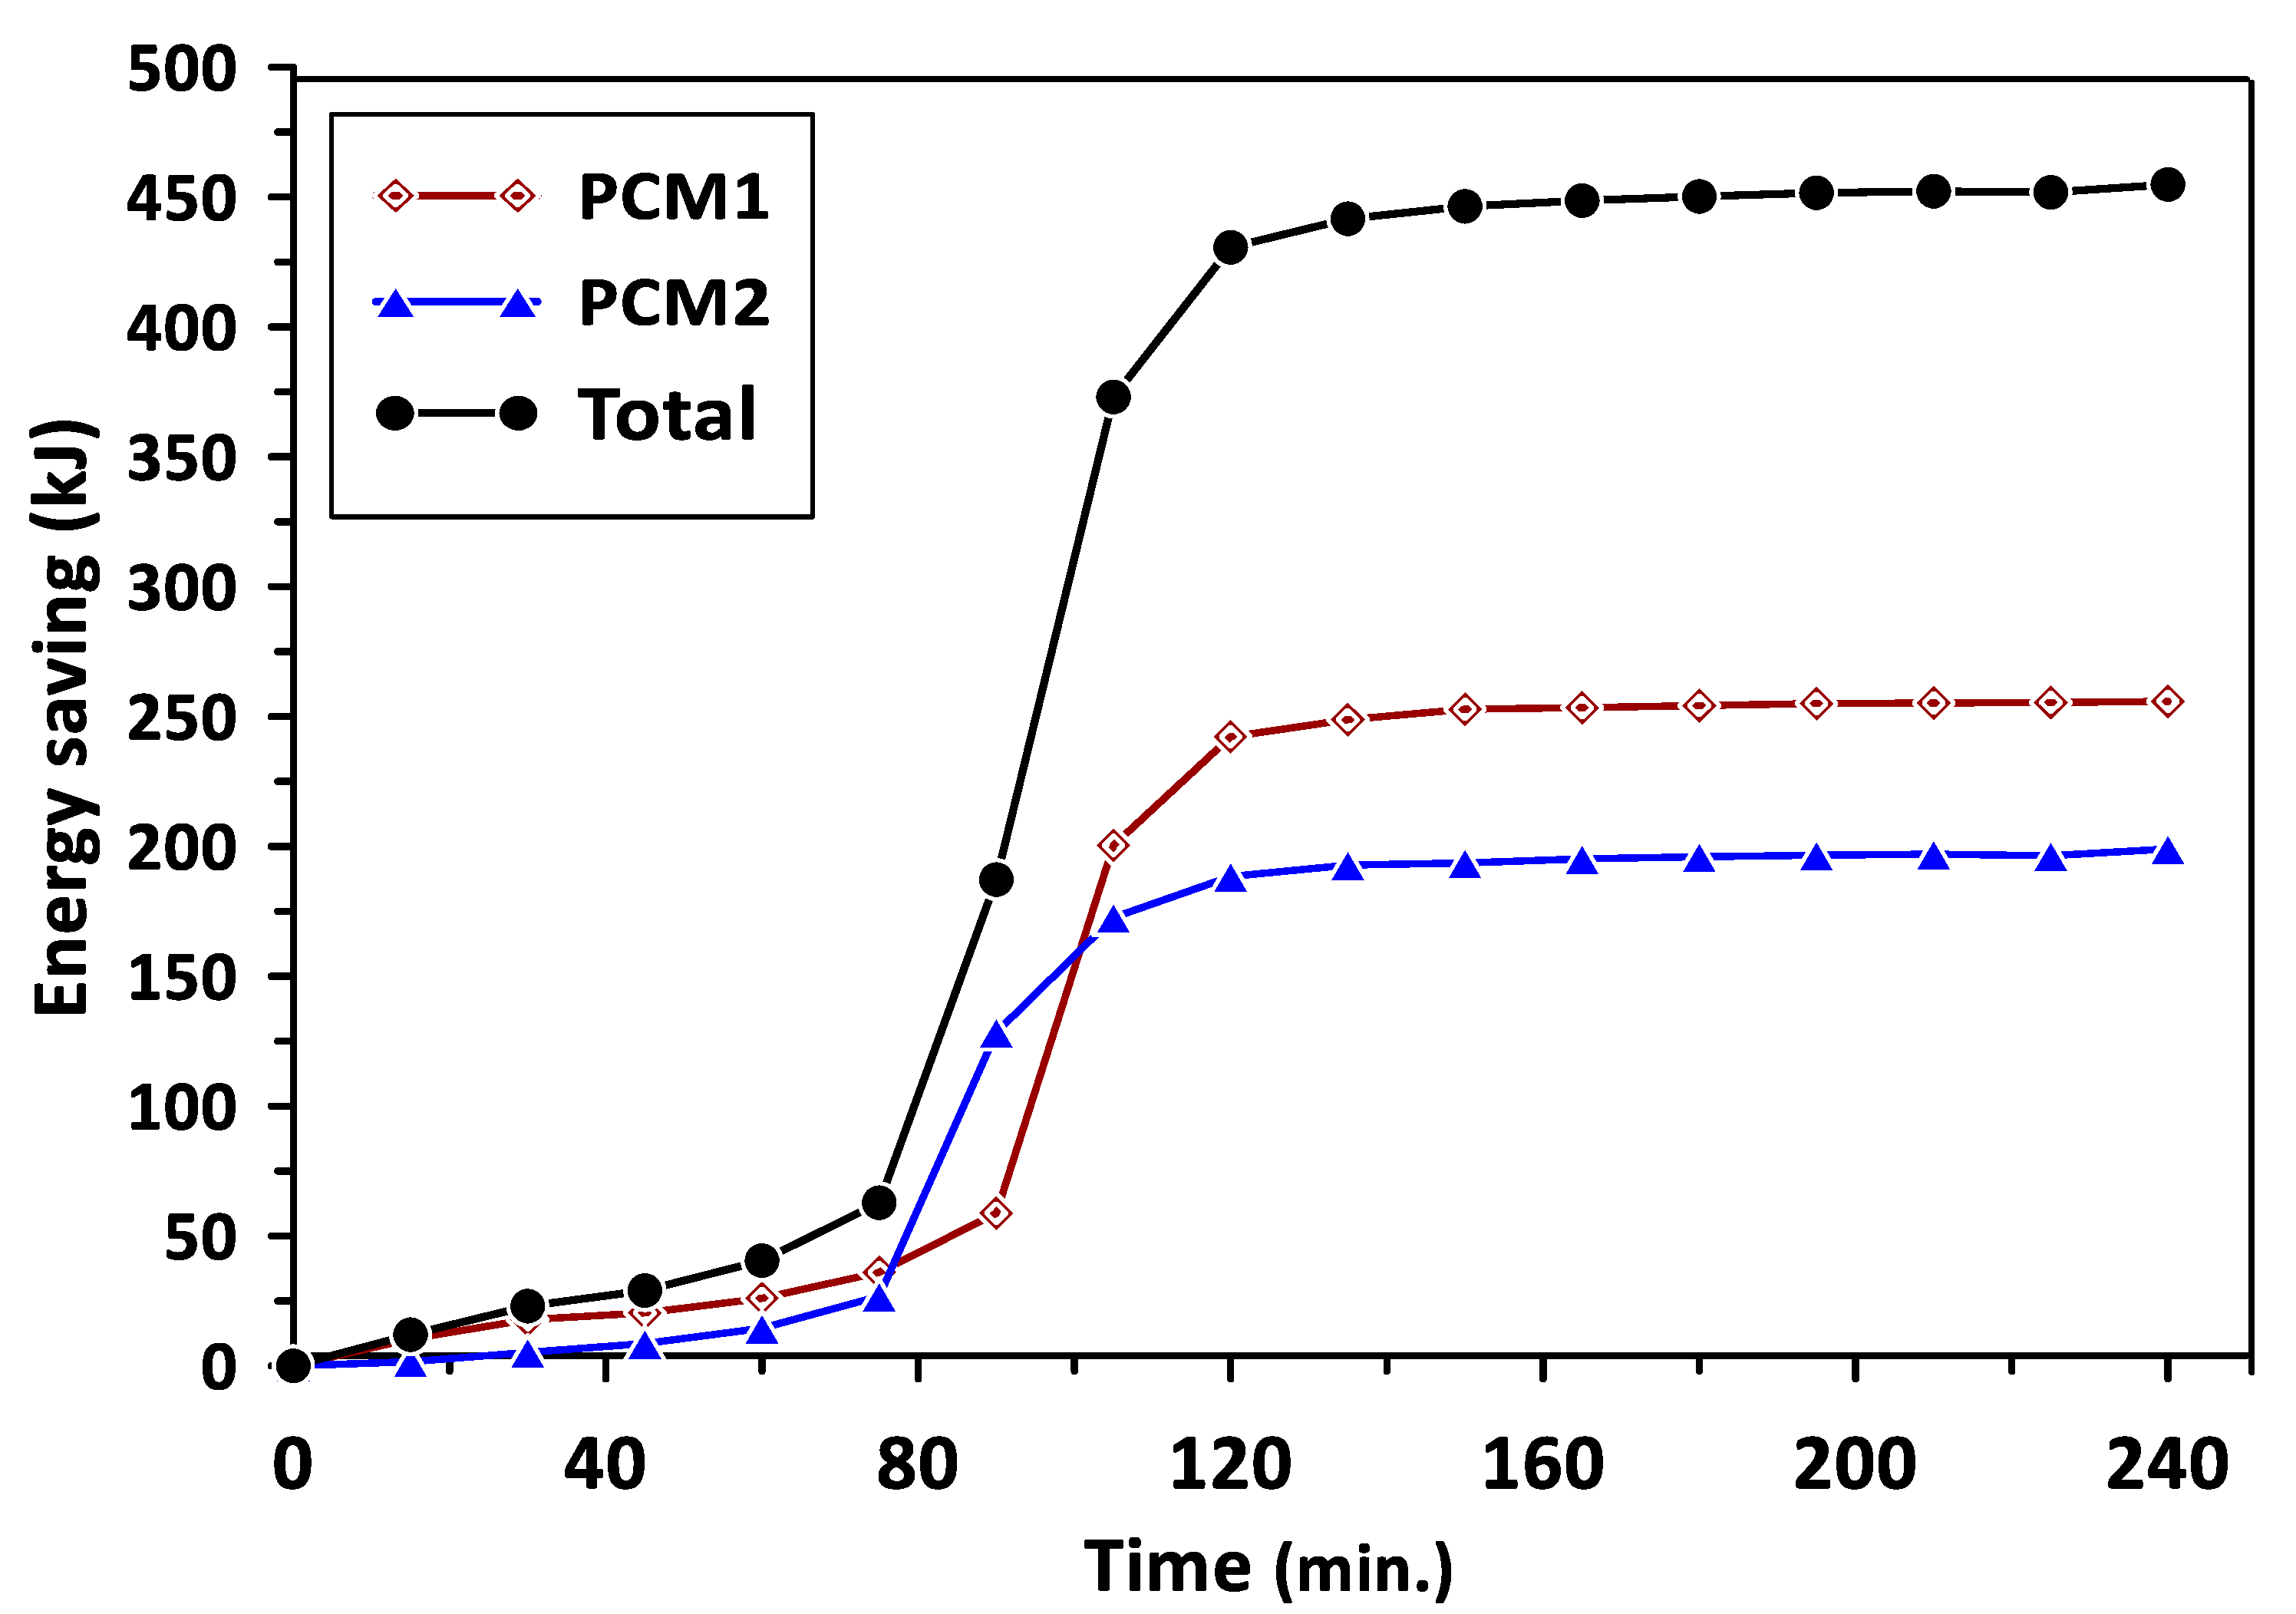
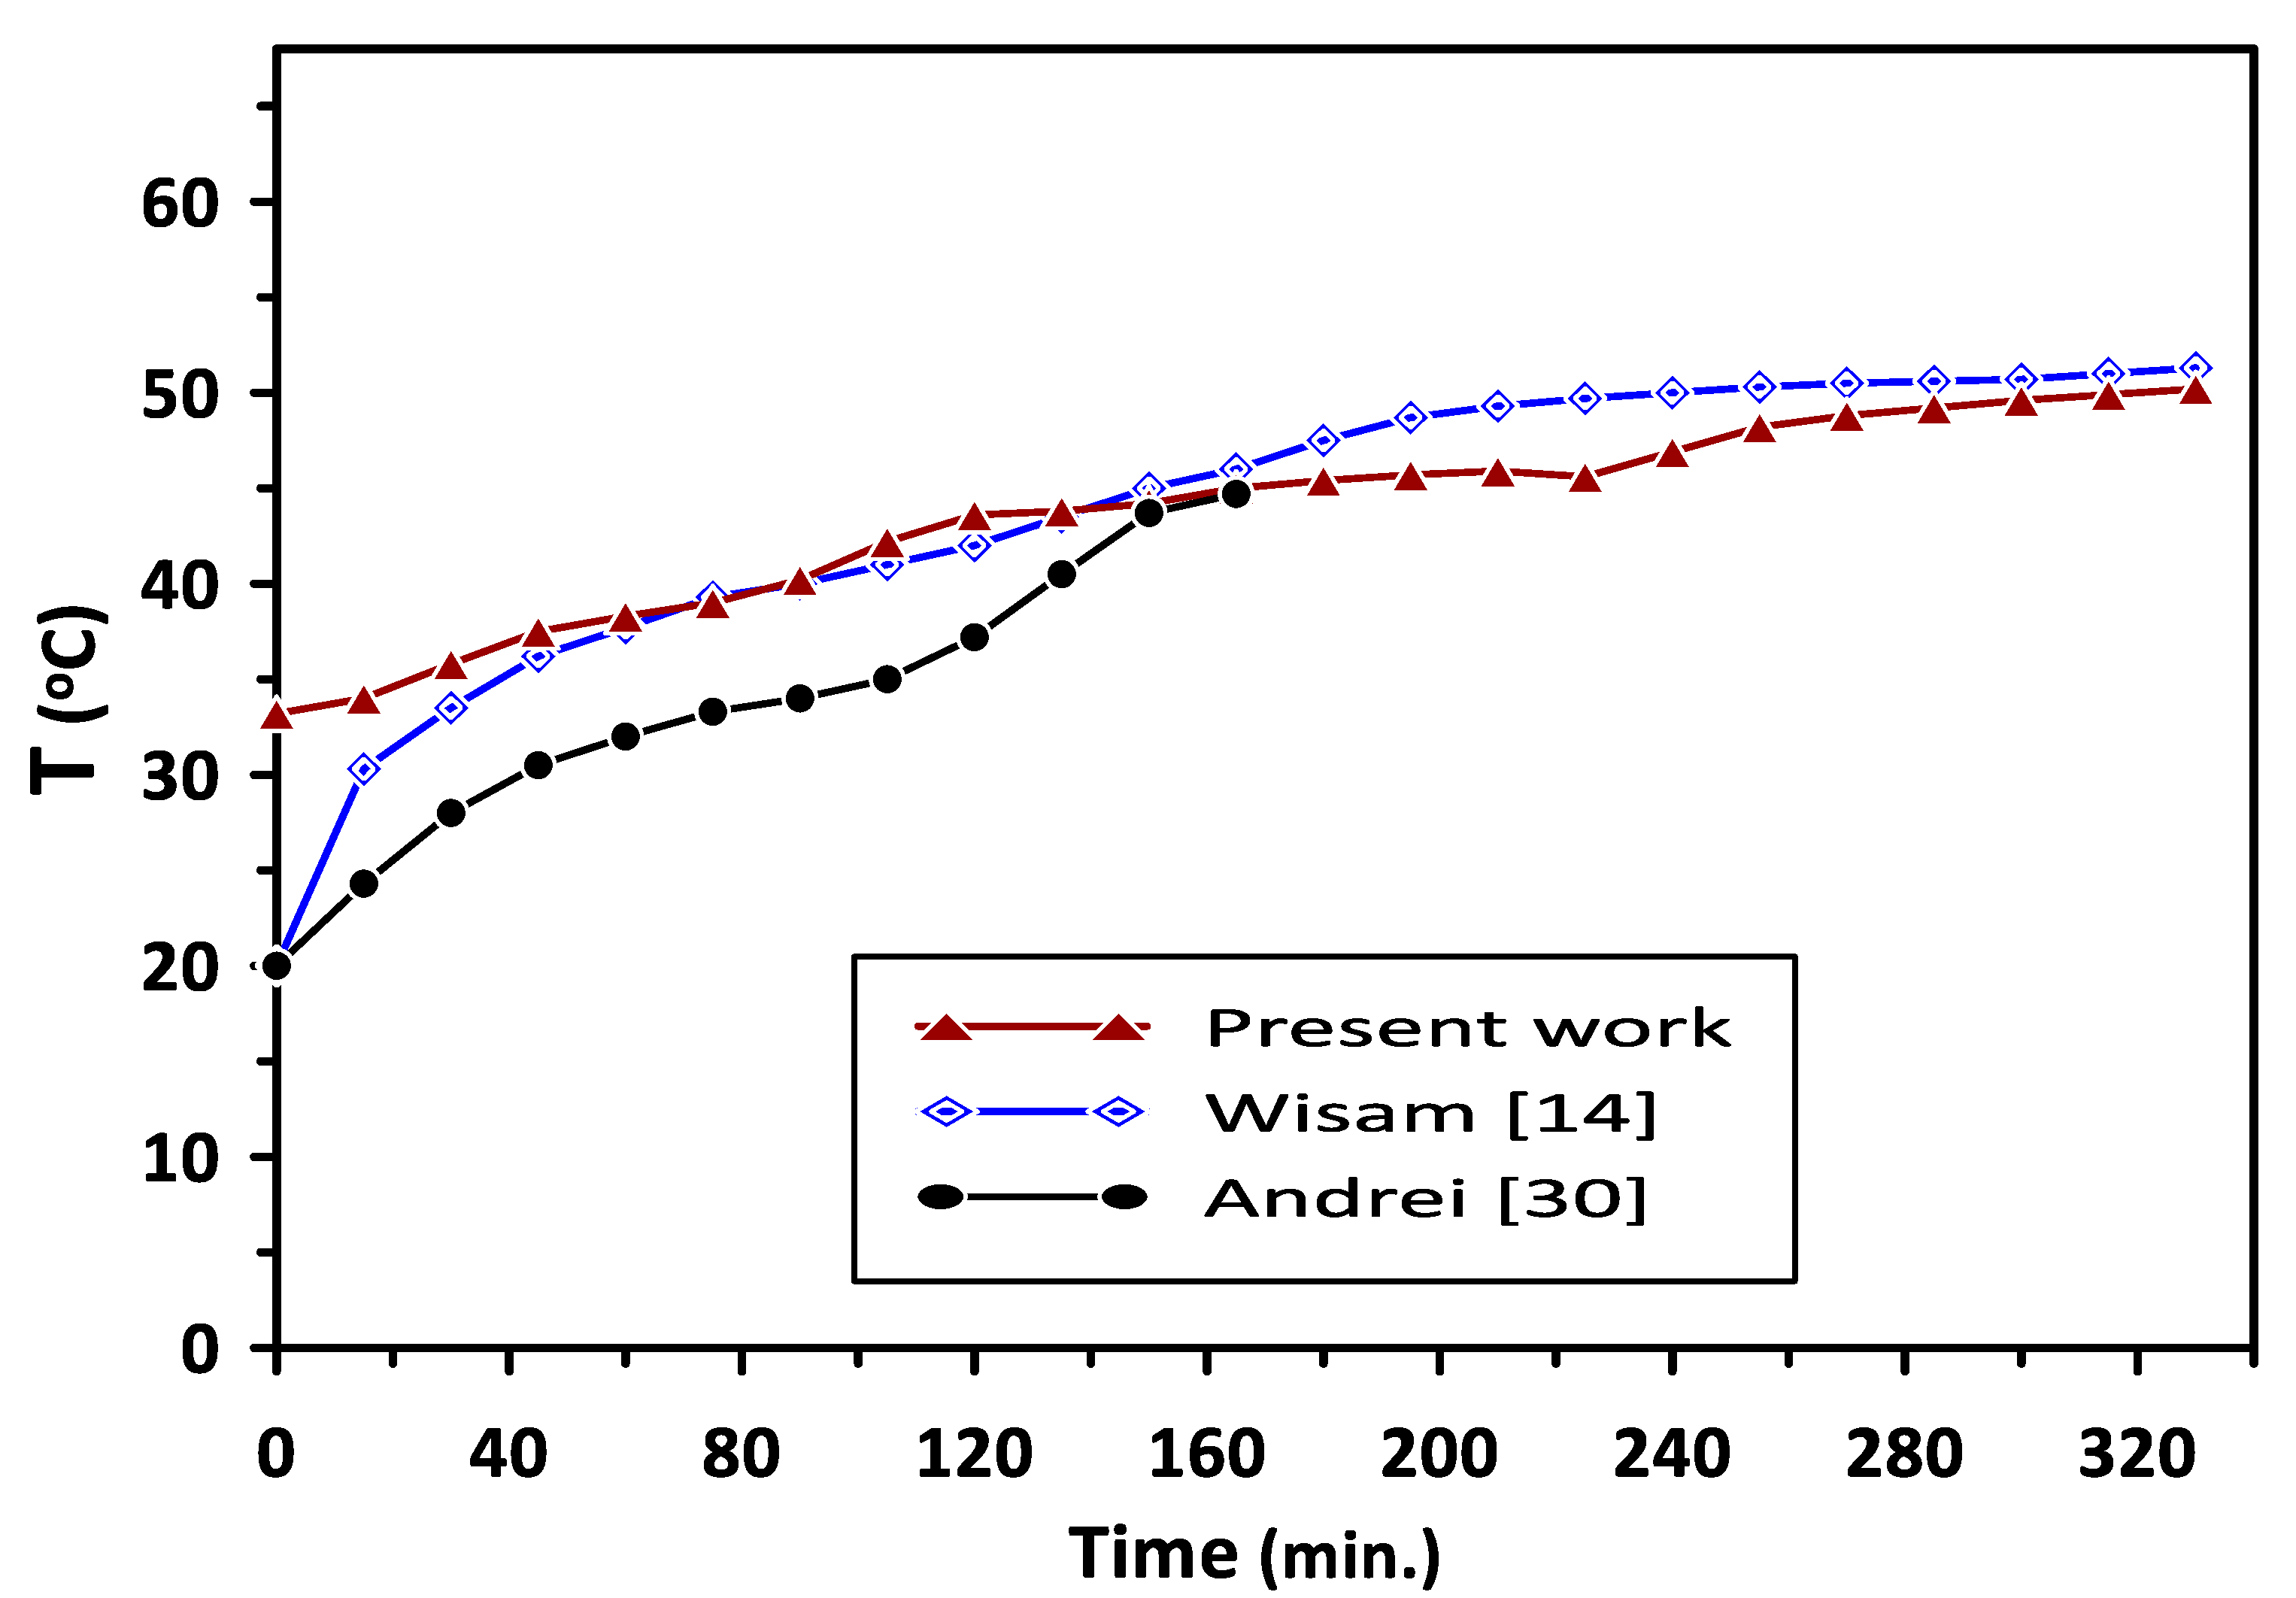
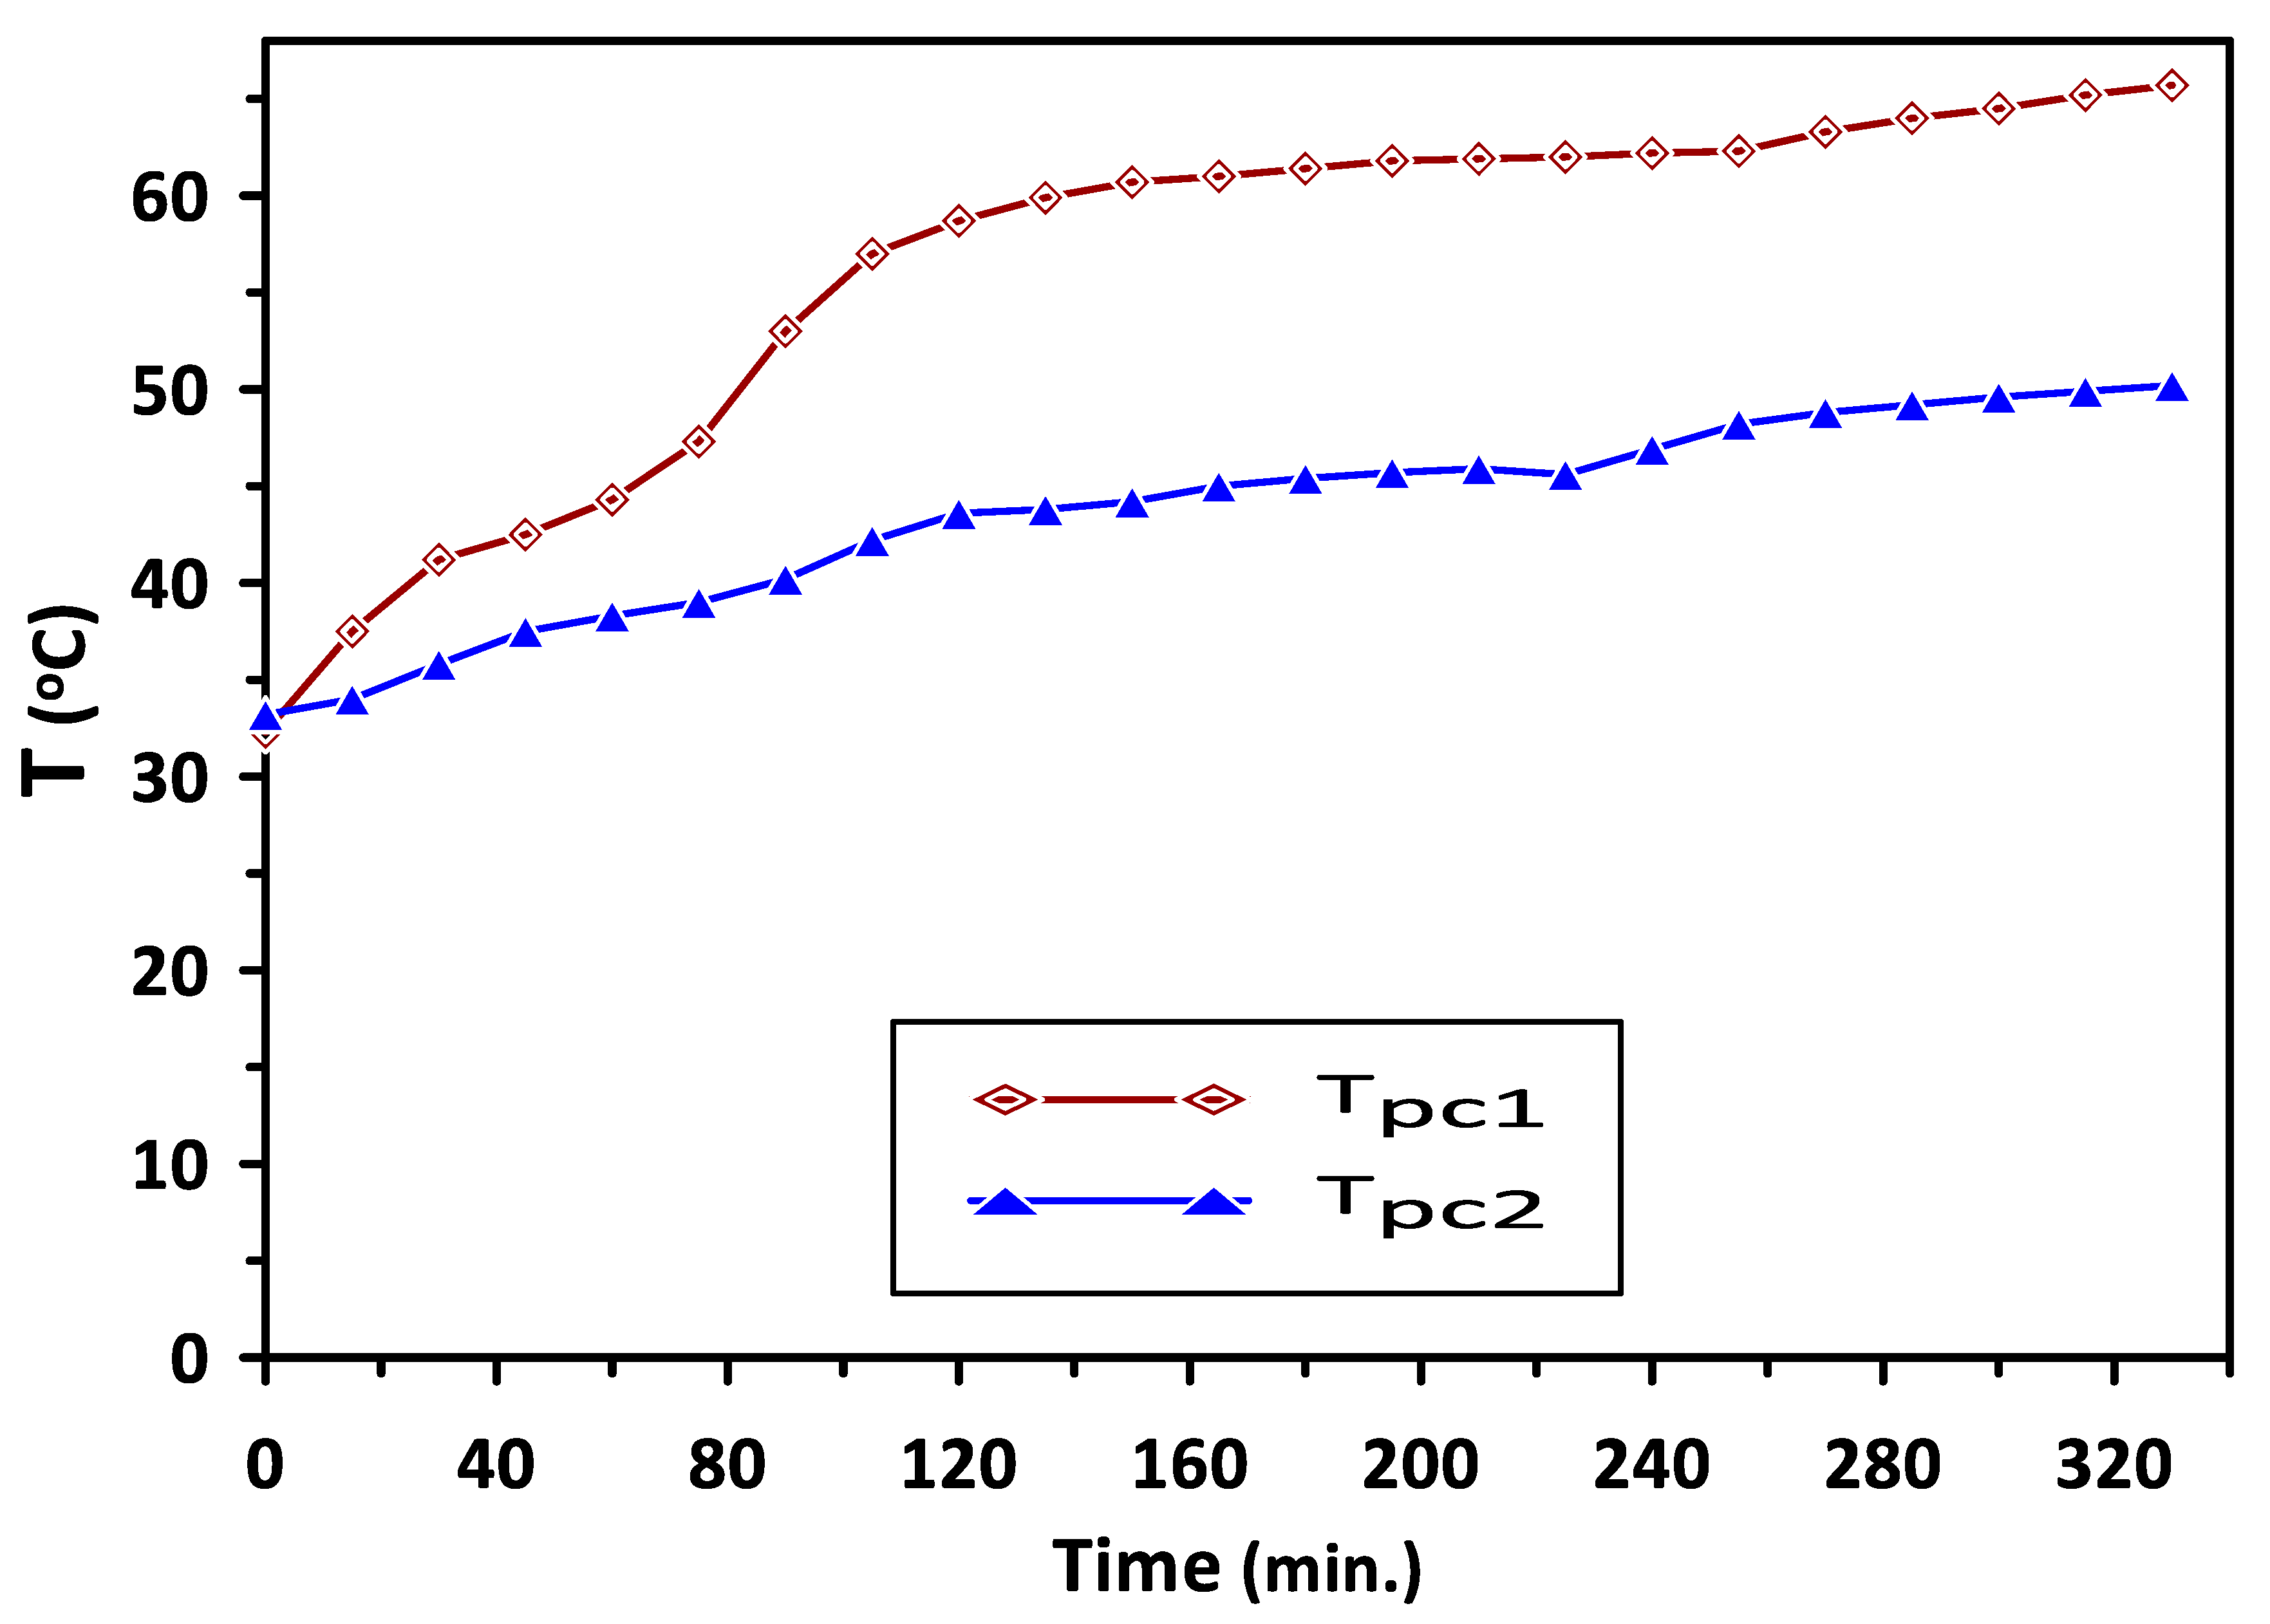
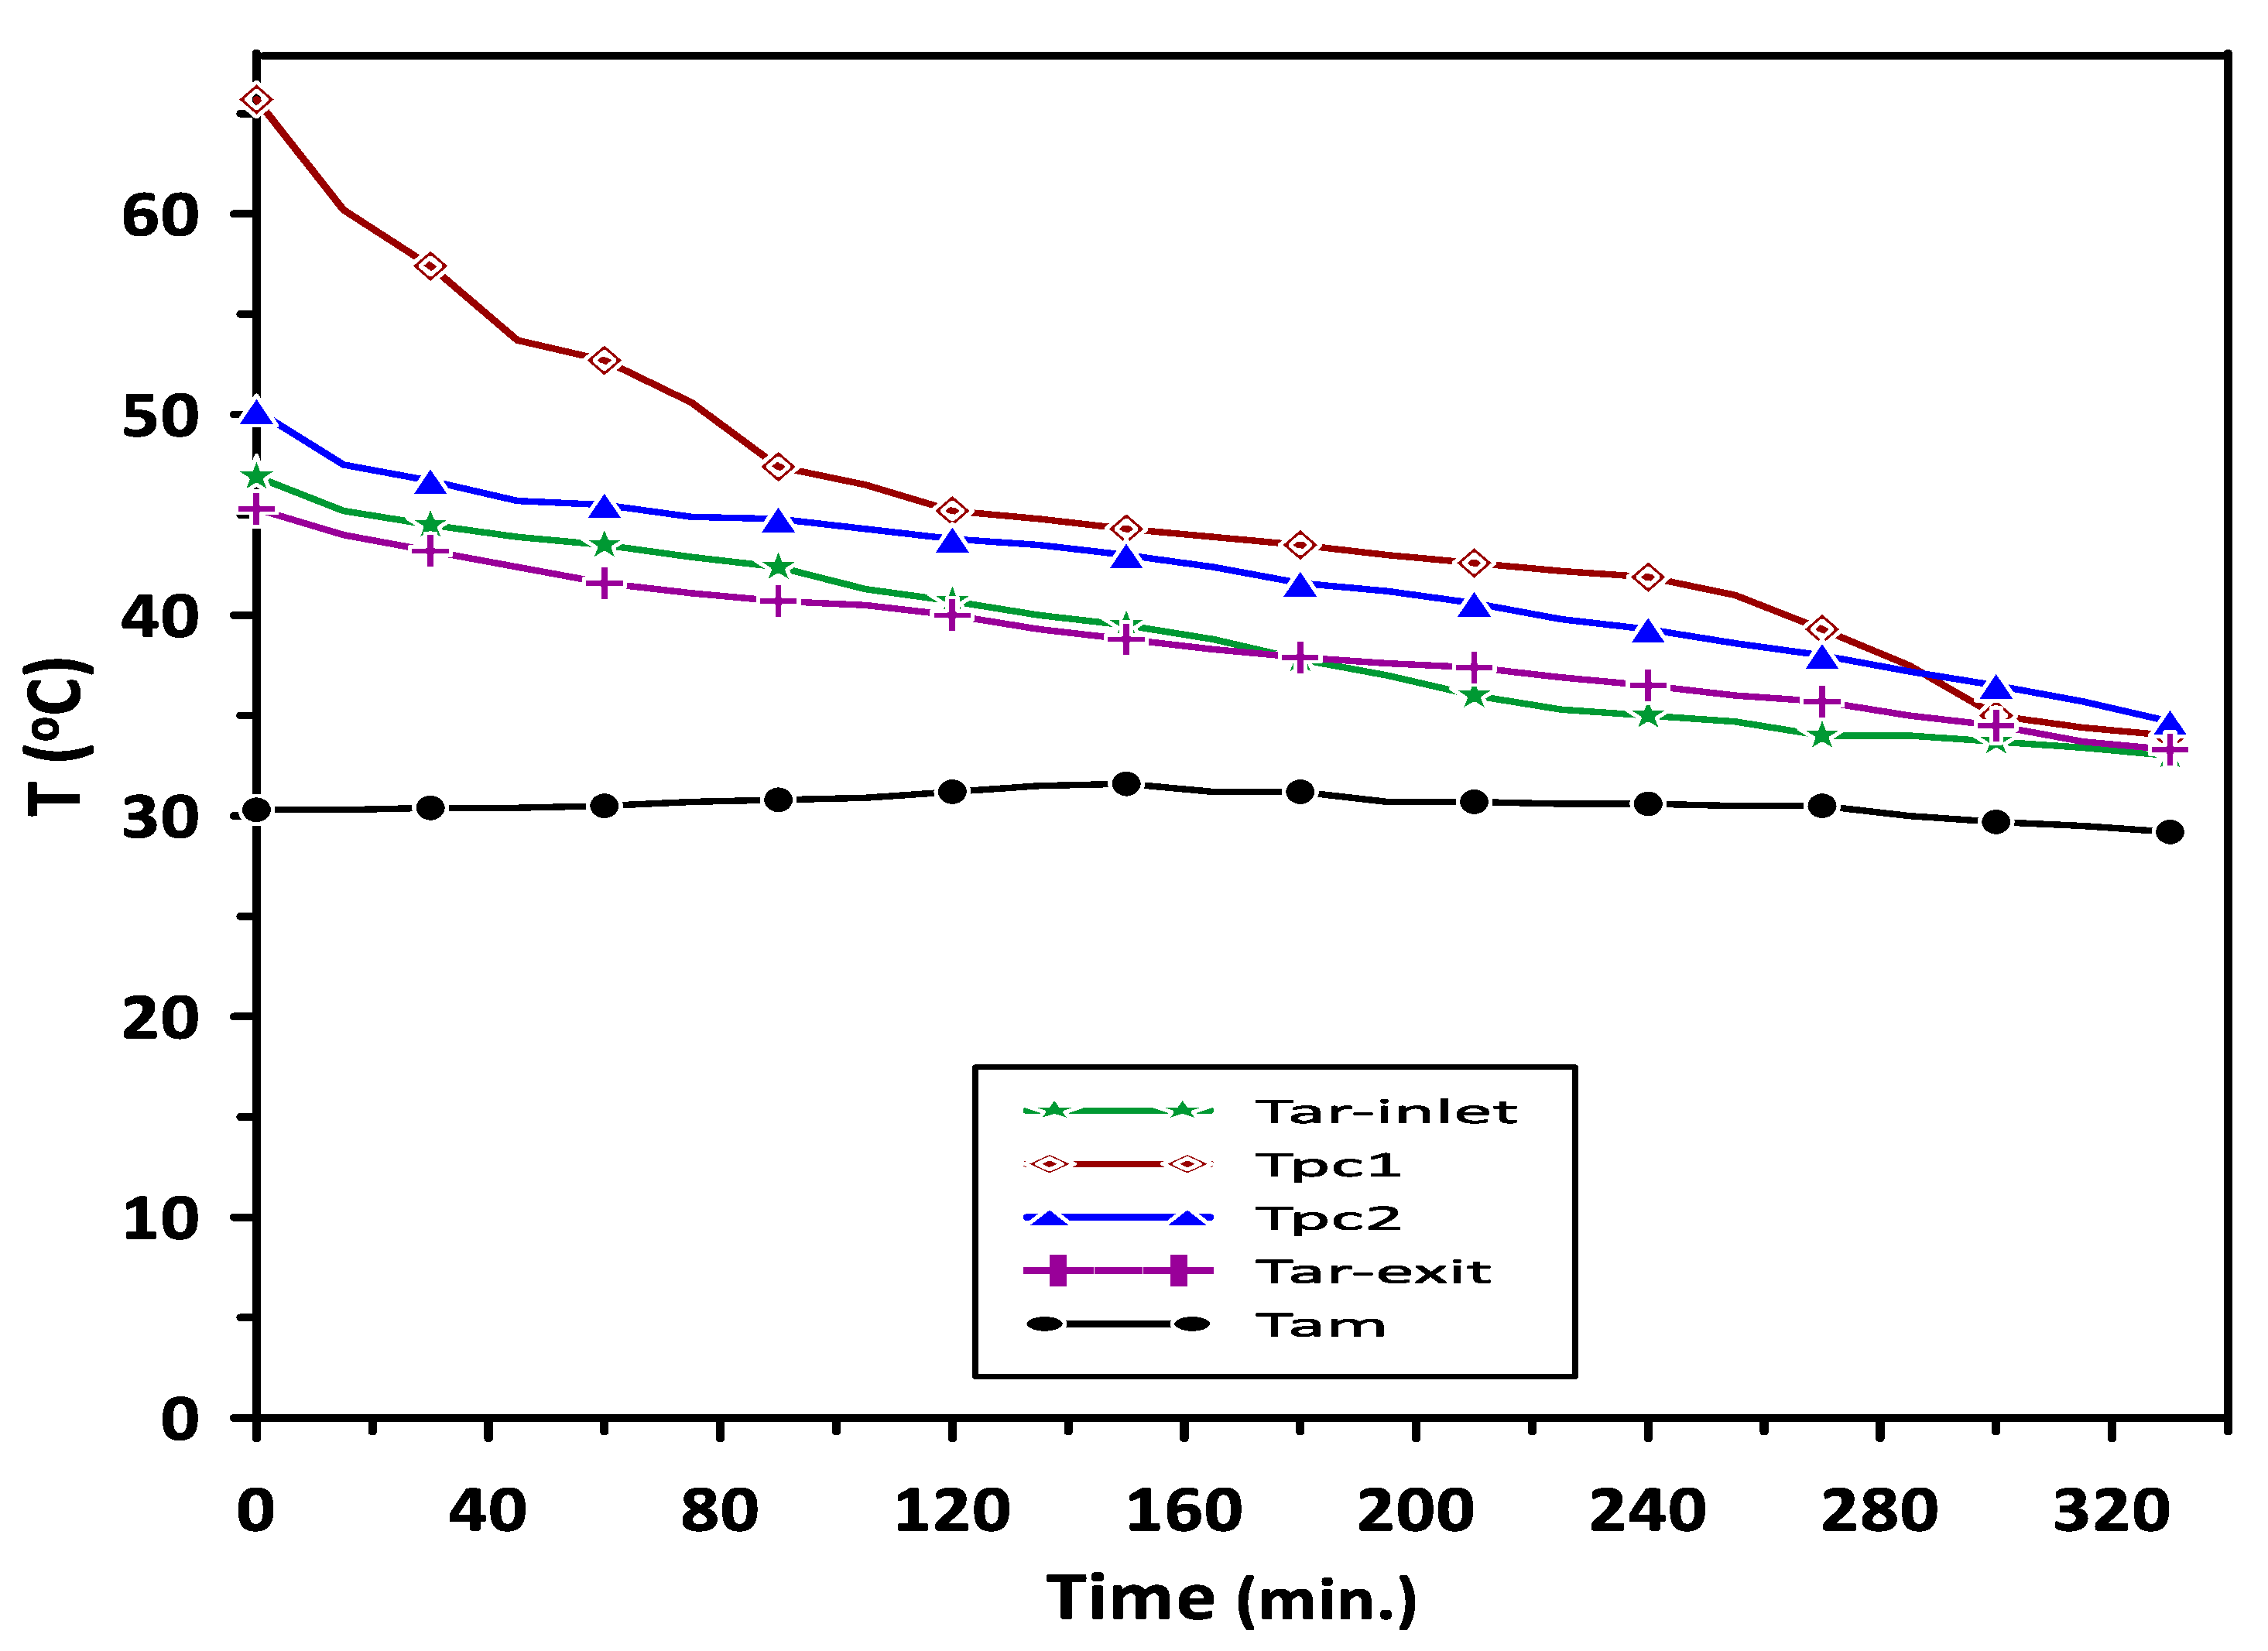
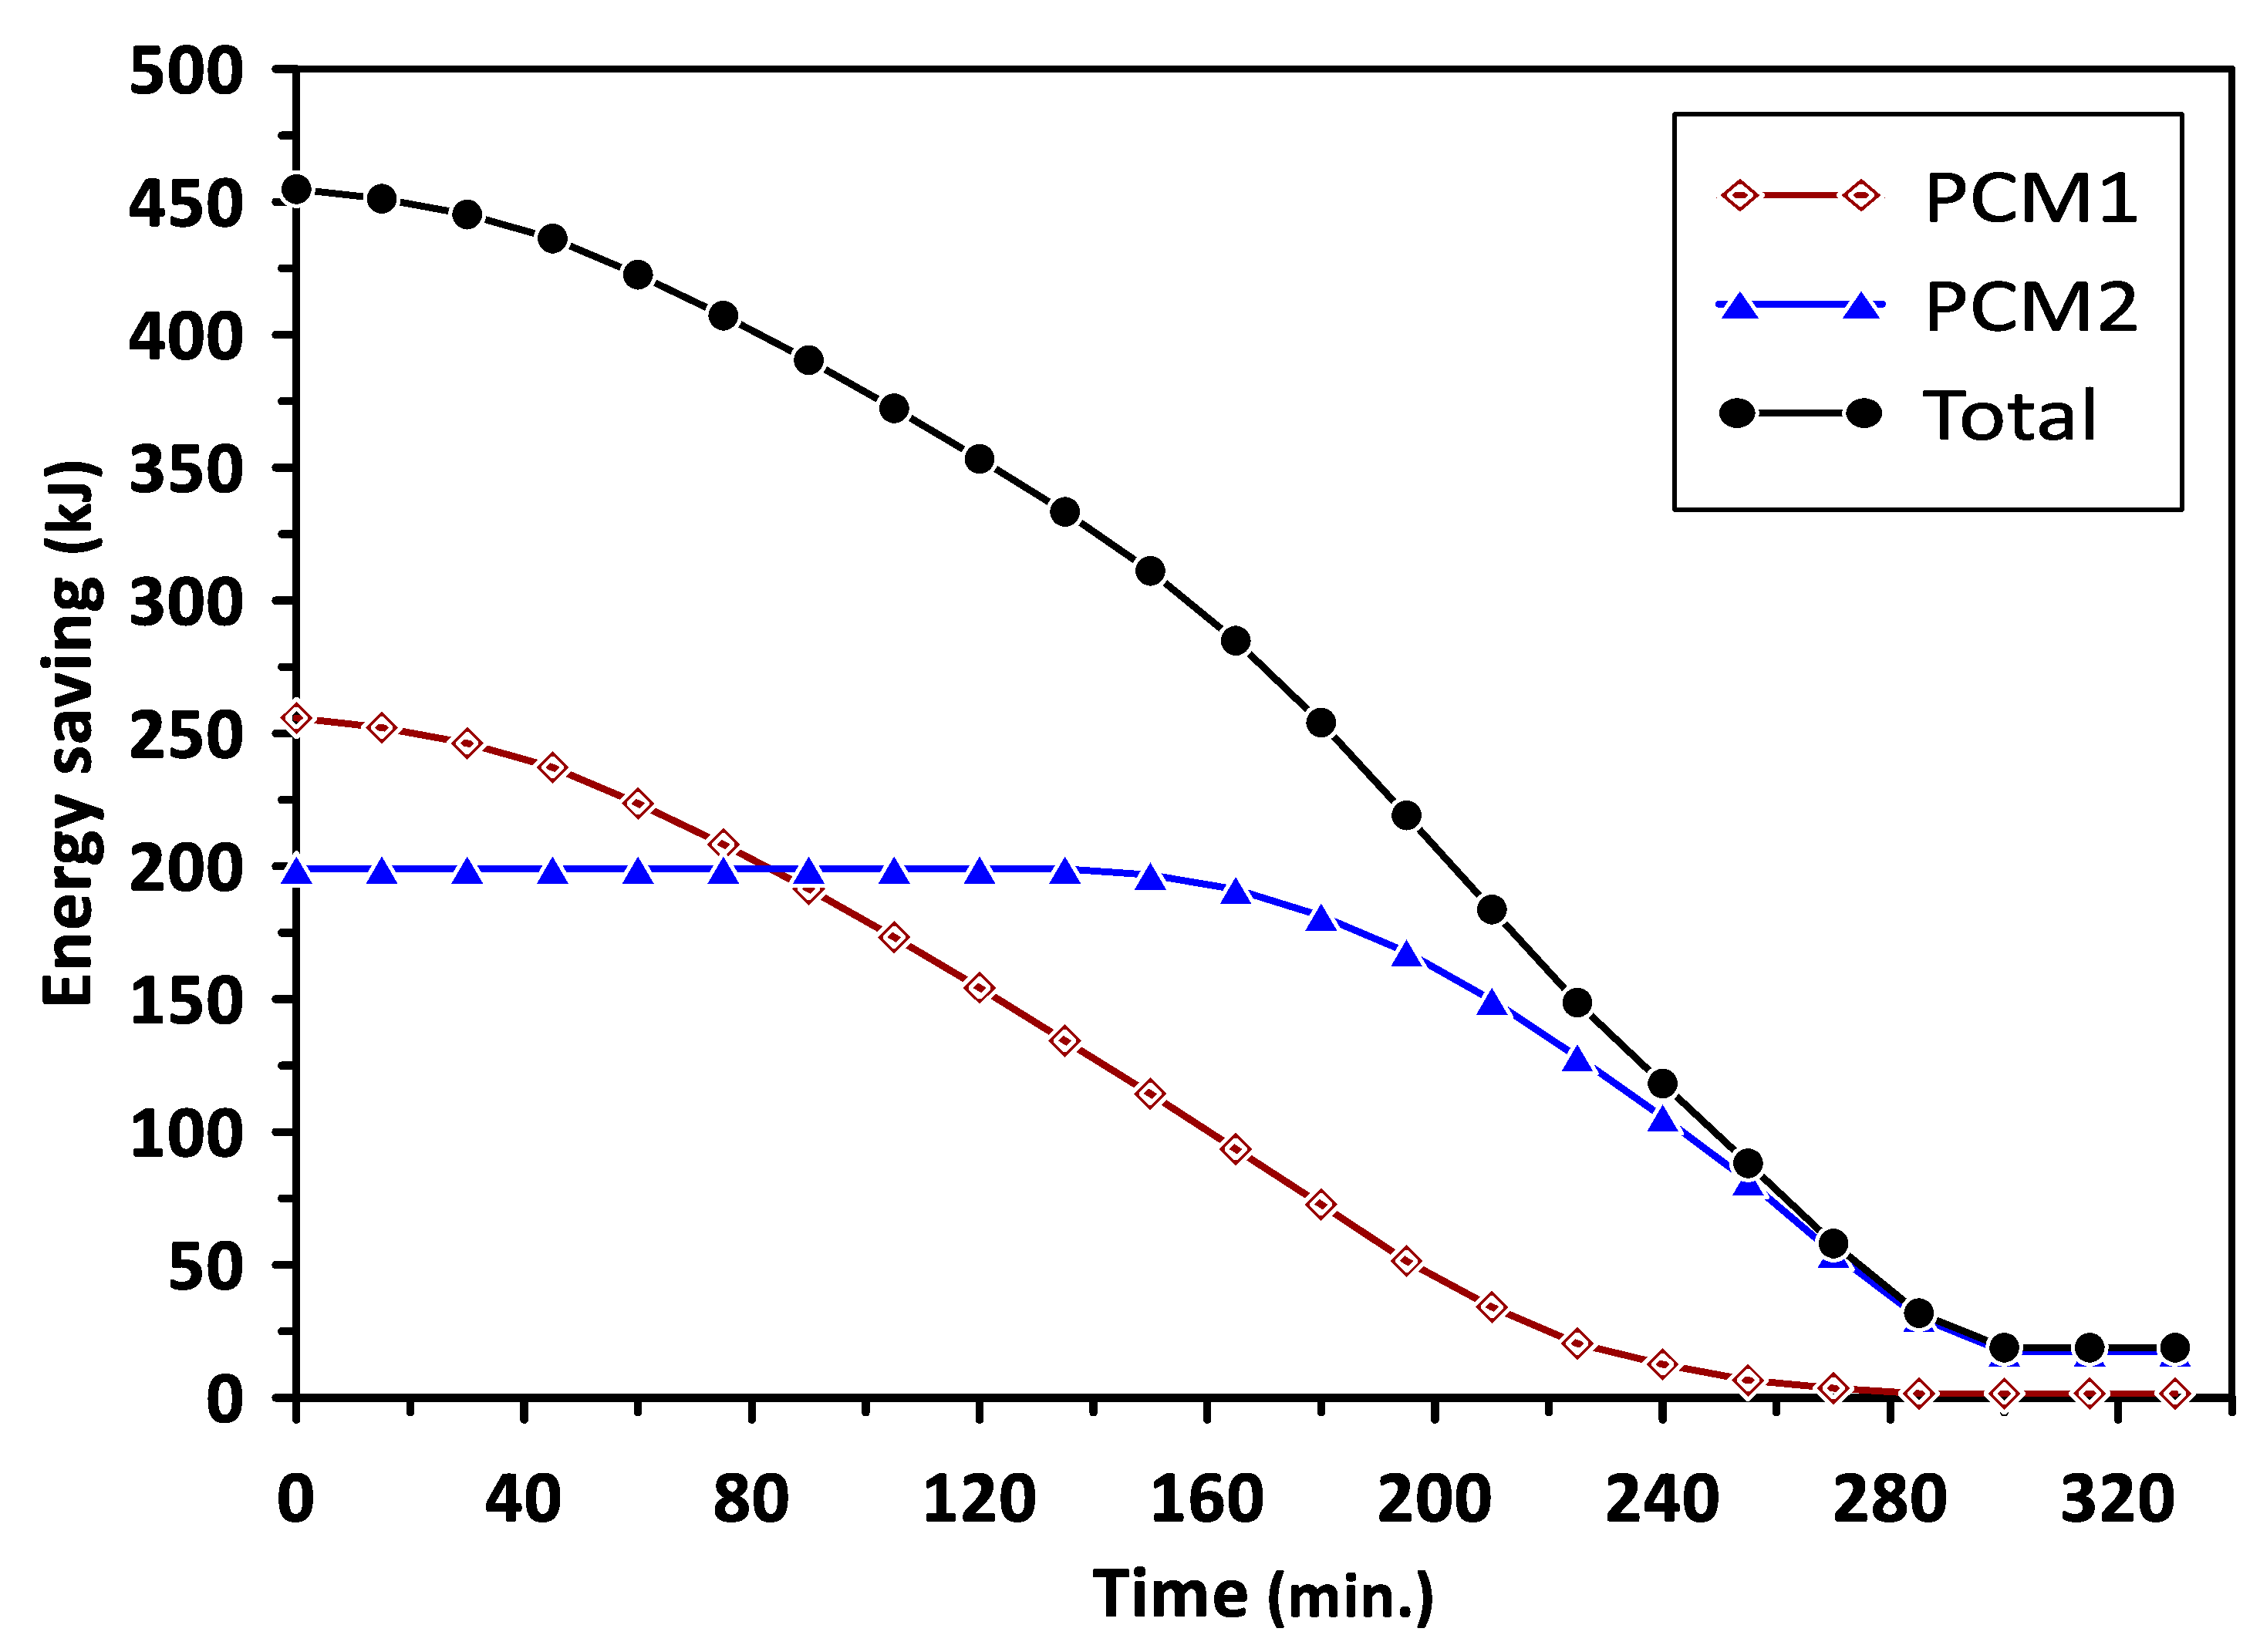
3. Results and Discussion

The results of the three testing cases were considered in the current study to investigate the energy saving and characteristics of PCMs used in the air heating systems. The first test was conducted using PCM1 alone in the air duct to store the excess heat energy during the melting process in the charging cycle when air was supplied at 65 °C. The stored energy was released to the air flowing into the duct at ambient temperature (29–31 °C) in the discharging cycle. The second test was conducted using PCM2 alone in the room model to minimize the fluctuations in room air temperature and energy saving during charging and discharging cycles. In the third case, both PCM1 and PCM2 were used for the same purpose and for the comparison of results. The duct inlet air temperature was maintained at a steady value of 65 °C, while the air temperature of the room model was controlled to be in the range of 35–40 °C. This temperature range is desired in the air heaters and food products drying systems to simulate the output air temperature of solar air heaters working under Iraqi conditions (33.2232° N, 43.6793° E). The solidification steps for 50 g of PCM1 (paraffin wax) and PCM2 (RT–42) heated to 65 °C and cooled at ambient air temperature (Tam = 30.6 °C) are shown in Figure 4. This test was conducted to determine the melting points of PCMs during the discharging cycle under the current work’s operating conditions. It can be observed for the PCMs at the liquid phase (65 °C) that the temperatures of complete solidification were in the ranges of 43–45 °C and 35–37 °C for PCM1 and PCM2, respectively.
Variations in the temperatures of PCM1 and PCM2 with time during the charging cycle at a duct inlet air temperature of 65 °C are shown in Figure 5. A constant trend in the temperatures can be observed in Figure 4 at 60 °C and 43 °C during the periods of 140–260 min and 120–220 min for PCM1 and PCM2, respectively. This behavior of the PCMs as energy storage materials can be attributed to the difference in the heat capacity based on various latent heats of fusion for these PCMs. Complete melting occurred during the charging cycle occurred at temperatures in the ranges of (57–60 °C) and (38–43 °C) for PCM1 and PCM2, respectively, which are identical to the reported PCMs melting–solidification results. A similar trend in the solidification temperatures of the PCM1 and PCM2 can be observed in Figure 6, which shows the variations in the temperatures of PCM1 and PCM2 with time during the discharging cycle at ambient air temperature of 30 °C. A steeper trend for the reduction in the temperatures can be seen before the discharging times of 80 min and 160 min for PCM1 and PCM2, respectively, due to the decrease in sensible heat of PCMs occurring at these discharge periods.
The complete melting and solidification of PCM1 and PCM2 during the charging and discharging cycles are illustrated in Figure 7. Variations in PCMs and room model air temperatures with the time during the discharging cycle are depicted in Figure 8. The results have revealed steady values of PCMs, room inlet and exit air temperatures for the period from 120 to 240 min. A significant increase of about 26% can be seen in room inlet and exit air temperatures compared with the ambient temperature of 30 °C due to the PCMs energy saving.
Figure 9 shows the variations in the room model air temperature with time for four cases: without the use of PCMs, with PCM1 alone, with PCM2 alone and with both PCM1 and PCM2 during the discharge cycle. In the current study, the set point air temperature of the room model was set to be in the range of 35–40 °C, which is suitable for air heating applications in the air conditioning systems and food products indirect solar dryers. It can be observed that, in the case of using a single phase change material, PCM1 or PCM2, the room air temperature was higher than that without PCMs but with undesired fluctuations in the temperature range between 23 °C and 47 °C. In the case of using both PCM1 and PCM2 during a relatively low heat energy supply in the discharge cycle, PCM1 provided heat to increase the air temperature in the duct to about 47 °C. The second material PCM2 worked to control the room temperature by minimizing the fluctuations in the air temperature and stabilizing its value in the range of 35–45.2 °C. The room’s average temperature was about 39.2 °C, which is desired in the air heating application. This behavior is attributed to the effect of PCM2, which works as excess heat energy storage when the room air temperature is higher than 40 °C and releases energy below the set room temperature (35–40 °C). The augmentation in the discharging time during energy release and improvement in the room air temperature when using multiple PCMs were about 28.4% higher than those without the use of PCMs.
The variations in the energy saving of PCM1 and PCM2 with the charging time are illustrated in Figure 10. The energy saving represents the excess heat energy stored by PCMs during the melting process in the charging cycle. It can be observed that PCM1 started to store the excess energy after a charging time of 130 min, reaching about 250 kJ. The energy saving beyond this time was maintained at a steady value due to the influence of PCM1 latent heat of fusion during the phase change period. Similar behavior could be seen for PCM2 after the charging time of 110 min with steady energy savings of 200 kJ. The total energy saving for PCM1 and PCM2 was about 450 kJ during a charging time of 240 min. Figure 11 shows the variations in the energy saving of PCM1 and PCM2 with the discharging time. During the discharging (solidification) cycle, the energy stored in the PCMs was released to increase the air temperature in the duct and room model; thus, there was a continued reduction in the energy saved by PCMs with the discharging time. The total energy saving in the case of using multiple PCMs was higher by about 29.5% and 46.7% than that achieved when using PCM1 and PCM2 alone, respectively. It can be concluded from the obtained results that multiple PCMs revealed higher energy saving and thermal stability for the considered air heating system. The discharging time required to provide the energy and maintain the room model temperature at the desirable value (35–40 °C) in the case of multiple PCMs was extended to 330 min compared with 240 min and 200 min for PCM1 and PCM2, respectively.
The present study’s results were validated with the reported experimental results of Wisam et al. [14] and Andrei et al. [30] during the PCM melting process, as shown in Figure 12. The comparison was based on results of PCM2 (RT–42) with a melting point of (38–43 °C) in the current study and the work of Wisam et al. [14], while the results of PCM- RT35 with a melting point of (31–36 °C) were considered in the comparison with the results of Andrei et al. [30]. A similar trend in the current study’s results of temperature variation with charging time can be observed in Figure 12, with average deviations of 3.4% and 17.6% when compared with the results of Wisam et al. [14] and Andrei et al. [30], respectively. The deviations in the results can be attributed to some differences in the compared works’ operating conditions.

4. Conclusions

The characteristics and energy savings of multiple phase change materials subjected to internal flow in an air heating system during the charging and discharging cycles are investigated in the present study. The experimental work was conducted using a test rig consisting of two main parts, an air supply duct and a room model equipped with PCMs panels. Investigation of the results was based on three cases using single phase change materials PCM1 and PCM2 in the first and second cases, respectively, while in the third case, both PCM1 and PCM2 were used. The obtained results demonstrate a significant improvement in the energy saving and room model temperature control for the air heating system incorporating two PCMs compared with that of a single PCM. The complete melting during the charging cycle occurred at temperatures in the ranges of 57–60 °C and 38–43 °C for PCM1 and PCM2, respectively, which are identical to the reported experimental results. Using multiple PCMs maintained the room’s air temperature at a steady value by minimizing the air temperature fluctuations and stabilizing its value in the range of 35–45.2 °C, which is desirable in air heating applications. The total energy saving in the case of using two PCMs was higher by about 29.5% and 46.7% than that of PCM1 and PCM2, respectively. The augmentation in the discharging time and improvement in the room model air temperature when using two PCMs were about 28.4% higher than those without the use of PCMs.

Funding

This research received no external funding.

Institutional Review Board Statement

The study was conducted according to the guidelines of the Declaration of Helsinki, and approved by the Institutional Review Board.

Informed Consent Statement

Informed consent was obtained from all subjects involved in the study.

Conflicts of Interest

The author declares no conflict of interest.

Nomenclature

Cpaair specific heat (J/kg °C)
Cppc1PCM1specific heat (J/kg °C)
Cppc2PCM2 specific heat (J/kg °C)
m a . air mass flow rate (kg/s)
mAlmass of the aluminum sheets for PCM panels (kg)
mpc1mass of PCM1 (kg)
mpc2mass of PCM2 (kg)
Q1cheat energy gained by PCM1 at charging cycle (J)
Q2cheat energy gained by PCM2 at charging cycle (J)
Q1dheat energy released from PCM1 at discharging cycle (J)
Q2dheat energy released from PCM2 at discharging cycle (J)
qpc1latent heat of fusion of PCM1 (J/kg)
qpc2latent heat of fusion of PCM2 (J/kg)
Tamambient temperature (°C)
Ta1air temperature at inlet of heating coil (°C)
Ta2air temperature at inlet of PCM1 panels (°C)
Ta3air temperature at exit of PCM1 panels (°C)
Ta4air temperature at room model exit (°C)
Tarmean room model air temperature (°C)
Tariinitial room model air temperature at the start of the charging cycle (°C)
Tarffinal room model air temperature at the end of the charging cycle (°C)
Tarsset point air temperature of the room model (°C)
Tpc1Mmelting temperature (melting point) of PCM1 (°C)
Tpc2Mmelting temperature (melting point) of PCM2 (°C)
Tpc1Ltemperature of PCM1 at liquid phase (°C)
tchcharging time of PCM (s)
tdcdischarging time of PCM (s)
Abbreviations
PCM1first phase change material
PCM2 second phase change material

References

  1. Nidal, H.A.; Khaled, A.A. Assessment of thermal performance of PCM in latent heat storage system for different applications. Sol. Energy 2019, 177, 317–323. [Google Scholar]
  2. Vivek, R.; Goswami, T.K. Use of phase change material (PCM) for the improvement of thermal performance of cold storage. Med. Crave MOJ Curr. Res. Rev. 2018, 1, 49–61. [Google Scholar]
  3. Lubna, A.N.; Tahseen, A.A.; Majid, I. Abdulwahab, Study of the Performance of Paraffin Wax as a Phase Change Material in Packed Bed Thermal Energy Storage system. Iraqi J. Chem. Petr. Eng. 2016, 17, 25–33. [Google Scholar]
  4. Rami, M.R. Advancement in Thermal Energy Storage Using Phase Change Materials. Ph.D. Thesis, Scholars’ Mine, a Service of the Missouri S&T Library and Learning Resources, Rolla, MO, USA, 2018. Available online: https://scholarsmine.mst.edu/doctoral_dissertations/2687 (accessed on 15 July 2021).
  5. Muhammad, S.M.; Naveed, I.; Abdul, W.; Khan, M.O.; Asghar, M.U.; Khan, S.; Khurshaid, T.; Kim, K.-C.; Rehman, Z.; Rizvi, S.T. Design and fabrication of solar thermal energy storage system using potash alum as a PCM. Energies 2020, 13, 6169. [Google Scholar]
  6. Li, Y.; Wang, J.; Yang, L.; Sundén, B. Heat-Dissipation Performance of Nanocomposite Phase-Change Materials in a Twin-Heat-Source System. Fluids 2020, 5, 174. [Google Scholar] [CrossRef]
  7. Dutkowski, K.; Kruzel, M.; Zajączkowski, B. Determining the Heat of Fusion and Specific Heat of Microencapsulated Phase Change Material Slurry by Thermal Delay Method. Energies 2021, 14, 179. [Google Scholar] [CrossRef]
  8. Nada, S.A.; Alshaer, W.G.; Saleh, R.M. Thermal characteristics and energy saving of charging/discharging processes of PCM in air free cooling with minimal temperature differences. Alex. Eng. J. 2019, 58, 1175–1190. [Google Scholar] [CrossRef]
  9. Salah, M.S.; Jalal, M.J.; Saleh, E.N. Double-Pass Solar air Heater (DP-SAH) utilizing Latent Thermal Energy Storage (LTES). IOP Conf. Ser. Mater. Sci. Eng. 2019, 518, 032038. [Google Scholar] [CrossRef]
  10. Salah, M.S.; Jalal, M.J.; Saleh, E.N. Experimental and numerical analysis of double-pass solar air heater utilizing multiple capsules PCM. Renew. Energy 2019, 143, 1053–1066. [Google Scholar] [CrossRef]
  11. Martin, Z.; Lubomír, K.; Pavel, C. Design optimization of a solar air collector integrating a phase change material. Chem. Eng. Trans. 2020, 81, 211–216. [Google Scholar]
  12. Ramin, M.; Ali, K.; Somchai, W. Optimization of a solar air heater with phase change materials: Experimental and numerical study. Exp. Therm. Fluid Sci. 2017, 89, 41–49. [Google Scholar]
  13. Alkilani, M.M.; Sopian, K.; Sohif, M.; Alghoul, M.A. Output Air Temperature Prediction in a Solar Air Heater Integrated with Phase Change Material. Eur. J. Sci. Res. 2009, 27, 334–341. [Google Scholar]
  14. Abishek, G.; Sudhakar, P. Experimental Investigation of Phase Change Material Based Thermal Storage System for Solar Dryer Applications. Int. J. Pure App. Math. 2017, 117, 331–343. [Google Scholar]
  15. Peter, O.; Cornelia, B. Investigating and modeling of simultaneous charging and discharging of a PCM heat exchanger. Energy Procedia 2014, 48, 413–422. [Google Scholar]
  16. Wisam, A.D.; Nabeel, S.D.; Tahseen, A.A. Experimental Investigation of the Horizontal Double Pipe Heat Exchanger Utilized Phase Change Material. IOP Conf. Ser. Mater. Sci. Eng. 2020, 671, 012148. [Google Scholar]
  17. Mao, Q.; Liu, N.; Peng, L. Numerical Investigations on Charging/Discharging Performance of a Novel Truncated Cone Thermal Energy Storage Tank on a Concentrated Solar Power System. Int. J. Photoenergy 2019, 17, 1609234. [Google Scholar]
  18. Arena, S.; Cau, G.; Palomba, C. CFD Simulation of Melting and Solidification of PCM in Thermal Energy Storage Systems of Different Geometry. J. Phys. Conf. Ser. 2015, 655, 012051. [Google Scholar] [CrossRef]
  19. Kumaresan, G.; Santosh, R.; Revanth, H.; Raju, G.; Bhattacharyya, S. CFD and Experimental analysis of phase change material behavior encapsulated in internally finned spherical capsule. E3S Web Conf. 2019, 128, 01002. [Google Scholar] [CrossRef]
  20. Mehdi, F.; Amel, A. Latent Heat Storage during Melting and Solidification of a Phase Change Material (PCM) Embedded with a Porous Matrix of High Thermal Conductivity. Int. J. Energy Eng. 2020, 10, 1–9. [Google Scholar]
  21. Dermardiros, V.; Chen, Y.; Athienitis, A.K. Modelling of an active PCM thermal energy storage for control applications. Energy Procedia 2015, 78, 1690–1695. [Google Scholar] [CrossRef] [Green Version]
  22. Giovannelli, A.; Bashir, M.A. Charge and Discharge Analyses of a PCM Storage System Integrated in a High-Temperature Solar Receiver. Energies 2017, 10, 1943. [Google Scholar] [CrossRef] [Green Version]
  23. Sreerag, T.S.; Jithish, K.S. Experimental investigations of a solar dryer with and without multiple phase change materials (PCM’s). World J. Eng. 2016, 13, 210–217. [Google Scholar] [CrossRef]
  24. Taha, K.A.; Muhammad, M.R. Comparison between single-PCM and multi-PCM thermal energy storage. Energy Conv. Manag. 2014, 83, 79–87. [Google Scholar]
  25. Mosaffa, A.H.; Infanta, C.A.; Talati, F.; Rosen, M.A. Thermal performance of multiple PCM thermal storage unit for free cooling. Energy Conv. Manag. 2013, 67, 1–7. [Google Scholar] [CrossRef]
  26. Touati, B.; Kerroumi, N.; Virgone, J. Solar thermal energy discharging from a unit contains multiple phase change materials. In Proceedings of the 8th International Renewable Energy Congress, (IREC 2017), Amman, Jordan, 21–23 March 2017. [Google Scholar] [CrossRef]
  27. Ming, F.; Guangming, C. Effects of different multiple PCMs on the performance of a latent thermal energy storage system. Appl. Therm. Eng. 2007, 27, 994–1000. [Google Scholar]
  28. Rohit, K.; Sahu, S.K.; Kundalwal, S.I.; Sahu1S. Comprehensive analysis of melting and solidification of a phase change material in an annulus. Heat Mass Trans. 2018, 55, 769–790. [Google Scholar] [CrossRef]
  29. Sameh, A.N.; Walid, G.A.; Ramy, M.S. Effect of phase change material plates’ arrangements on charging and discharging of energy storage in building air free cooling. Energy Storage 2020, 2, e142. [Google Scholar] [CrossRef]
  30. Ozioko, R.E.; Ogbonna, I.D.; Ugwu, K.C. Determination of the Melting Point of Paraffin Wax Using Temperature Variation Test Method. Am. J. Eng. Res. 2018, 7, 101–104. [Google Scholar]
  31. Shailendra, K.; Kishan, K.V. Charging-Discharging Characteristics of Macro Encapsulated Phase Change Materials in an Active Thermal Energy Storage System for a Solar Drying Kiln. Therm. Sci. 2017, 21, 2525–2532. [Google Scholar]
  32. Andrei, S.B.; Abdelouhab, L.; Cristiana, V.C.; Tiberiu, C.; Hassan, C.; Brahim, B. Experimental investigation of the charge/discharge process for an organic PCM macro encapsulated in an aluminium rectangular cavity. E3S Web Conf. 2018, 32, 01004. [Google Scholar] [CrossRef] [Green Version]
  33. Abduljalil, A.A.; Sohifa, M.; Sopian, K.; Sulaiman, M.Y.; Abdulrahman, T.M. Experimental study of melting and solidification of PCM in a triplex tube heat exchanger with fins. Energy Build. 2014, 68, 33–41. [Google Scholar]
  34. Ajay, M.N.; Vinod, K.N. Comparison of Charging and Discharging Period Analysis of Phase Change Materials-Paraffin Wax and Myristic Acid. Int. J. Curr. Eng. Technol. 2018, 8, 44–47. [Google Scholar]
  35. Abdullah, N.O.; Ahmed, A.; Ayman, A. Studying the Stability of Melting and Solidification Behavior of Phase Change Material. J. App. Res. Indus. Eng. 2017, 4, 192–198. [Google Scholar]
  36. Kanimozhi, B.; Kasilanka, H.; Bellamkonda, S.T.; Pogaku, S.R.; Padakandla, S.S. Charging and Discharging Processes of Thermal Energy Storage System Using Phase change materials. IOP Conf. Ser. Mater. Sci. Eng. 2017, 197, 012040. [Google Scholar] [CrossRef] [Green Version]
  37. Kaviarasu, C.; Prakash, D. Review on Phase Change Materials with Nanoparticle in Engineering Applications. J. Eng. Sc. Tech. Rev. 2016, 9, 26–386. [Google Scholar] [CrossRef]
Figure 1. Schematic diagram of the experimental setup.
Fluids 06 00275 g001
Figure 2. Longitudinal section illustrating the main parts of the experimental setup.
Fluids 06 00275 g002
Figure 3. Encapsulated PCM rectangular aluminum panels: (a) PCM1 and (b) PCM2.
Fluids 06 00275 g003
Figure 4. Solidification steps for 50 g of PCM1 (Tpr) and PCM2 (TRT) heated to 65 °C and cooled at ambient air temperature (Tam = 30.6 °C).
Fluids 06 00275 g004
Figure 5. Variations in PCM1 and PCM2 temperatures with time during the charge cycle at duct inlet air temperature of 65 °C.
Fluids 06 00275 g005
Figure 6. Variations in PCM1 and PCM2 temperatures with time during the discharge cycle at ambient air temperature of 30 °C.
Fluids 06 00275 g006
Figure 7. Complete melting and solidification of PCM1 and PCM2 during the charging and discharging cycles.
Fluids 06 00275 g007
Figure 8. Variations in PCMs and room model air temperatures with the time during the discharging cycle at ambient temperature of 30 °C.
Fluids 06 00275 g008
Figure 9. Air temperature variation in the room model with and without using PCMs during the discharging cycle.
Fluids 06 00275 g009
Figure 10. Energy saving of PCM1 and PCM2 during the charging cycle.
Fluids 06 00275 g010
Figure 11. Energy saving of PCM1 and PCM2 during the discharging cycle.
Fluids 06 00275 g011
Figure 12. Comparison of the present work’s results of the PCM2 temperature distribution during the melting process with the previous investigations.
Fluids 06 00275 g012
Table 1. Thermophysical properties of PCM1 and PCM2 [37].
PropertiesPCM1 (Paraffin Wax)PCM2 (RT–42)
Density
Melting Temperature
Latent Heat of Fusion
Specific Heat Capacity
Thermal Conductivity
810 kg/m3 (liquid)
910 kg/m3 (solid) 57 °C
204 kJ/kg
2.1 kJ/kg °C (liquid)
2 kJ/kg °C (solid)
0.25 W/m °C (liquid)
0.23 W/m °C (solid)
760 kg/m3 (liquid)
880 kg/m3 (solid)
38–43 °C
174 kJ/kg
2 kJ/kg °C
0.2 W/m °C
Publisher’s Note: MDPI stays neutral with regard to jurisdictional claims in published maps and institutional affiliations.

