1. Introduction
A local decrease in pressure of a liquid due to the propagation of an acoustic wave can lead to the formation of vapor–gas bubbles. This effect is called acoustic cavitation. Cavitation processes are accompanied by powerful hydrodynamic disturbances with microflows and microshockwaves. The physical and chemical effects of ultrasonic cavitation can be used to perform many tasks, such as initiating and accelerating chemical reactions [
1,
2,
3], enhanced oil recovery [
4], emulsification [
5,
6], surgical and medical procedures [
7,
8], sterilization of liquids [
9], isolation of biologically active substances from plant cells [
10,
11], etc.
Cavitation bubbles are formed in a liquid when negative pressure in the rarefaction phase of an acoustic wave reaches a certain threshold value. This threshold value varies depending on a combination of different parameters, such as hydrostatic pressure level, the temperature of the liquid, and rate of change in local pressure. One of the ways to generate an acoustic wave with a given rate and duration of local pressure change is by using ultrasonic exposure. The combination of frequency and amplitude of ultrasound allows selecting the required cavitation threshold for specific external conditions and liquid parameters.
Although numerous researchers have studied cavitation threshold theoretically, a reliable and generally accepted approach to assessing acoustic cavitation threshold has not yet been formed. For example, classical nucleation theory (CNT) [
12,
13,
14] is widely used to calculate the threshold of inception and the rate of nucleation of vapor–gas nucleus in liquids [
15,
16,
17]. According to CNT, the vapor–gas phase in a liquid can be nucleated in two conditions. One is when the pressure of the liquid drops below the pressure of the vapor–gas phase (cavitation). The second is when the liquid temperature rises above the saturated vapor temperature (boiling). The first method is more commonly used in research. Theoretical models of cavitation based on the CNT theory provide the best results that are qualitatively, and sometimes quantitatively, consistent with experimental data. However, CNT is still only an approximate theory.
Another common approach to calculating cavitation threshold is by modeling the dynamics of bubble boundaries with a given initial radius under acoustic influence [
18,
19]. Critical negative pressures for the inception of transient cavitation are estimated using Blake-type criteria [
20] with various changes, taking into account the characteristics of the liquid or the thermodynamic process involved. This approach also produces acceptable qualitative and quantitative results. However, it still needs improvement.
The topic of cavitation threshold continues to be the focus of many studies with various purposes. For instance, experimental study of the cavitation pressure in D
2O, ethanol, heptane, and DMSO subjected to tension in an acoustic wave was presented in [
21]. The results obtained were compared with those of the CNT. It is discussed that an appropriate microscopic model of liquids with high surface tension is necessary for accurate prediction of the cavitation threshold. In addition, in [
22], a theoretical study of the thresholds for inertial cavitation from acoustic radiation force impulse (ARFI) imaging was carried out for different durations of acoustic periods in water, urine, blood, heart and skeletal muscle, brain, kidney, liver, and skin. The effects of positive and negative pressure on the nanodroplet-mediated histotripsy (NMH) cavitation threshold were investigated separately in [
23]. The experimental results showed good agreement with the theoretical calculation by the CNT. Acoustic cavitation thresholds for two ultrasound contrast agents (UCA) exposed to 120 kHz ultrasound were measured over a range of duty cycles in [
24]. It was shown that the thresholds occurred at approximately the same acoustic pressure amplitude for all duty cycles and for pulses longer than 20 cycles. In addition, it was discussed that nucleation of cavitation occurs via rupture of the UCA. In [
25,
26], the influence of lipids on the cavitation of liquids was considered. The thermodynamic state of lipid interfaces during shockwave-induced cavitation in water with sub-microsecond resolution was analyzed in [
25]. It was shown that the cavitation threshold is lowest near a phase transition of the lipid interface. On the other hand, combining molecular dynamics simulations with kinetic modeling in [
26] revealed that that the presence of lipid aggregates imposes an upper stability limit for the magnitude of negative pressures in biological liquids that contain lipid bilayers. The problem of the cavitation inception threshold has been addressed also by numerical works [
27,
28,
29,
30]. In [
27,
28], a numerical study was performed to analyze the effect of multifrequency excitation on the inertial cavitation threshold. It was found that the introduction of additional frequencies into the excitation can significantly decrease the cavitation threshold. A numerical study of cavitation in a liquid using a free-energy lattice Boltzmann simulation based on the van der Waals equation of state was carried out in [
29]. It was shown that the local bulk pressure is not sufficient to explain the phenomenon of cavitation inception: it is necessary to take into account the viscous stress, interfacial contribution to the local pressure, and the Laplace pressure. In a theoretical work [
30], classical nucleation theory was applied to investigate the interrelation of high-intensity focused ultrasound (HIFU) pressure and temperature fields with the energetic requirements of bubble nucleation. The thermal and mechanical effects of HIFU during bubble nucleation for timescales of a few milliseconds were found to be inextricably linked.
Common to all of the above works is the need to improve existing approaches to assess the cavitation threshold, taking into account a wide range of parameters, including both external conditions of excitation on a liquid and the liquid, itself. As discussed in [
31,
32,
33], one of the reasons for the discrepancy between the calculations and experiments may be the use of macroparameters to describe processes at the microlevel. For example, it is not obvious that the macroscopic parameter of surface energy can be used for a nucleus with a radius of several tens of molecules. Another problem is that the dimensions of the “defective” structure of the liquid (vapor–gas bubbles, solid particles) have to be known in advance, which is not always acceptable in real-life situations. Moreover, there is little evidence to prove that existing models can be used to predict the cavitation threshold when external conditions change. For example, if the frequency of an ultrasonic wave or hydrostatic pressure changes, then using model parameters obtained for specific conditions may not provide an accurate calculation of the cavitation threshold. Thus, at present, there is still a need to develop existing models or produce new models that are capable of predicting the inception and development of acoustic cavitation.
A new approach to analyzing the cavitation threshold was proposed in [
34,
35]. This approach is based on the application of the incubation time criterion, which was first applied to assess the dynamic strength of solids [
36]. In short, the core problem is that the strength of a material depends on the strain rate. In the case of a quasistatic load, the ultimate stress that the material can withstand can be considered as a constant. However, with a gradual increase in the strain rate, an increase in the ultimate stress is observed. At high strain rates, the ultimate strength can increase several-fold. With that, the time to failure decreases to a certain value and remains fairly constant at high strain rates. This forms two branches on the strain rate dependence of the time to failure: static and dynamic. The incubation time approach allows one to calculate both branches, and, accordingly, to predict the strength of materials for any type of loading; it has already been successfully used to calculate the strength of materials under dynamic loads [
35,
37,
38,
39]. An example of such modeling can be found in [
37], where the problem of spall fracture at nanosecond pulses was considered. Spall fracture is a widespread method of creating a tensile dynamic load in materials. This problem does not find a solution within the framework of traditional concepts of material strength. Using the incubation time criterion, the authors calculated the strain rate dependence of spall strength. This can be done, because of the assumption that loading to a critical value of stress is insufficient for failure under dynamic loads, and the force impulse must reach a critical value within a certain time.
A similar concept can be applied to cavitation. As in problems of strength of material, according to the concept of incubation time criterion, reaching the critical value of negative pressure is not sufficient to start cavitation. The negative pressure pulse must reach a critical value within a certain time. The results presented in [
34,
35,
40] indicate that it is possible to apply the incubation time criterion to cavitation problems in liquids to predict the transient cavitation threshold, depending on the acoustic pulse duration or ultrasonic wave frequency. Additionally, the criterion was applied to calculate the dependence of ultrasound threshold amplitude on the liquid temperature at different hydrostatic pressures [
40]. However, the effect of combined changes in the parameters of ultrasonic action, hydrostatic pressure, and liquid temperature on cavitation threshold has not yet been analyzed. Moreover, calculations based on the incubation time criterion of cavitation were not compared with calculations based on other models.
In this paper, we have considered the possibility of applying the incubation time criterion to estimate the threshold amplitude of ultrasound for the onset of cavitation in water under various experimental conditions. We determined the efficiency of the criterion by analyzing the experimental data known from existing literature. This criterion uses only parameters that are assumed to be macroparameters of a liquid. In this study, we have additionally considered the possibility of taking into account a microparameter in the size of a cavitation nucleus. In addition, we have also made a comparison between the calculations made using the criterion and the classical nucleation theory. The results of our study showed that the incubation time criterion of cavitation allows one to select the necessary threshold for the onset of cavitation for a given hydrostatic pressure and water temperature by calculating the combination of frequency and amplitude of ultrasound. This approach is convenient for applications in which there are special requirements for the parameters of ultrasound, maximum negative pressure, and temperature of the liquid.
2. Theoretical Approach
When studying the tensile strength of liquid, the question arises of determining the conditions that lead to cavitation. Since the continuity of liquid is violated during cavitation, we can draw an analogy with failure in solids.
An increase in strength with a decrease in loading duration or an increase in strain rate observes in the fracture of solids. This effect indicates the need to preserve the magnitude of the fracture force impulse. The magnitude of the critical stress cannot remain at the same level, otherwise infinitely short impacts can lead to fracture with infinitesimal energy being supplied to the place of fracture. In addition, the critical stress must be withstood for some time, since the reaction of the medium and microprocesses cannot occur instantly and require a certain amount of time. Based on this reasoning, the incubation time criterion of fracture was proposed [
36,
41]. In a generalized form, the criterion can be represented by the following integral condition [
35]:
where
P(
t’) is the intensity of the local force field;
Pc is the static limit of the local force field;
τ is the incubation time associated with the dynamics of structural processes preceding the observed event and characterizing and therefore the time to this event; and
α is the sensitivity of the medium to a level of the local force field. The time and place of the event are defined as the moment and the point (in the material volume) of the fulfilment of the condition (Equation (1)).
In order to determine acoustic cavitation, it is convenient to represent the variables and parameters of the criterion (Equation (1)) in the following form:
where
Pc is the cavitation threshold at low frequencies, wherein a change in the frequency does not cause a significant change in the cavitation threshold;
T is the liquid temperature;
Pst is the hydrostatic pressure;
Pph(
T) is the pressure described by the line of the phase boundary between liquid and vapor;
P(
t) is the acoustic pressure,
A and
f are the amplitude and the frequency of acoustic oscillations;
τ0 is the incubation time typical for a given spatial scale level (can be considered as a timescale);
k is the Boltzmann constant; and
W is the fraction of energy required to start cavitation in a representative volume of a given scale level.
If we substitute Equations (2)–(4) in Equation (1), we can obtain the expression for calculating the threshold pressure of the beginning of liquid cavitation for different ultrasound frequencies, at different liquid temperatures, and hydrostatic pressure:
where
,
, and
.
The application of criterion (Equation (1)) and expression in form (Equation (5)) was proposed for calculating the onset of acoustic cavitation in seawater [
42] or water, depending on its temperature and hydrostatic pressure [
40]. However, it should be noted that the parameters
τ0 and
W are determined using a semiempirical method, fitting the calculated curves to the experimental points with the smallest deviation. Despite the clear physical evidence of these parameters, the question of whether they can be directly determined from experiment or calculation still remains open. Possible ways to determine these parameters and potential future research on this matter will be considered in the discussion section.
One more remark needs to be made for Equation (3). Here, we assume a sinusoidal acoustic waveform. However, in a real-life situation, this form is not always realized. The mathematical idealization of the acoustic waveform can lead to calculation errors. In addition, studies of acoustic cavitation are often considered impulse waves. Therefore, in this case, it is necessary to use a different expression for the acoustic wave profile in Equation (3) as, for example, it was done for pulse pressure in [
34].
In the following sections, we will analyze the results of calculations of the onset of acoustic cavitation in water for various external conditions and compare them with various experimental data. Equation (5) was solved using numerical calculations in MATLAB; the optimal approximation of the calculated curves to experimental points was determined by using the least squares method.
3. Results
Although numerous studies have analyzed cavitation problems, not many experiments have been conducted to study the dependence of acoustic cavitation threshold on the frequency of ultrasound, liquid temperature, and hydrostatic pressure. Therefore, we have collected some experimental data together to evaluate the efficiency of utilizing the concept of the incubation time criterion to predict the onset of acoustic cavitation on the example of water. In these works, the authors investigated the dependence of the cavitation threshold on one external parameter, with the exception of the work of Bader et al. (2012) [
43], where both temperature and static pressure were changed in the tests. In this work, transient cavitation threshold was studied in ultrapure water. A radially symmetric standing wave field was generated in a spherical resonator at frequency of 25.5 kHz. Static pressure varied from 1 bar to 300 bar, and the temperature range was 18–34 °C. In the study by Vlaisavljevich et al. (2016) [
16], distilled degassed water underwent focused ultrasonic pulse with a frequency of 1 MHz. In the experiments, passive cavitation detection and high-speed photography were used. Cavitation threshold was measured from the pressure amplitude dependency on the probability of cavitation. Experiments were carried out within a temperature range of 10–90 °C. Similar work was done by Herbert et al. (2006) [
44]. Authors presented experimental and theoretical study of cavitation threshold for different temperatures at a frequency of 1 MHz. Threshold pressure was defined from the statistics of cavitation. Connolly and Fox (1954) [
45] also studied cavitation threshold in a temperature range of 0–30 °C. Ultrasound was applied as plane progressive and focused waves driven at a frequency of 1 MHz. Barger (1964) [
46] measured cavitation thresholds at a wide range of frequencies. Water was placed in a spherical glass to which radially symmetric resonance modes were applied. As in previous works, ultrasonic action was focused on a center of the sphere.
The experimental conditions (ultrasound frequency
f, water temperature
T, and hydrostatic pressure
Pst) and the parameters required for the calculations by Equation (1) are given in
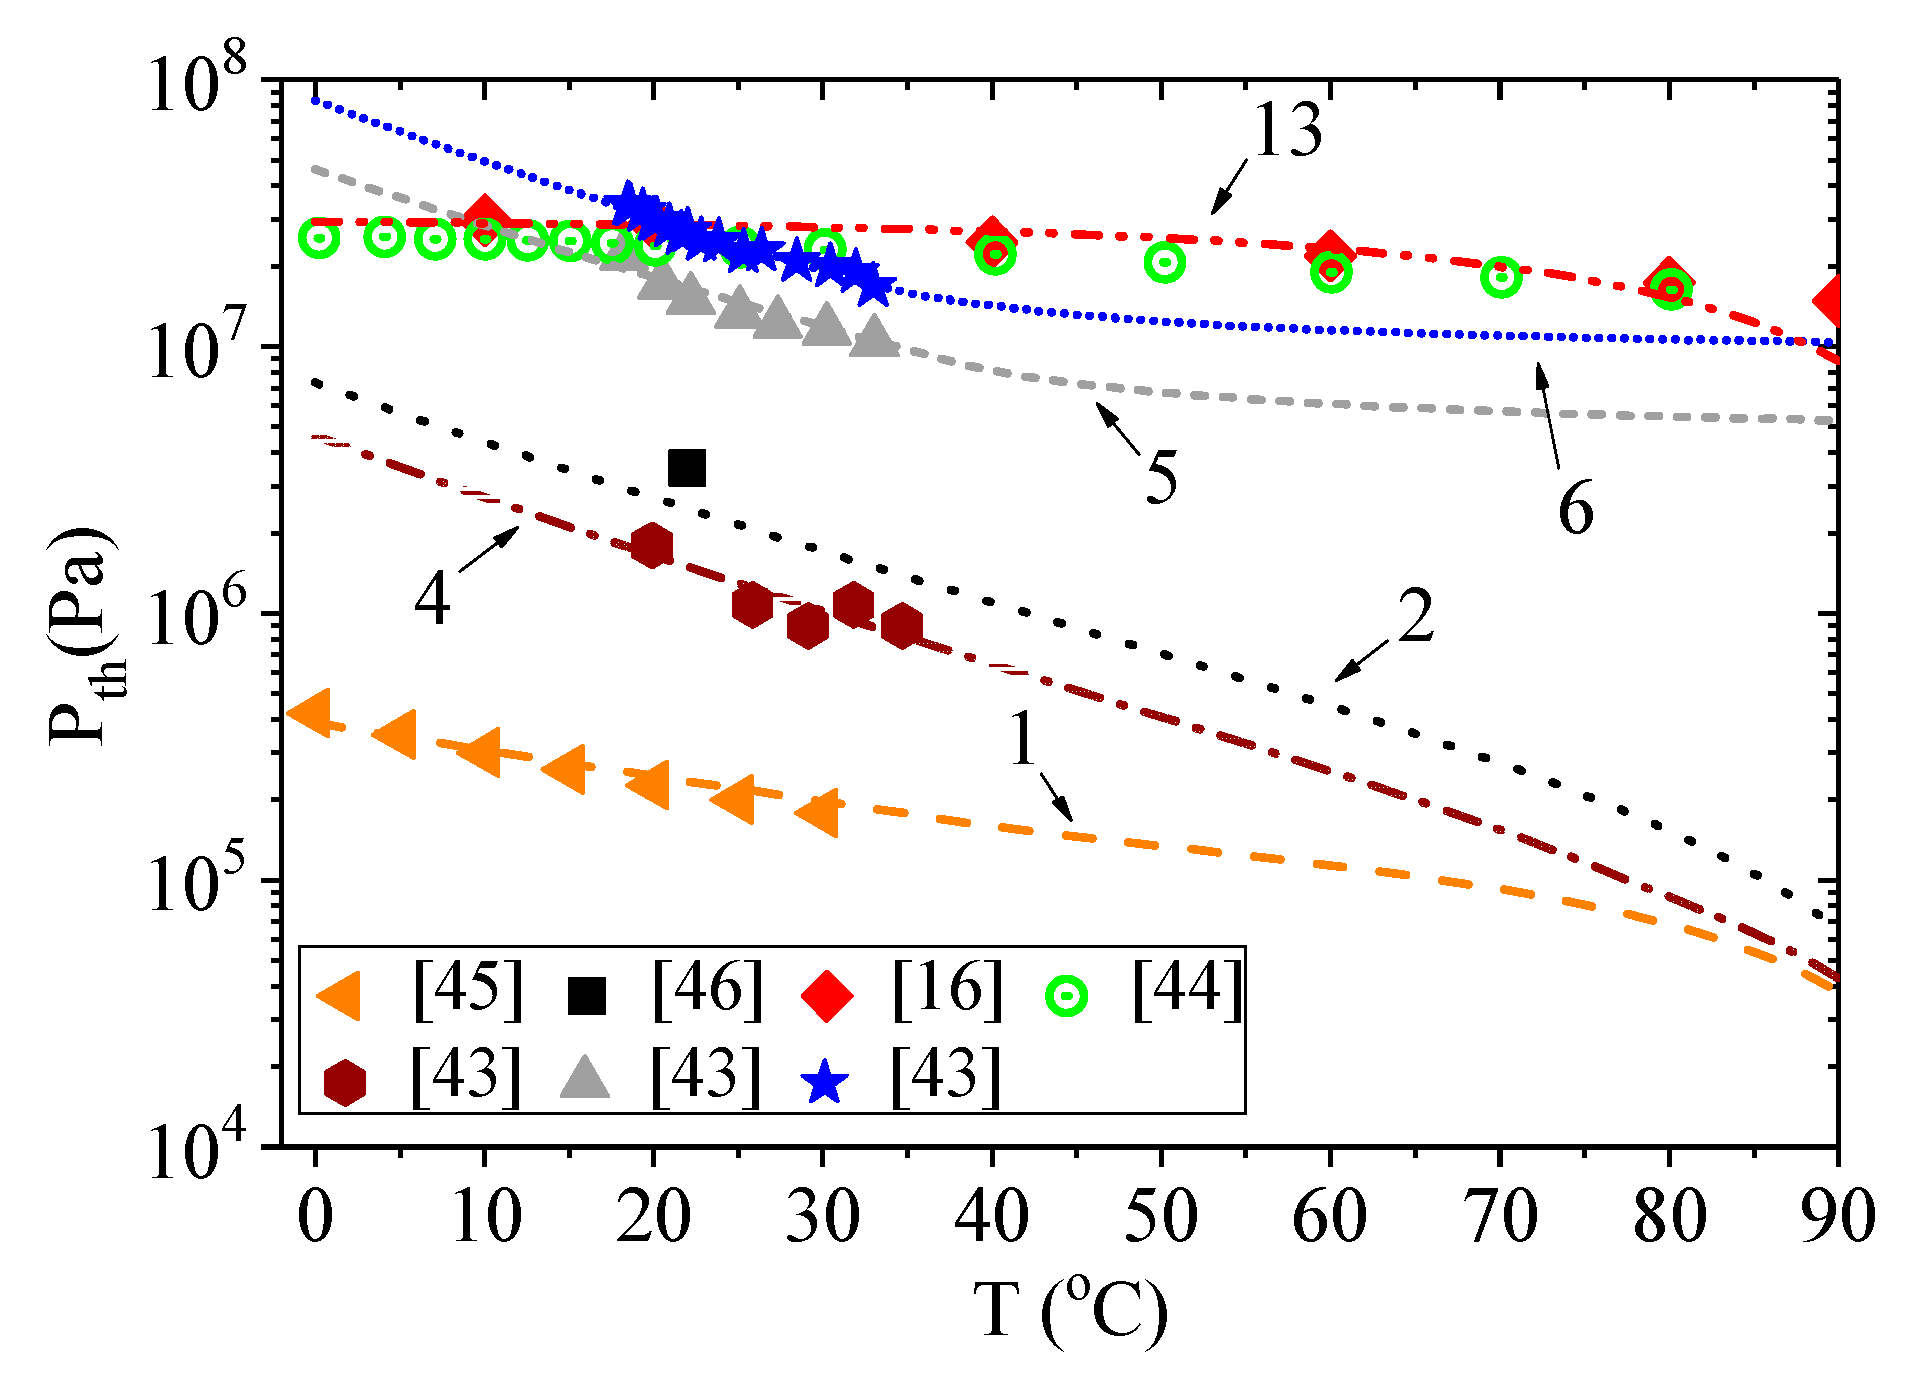
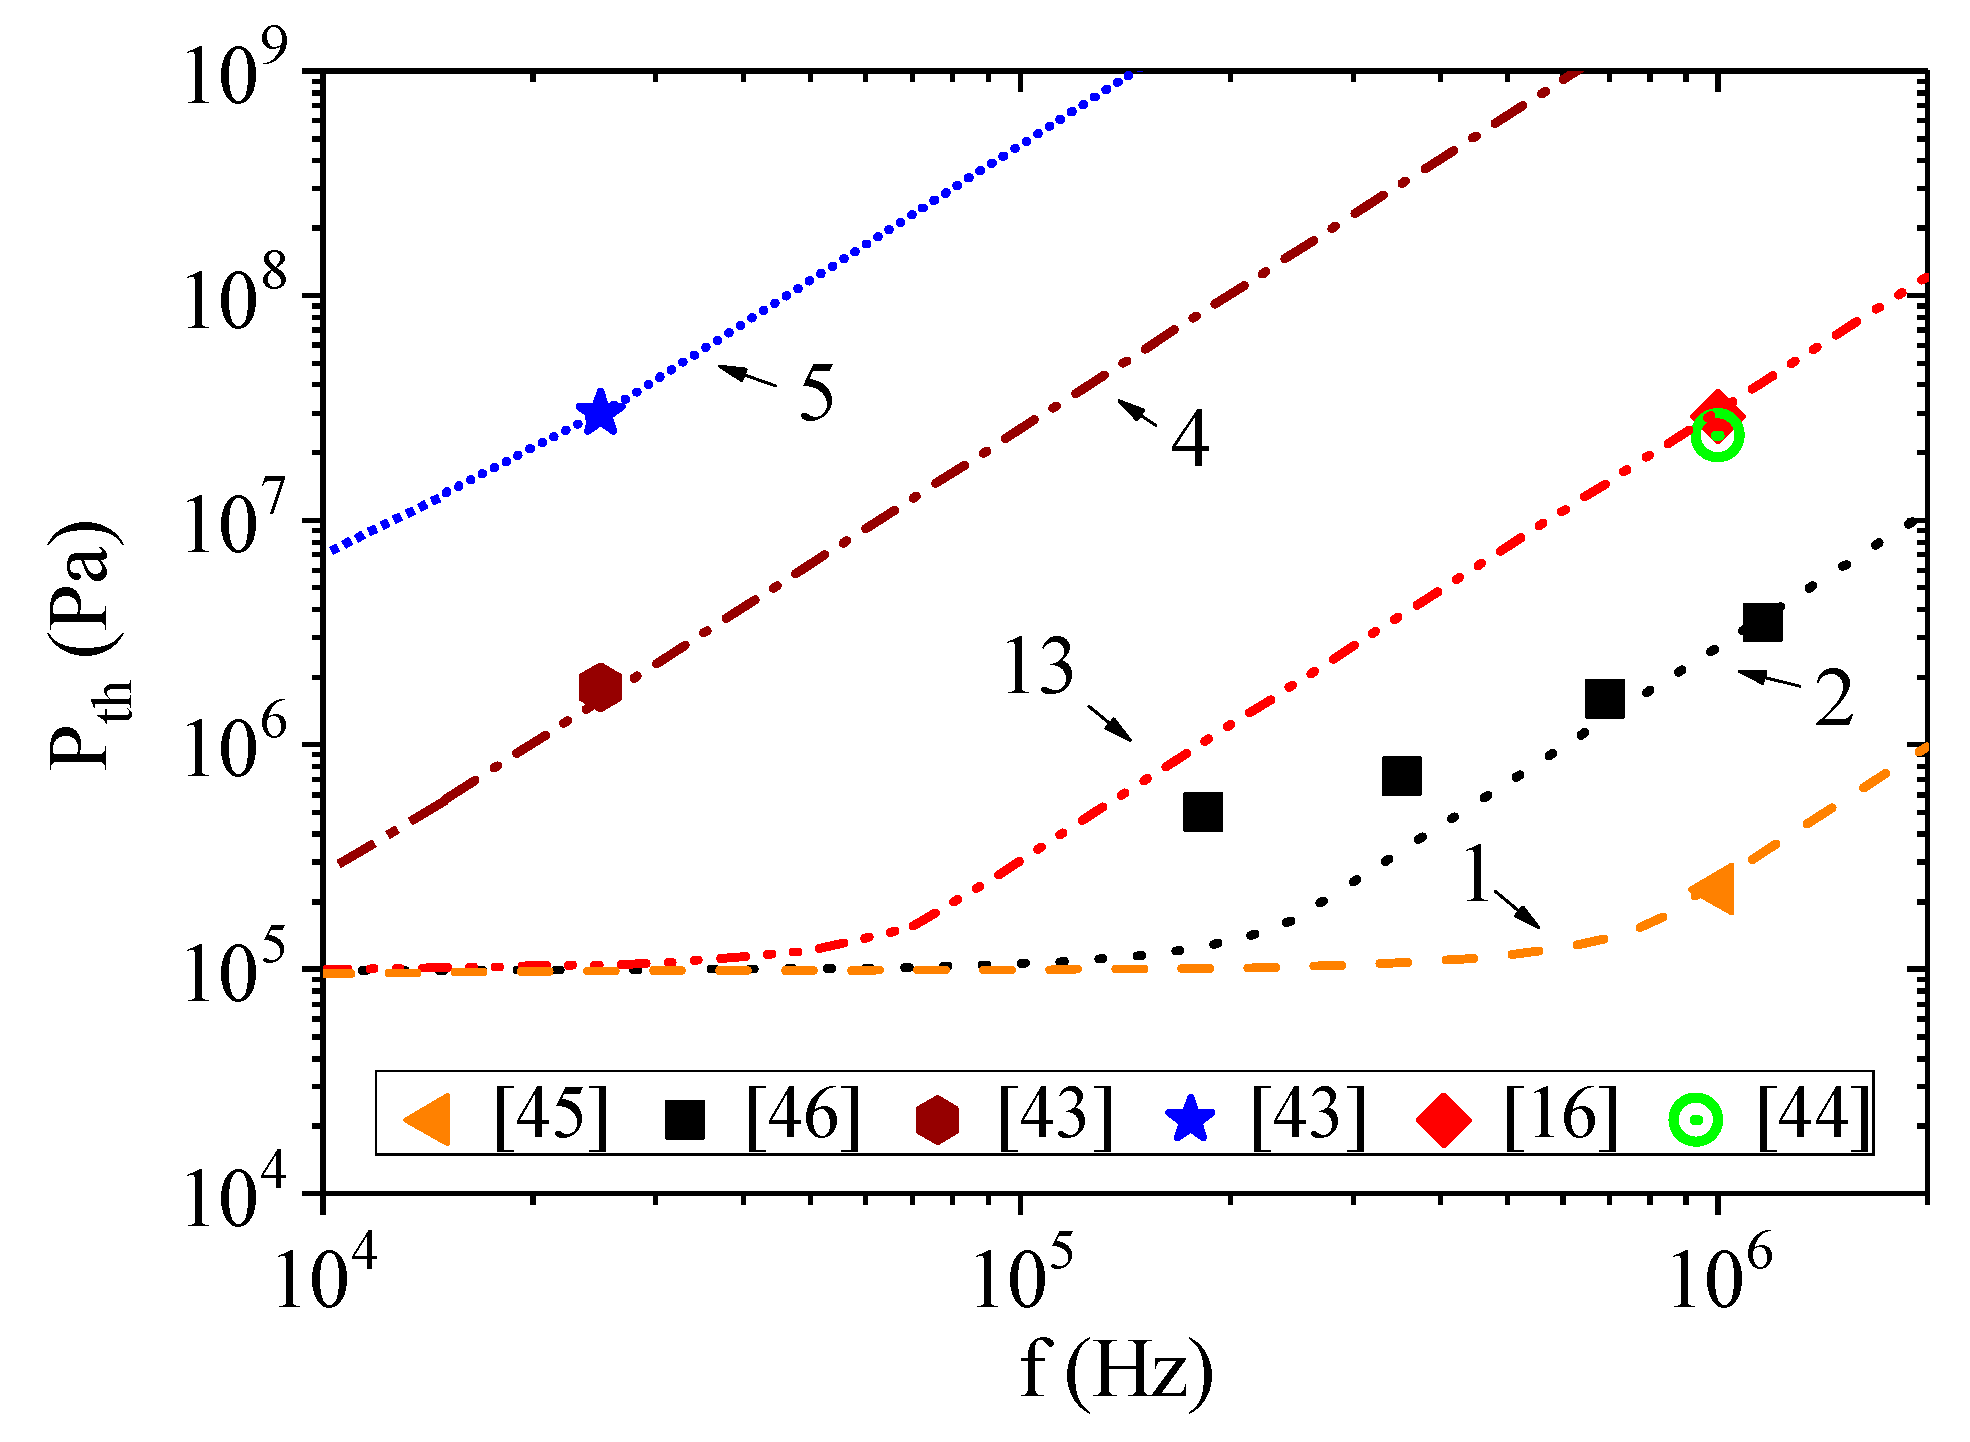
Table 1. The results of calculations, together with the experimental data, are presented in
Figure 1 and
Figure 2. In all cases, the parameter α was equal to 1/2 [
47].
The calculation was carried out in such a way that the calculated curves obtained by Equation (5) approximate the experimental points that meet certain conditions in water. Since, in the experimental data, the onset of cavitation was dependent either on water temperature or on ultrasound frequency, while the other conditions of exposure to water were fixed, the parameters for the incubation time criterion of cavitation were selected for one of the cases. After that, another case was calculated, even if there were no corresponding experimental data.
Figure 1 shows the calculated dependencies of the onset of acoustic cavitation on water temperature at fixed ultrasound frequency and hydrostatic pressure.
Figure 2 shows the calculated dependencies of the onset of acoustic cavitation on ultrasound frequency at fixed liquid temperature and hydrostatic pressure. The calculated curves indicated by the same number in both figures were obtained for the same parameters
Pc,
τ0, and
W. Thus, we assumed that the parameters are invariant with respect to the experimental scheme.
It is clearly seen that the experimental data differs greatly in assessing the cavitation strength of water. However, good qualitative and quantitative agreement between the calculated curves and experimental points was observed. The corresponding coefficient of determination
R2 is presented in
Table 1. Here, the higher the cavitation threshold, the longer was the incubation time of cavitation
τ0 and the lower was the energy fraction for activation of cavitation
W. Nevertheless, their value depends on the accuracy of determining the static cavitation threshold
Pc. The results obtained are discussed in more detail in the next section.
4. Discussion
The results shown in
Figure 2 were obtained based on assumption that the “quasistatic” strength of water
Pc in all experiments is the same and can be calculated by using Equation (2). However, for example, as shown by curve 2, this approach can significantly deviate the calculated curve from the experimental points. In general, a liquid may contain cavitation nuclei of various sizes. This can lead to significant differences in the cavitation strength of the liquid. Therefore, it is necessary to take into account these features and determine the quasistatic cavitation threshold for using the incubation time criterion more accurately. The best way to do this is through direct experimental measurement. Nevertheless, as this is not always possible, let us consider another possible theoretical way of estimating the “quasistatic” threshold of cavitation
Pc.
Following Laplace′s equation, the critical negative pressure should be proportional to the pressure caused by the surface tension of the initial bubble. As shown in [
46,
48,
49], the proportionality constant can be calculated based on the values of hydrostatic and acoustic pressure and the critical radius of the bubble. It follows that the acoustic pressure required to exceed the tensile strength of a small air or vapor bubble at a sufficiently slow pressure change can be estimated as
where
σ(
T) is the surface tension and
R0 is the initial radius of the bubble. The temperature dependence of the surface tension of pure water in contact with its vapor can be represented using the following formula [
50]:
where
Tc is the critical temperature (647.096 K). We used a reduced surface tension of 27.5%, because, as discussed by various authors [
31,
32,
33,
44], it is not accurate to use the bulk macroscopic surface tension value for calculating the surface tension of a cavitation nucleus with a nanoscopic radius.
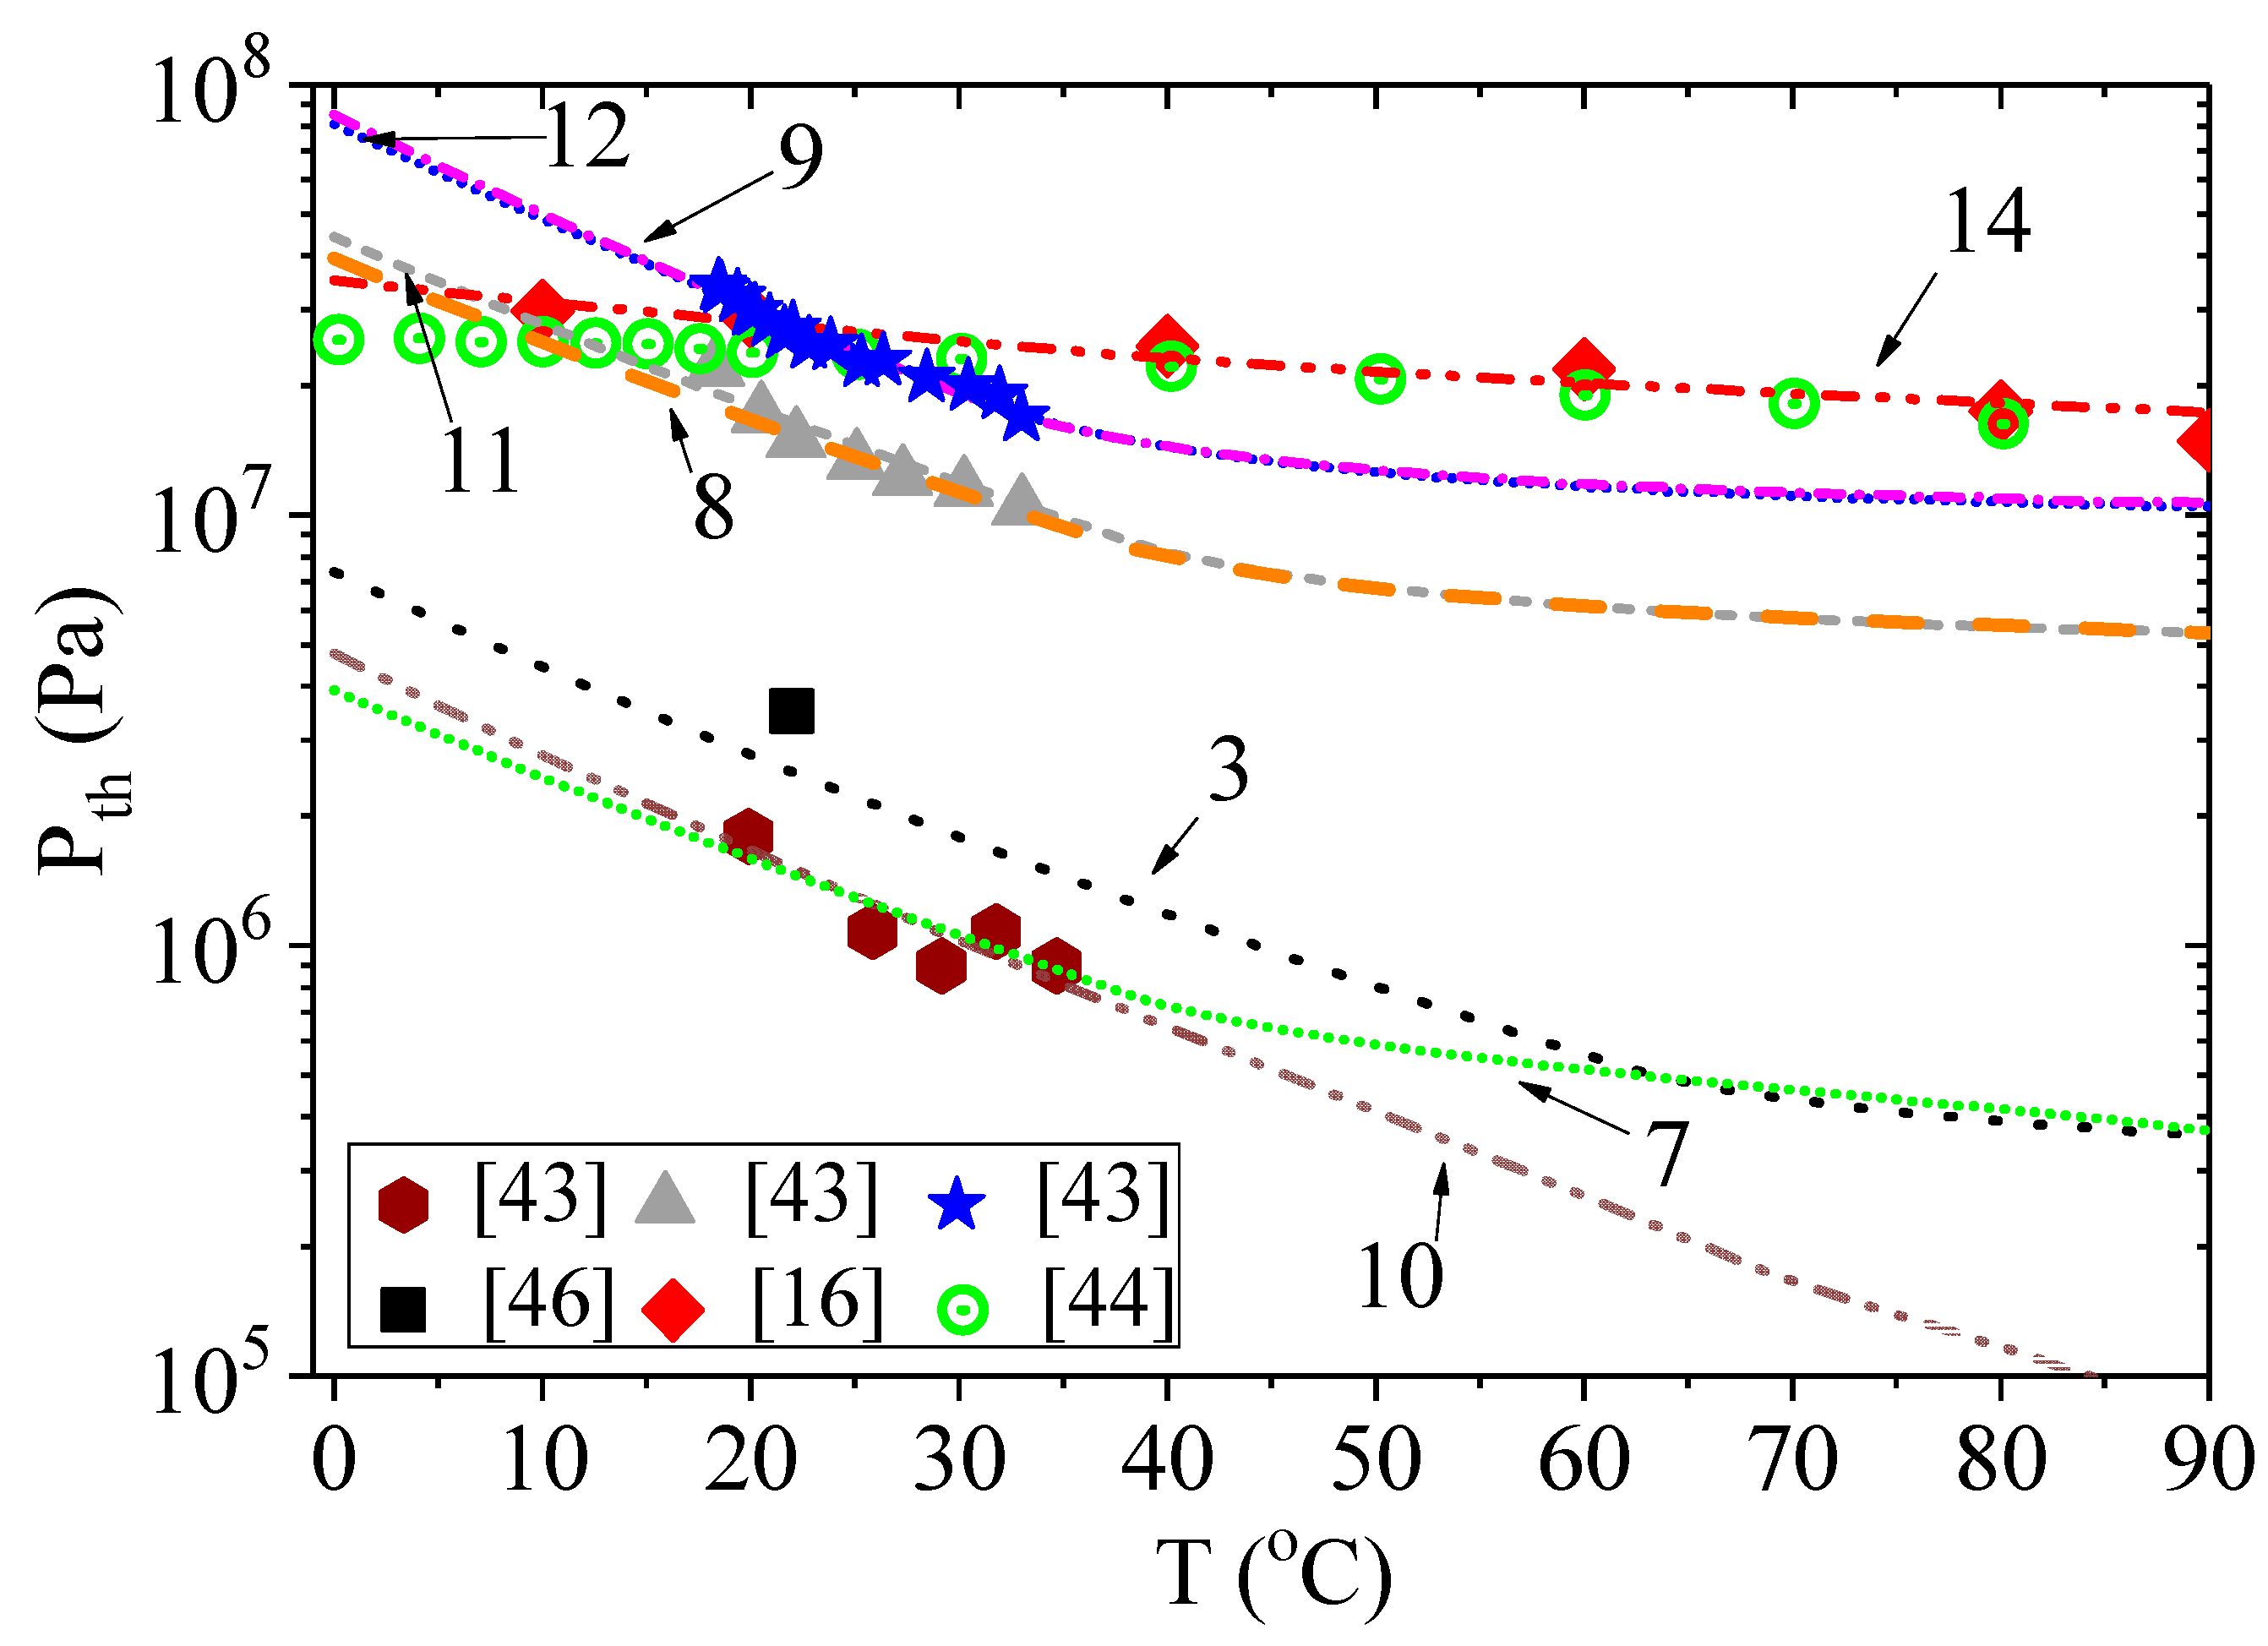
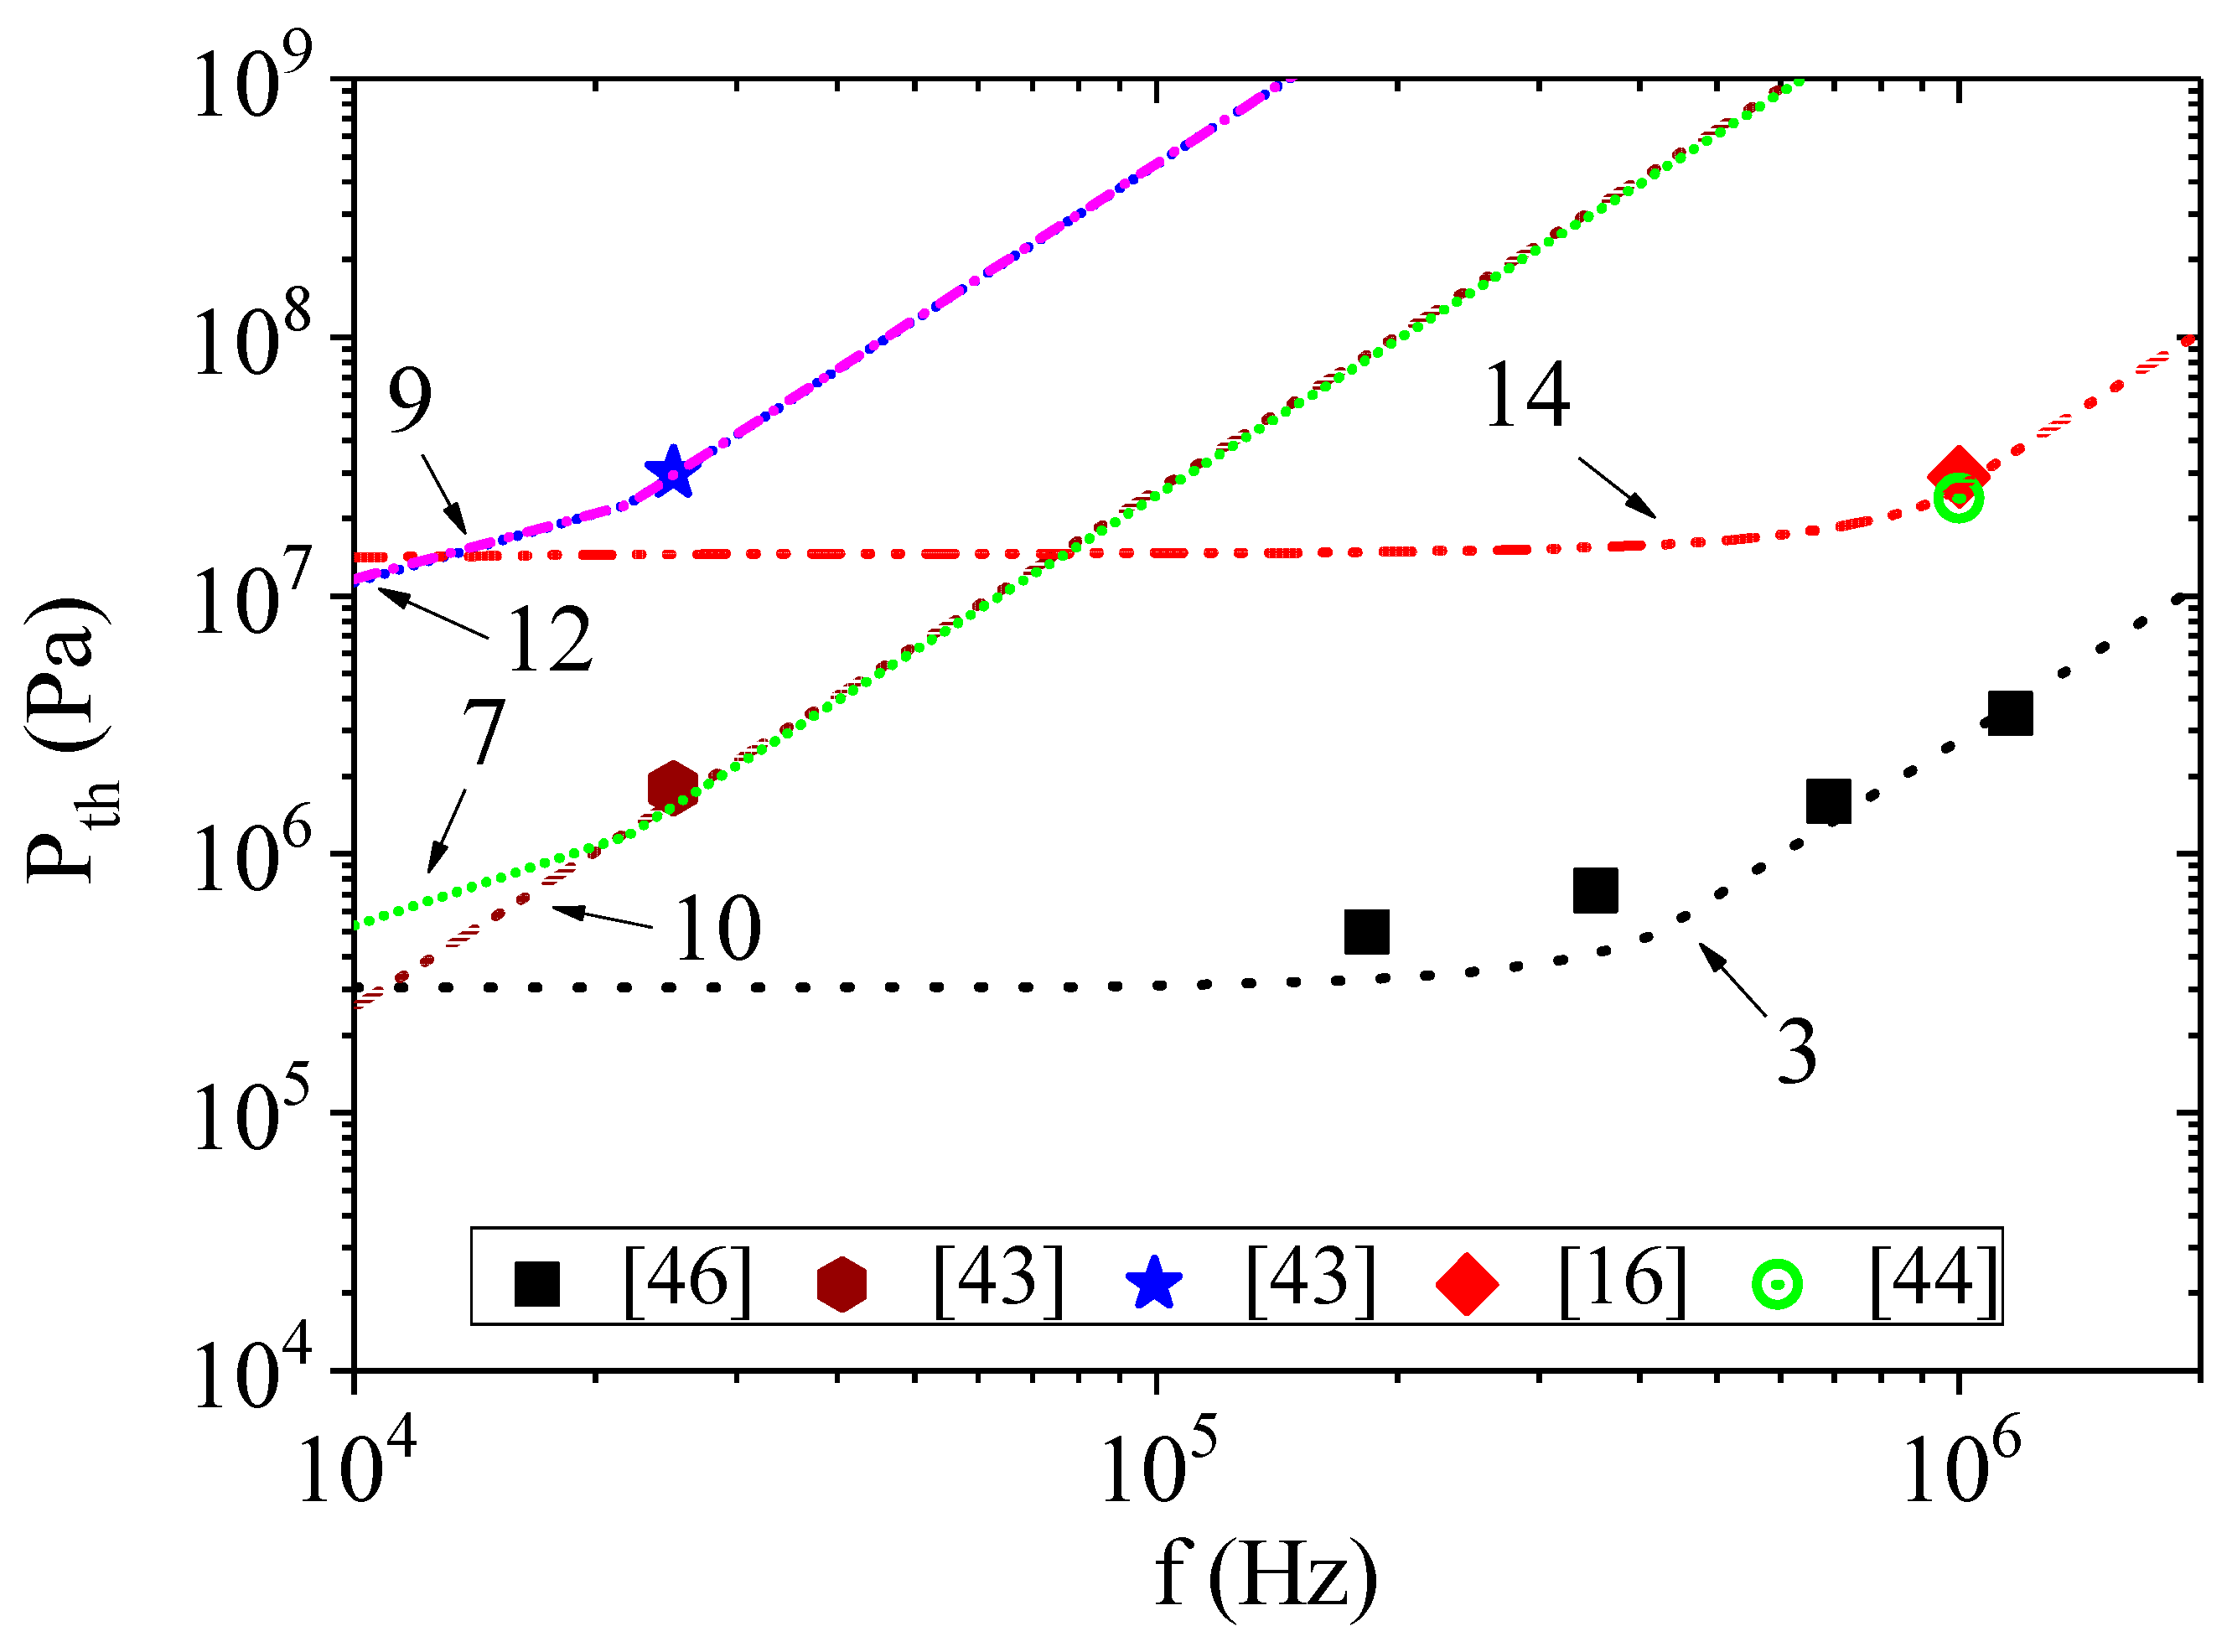
The results of calculations by Equation (5) using Equation (6) instead of Equation (3) are presented in
Figure 3 and
Figure 4. The conditions for calculations are presented in
Table 1, with the corresponding designation of the curves in the figures. The initial bubble radii were chosen according to their estimates given in the corresponding papers. The addition of pressure due to surface tension significantly changes the calculated dependencies of acoustic threshold for the onset of cavitation on ultrasound frequency. However, as can be clearly seen in
Figure 3, the initial size of the cavitation nucleus and the hydrostatic pressure also affect the calculation results. We used two different initial bubble radii to model the results of the experiments from [
43]. To simplify the calculation, we assumed that the change in the bubble radius, as a result of the temperature change, is negligible. When the hydrostatic pressure is equal to atmospheric pressure (curves 7 and 10), a clear influence of the bubble radius was observed, especially at liquid temperatures above 40 °C or ultrasound frequencies below 20 kHz. When the hydrostatic pressure was above 5 MPa (curves 8 and 11 or 9 and 12), the effect of the bubble radius was almost indistinguishable.
Another regularity can be identified by comparing the results in [
43] and [
16,
44]. Since there are no data regarding hydrostatic pressure in [
16], we assumed it to be equal to atmospheric pressure. In [
44], the authors note that the threshold negative pressure was not dependent on the hydrostatic pressure in the range of 1–9 MPa. However, the threshold negative pressures in [
43] were reported to have depended significantly on hydrostatic pressure and reached the level of the threshold negative pressures reported in [
16,
44] only at the hydrostatic pressure of 10 MPa. On the other hand, these values were obtained at different ultrasound frequencies (25.5 kHz in [
43] and 1 MHz in [
16,
44]). The calculation based on the incubation time criterion (
Figure 4, curves 7,9,14) shows that the threshold negative pressure at the frequency of 1 MHz for the hydrostatic pressure of 10 MPa and 0.1 MPa pertaining to the liquid in [
43] should significantly exceed the threshold negative pressure at the same frequency of acoustic oscillations pertaining to the liquid in [
16,
44]. Note that the energy required for the activation of cavitation
W obtained for curves 7 and 9 is significantly higher than the energy for curve 14. The opposite is observed for the characteristic timescale
τ0.
In [
16,
44], the experimental data were compared with calculations based on the classical nucleation theory (CNT) [
12,
13,
14]. Let us consider how the calculations of the threshold acoustic amplitude according to the CNT are consistent with the calculations, according to the incubation time criterion. According to CNT [
12,
13,
16,
44,
48], the cavitation pressure for an experiment carried out with a volume
V during time
ξ at the cavitation probability of 1/2 can be determined using the formula
where
k is the Boltzmann constant, and
J0 can be approximated by [
48]:
Here, n is the number density of the liquid, and m is the mass of the molecule. Note that there are no generally accepted expressions for V, ξ and J0 yet, and ways to define them are still being discussed. However, these parameters are inside the logarithm, and their change has little effect on the cavitation threshold PCNT. The surface tension provides the main contribution to the value of the cavitation threshold. Since the dependence of surface tension on the frequency of acoustic oscillations has not been established, in order to plot the dependence of PCNT on frequency, let us assume that volume V and time ξ depend on frequency. For example, let the volume V be equal to 4/3π(c/f)3 (where c is the speed of sound), and the time ξ be equal to 1/(10f). Thus, volume V is determined by the length of the acoustic wave. The choice of ξ allows us to assume that the variations of P and T are minimal and that their values could be considered almost constant over such timescale.
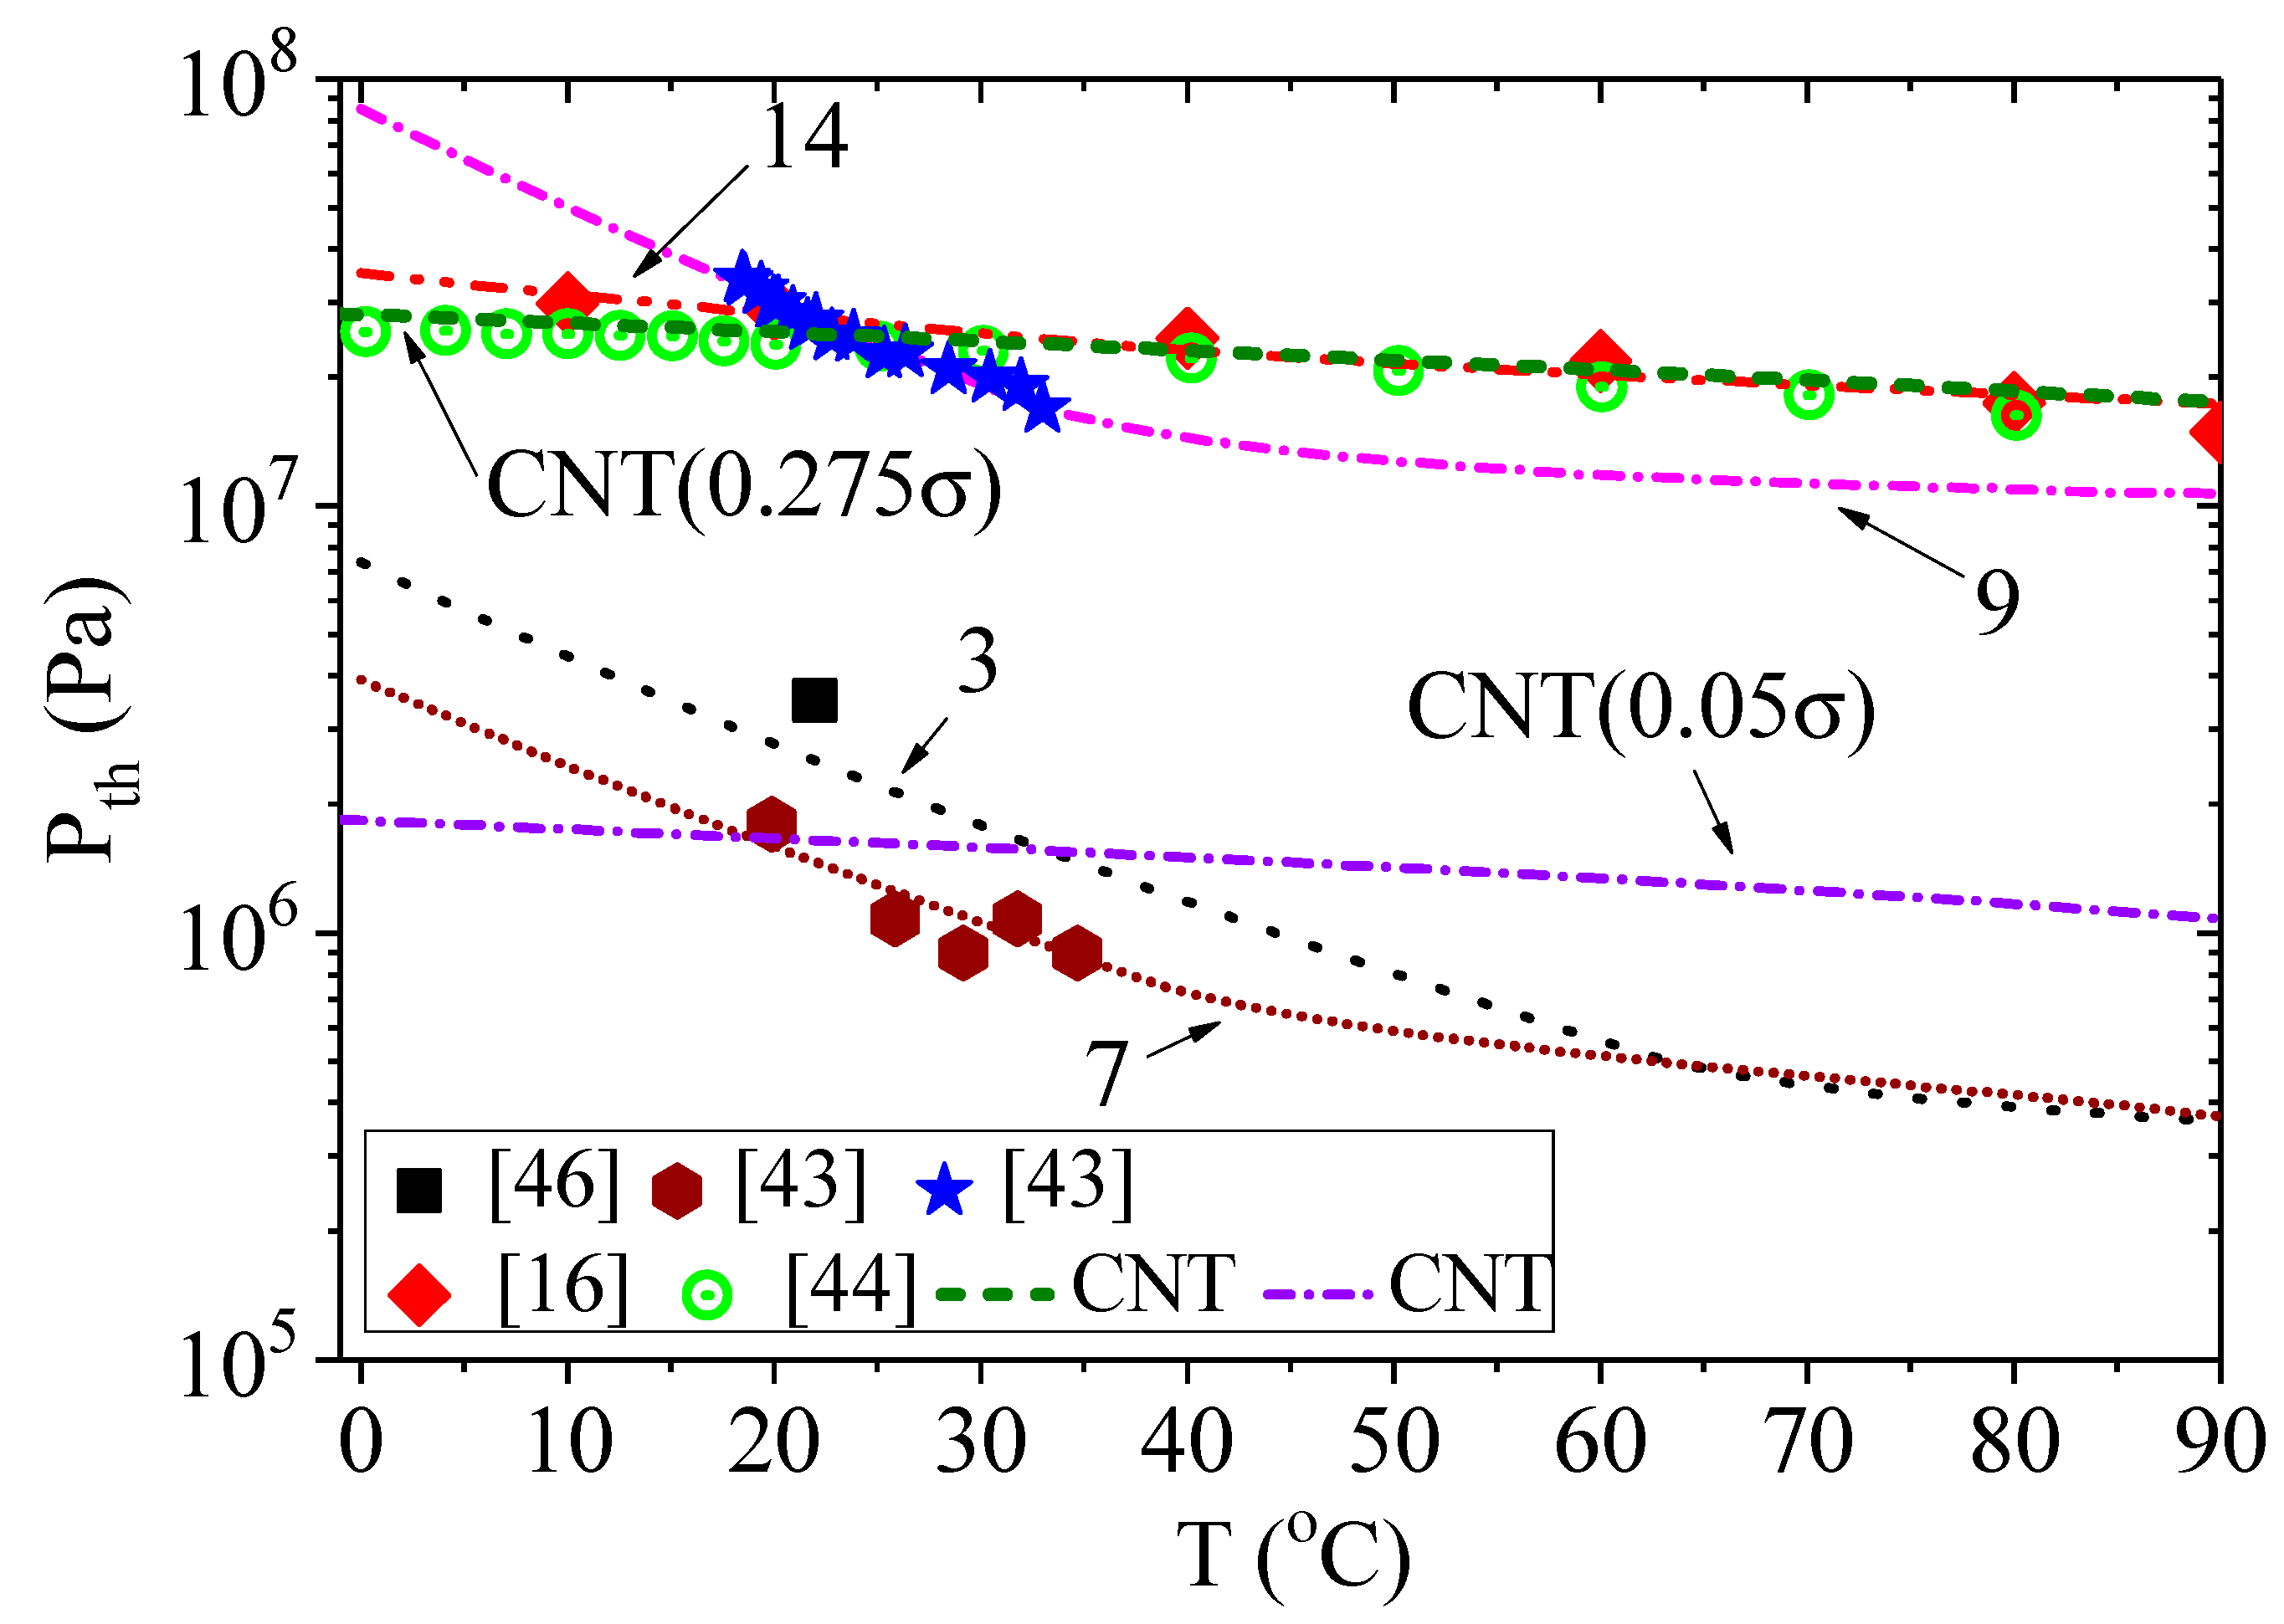
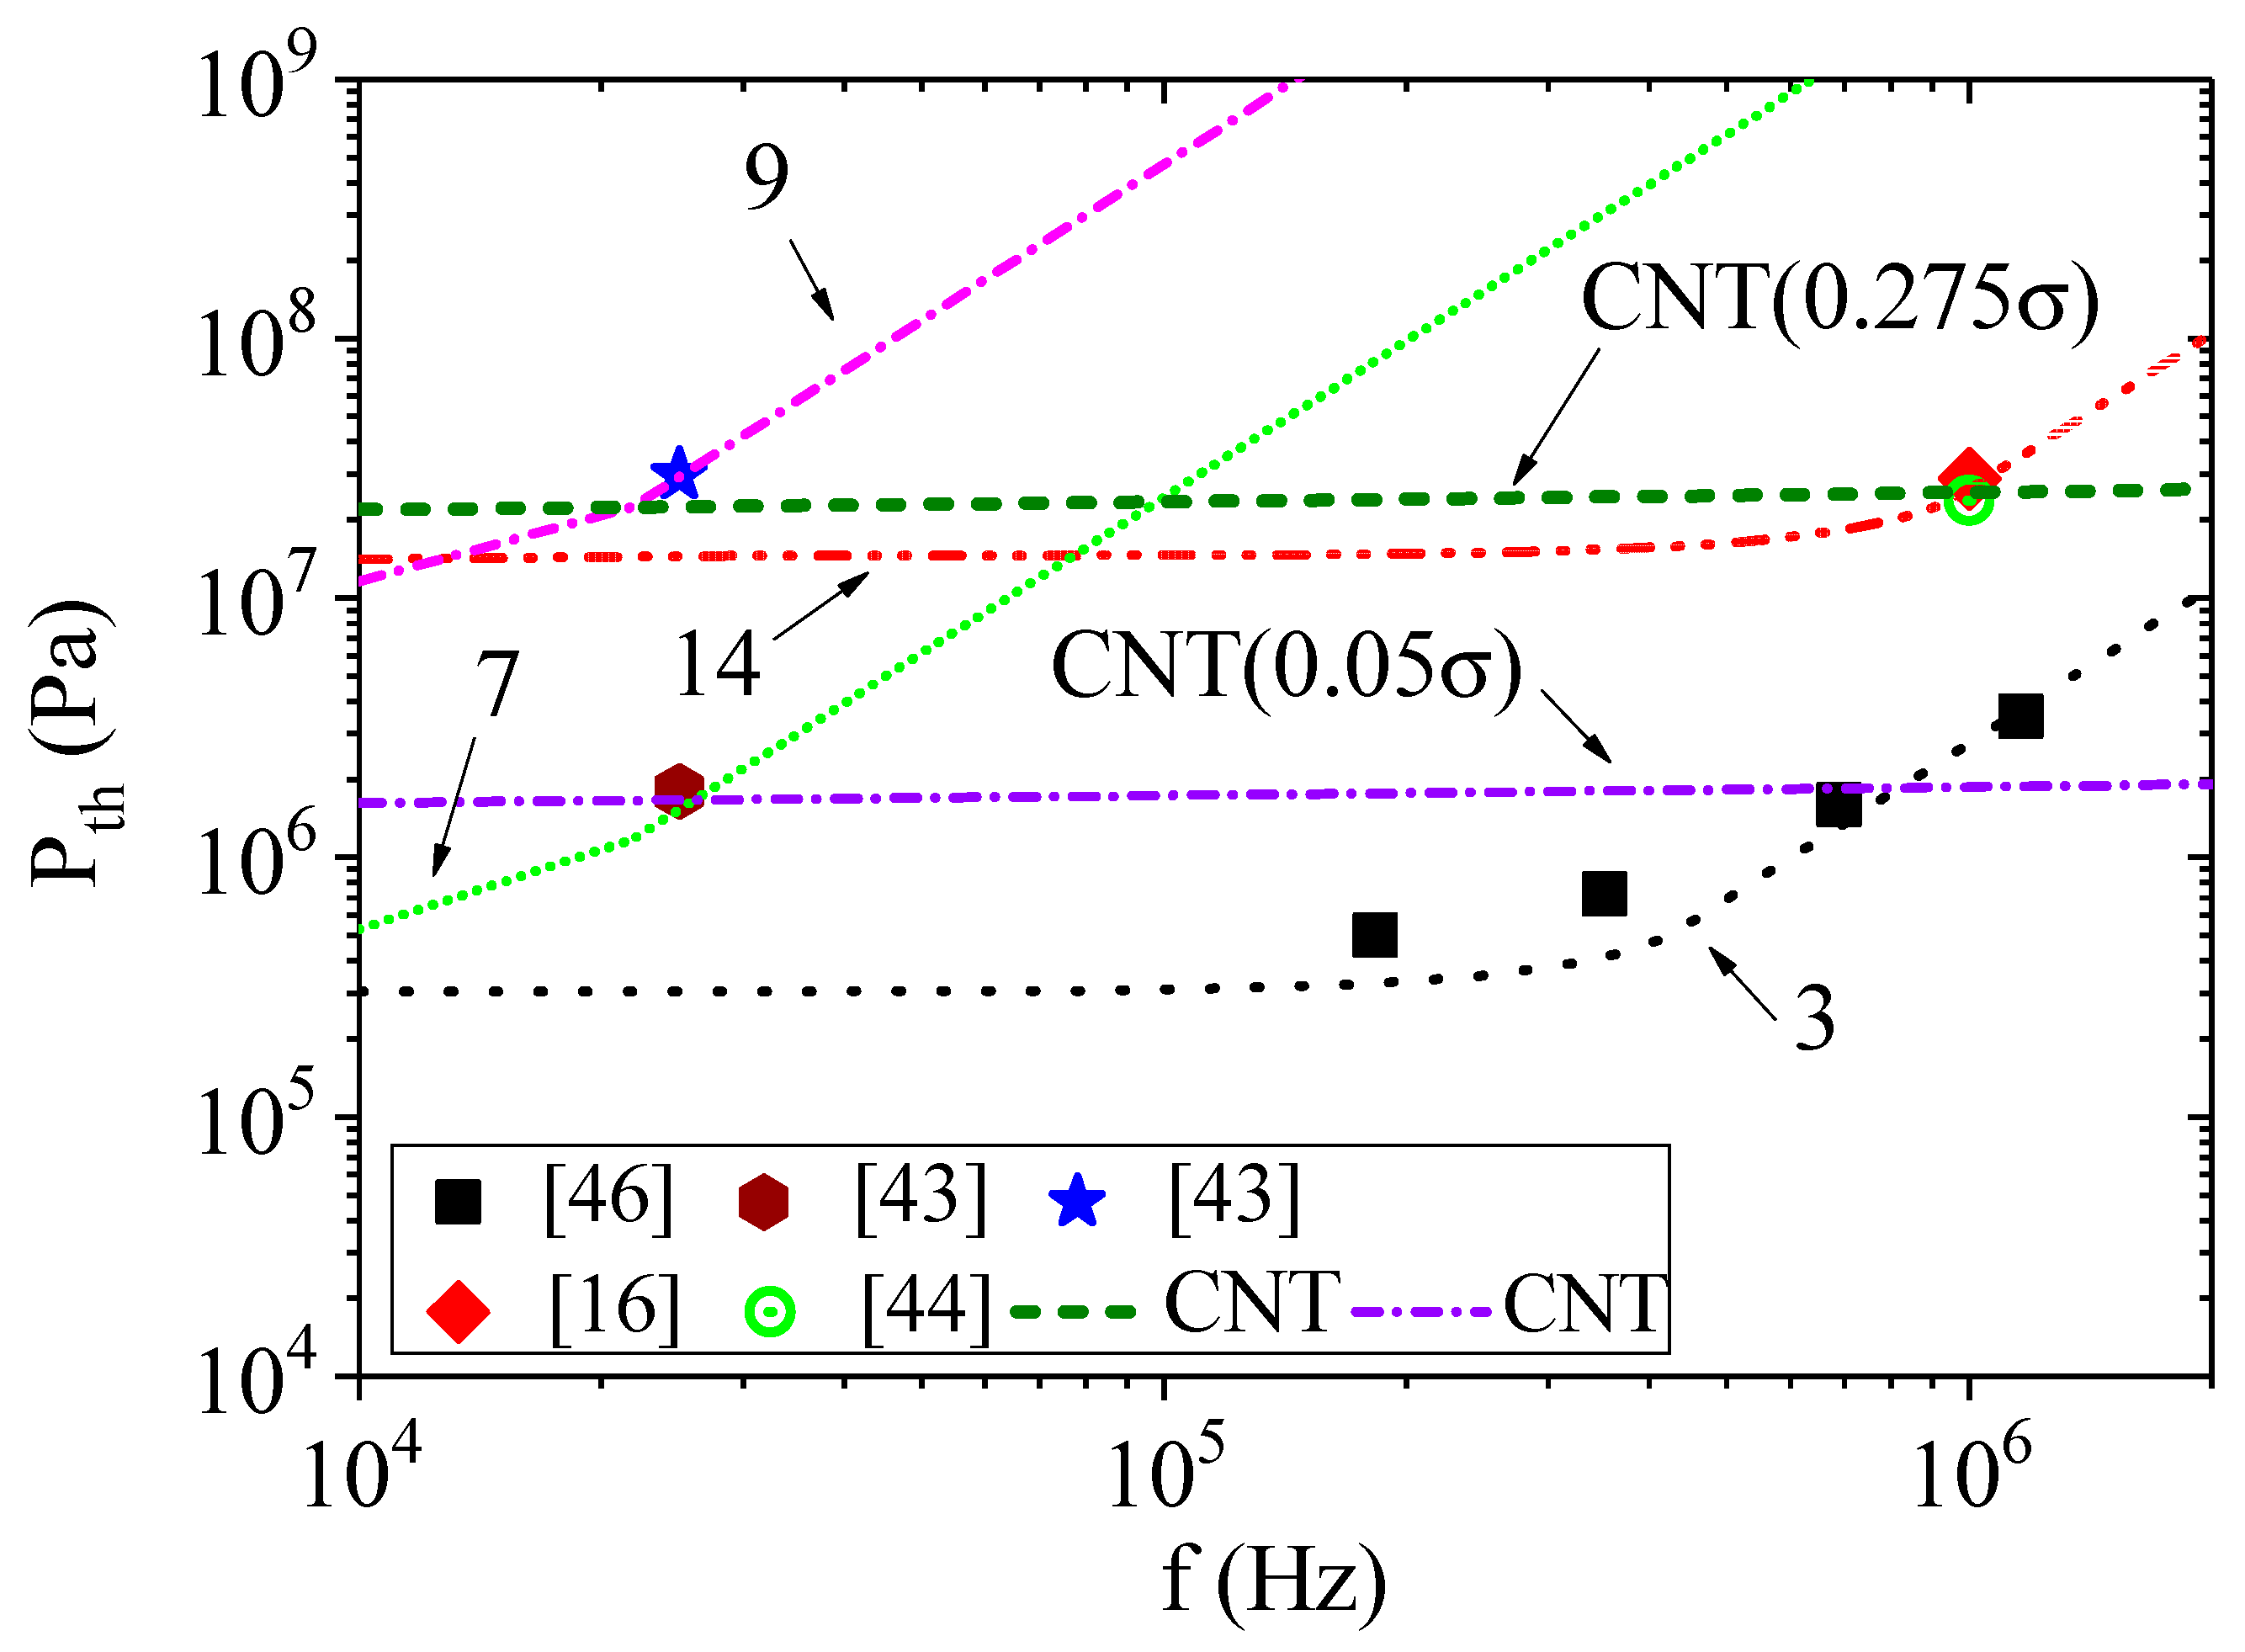
Figure 5 and
Figure 6 show the results of the calculations made using Equation (8). The use of CNT allowed us to obtain the dependence of cavitation threshold on temperature, which quantitatively coincides with the experimental results [
16,
44]. To obtain this result, we had to reduce the surface tension by almost 4 times. The same correction was used in [
16]. Note that the calculation of the experimental results from [
43] required a decrease in the surface tension value to 5%. However, the calculation did not correspond well to the dependence of the cavitation threshold on temperature. The results of calculating the cavitation threshold according to CNT (Equation (8)) and the incubation time criterion (Equation (5)) were close to each other, when considering experiments from [
16] (curves 14 and CNT0.275
σ in
Figure 5). In other cases, the incubation time criterion provided a better result.
According to CNT [
12,
13], there is the critical radius for the cavitation nucleus
Rc. For the nucleus of radius
Rc, the minimum work required to create a spherical bubble of radius
R filled with vapor will reach its maximum. This maximum is an energy barrier that must be overcome for the bubble to grow spontaneously. Since the incubation time criterion assumes the presence of such a liquid parameter as the energy required for the onset of cavitation in a representative volume, it is interesting to estimate to which critical size of the nucleus it can relate. The critical radius of the nucleus can be defined as:
Such estimates of the critical radius are presented in
Table 1. For all calculations, the critical radius exceeds the average distance of intermolecular bonds by only 3–6 times (~2.7 Å; see, for example, [
51,
52]). Therefore, it can be assumed that the cavitation activation energy
W introduced into the incubation time criterion should be associated with the formation of nuclei at the intermolecular level. In this case, the incubation time
τ0 can be considered as the time required to prepare the onset of cavitation at the given spatial scale. However, it remains unclear how this parameter can be defined. In continuation of the analysis of the experimental data, let us consider a way for estimation of
τ0 and
W based on the CNT.
In the classical theory of nucleation, it is customary to consider the nucleation rate [
12]
where
N is the number of molecules per unit volume of the liquid,
B is the kinetic factor, and
W* is the work of forming a critical nucleus. The factor
is the average number of critical nuclei per unit volume of the liquid, and the factor
B corresponds to the average rate of transition of the nucleus through the critical size
Rc. Work
W* characterizes the height of the Gibbs free energy barrier, which must be overcome by the system due to atomic fluctuations in order to form a nucleus. The ratio
is called the Gibbs number and is considered as a dimensionless measure of the stability of a liquid to the formation of cavitation nuclei. In this case, the height of the activation barrier, i.e., the Gibbs potential difference for the two phases, is related to the average energy of thermal motion per degree of freedom. Herewith, the more the critical size of the nucleus is exceeded, the less the growth of the bubble is subject to fluctuations, i.e., the time of the “settled” position of the atoms around the nucleus increases. Thus, the average time of the appearance of a nucleus in a given volume of a liquid
V is inversely proportional to the rate of nucleation. If we assume that the incubation time (Equation (4)) is the time characterizing average waiting time for irreversible expansion of the cavitation nucleus depending on temperature, and
W =
W*, then we can obtain an expression for determining
τ0:
The molecules that oscillate around the temporary equilibrium positions then jump to another position, to the bottom of a potential well formed by the particles of the new environment. The magnitude of the jumps determines the structural scale
d, and the average settling time
τ0 is the characteristic timescale for a given liquid. The kinetic factor does not yet have a universal expression. Its classical estimates are discussed in detail in [
12,
53]. The ambiguous variants of the factor
B provide ample opportunities for a large set of
τ0 values. Therefore, additional research is needed on this issue. Nevertheless, the incubation time can be calculated, taking into account the thermal and hydrodynamic conditions near the nucleus. The accuracy of its calculations will be determined by the accuracy of the estimation of the CNT parameters.
Note again that, in this work, we estimate the threshold for the onset of cavitation based on the approach that is used to estimate the strength of solids. Since failure is a process that develops over time, it is natural to characterize it either by a certain rate of accumulation of defects or by the time during which the process develops to a certain stage of failure. Therefore, according to the kinetic concept of failure, the durability of a solid is a fundamental characteristic of the mechanical strength of a material. It can be considered as a value inversely proportional to the average rate of the failure process. In the classical expression, this formula was presented by Zhurkov [
54,
55] and has a general form (Equation (4)). The proportionality of
τ to the factor
indicates the thermal fluctuation nature of failure. Thus, the application of the criterion for the incubation time of failure of solids, considering the thermal fluctuation nature of failure for the problem of failure of water under tensile pressures, gave results that qualitatively describe the experimental data, at least within the framework of the considered experimental conditions. It is noteworthy that similar ideas are embedded in the classical theory of nucleation. Postulating the equality of the activation energies of failure in Equations (4) and (11), we can propose a way for estimating the parameters of the incubation time criterion based on the CNT principles. However, this requires more detailed studies, including experimental ones, which we plan to implement in future works. Moreover, the results obtained need to be considered for other liquids, including multiphase ones.
